HP Victus 16 gaming laptop review: Powerful hardware in a stylish case
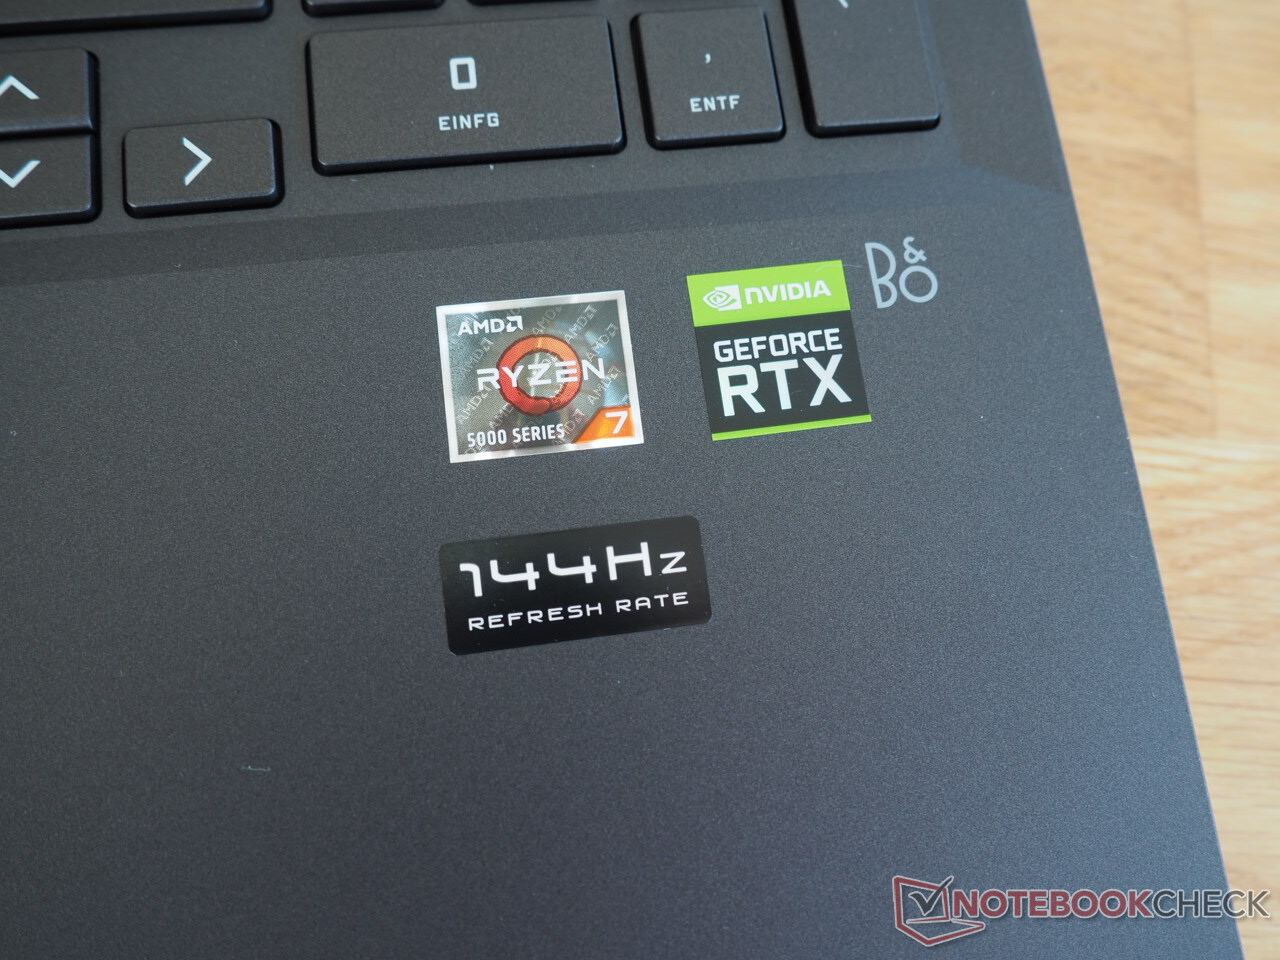
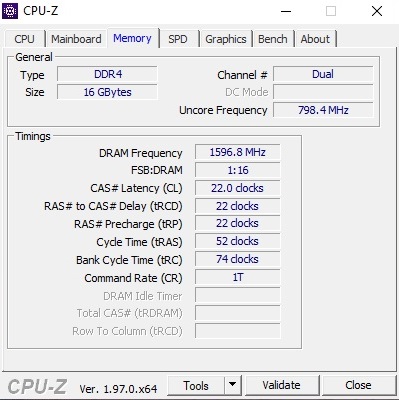
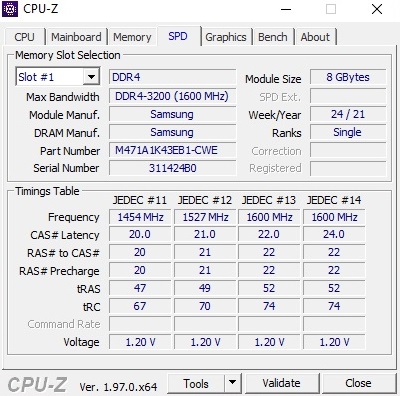
The brand new HP Victus 16 is available in various equipment configurations. Our test unit with the label e0179ng is available for almost 1400 Euros (~$1641) and contains a powerful GeForce RTX 3060 with 6 GB of GDDR6-VRAM and a very powerful Ryzen 7 5800H. They are accompanied by 16 GB of RAM in dual-channel mode (2x 8 GB DDR4-3.200) and a large, 1 TB NVMe SSD. The display is a matte 16.1-inch panel based on IPS with a 1920 x 1080 pixel resolution that supports FreeSync. Windows 10 Home 64 bit is preinstalled as the operating system.
The competitors of the Victus 16-e0179ng include other gaming laptops with the GeForce RTX 3060 such as the Lenovo Legion 5 15ACH, the Alienware m15 R5, and the Asus TUF F15 FX506HM. These competitors are also listed as the comparison devices in our charts below.
Possible Competitors in Comparison
Rating | Date | Model | Weight | Height | Size | Resolution | Price |
|---|---|---|---|---|---|---|---|
| 84.3 % v7 (old) | 09 / 2021 | HP Victus 16-e0179ng R7 5800H, GeForce RTX 3060 Laptop GPU | 2.5 kg | 23.5 mm | 16.10" | 1920x1080 | |
| 83.4 % v7 (old) | 09 / 2021 | Lenovo Legion 5 15ACH-82JU00C6GE-FL R7 5800H, GeForce RTX 3060 Laptop GPU | 2.5 kg | 26 mm | 15.60" | 1920x1080 | |
| 84.7 % v7 (old) | 06 / 2021 | Alienware m15 R5 Ryzen Edition R7 5800H, GeForce RTX 3060 Laptop GPU | 2.5 kg | 22.85 mm | 15.60" | 1920x1080 | |
| 85.9 % v7 (old) | 06 / 2021 | Asus TUF Gaming F15 FX506HM i7-11800H, GeForce RTX 3060 Laptop GPU | 2.3 kg | 24.9 mm | 15.60" | 1920x1080 |
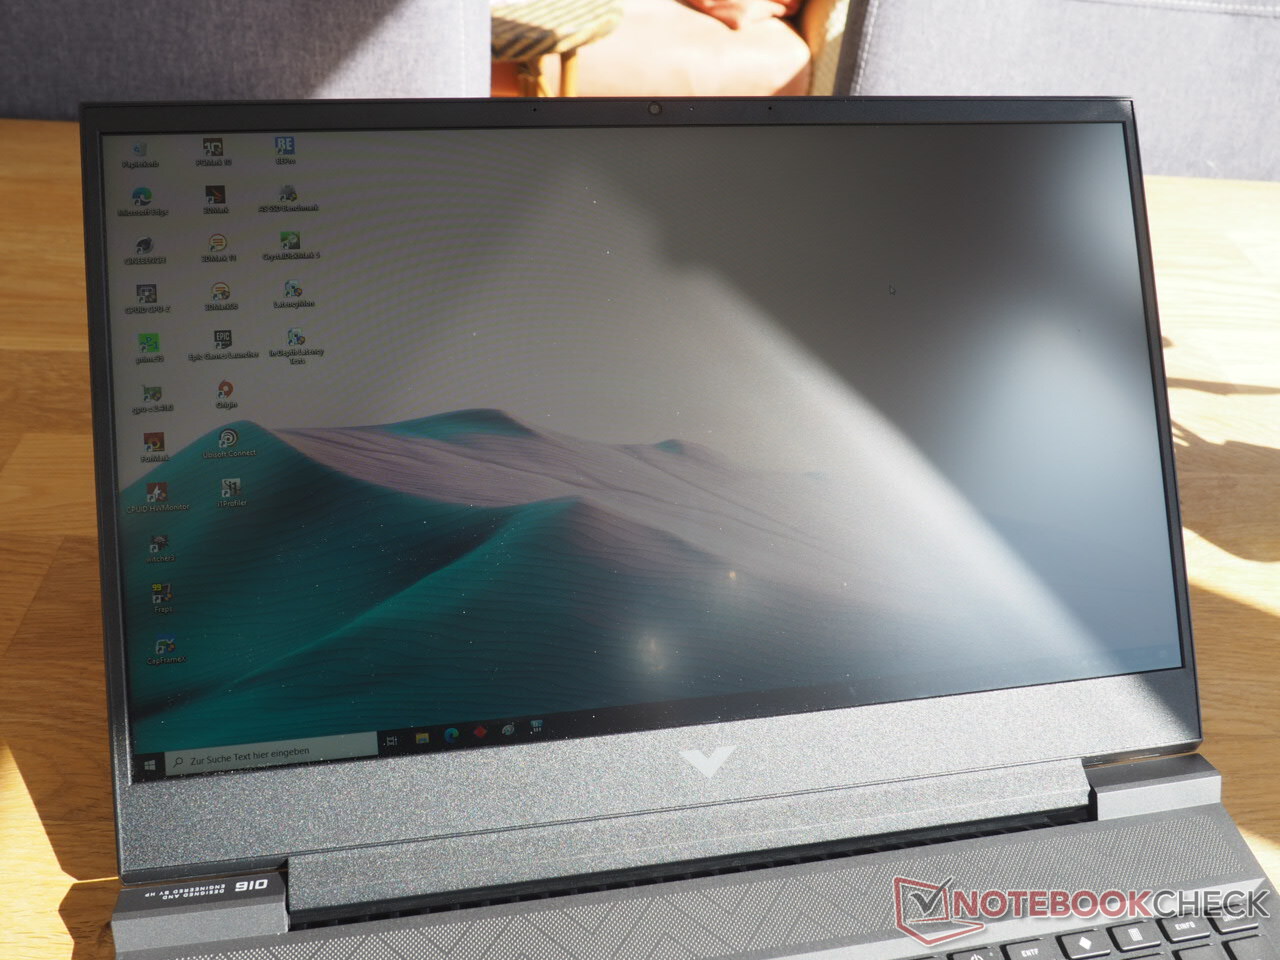
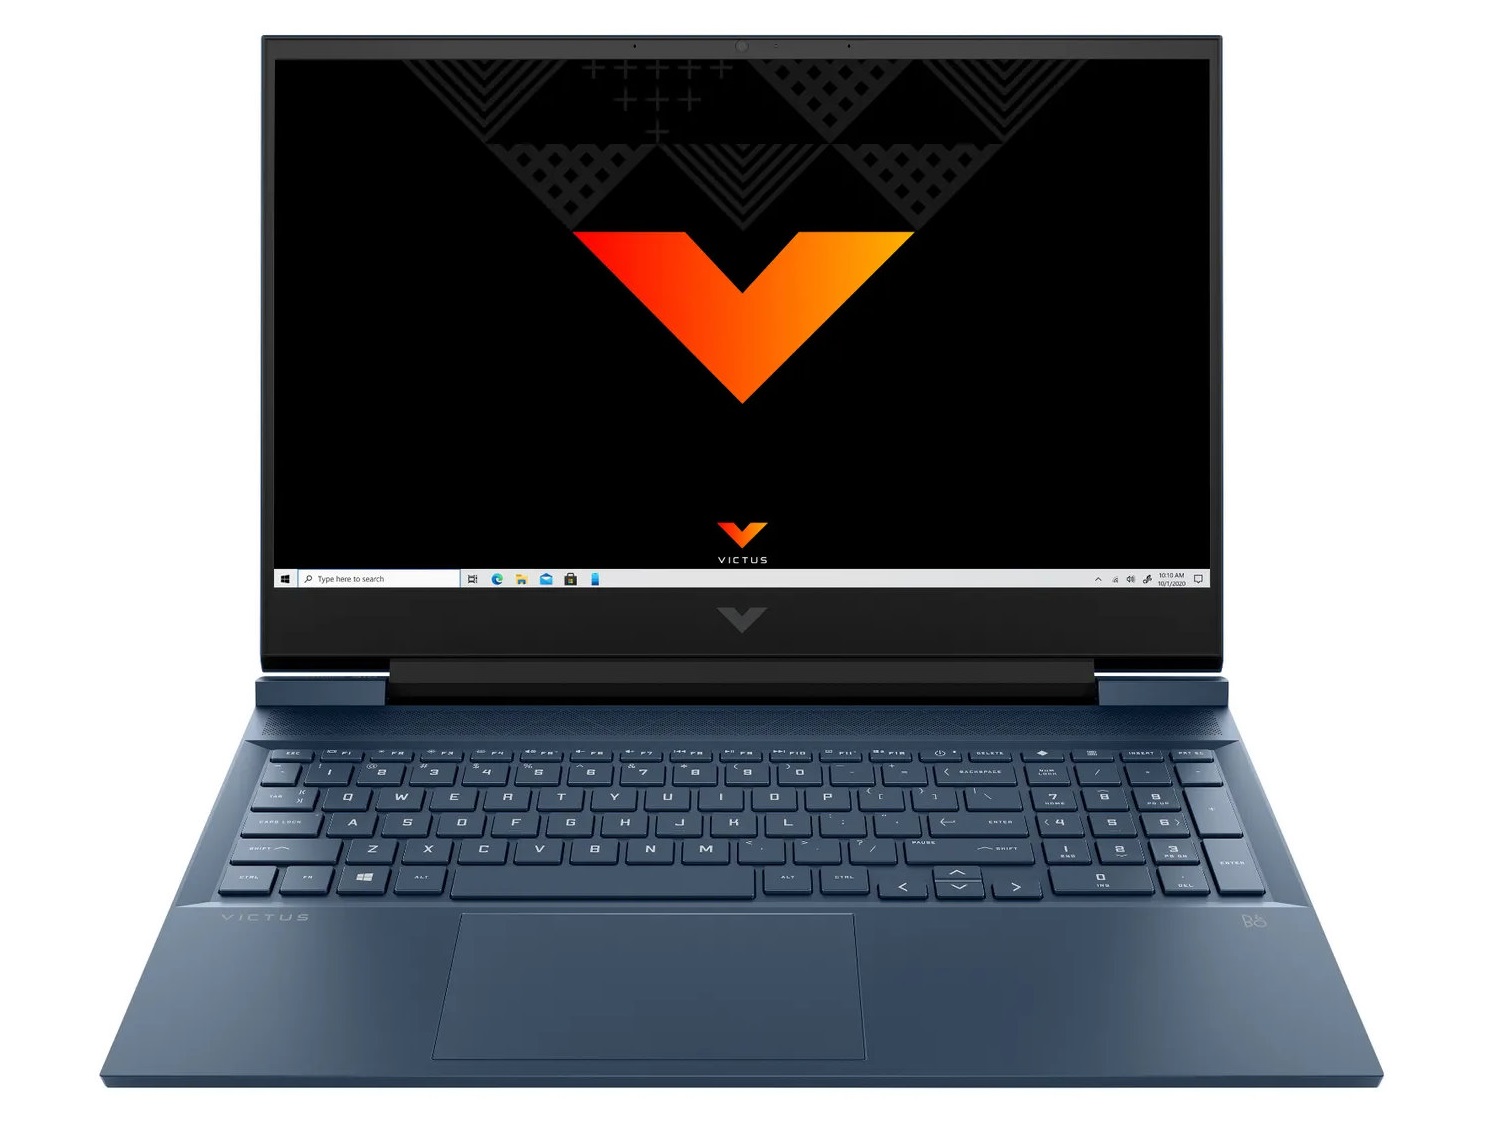
Case
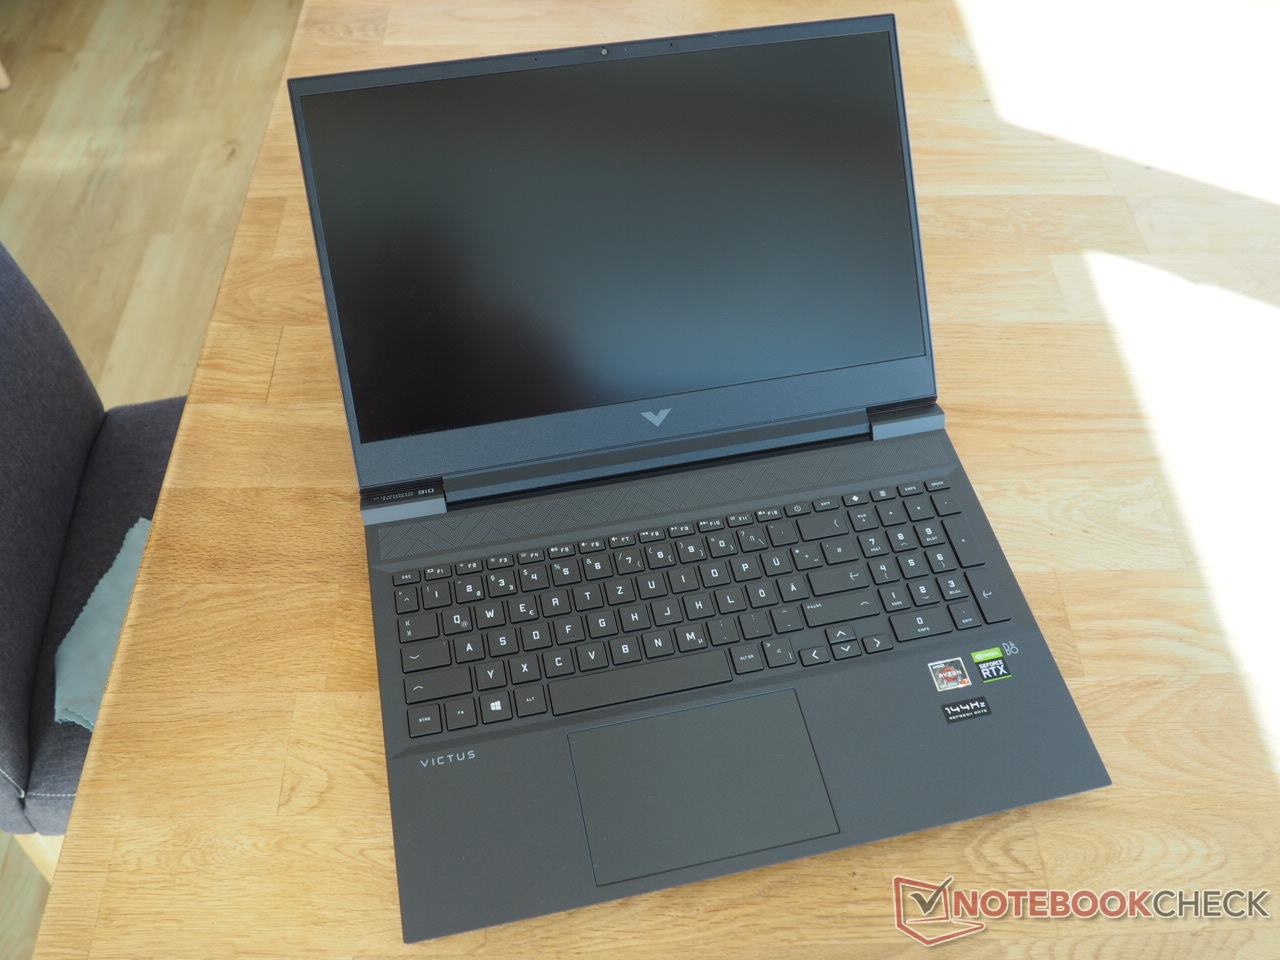
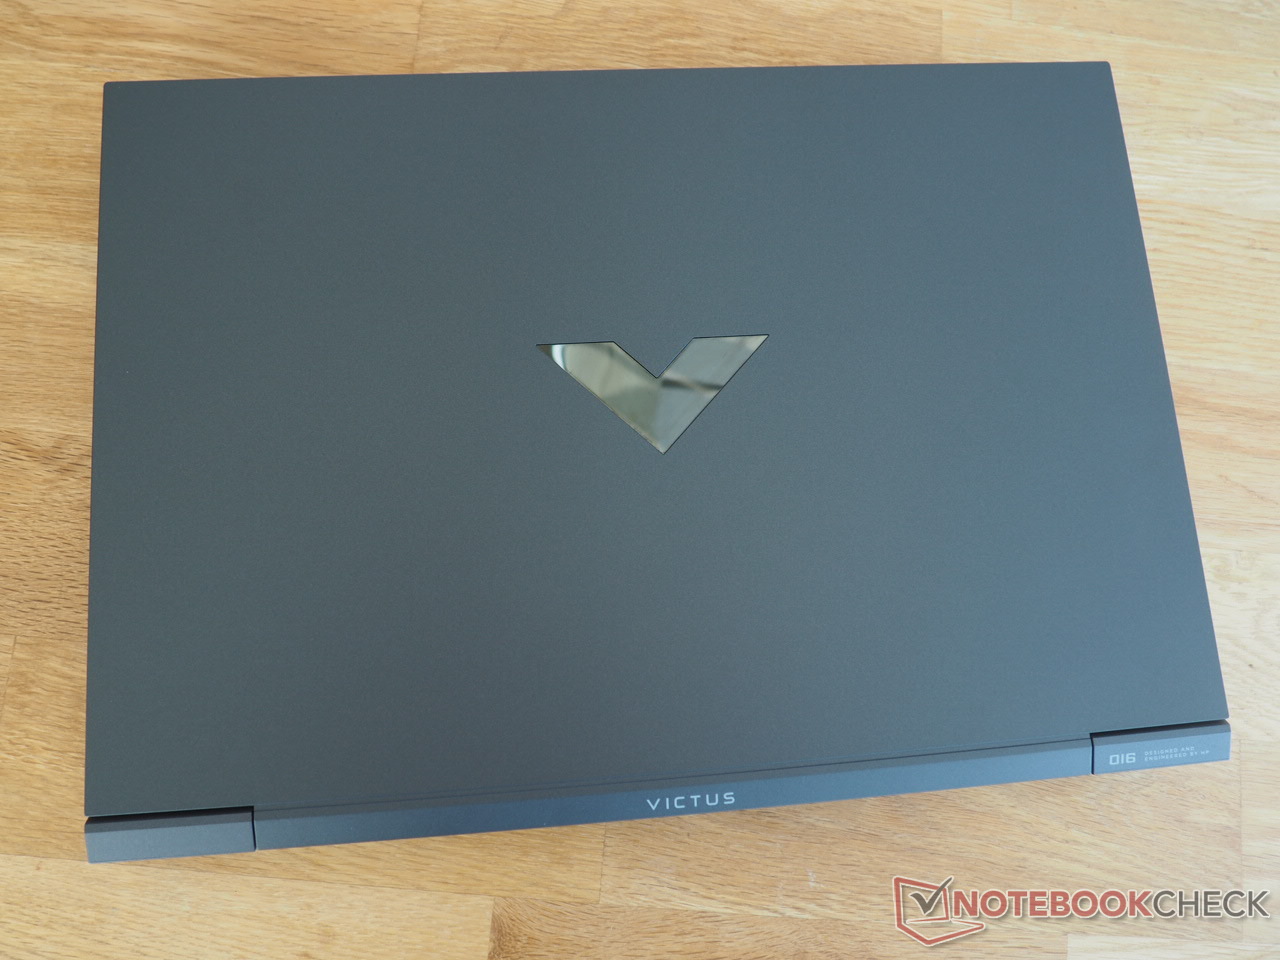
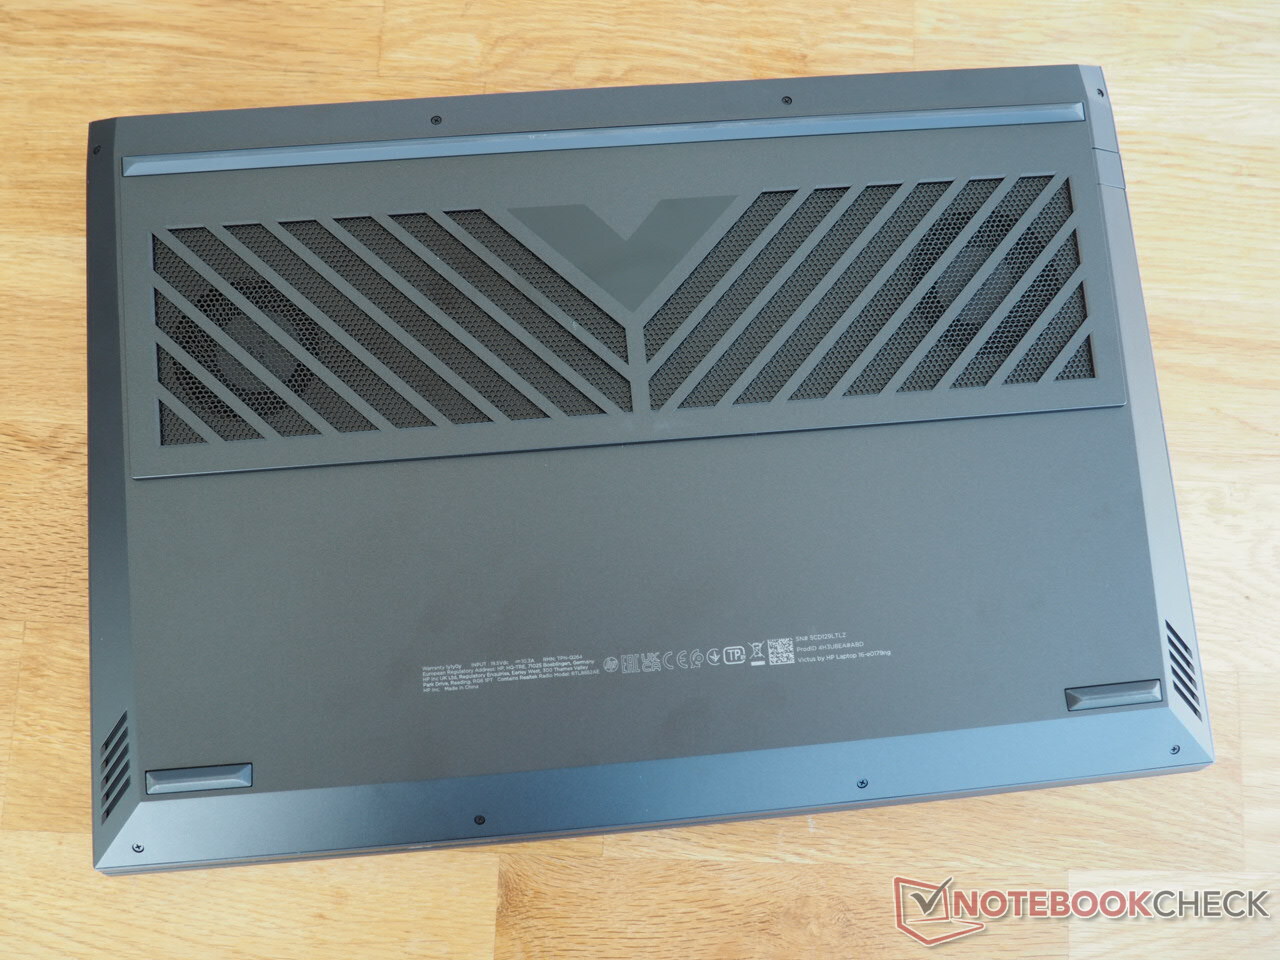
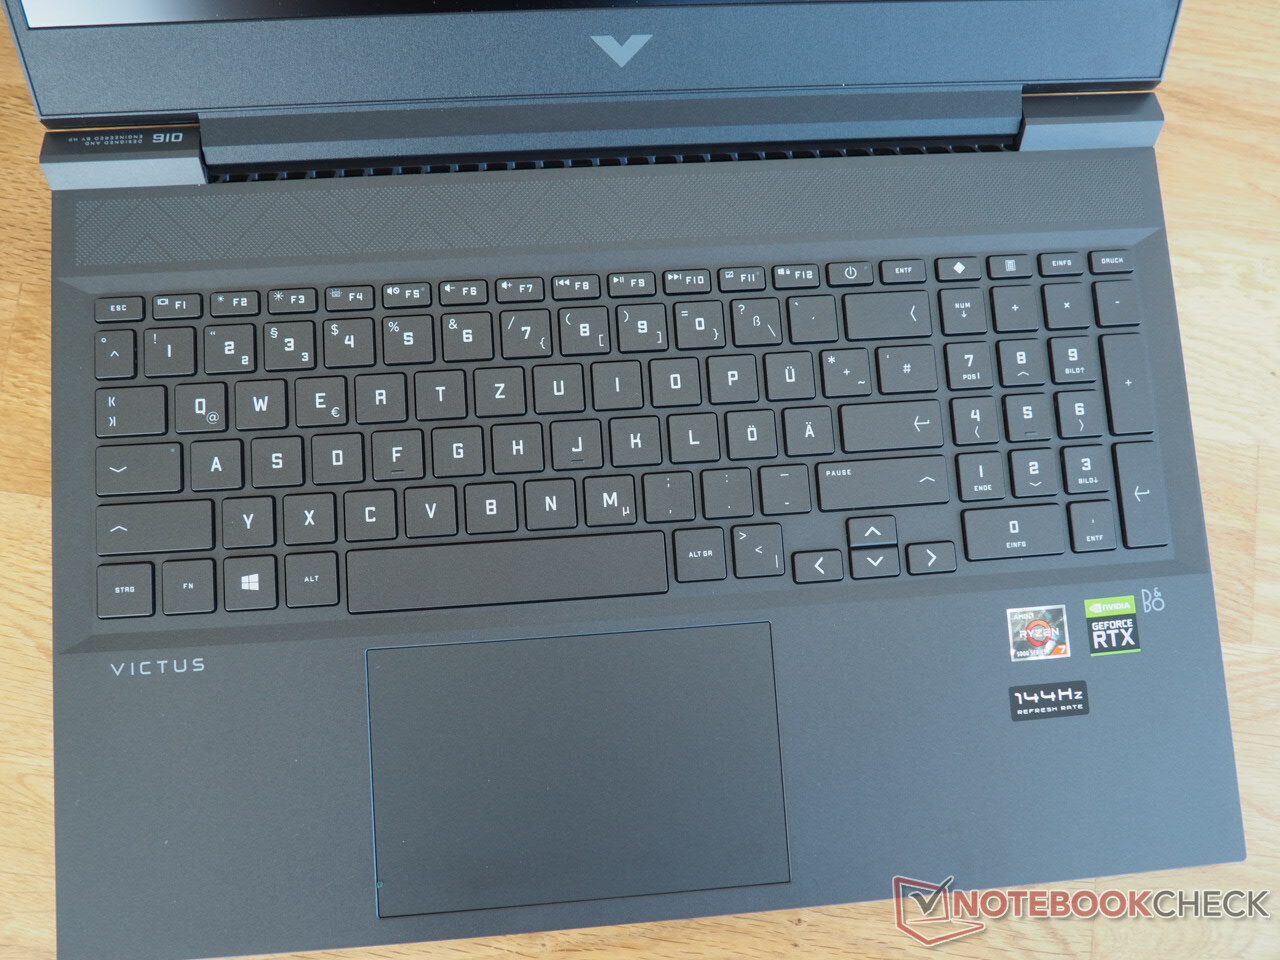
HP laptops are known for their unique designs. The Victus 16 is no exception here and distinguishes itself visually in many ways from the competitors. In addition to the V on the display lid (which is unfortunately very susceptible to fingerprints), the pretty design of the fan vents on the case bottom provides an individual look. Despite its numerous design elements, the case does not look overly playful but still rather subdued, which is mainly due to the dark colors.
In terms of the build quality, the Victus 16 leaves some mixed feelings. The plastic surfaces, which tend to produce clattering in some places (cover and touchpad area) could be more robust, for example. The hinges are also not perfect. First, when we open the display lid, the base unit also moves slightly with it, and second, vibrations of the surface will also lead to more than the usual wobbling of the display. On the other hand, the workmanship gives hardly any reason for complaint. Almost all the case elements of our test unit show clean transitions. However, due to the edgy design, some corners still feel quite sharp, so they can cause some discomfort while using the laptop.
At 2.5 kg (~5.5 lb), the weight of the Victus 16 is similar to that of the competitors. Only the Asus TUF F15 is a tick lighter at 2.3 kg (~5 lb). In terms of the height, with its 2.35 cm (~0.93 in), the 16-inch laptop presents a slim impression, placing between the slimmer Alienware m15 R5 and the thicker Lenovo Legion 5.
Equipment
Connections
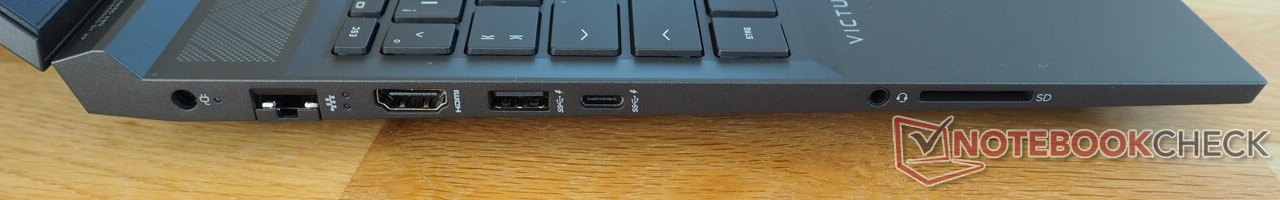
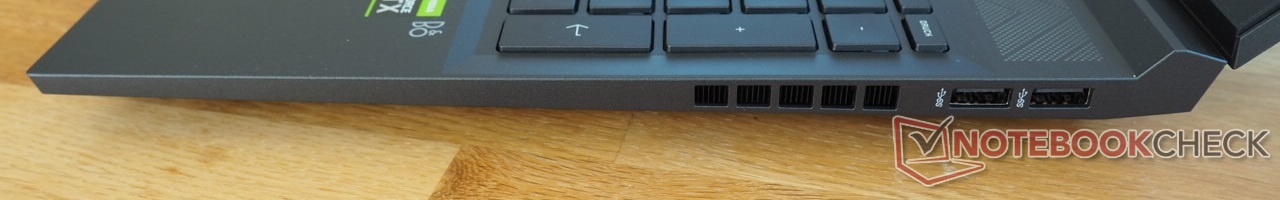
The connection equipment is not quite up-to-date anymore. Because of AMD, the laptop has to make do without Thunderbolt. However, the fact that the four available USB ports (3x Type-A, 1x Type-C) only support 3.2 Gen1, which corresponds to the old 3.0 standard, is an unnecessary limitation. At least the Type-C port is capable of DisplayPort output, so that together with the HDMI 2.1 port and the built-in display, you can run up to three displays. The connections are completed by an RJ45 port, an audio port (combined headset/microphone port), and a card reader.
Since most of the connections are placed in the back half of both sides, it is easy to use an external mouse, particularly for right-handed users.
SD Card Reader
The card reader (SD/SDHC/SDXC) delivers a mediocre performance. Barely 80 MB/s during sequential reading and transferring photos are less than the average for gaming laptops. But at least the Victus 16 has a card reader, while all of the competitors fail in this regard.
| SD Card Reader | |
| average JPG Copy Test (av. of 3 runs) | |
| Average of class Gaming (20.9 - 210, n=54, last 2 years) | |
| HP Victus 16-e0179ng (AV PRO microSD 128 GB V60) | |
| maximum AS SSD Seq Read Test (1GB) | |
| Average of class Gaming (25.5 - 261, n=51, last 2 years) | |
| HP Victus 16-e0179ng (AV PRO microSD 128 GB V60) | |
Communication
A communication module from Realtek handles the wireless communication. While the RTL8852AE is at a fairly current level in terms of the technology (Wi-Fi 6), in our range test using the Netgear Nighthawk AX12 router (1 m distance), the measured results weren't really convincing. For receiving data, the Victus 16 finished in the last place, for example.
Webcam
As we are used to from most laptops, the webcam quality is limited. In addition to the color accuracy, the image sharpness also turns out disappointing.


Accessories
All that is included in the box is a quick start guide and a nicely rounded 200-Watt power supply.
Maintenance
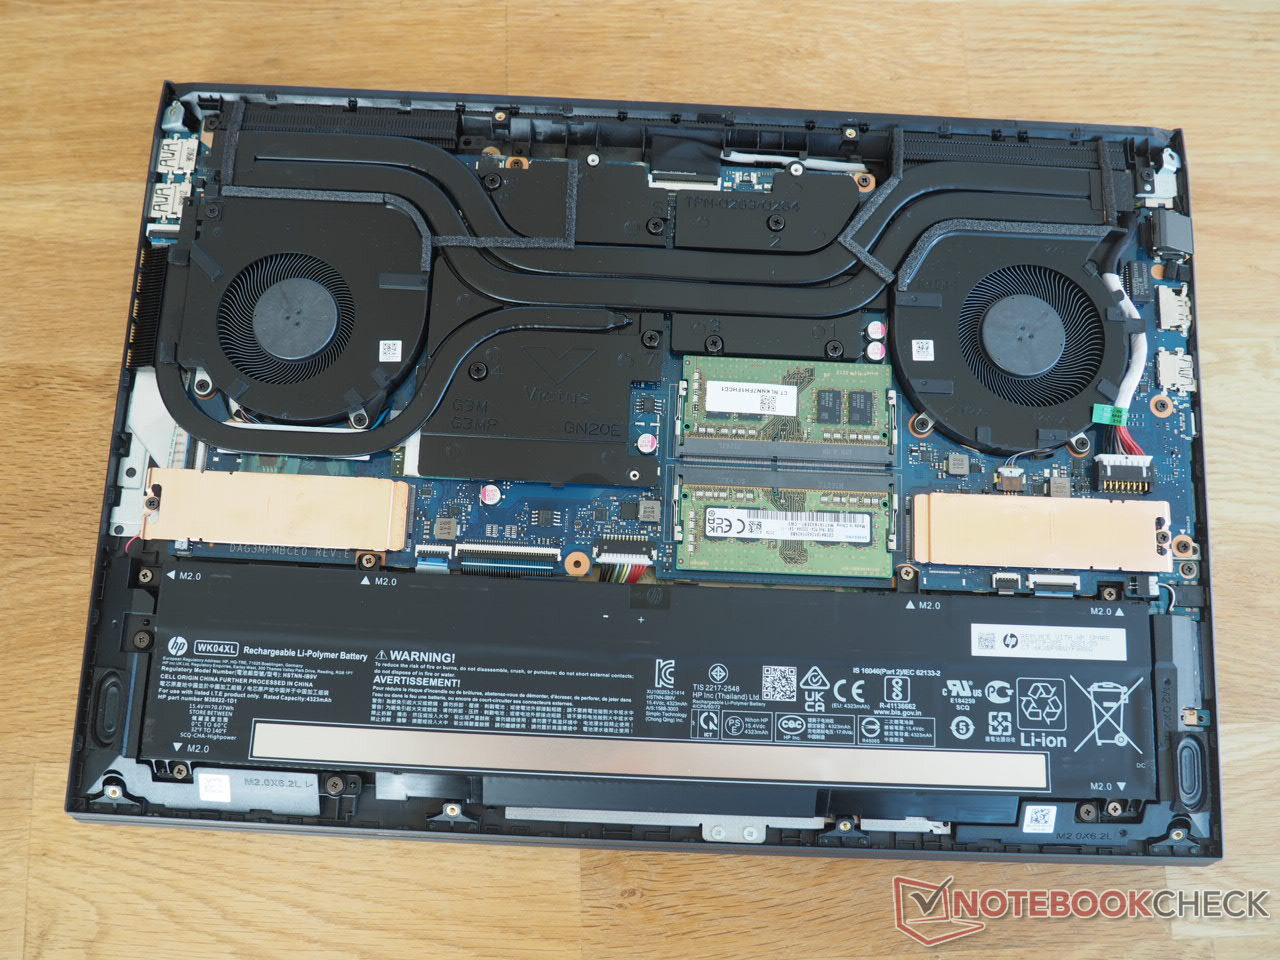
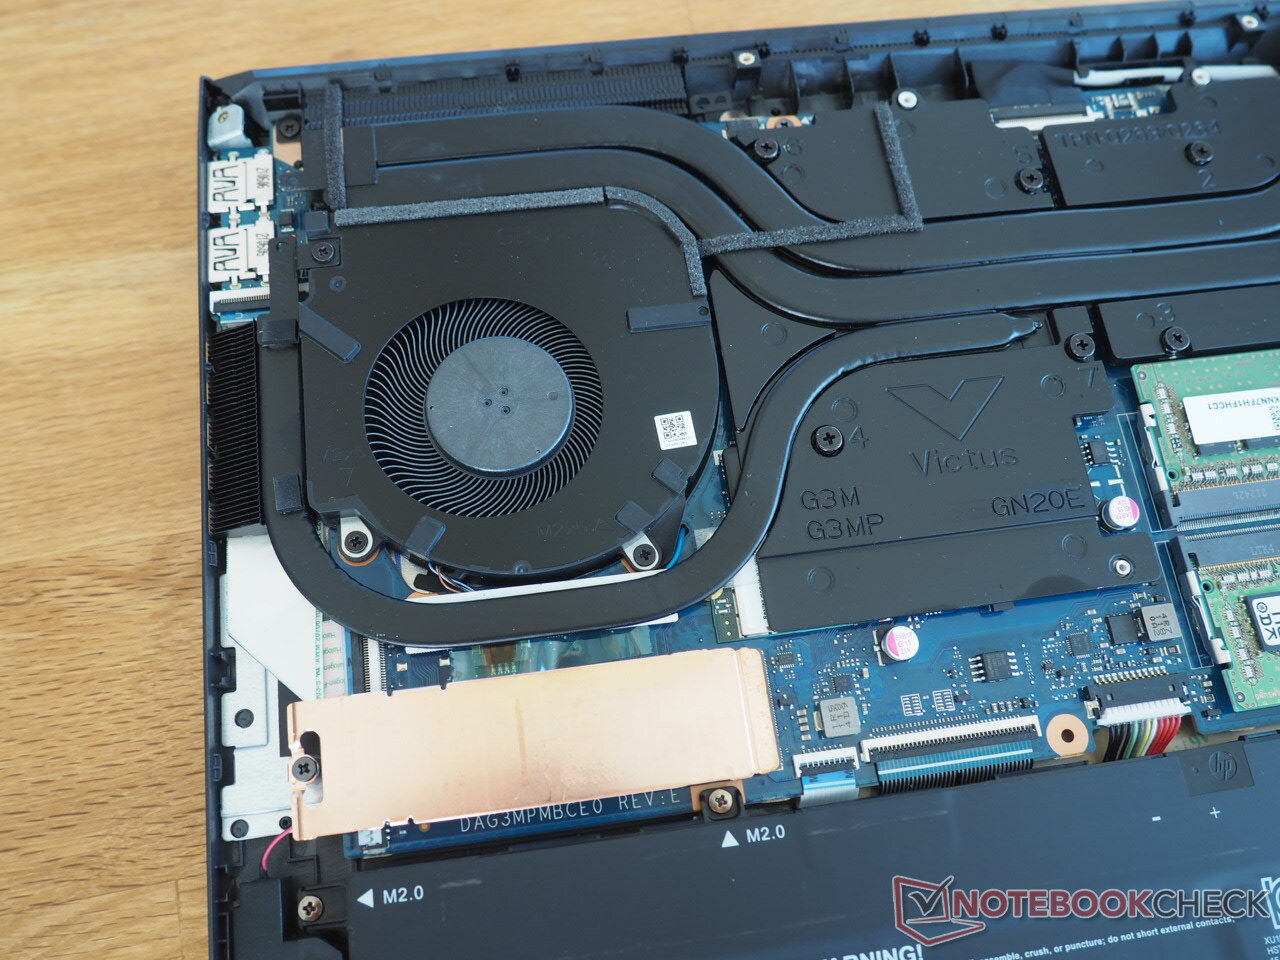
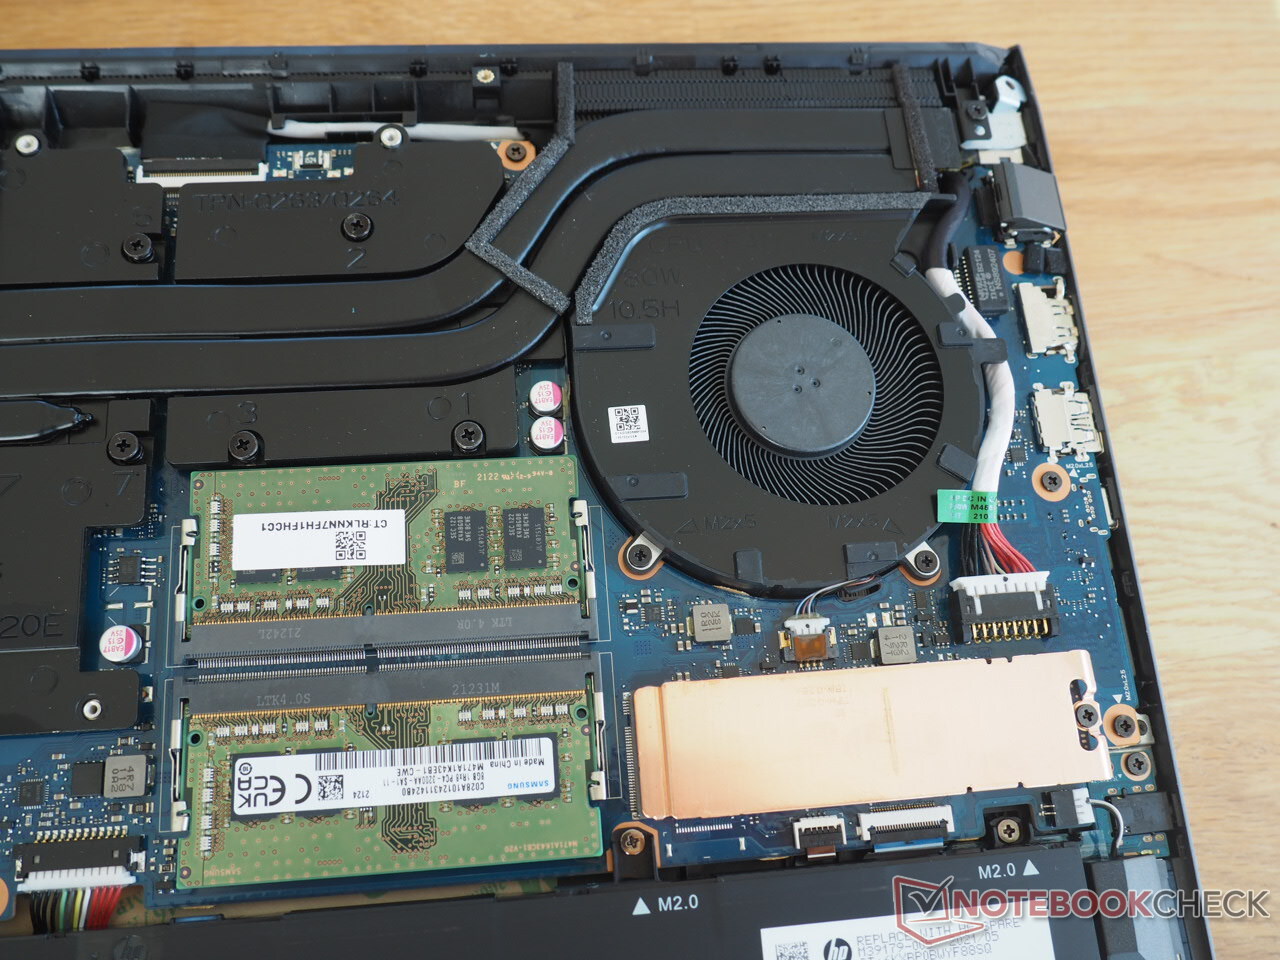
Not only will you need a small screw driver for tiny Philips screws to get at the insides, but you also need a good combination of delicate touch and force. The bottom of the case is tightly fastened, especially in the back. After you finally succeeded in opening the case, you are greeted by a clean presentation. The space below the palm rest is completely taken up by the battery. Behind that are two RAM slots and two M.2 slots (each of them with a cooling element). The cooling system consists of two fans, several heat pipes, and relatively large-size metal surfaces.
Input Devices
Keyboard
The Victus 16 uses a slightly unconventional keyboard layout. The position of the power button is just as unusual as the placement of the Insert and Delete keys, as well as the ><| key (see picture). German users will also have to get used to the single-row Enter key. There are more negative points for the measly arrow keys that are hardly suitable for gaming. On the other hand, the 16-inch laptop offers a full number block. We would evaluate the typing experience as "good" (pressure point, stroke, etc.), although the shape of the keys has a real edge to it.

Touchpad
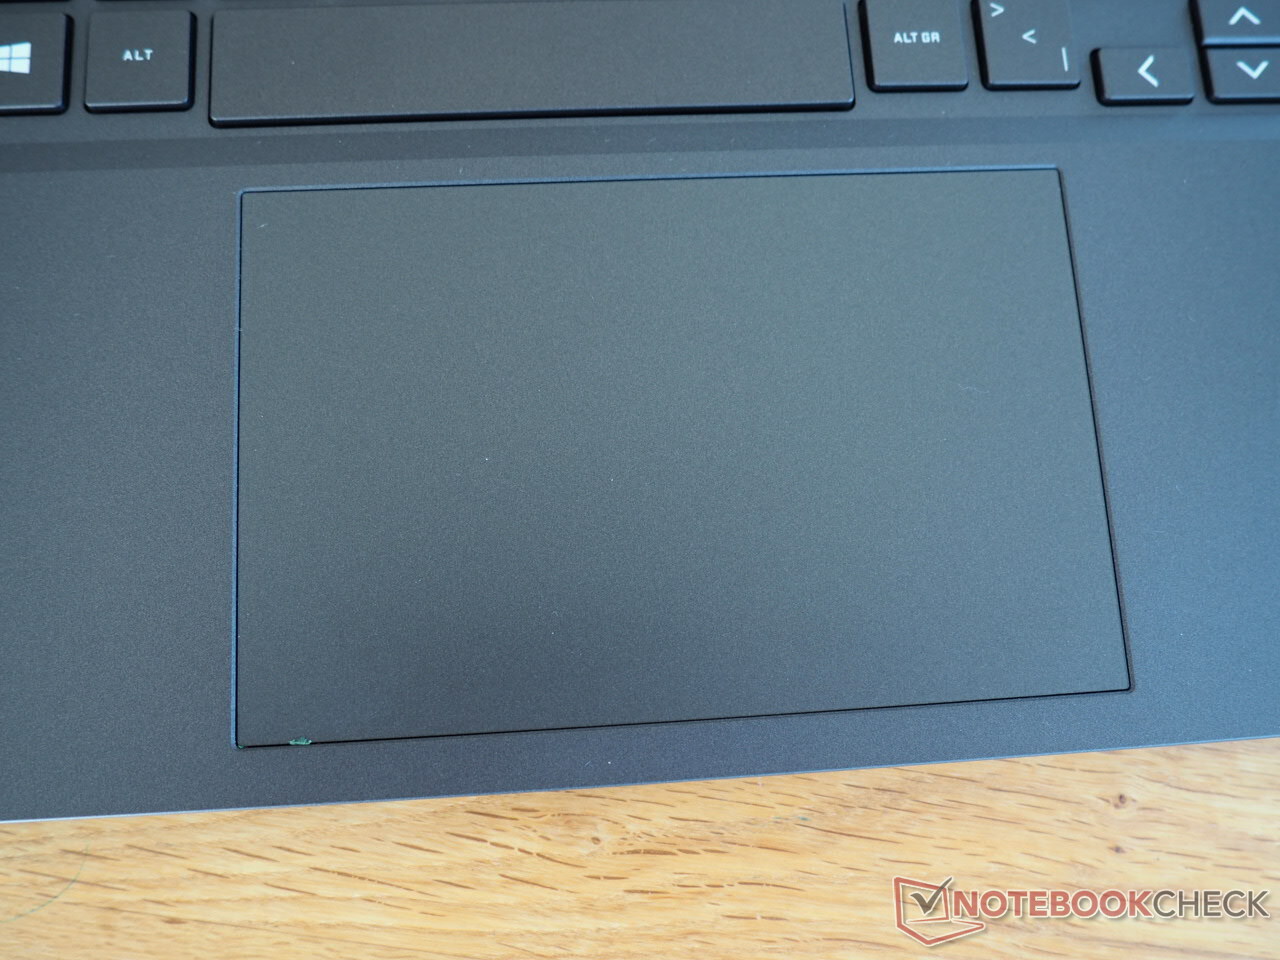
Aside from the stability, which is less than optimal, the touchpad delivers a good performance. With a width of 12.5 cm (~4.9 in) and depth of 8 cm (~3.1 in), it is pleasantly large. Even though the surface feels slightly less smooth than in many competitors, all the mouse movements succeed easily. Gesture support such as zooming and scrolling with two fingers also works reliably. A small issue: left and right clicks at the bottom edge produce slight clattering sounds, which takes away some of the quality impression of the laptop.
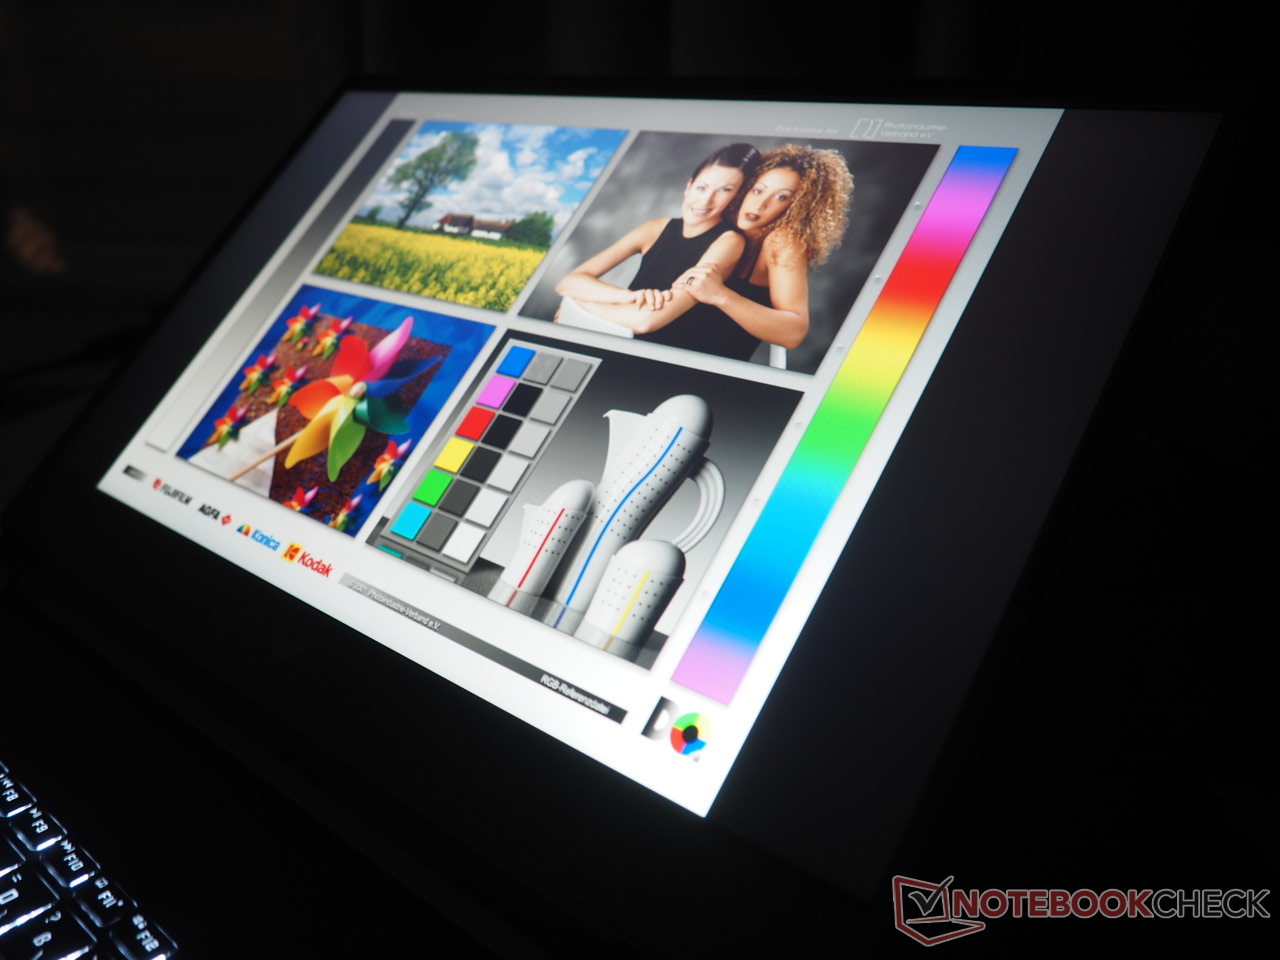
Display
While some of the competitors offer mediocre displays (the first of those being the Asus TUF F15), the 144-Hz panel of the Victus 16-e0179ng scores in almost every regard.
| |||||||||||||||||||||||||
Brightness Distribution: 88 %
Center on Battery: 361 cd/m²
Contrast: 1203:1 (Black: 0.3 cd/m²)
ΔE ColorChecker Calman: 2.44 | ∀{0.5-29.43 Ø4.73}
calibrated: 1.26
ΔE Greyscale Calman: 4.6 | ∀{0.09-98 Ø4.97}
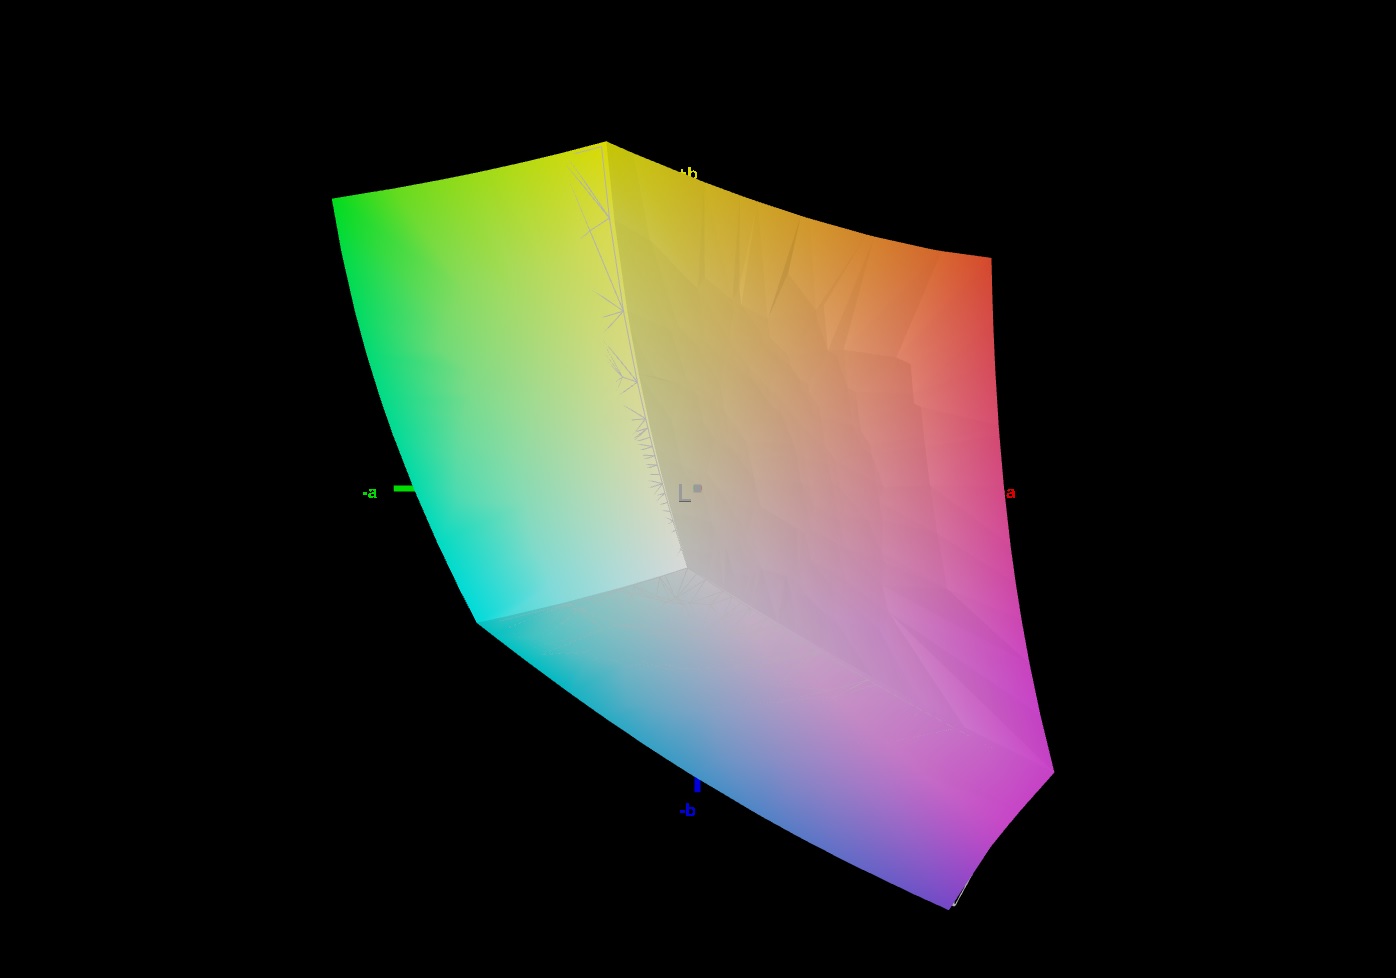
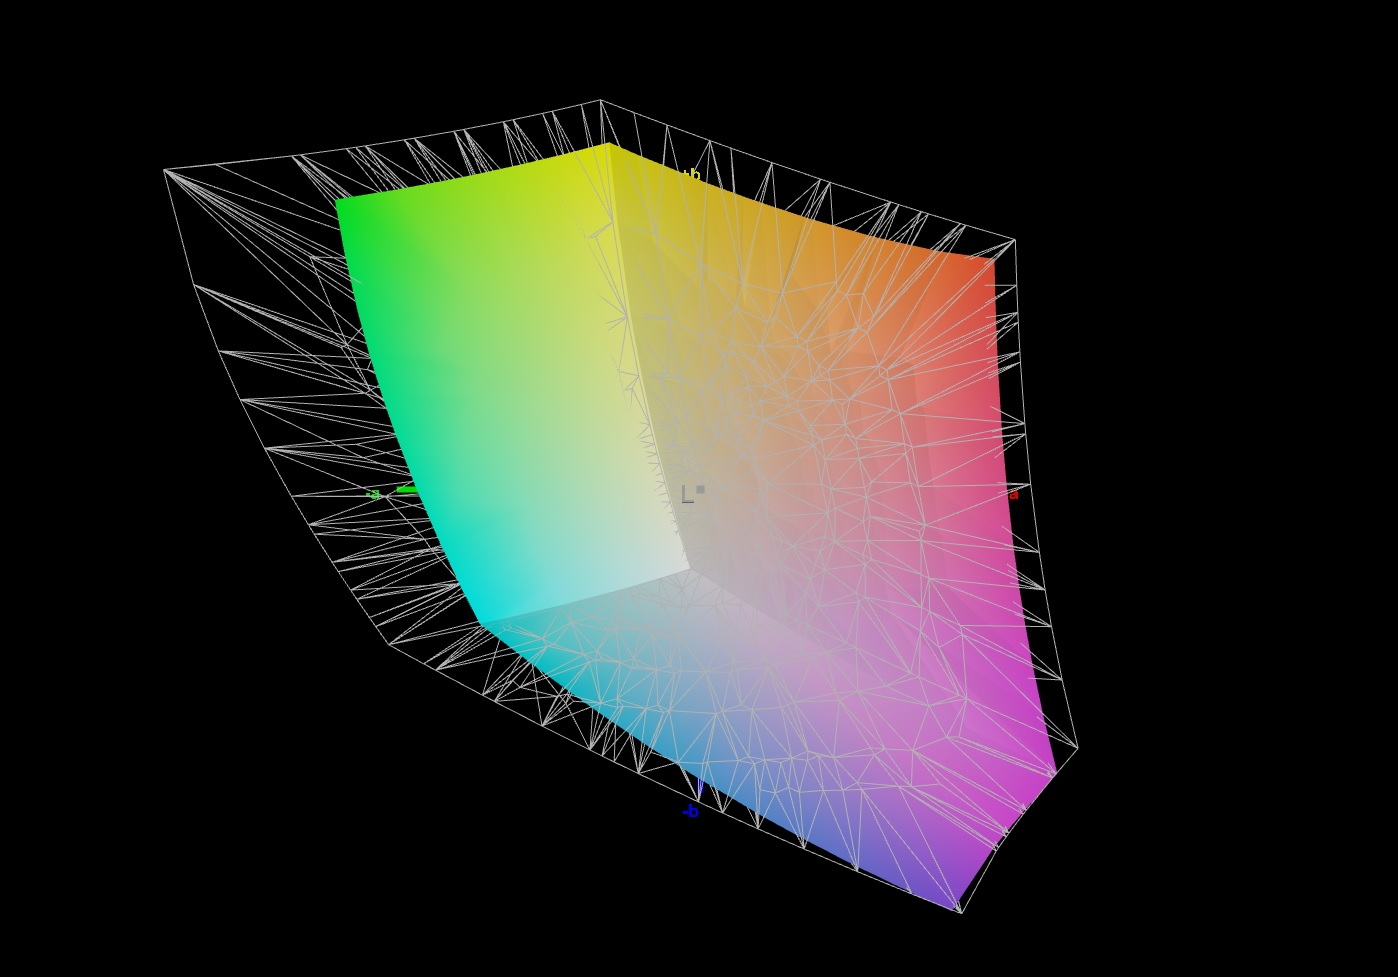
73.5% AdobeRGB 1998 (Argyll 3D)
100% sRGB (Argyll 3D)
72.6% Display P3 (Argyll 3D)
Gamma: 2.268
CCT: 6609 K
| HP Victus 16-e0179ng BOE09BE, IPS, 1920x1080, 16.1" | Lenovo Legion 5 15ACH-82JU00C6GE-FL B156HAN12.H, , 1920x1080, 15.6" | Alienware m15 R5 Ryzen Edition B156HAN, IPS, 1920x1080, 15.6" | Asus TUF Gaming F15 FX506HM Chi Mei N156HRA-EA1, IPS, 1920x1080, 15.6" | |
|---|---|---|---|---|
| Display | -7% | -40% | ||
| Display P3 Coverage (%) | 72.6 | 65.4 -10% | 41.9 -42% | |
| sRGB Coverage (%) | 100 | 96.3 -4% | 62.9 -37% | |
| AdobeRGB 1998 Coverage (%) | 73.5 | 67.5 -8% | 43.3 -41% | |
| Response Times | -3% | 50% | -123% | |
| Response Time Grey 50% / Grey 80% * (ms) | 9.6 ? | 13.6 ? -42% | 4 ? 58% | 28.4 ? -196% |
| Response Time Black / White * (ms) | 14.4 ? | 9.2 ? 36% | 8.4 ? 42% | 21.6 ? -50% |
| PWM Frequency (Hz) | ||||
| Screen | -14% | 3% | -59% | |
| Brightness middle (cd/m²) | 361 | 350 -3% | 329 -9% | 268.3 -26% |
| Brightness (cd/m²) | 341 | 350 3% | 321 -6% | 257 -25% |
| Brightness Distribution (%) | 88 | 96 9% | 92 5% | 84 -5% |
| Black Level * (cd/m²) | 0.3 | 0.3 -0% | 0.27 10% | 0.34 -13% |
| Contrast (:1) | 1203 | 1167 -3% | 1219 1% | 789 -34% |
| Colorchecker dE 2000 * | 2.44 | 3.9 -60% | 2.78 -14% | 5.05 -107% |
| Colorchecker dE 2000 max. * | 6.37 | 8.2 -29% | 4.88 23% | 15.43 -142% |
| Colorchecker dE 2000 calibrated * | 1.26 | 1.6 -27% | 1.63 -29% | 3.21 -155% |
| Greyscale dE 2000 * | 4.6 | 5.5 -20% | 2.5 46% | 5.5 -20% |
| Gamma | 2.268 97% | 2.15 102% | 2.106 104% | 2.35 94% |
| CCT | 6609 98% | 7414 88% | 6201 105% | 7392 88% |
| Color Space (Percent of AdobeRGB 1998) (%) | 76 | |||
| Color Space (Percent of sRGB) (%) | 99 | |||
| Total Average (Program / Settings) | -8% /
-11% | 27% /
12% | -74% /
-64% |
* ... smaller is better
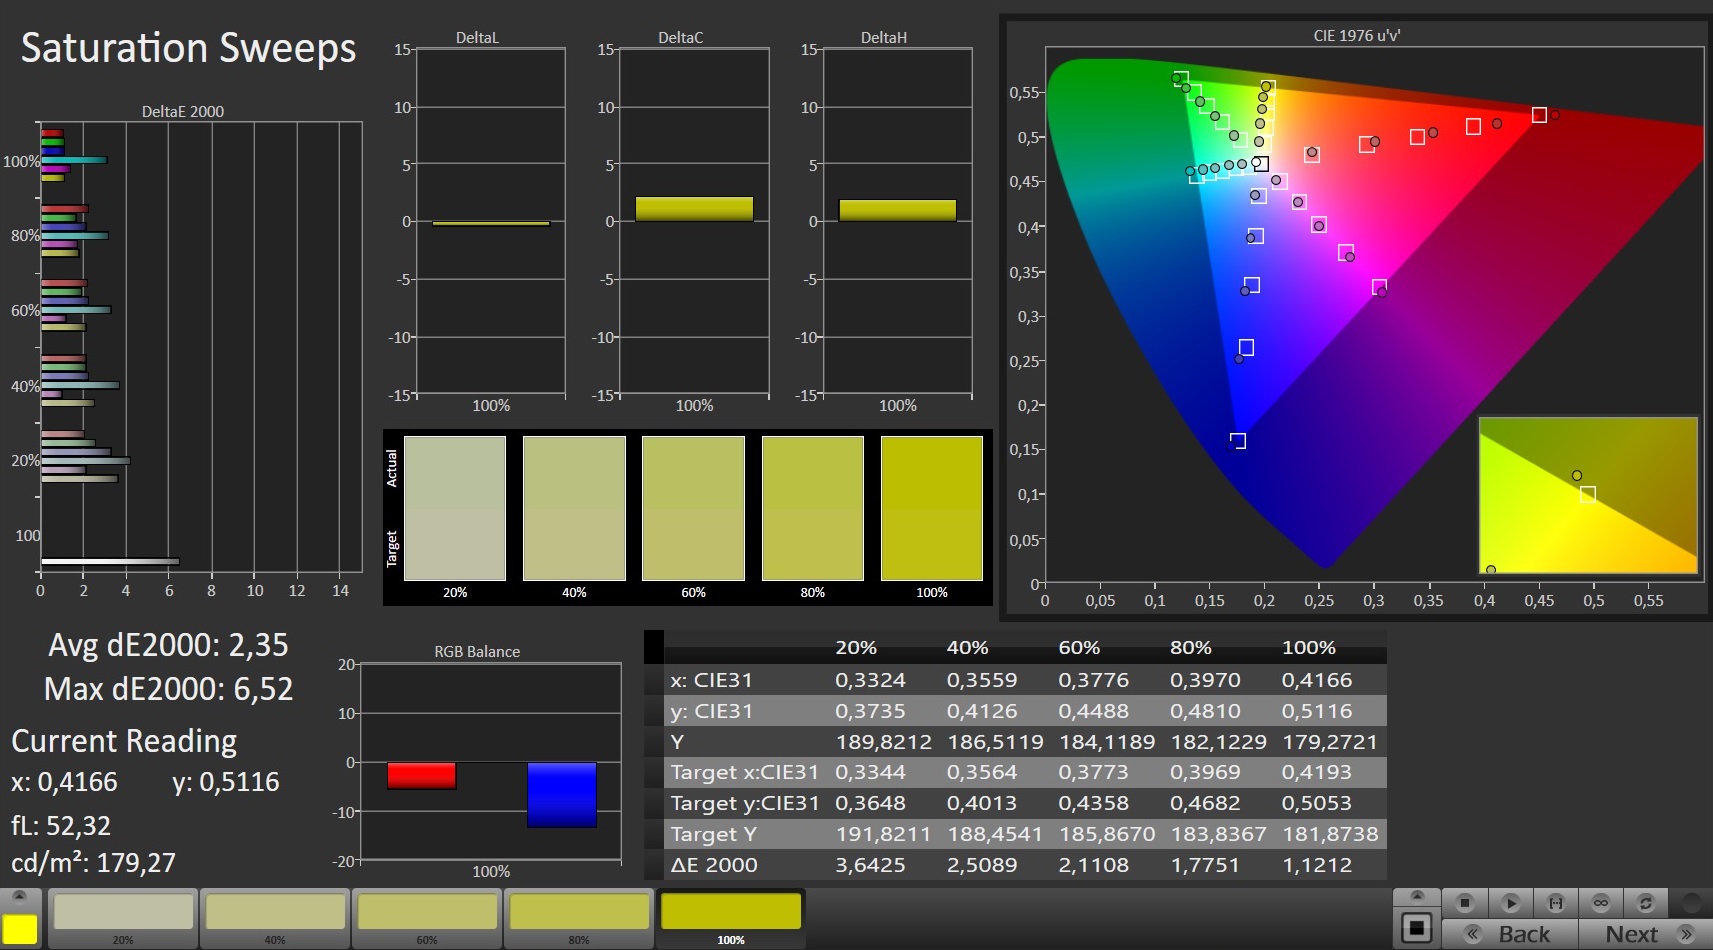
This begins with the color space coverage, which measures 100% sRGB and almost 74% AdobeRGB. This is quite a lot for a gaming laptop. At about 10 ms, the response time is also not bad.
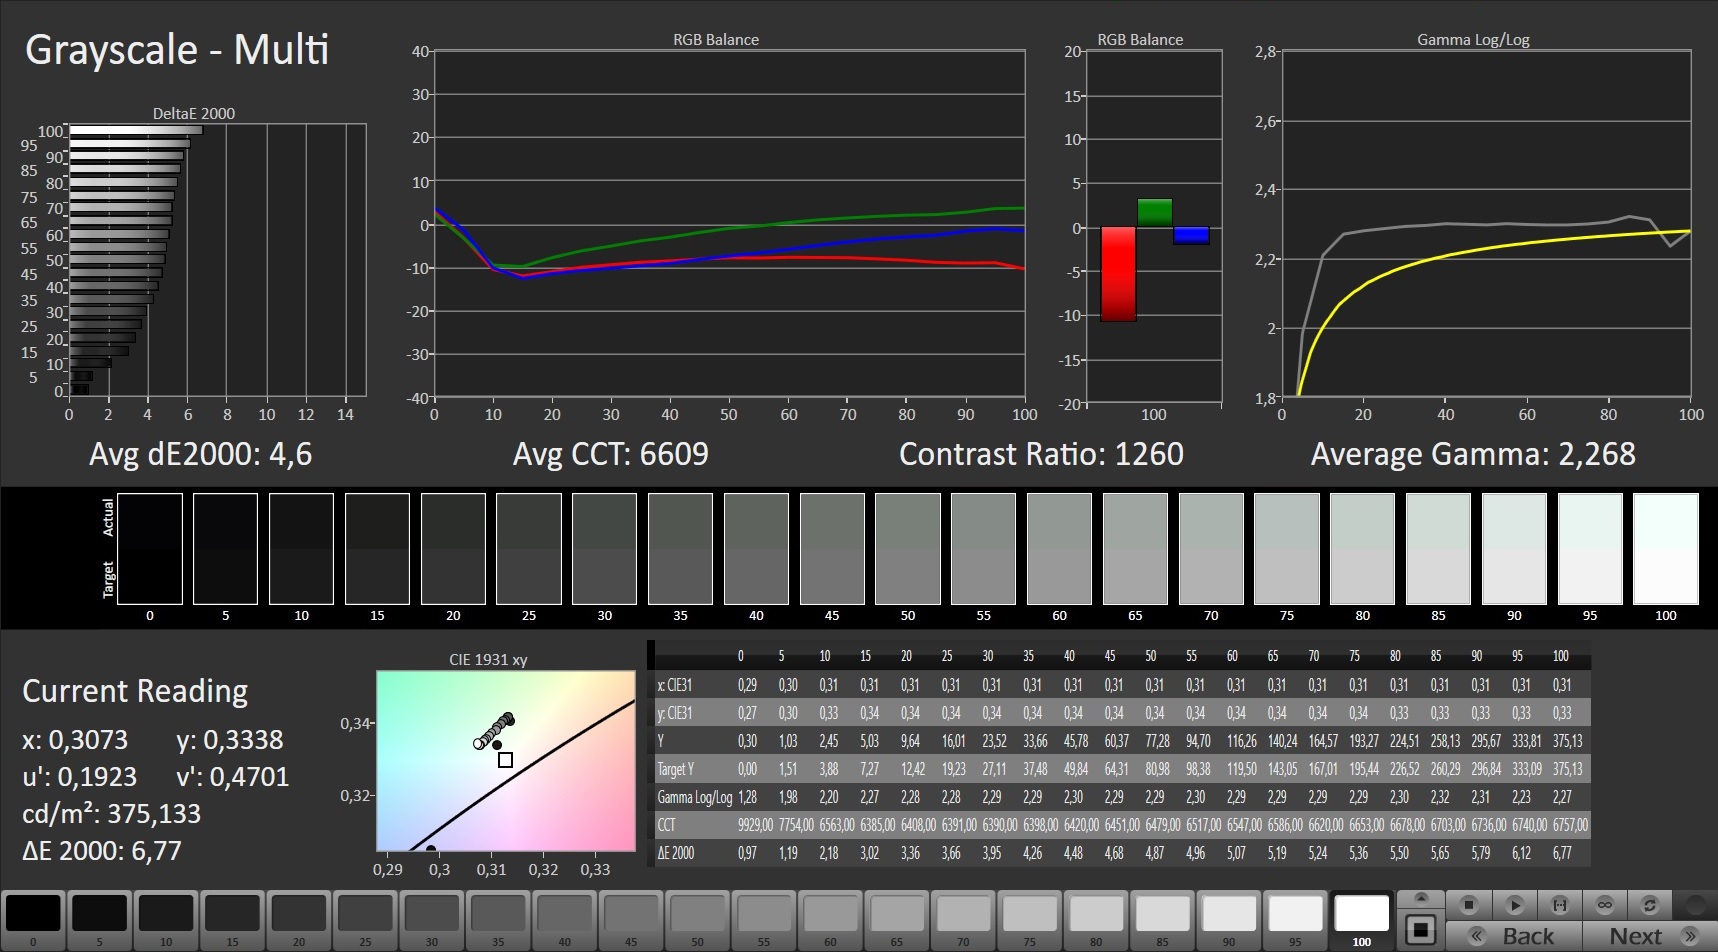
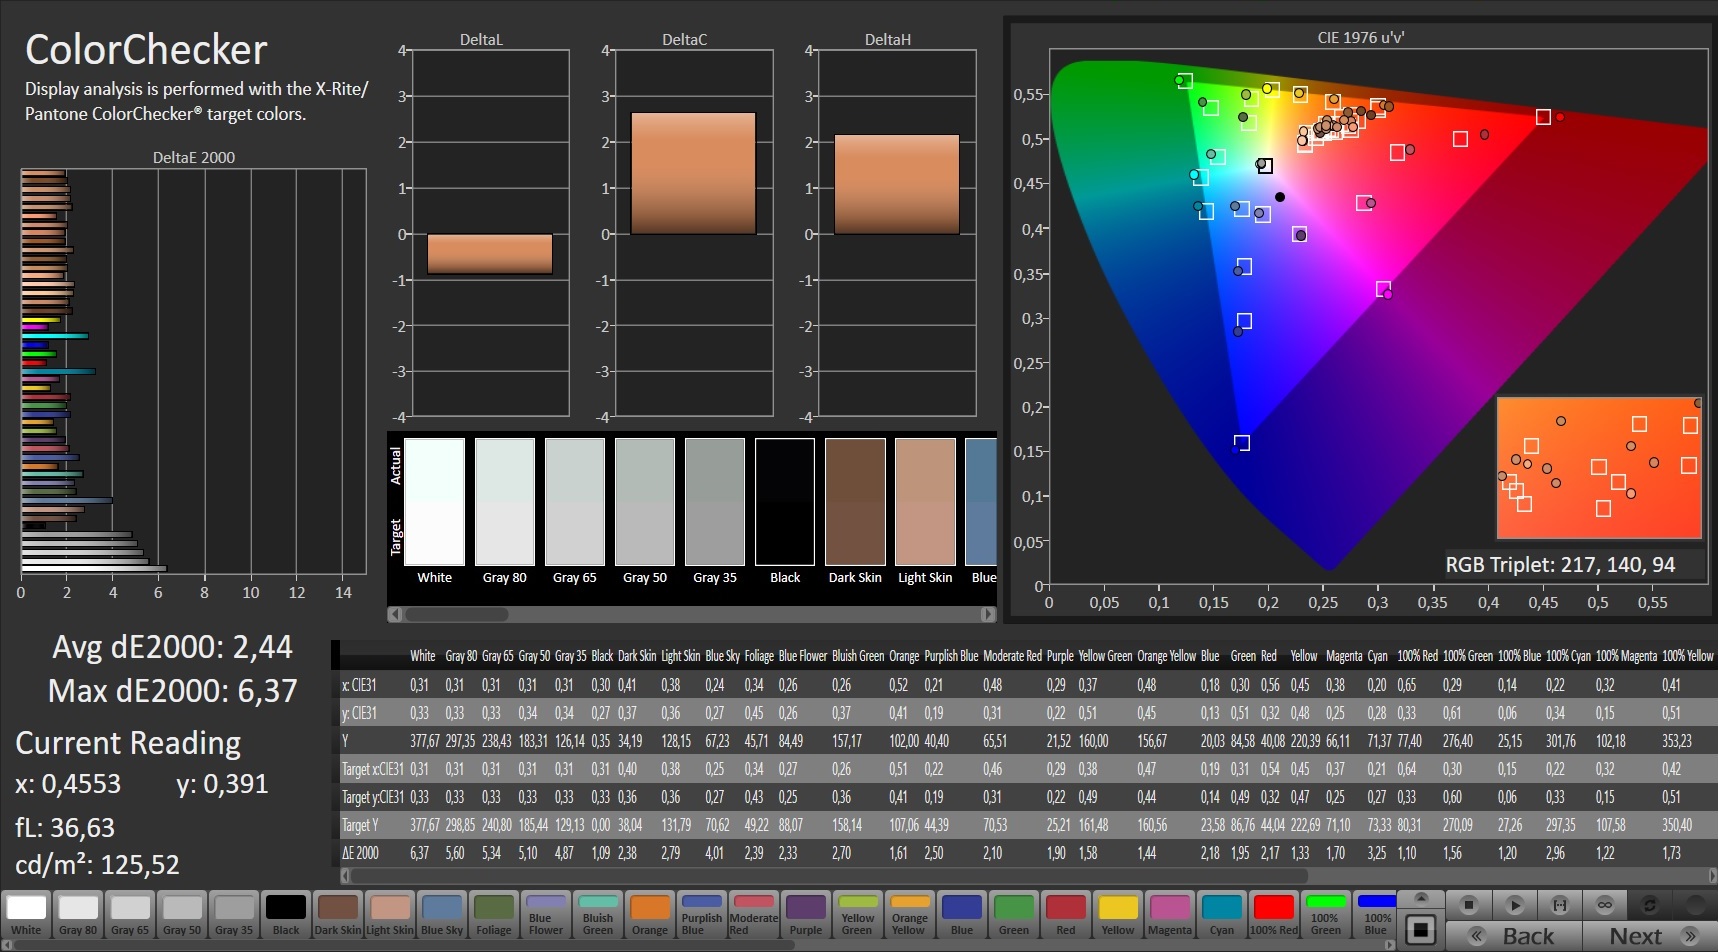
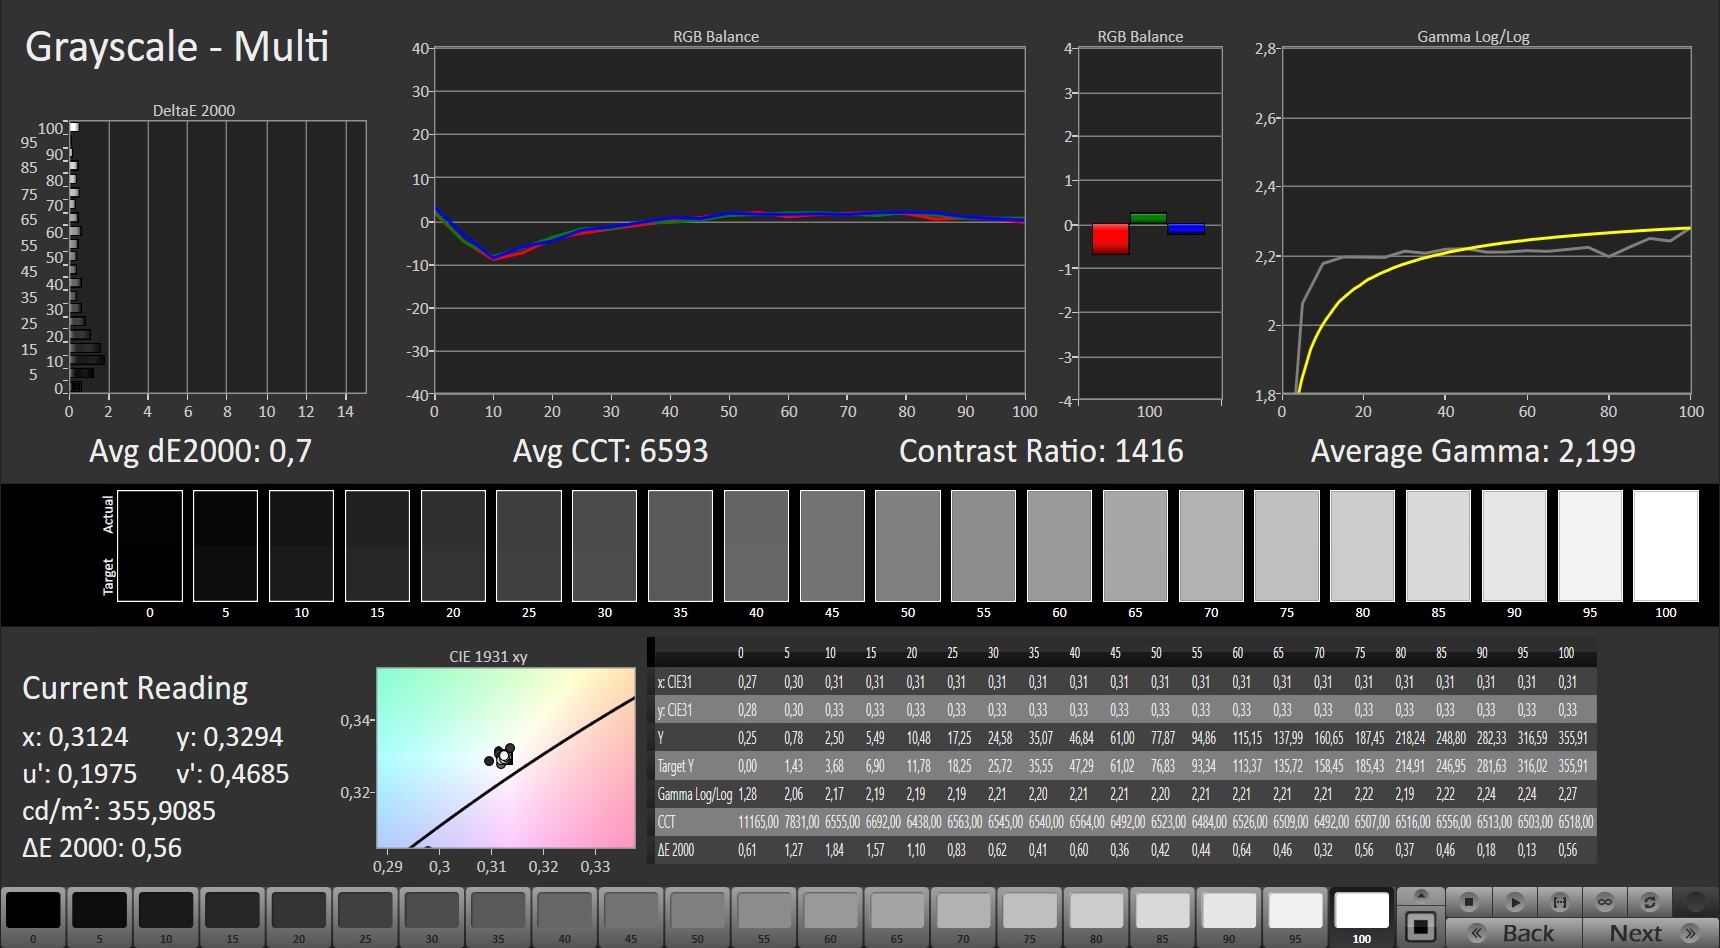
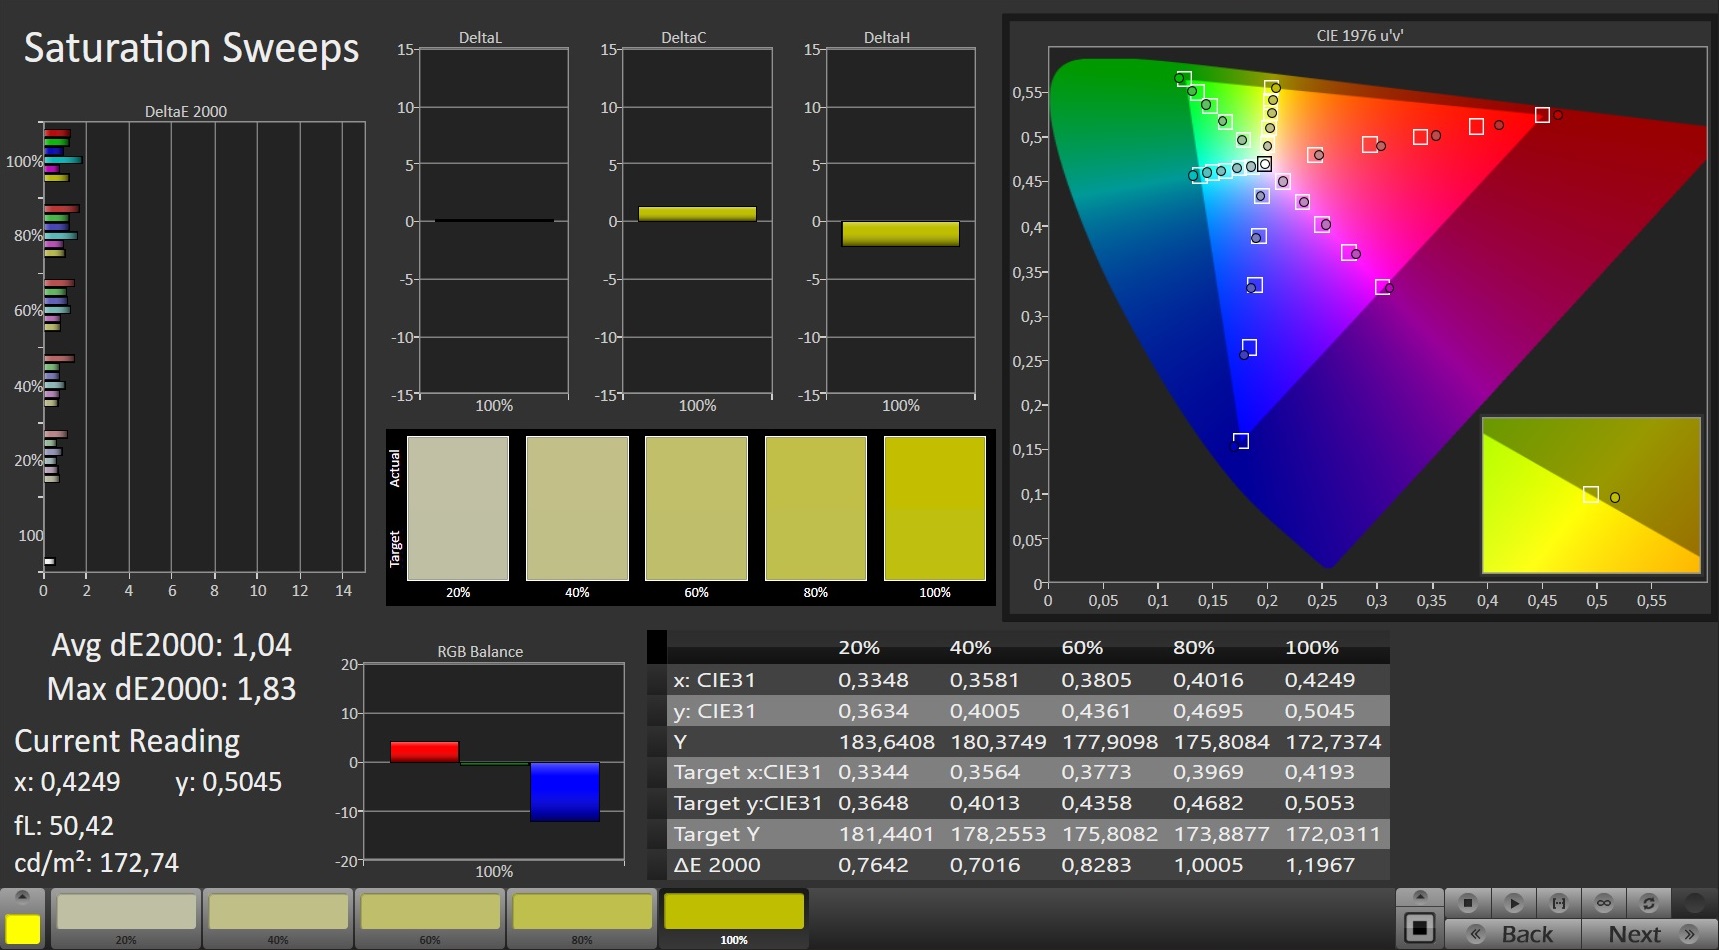
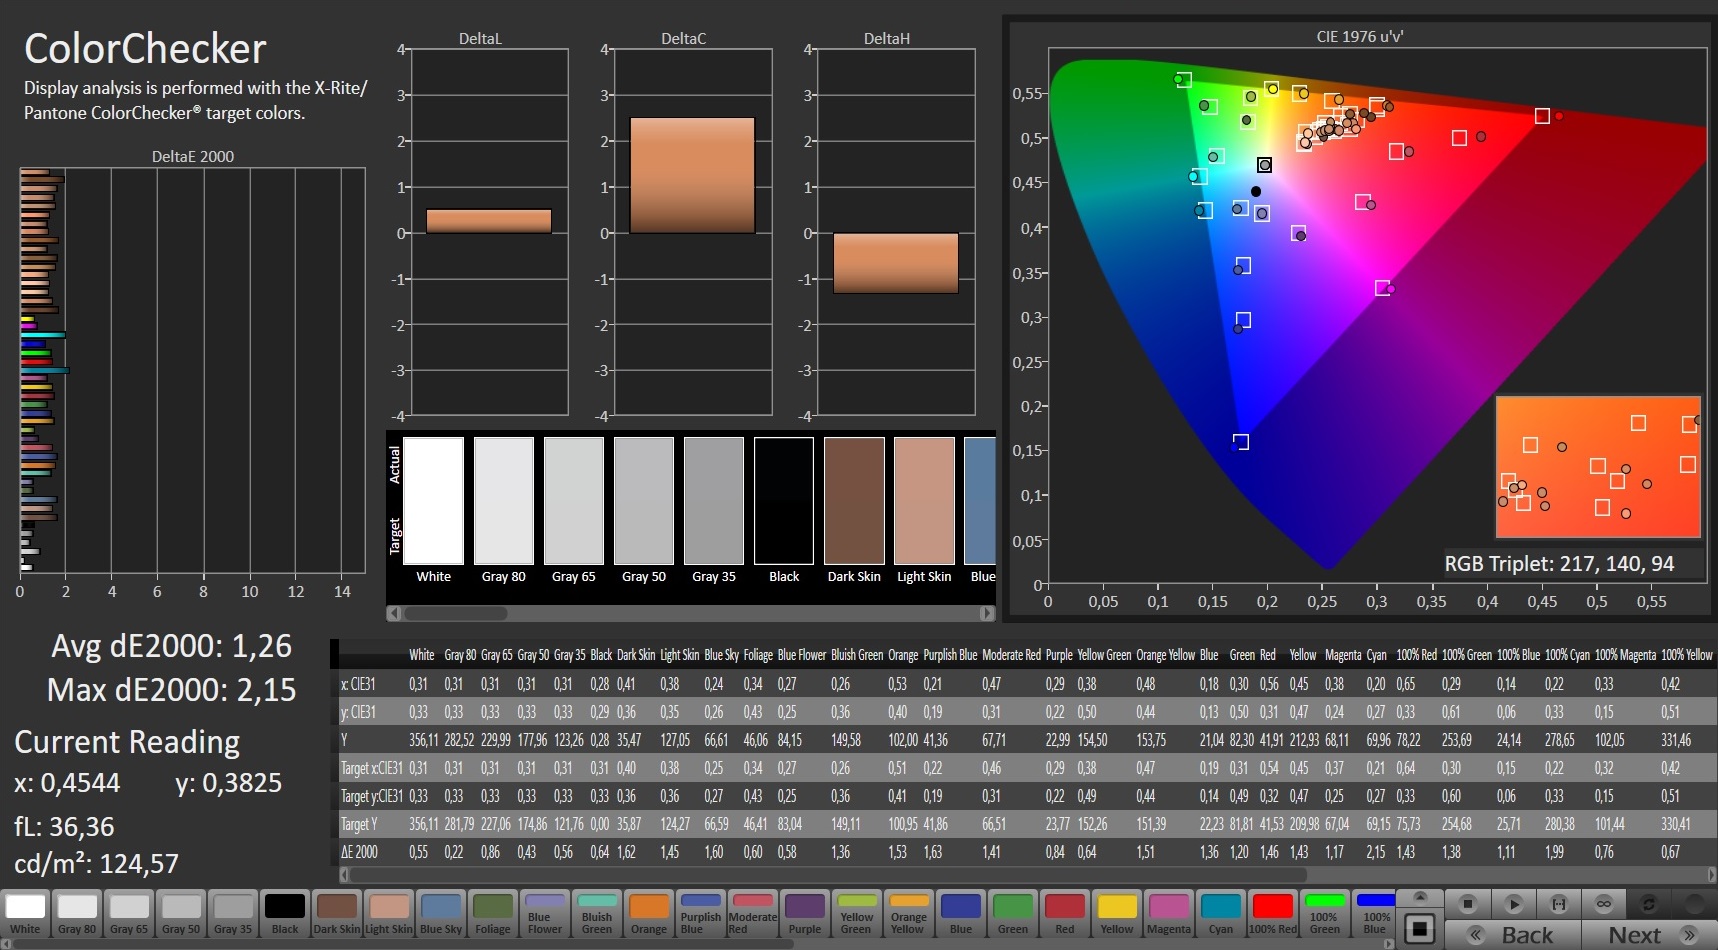
The 16-inch screen also leaves a convincing impression in the rest of the measurements. The relatively low black value (0.3 cd/m²) and the acceptable brightness (341 cd/m² on average) result in a contrast of about 1200:1. Together with the relatively good color reproduction in the state of delivery, this ensures a vibrant and differentiated display image.
Another positive point is the fact that we did not see any display flickering in our test unit due to PWM or anything similar.
Display Response Times
| ↔ Response Time Black to White | ||
|---|---|---|
| 14.4 ms ... rise ↗ and fall ↘ combined | ↗ 8.4 ms rise | 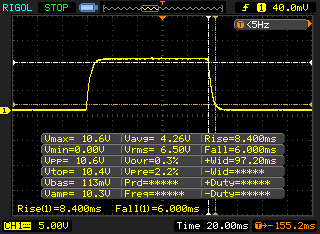 |
| ↘ 6 ms fall | ||
| The screen shows good response rates in our tests, but may be too slow for competitive gamers. In comparison, all tested devices range from 0.1 (minimum) to 240 (maximum) ms. » 35 % of all devices are better. This means that the measured response time is better than the average of all tested devices (19.9 ms). | ||
| ↔ Response Time 50% Grey to 80% Grey | ||
| 9.6 ms ... rise ↗ and fall ↘ combined | ↗ 5.2 ms rise | 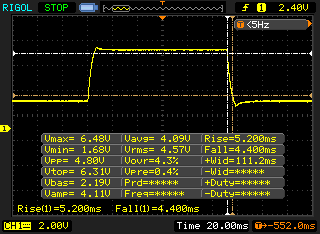 |
| ↘ 4.4 ms fall | ||
| The screen shows fast response rates in our tests and should be suited for gaming. In comparison, all tested devices range from 0.165 (minimum) to 636 (maximum) ms. » 23 % of all devices are better. This means that the measured response time is better than the average of all tested devices (31.1 ms). | ||
Screen Flickering / PWM (Pulse-Width Modulation)
| Screen flickering / PWM not detected |  | ||
In comparison: 52 % of all tested devices do not use PWM to dim the display. If PWM was detected, an average of 7810 (minimum: 5 - maximum: 343500) Hz was measured. | |||
Test Conditions
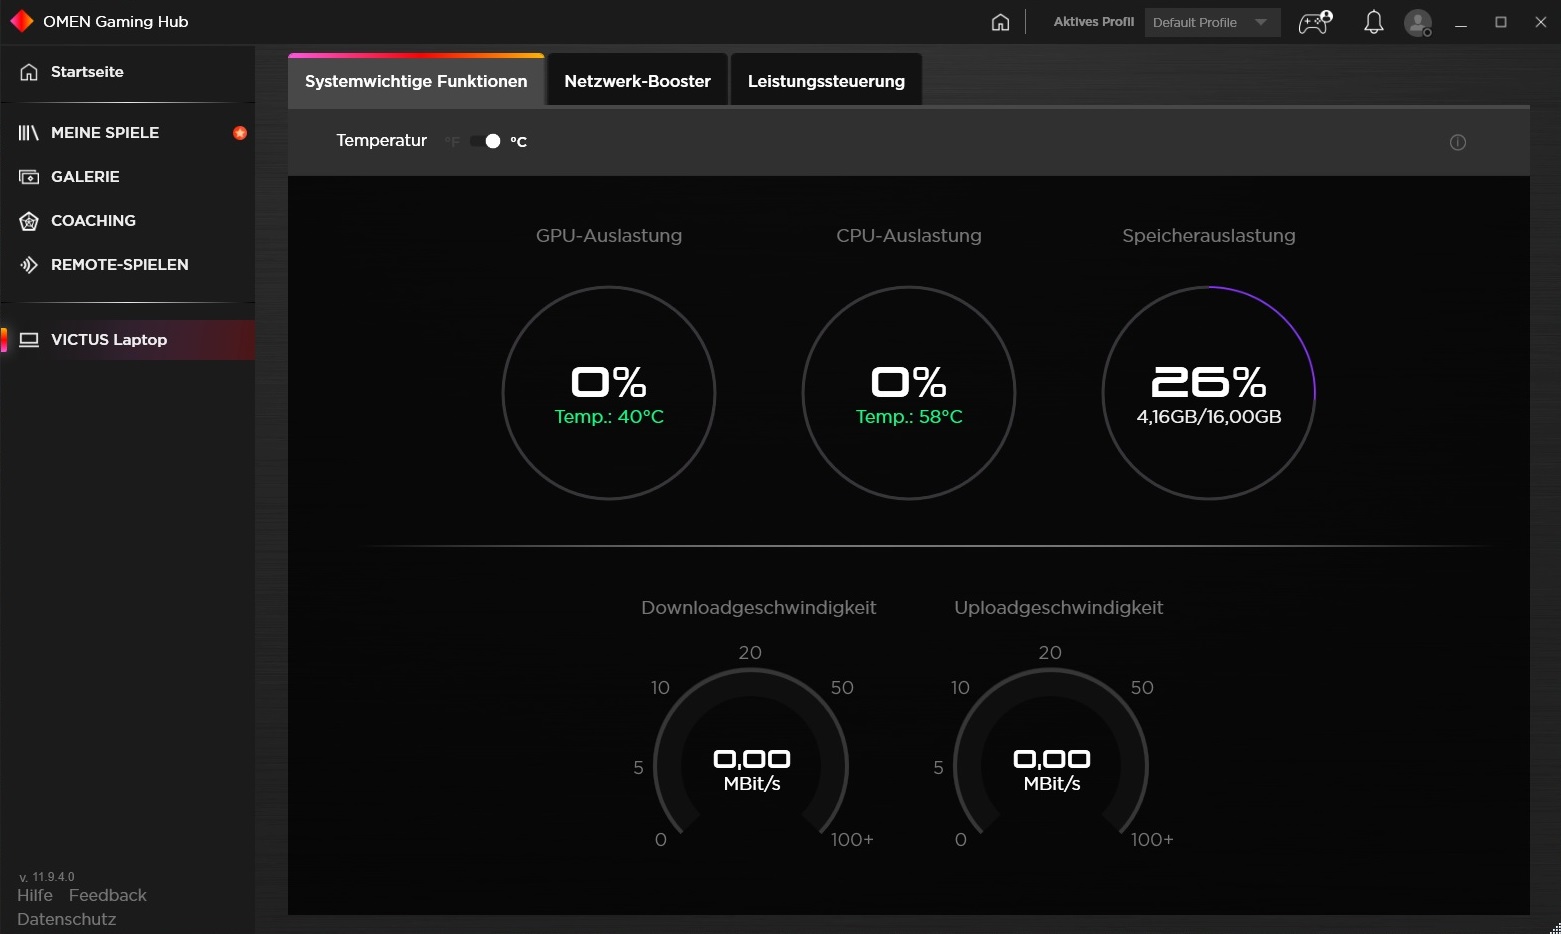
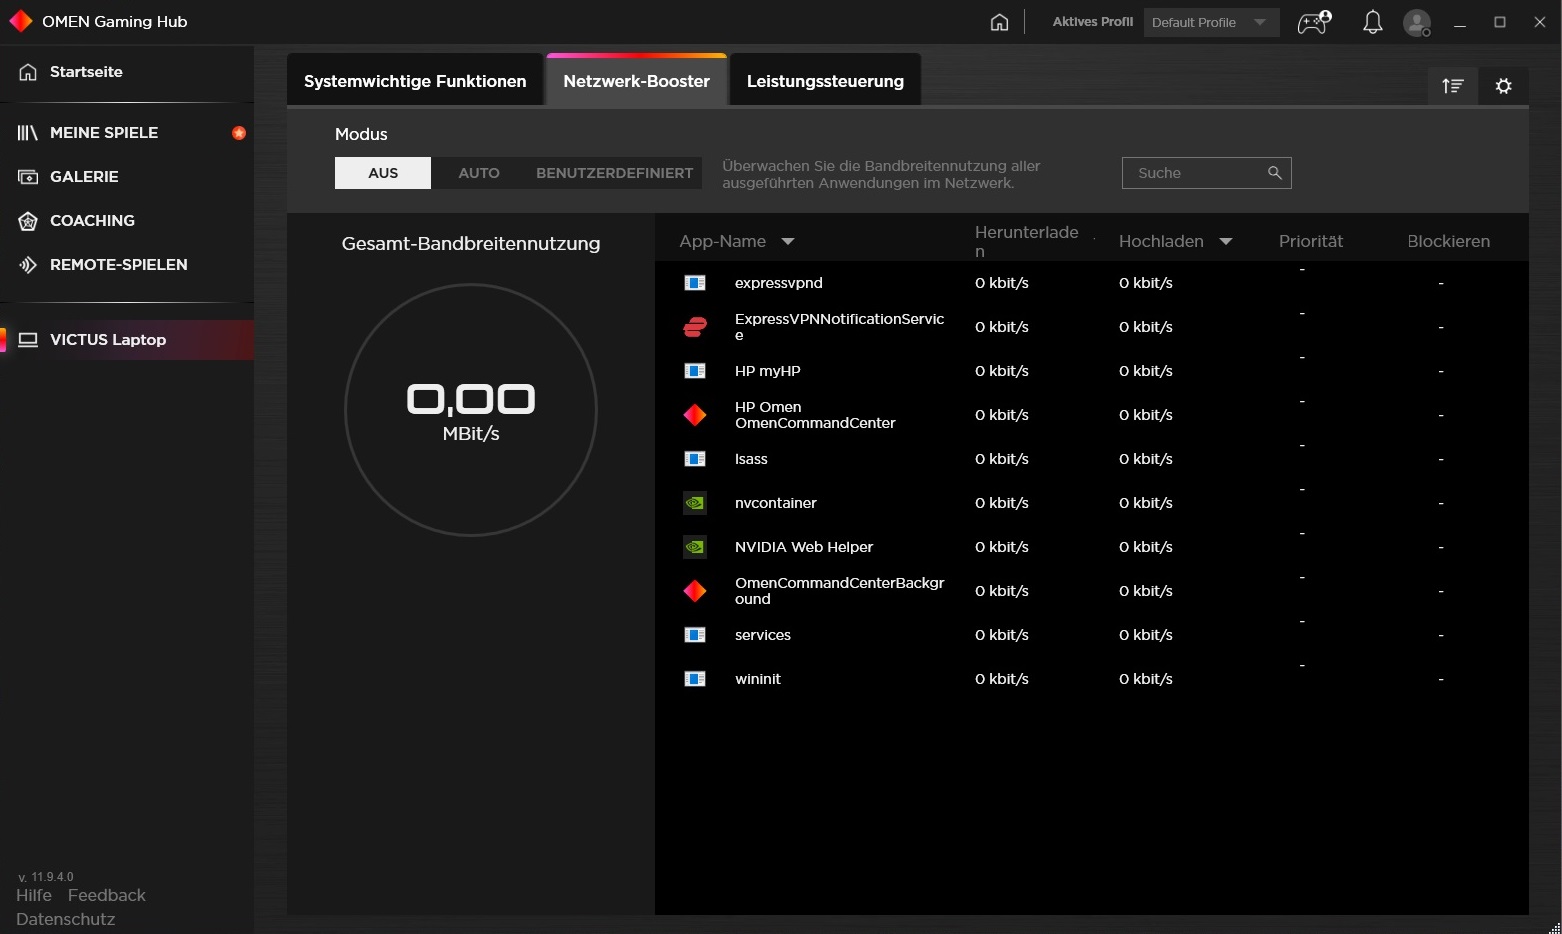
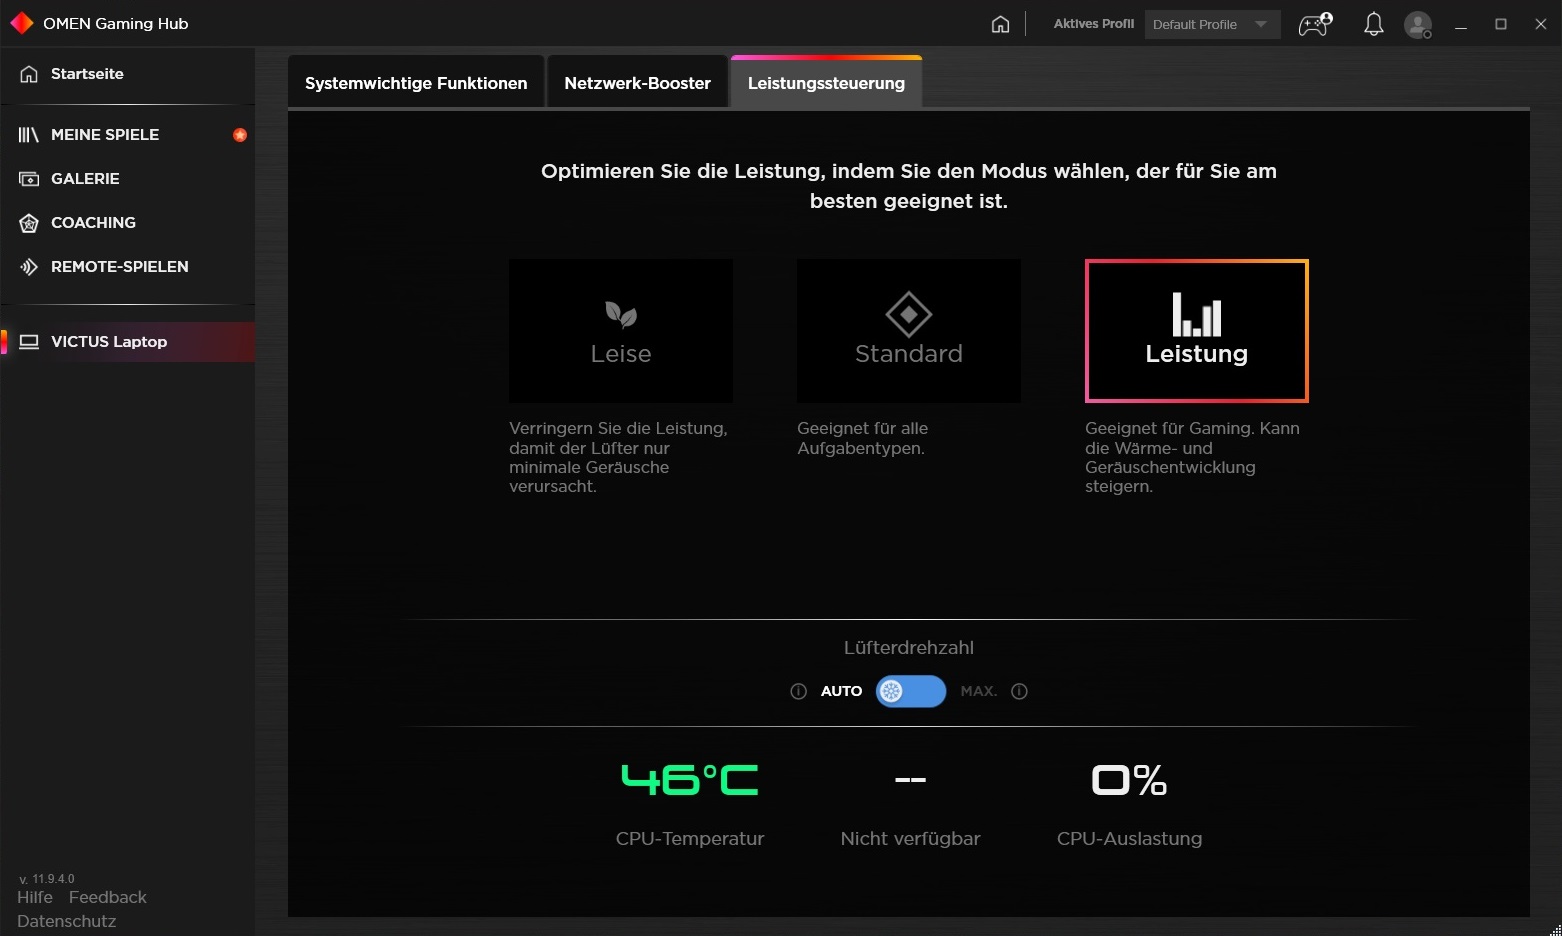
Those who like to finetune the performance should be pleased about the Omen Gaming Hub. The "Victus Laptop" menu offers tabs for system monitoring (temperature, load, …), a network booster, and performance control. In the latter, we selected the "Performance" mode with the automatic fan speed for our measurements.
Performance
Considering the GeForce RTX 3060, the Victus 16-e0179ng should be settled in the lower high-end range, even though 6 GB of VRAM are not state-of-the-art at this point anymore. 16 GB of RAM and a 1-TB SSD should satisfy most buyers and be sufficient for the next few years. The same goes for the octa-core processor from AMD.

Processor
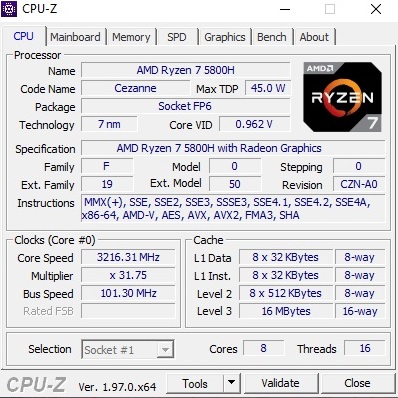
The Ryzen 7 5800H is considered the absolute top in the laptop segment. The octa-core model on 7-nm basis that contains 16 MB L3 cache and is able to work on 16 threads in parallel via SMT does not have to hide behind the Intel competitors. The opposite is the case, in fact.
As our Cinebench R15 loop shows, the 5800H performs at the level of the Core i7-11800H, which is also specified at 45 watts TDP. However, newer benchmarks such as Cinebench R23 reveal that the processor in the Victus 16 is unable to develop its full potential. In other devices, the AMD CPU achieves a performance that is various percentage points higher. The basic clock speed of the 5800H is also 3.2 GHz. Under load, up to 4.4 GHz are possible due to the automatic Turbo.
Cinebench R15 Multi Constant Load Test
* ... smaller is better
System Performance
In the PCMark 10 system test, the Victus ends up next to last. However, the differences turn out relatively small and should be hardly noticeable in practical operation. Subjectively, the operating system responds as quickly as we expect from a current gaming laptop.
| PCMark 10 / Score | |
| Average of class Gaming (5828 - 11574, n=95, last 2 years) | |
| Asus TUF Gaming F15 FX506HM | |
| Average AMD Ryzen 7 5800H, NVIDIA GeForce RTX 3060 Laptop GPU (6465 - 6855, n=6) | |
| Lenovo Legion 5 15ACH-82JU00C6GE-FL | |
| HP Victus 16-e0179ng | |
| Alienware m15 R5 Ryzen Edition | |
| PCMark 10 / Essentials | |
| Average of class Gaming (8810 - 12600, n=99, last 2 years) | |
| Asus TUF Gaming F15 FX506HM | |
| Lenovo Legion 5 15ACH-82JU00C6GE-FL | |
| Average AMD Ryzen 7 5800H, NVIDIA GeForce RTX 3060 Laptop GPU (9589 - 10414, n=6) | |
| HP Victus 16-e0179ng | |
| Alienware m15 R5 Ryzen Edition | |
| PCMark 10 / Productivity | |
| Average of class Gaming (6845 - 18766, n=97, last 2 years) | |
| Lenovo Legion 5 15ACH-82JU00C6GE-FL | |
| Average AMD Ryzen 7 5800H, NVIDIA GeForce RTX 3060 Laptop GPU (8798 - 9728, n=6) | |
| HP Victus 16-e0179ng | |
| Alienware m15 R5 Ryzen Edition | |
| Asus TUF Gaming F15 FX506HM | |
| PCMark 10 / Digital Content Creation | |
| Average of class Gaming (7602 - 19657, n=97, last 2 years) | |
| Asus TUF Gaming F15 FX506HM | |
| Average AMD Ryzen 7 5800H, NVIDIA GeForce RTX 3060 Laptop GPU (7884 - 9497, n=6) | |
| HP Victus 16-e0179ng | |
| Alienware m15 R5 Ryzen Edition | |
| Lenovo Legion 5 15ACH-82JU00C6GE-FL | |
| PCMark 10 Score | 6567 points | |
Help | ||
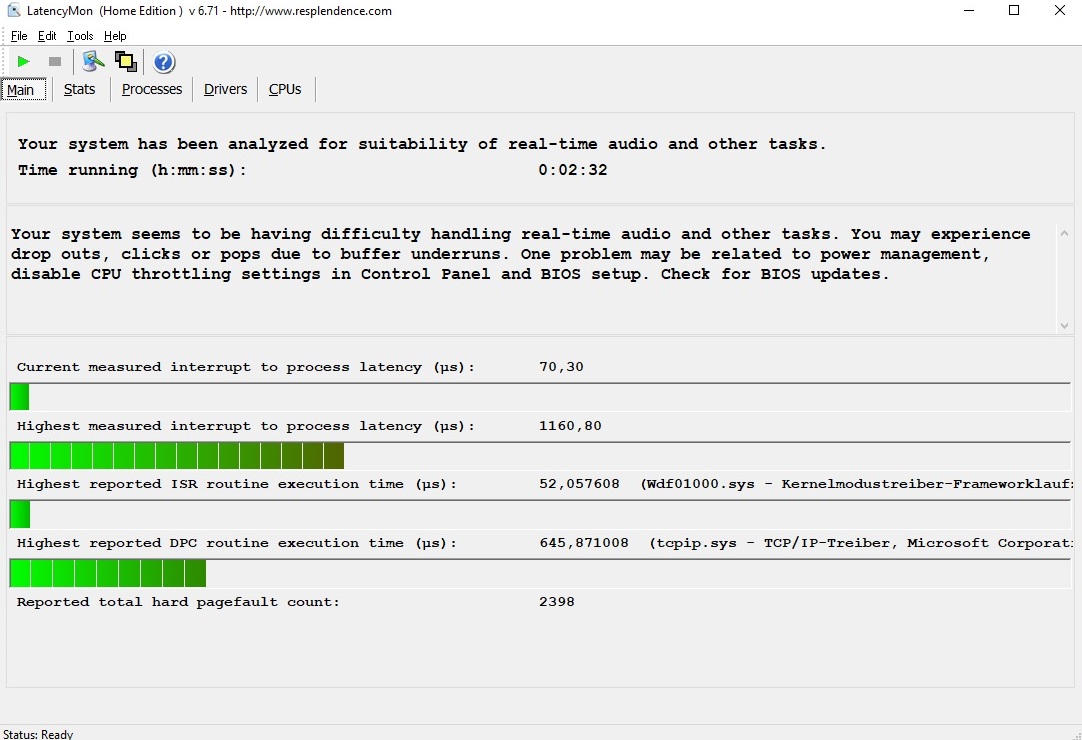
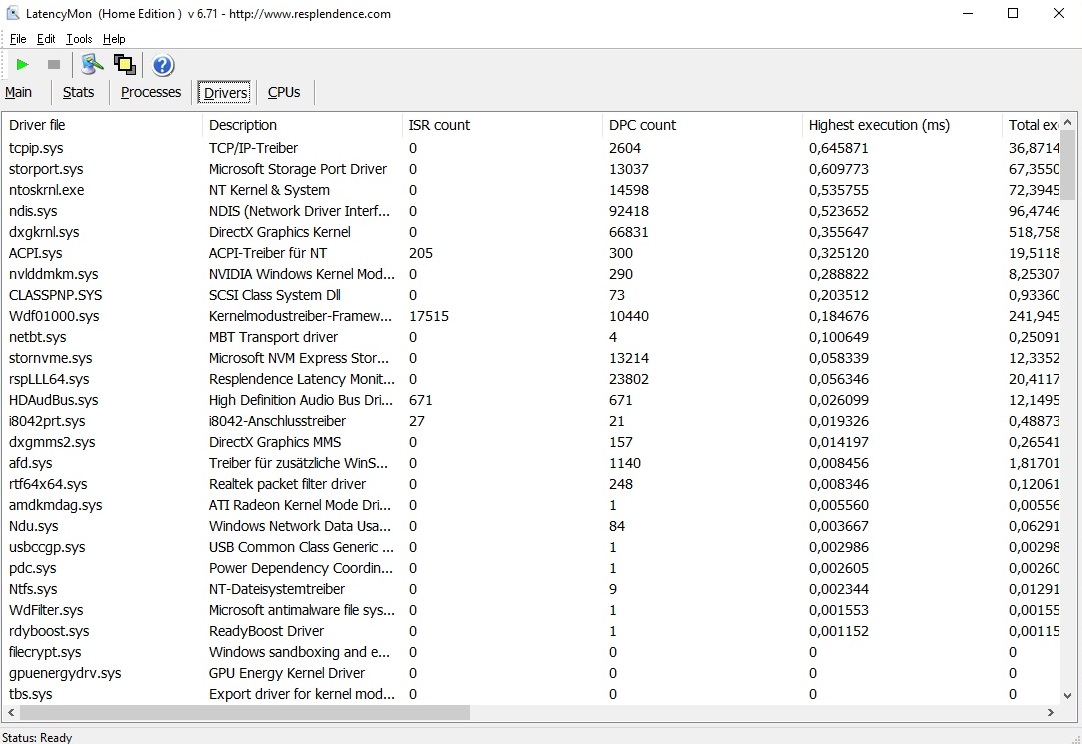
DPC Latencies
There is some room for optimization in the latencies. The LatencyMon tool reports that the Victus 16 has some problems with real-time processing of audio and/or video content in the state of delivery. However, most users should not notice this problem.
| DPC Latencies / LatencyMon - interrupt to process latency (max), Web, Youtube, Prime95 | |
| Asus TUF Gaming F15 FX506HM | |
| HP Victus 16-e0179ng | |
| Lenovo Legion 5 15ACH-82JU00C6GE-FL | |
| Alienware m15 R5 Ryzen Edition | |
* ... smaller is better
Storage Solution
As the storage solution, HP uses an NVMe drive from Western Digital in our test unit. The 1-TB version of the WDC PC SN730 races past most of the SSDs of the competitors that use Micron, Toshiba, or SK Hynix SSDs, particularly in the AS SSD benchmark. It is also very useful that those who want to expand the storage will find an empty M.2 slot under the hood.
| HP Victus 16-e0179ng WDC PC SN730 SDBPNTY-1T00 | Lenovo Legion 5 15ACH-82JU00C6GE-FL Micron 2300 512GB MTFDHBA512TDV | Alienware m15 R5 Ryzen Edition Toshiba KBG40ZNS512G NVMe | Asus TUF Gaming F15 FX506HM SK Hynix HFM001TD3JX013N | |
|---|---|---|---|---|
| CrystalDiskMark 5.2 / 6 | 4% | -22% | 3% | |
| Write 4K (MB/s) | 157.3 | 124.6 -21% | 116.9 -26% | 168.1 7% |
| Read 4K (MB/s) | 49 | 54.2 11% | 44.56 -9% | 65.1 33% |
| Write Seq (MB/s) | 2983 | 2706 -9% | 1552 -48% | 2124 -29% |
| Read Seq (MB/s) | 2247 | 2298 2% | 1682 -25% | 2204 -2% |
| Write 4K Q32T1 (MB/s) | 395 | 499.7 27% | 497.8 26% | 455.3 15% |
| Read 4K Q32T1 (MB/s) | 557 | 570 2% | 436.8 -22% | 465.6 -16% |
| Write Seq Q32T1 (MB/s) | 3094 | 2999 -3% | 1461 -53% | 2911 -6% |
| Read Seq Q32T1 (MB/s) | 2871 | 3461 21% | 2364 -18% | 3519 23% |
| AS SSD | -27% | -80% | -13% | |
| Seq Read (MB/s) | 2383 | 2960 24% | 2082 -13% | 2873 21% |
| Seq Write (MB/s) | 2466 | 2586 5% | 825 -67% | 1619 -34% |
| 4K Read (MB/s) | 44.14 | 46.84 6% | 42.41 -4% | 57.5 30% |
| 4K Write (MB/s) | 117.5 | 96.1 -18% | 98.3 -16% | 149.6 27% |
| 4K-64 Read (MB/s) | 1734 | 854 -51% | 1255 -28% | 1252 -28% |
| 4K-64 Write (MB/s) | 2088 | 2015 -3% | 738 -65% | 2196 5% |
| Access Time Read * (ms) | 0.049 | 0.048 2% | 0.109 -122% | 0.04 18% |
| Access Time Write * (ms) | 0.032 | 0.094 -194% | 0.17 -431% | 0.082 -156% |
| Score Read (Points) | 2017 | 1197 -41% | 1506 -25% | 1597 -21% |
| Score Write (Points) | 2452 | 2370 -3% | 918 -63% | 2508 2% |
| Score Total (Points) | 5503 | 4170 -24% | 3136 -43% | 4869 -12% |
| Total Average (Program / Settings) | -12% /
-14% | -51% /
-55% | -5% /
-6% |
* ... smaller is better

Constant Performance Reading: DiskSpd Read Loop, Queue Depth 8
Graphics Card
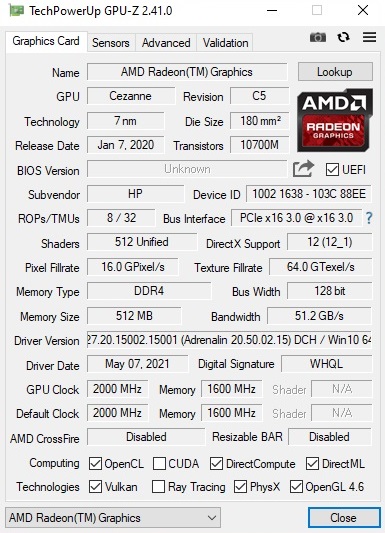
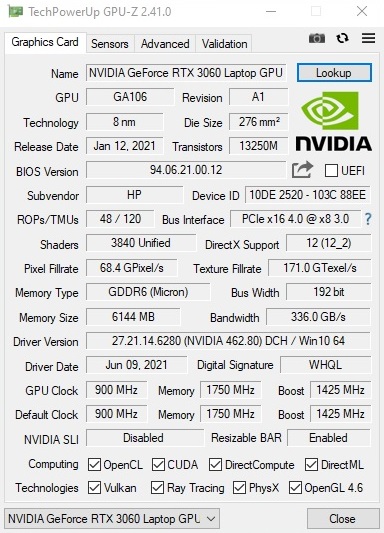
In contrast to the GeForce RTX 3050 (Ti), which due to its meager video storage of only 4 GB does not offer any particular assurance and sense of being future proof, the GeForce RTX 3060 is a good choice for price conscious gamers. The DirectX 12 model from Nvidia's Ampere generation at least has 6 GB of GDDR6 VRAM, which is currently still sufficient.
However, analogous to the CPU performance, the GPU performance of the Victus 16 is also mostly below average compared to the competitors. This is not surprising, since the HP only configured the RTX 3060 with a TGP of 95 watts (including Dynamic Boost). Theoretically, up to 130 watts are possible, as for example Lenovo shows with the Legion 5. That laptop is often more than 10% ahead of the HP device in the synthetic graphics benchmarks and also in the gaming runs.
| 3DMark 11 Performance | 22166 points | |
| 3DMark Cloud Gate Standard Score | 45994 points | |
| 3DMark Fire Strike Score | 17711 points | |
| 3DMark Time Spy Score | 7680 points | |
Help | ||
Gaming Performance
Despite the relatively low TGP, the Victus holds its own with modern games. With the exception of "Crysis Remastered," which uses raytracing at higher levels, all the tested games were run at more than 60 fps even in maximum detail settings. This was the case even for extremely demanding and VRAM hungry games such as the recently introduced "Deathloop."
| The Witcher 3 | |
| 1920x1080 High Graphics & Postprocessing (Nvidia HairWorks Off) | |
| Average of class Gaming (181 - 341, n=3, last 2 years) | |
| Average NVIDIA GeForce RTX 3060 Laptop GPU (81 - 186.8, n=41) | |
| Asus TUF Gaming F15 FX506HM | |
| Alienware m15 R5 Ryzen Edition | |
| HP Victus 16-e0179ng | |
| 1920x1080 Ultra Graphics & Postprocessing (HBAO+) | |
| Average of class Gaming (95 - 240, n=8, last 2 years) | |
| Average NVIDIA GeForce RTX 3060 Laptop GPU (58.2 - 91.5, n=48) | |
| Alienware m15 R5 Ryzen Edition | |
| Asus TUF Gaming F15 FX506HM | |
| HP Victus 16-e0179ng | |
Beyond some smaller FPS fluctuations, the constant load test with "The Witcher 3" shows nothing unusual.
The Witcher 3 FPS Chart
| low | med. | high | ultra | |
|---|---|---|---|---|
| GTA V (2015) | 150 | 86.6 | ||
| The Witcher 3 (2015) | 135 | 70.9 | ||
| Dota 2 Reborn (2015) | 149 | 134 | 128 | 121 |
| Final Fantasy XV Benchmark (2018) | 74.9 | |||
| X-Plane 11.11 (2018) | 98.9 | 87.2 | 72.8 | |
| Far Cry 5 (2018) | 109 | 102 | ||
| Strange Brigade (2018) | 146 | 128 | ||
| Hunt Showdown (2020) | 93.3 | |||
| Doom Eternal (2020) | 149 | 145 | ||
| Crysis Remastered (2020) | 60.7 | 43.4 | ||
| Mafia Definitive Edition (2020) | 86.1 | |||
| Star Wars Squadrons (2020) | 178 | 166 | ||
| FIFA 21 (2020) | 194 | 185 | ||
| Outriders (2021) | 100 | 85.3 | ||
| Resident Evil Village (2021) | 129 | 113 | ||
| Mass Effect Legendary Edition (2021) | 109 | |||
| Monster Hunter Stories 2 (2021) | 143 | |||
| Deathloop (2021) | 72.3 | 63.5 |
Emissions
Noise Emissions
During idle operation, the 16-inch laptop strikes a good figure in terms of the noise level. For long stretches, the fans remain turned off, which leads to completely silent operation. However, under load the peace and quiet comes to an end. 44 to 52 dB(A) represent a clearly noticeable noise level that can feel annoyingly loud to some users and recommends the use of headphones. At almost 50 dB(A) during "The Witcher 3," the Victus 16 is more noticeable than the Alienware m15 R5 and Asus TUF F15 but still less loud than the Lenovo Legion 5.
Noise level
| Idle |
| 24 / 25 / 34 dB(A) |
| Load |
| 44 / 52 dB(A) |
 | ||
30 dB silent 40 dB(A) audible 50 dB(A) loud |
||
min: | ||
| HP Victus 16-e0179ng R7 5800H, GeForce RTX 3060 Laptop GPU | Lenovo Legion 5 15ACH-82JU00C6GE-FL R7 5800H, GeForce RTX 3060 Laptop GPU | Alienware m15 R5 Ryzen Edition R7 5800H, GeForce RTX 3060 Laptop GPU | Asus TUF Gaming F15 FX506HM i7-11800H, GeForce RTX 3060 Laptop GPU | Average of class Gaming | |
|---|---|---|---|---|---|
| Noise | -8% | 1% | 10% | -1% | |
| off / environment * (dB) | 24 | 24.2 -1% | 24 -0% | 24.8 -3% | 24.1 ? -0% |
| Idle Minimum * (dB) | 24 | 29 -21% | 24 -0% | 24.6 -3% | 25.8 ? -8% |
| Idle Average * (dB) | 25 | 29 -16% | 25 -0% | 24.9 -0% | 27.4 ? -10% |
| Idle Maximum * (dB) | 34 | 29 15% | 35 -3% | 24.9 27% | 30 ? 12% |
| Load Average * (dB) | 44 | 53.5 -22% | 44 -0% | 27.1 38% | 43.2 ? 2% |
| Witcher 3 ultra * (dB) | 50 | 53.5 -7% | 48 4% | 46.4 7% | |
| Load Maximum * (dB) | 52 | 53.5 -3% | 50 4% | 49 6% | 54 ? -4% |
* ... smaller is better
Temperature
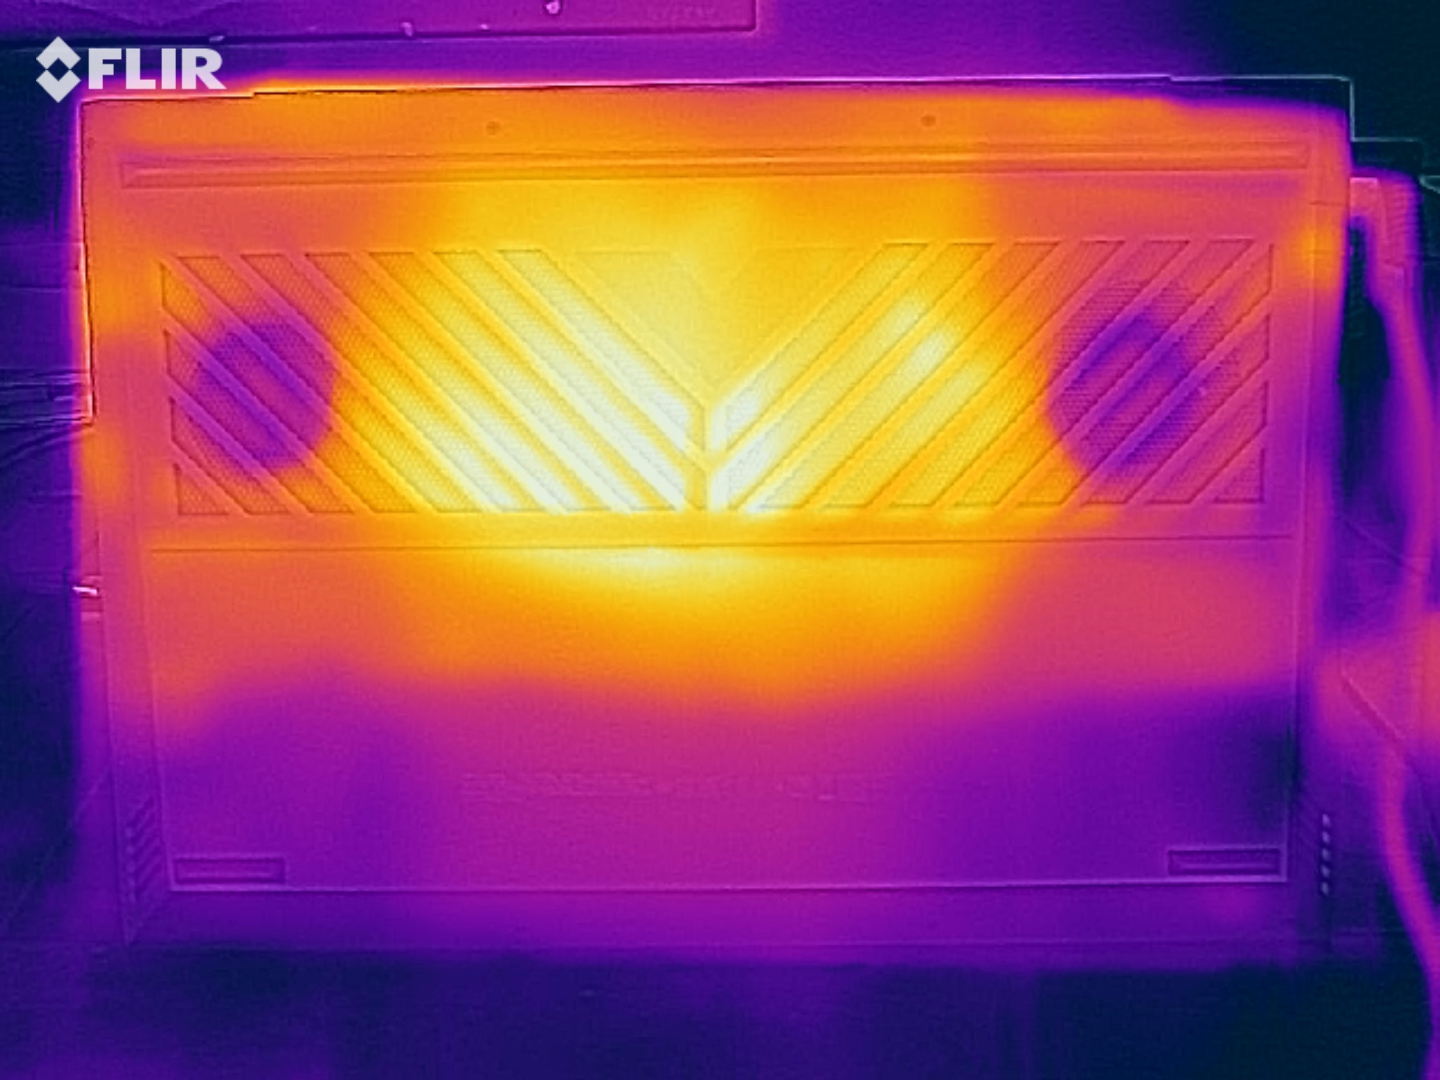
The temperature development already turns out quite high during idle operation. According to our measurement, the top of the base reaches a temperature above 40 °C (104 °F) in the central area and towards the back. During 3D operation, the case even surpasses the 50-°C mark (122 °F), which speaks against gaming sessions with the device on your lap. The palm rest always remains fairy cool, though.
The components also work up quite a sweat. The CPU and GPU finish the 60-minute Witcher 3 test at about 82 and 70 °C respectively (180 and 158 °F). While these are medium-high values, they give no reason for concern. During the stress test (FurMark + Prime95), the Ryzen 7 5800H gets even hotter at almost 90 °C (194 °F). On the other hand, the temperature of the GeForce RTX 3060 hardly increases.
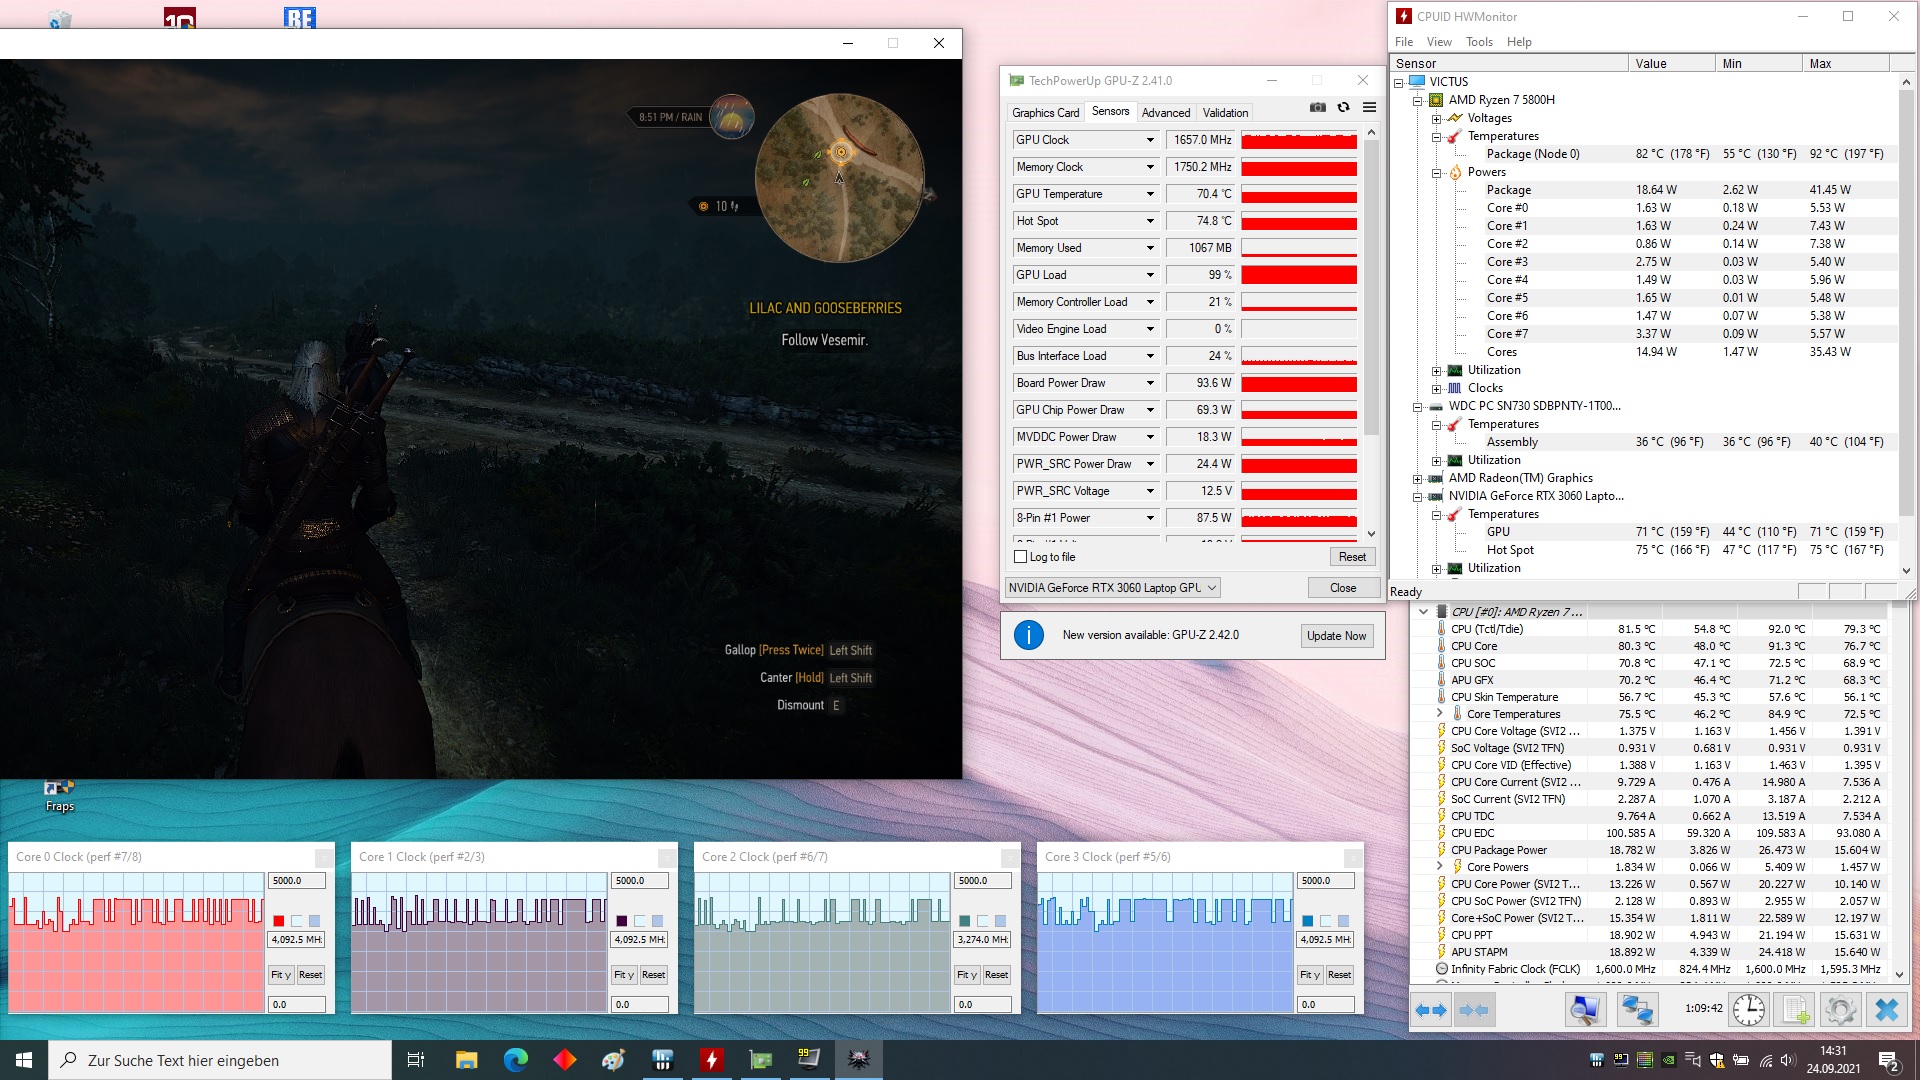
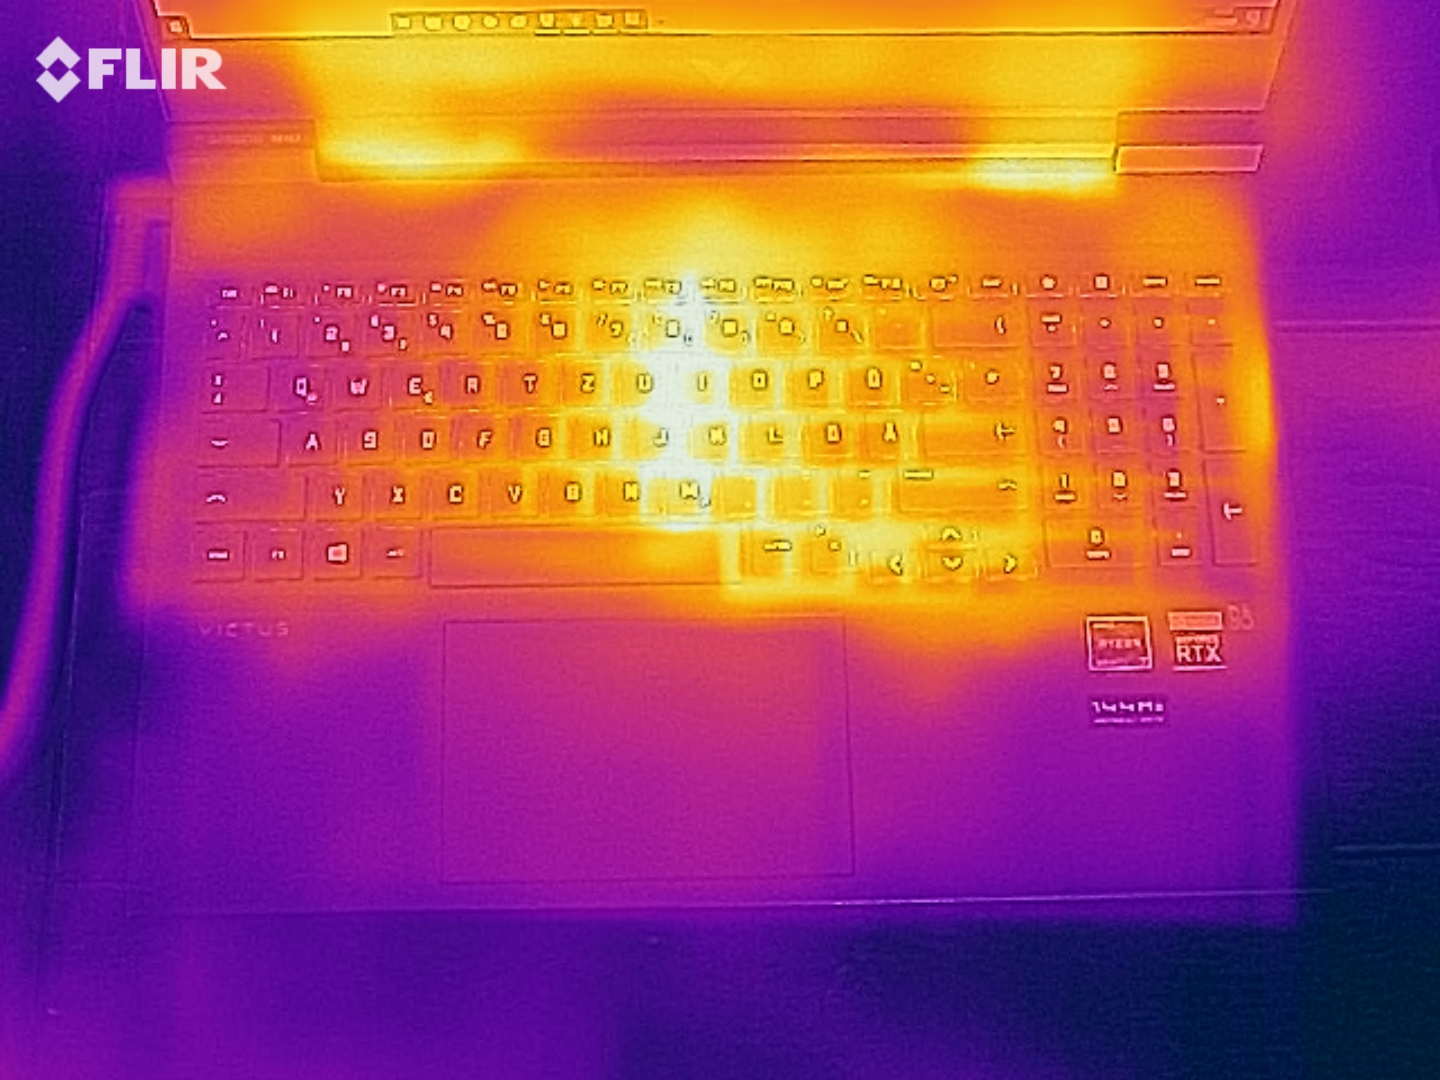

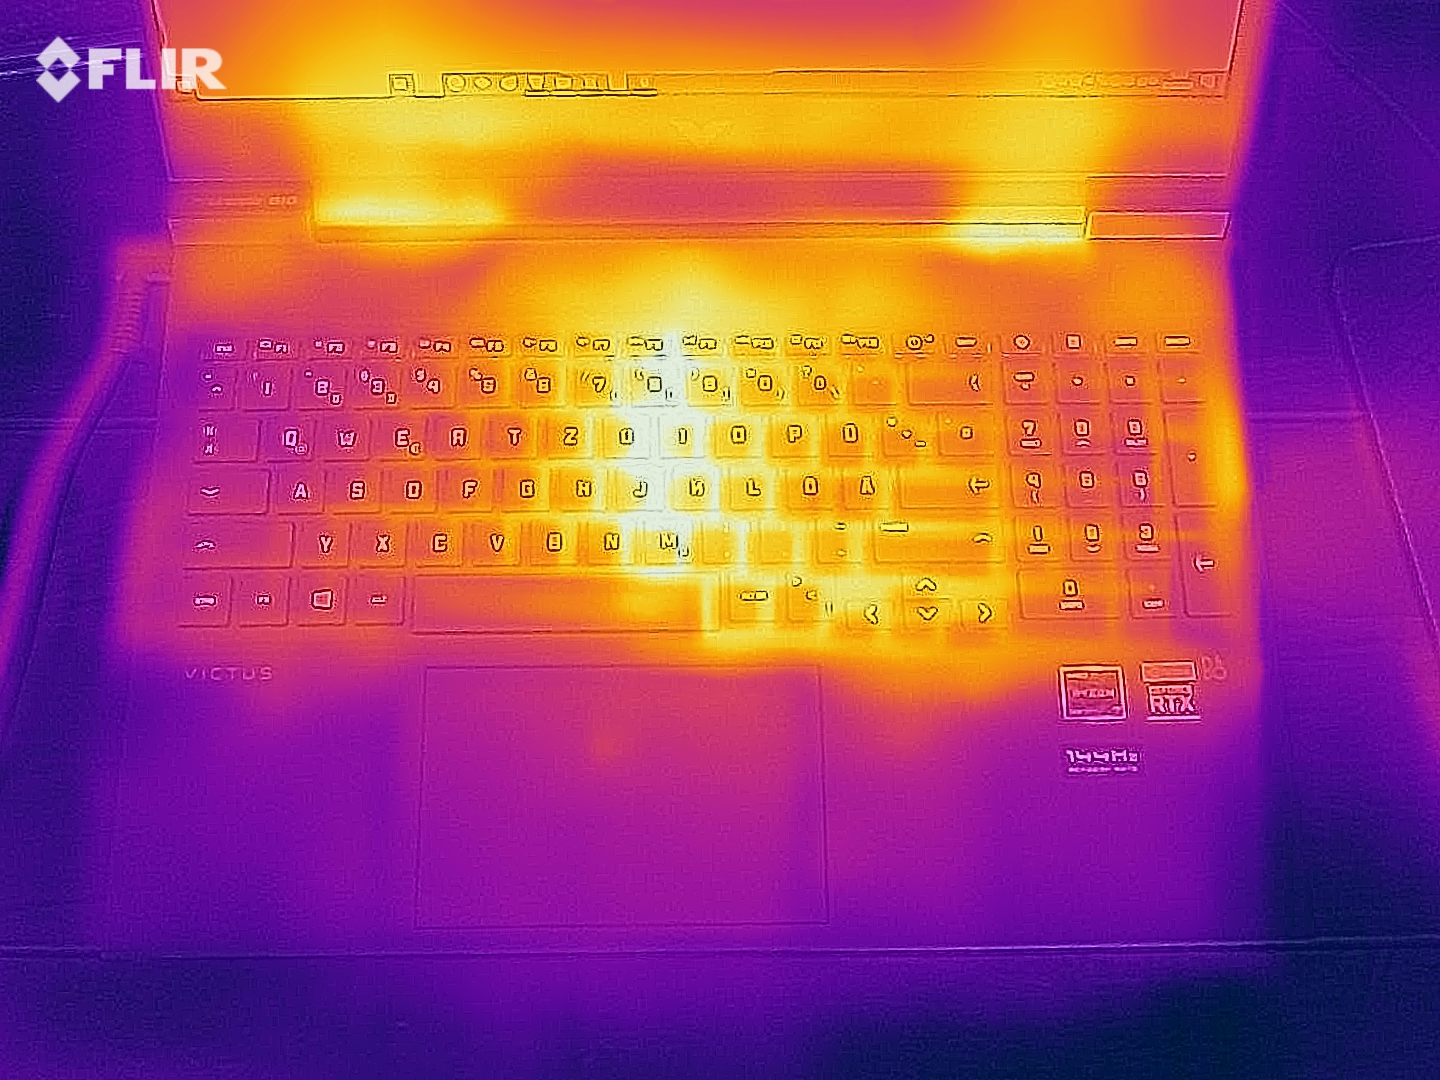
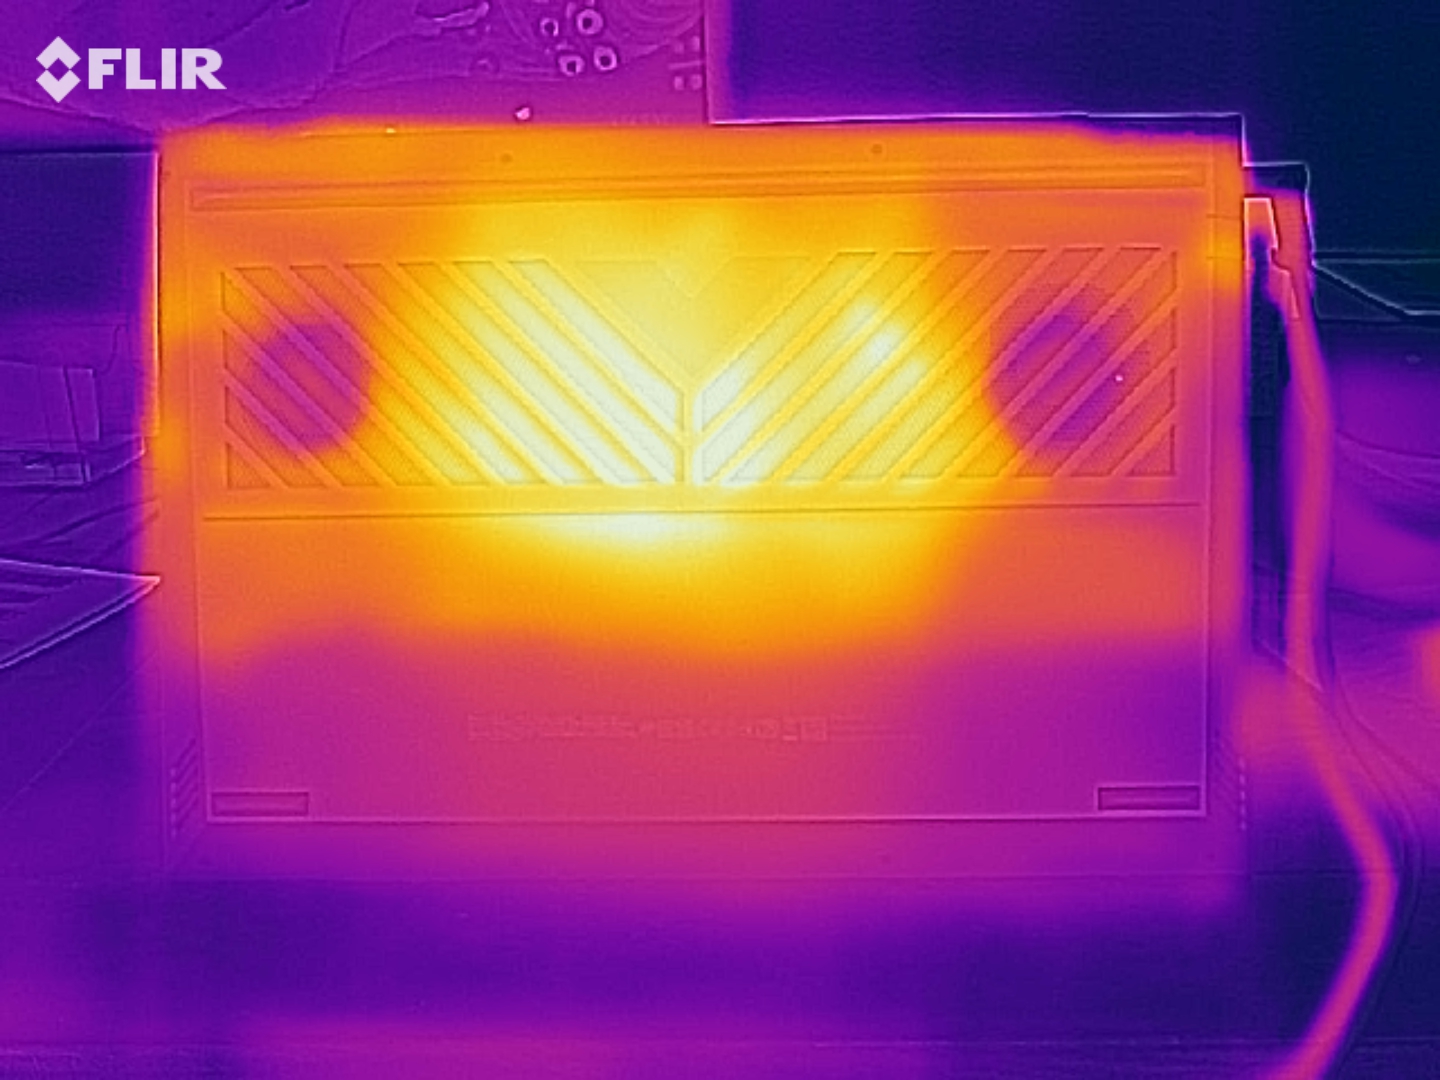
(-) The maximum temperature on the upper side is 51 °C / 124 F, compared to the average of 40.4 °C / 105 F, ranging from 21.2 to 68.8 °C for the class Gaming.
(-) The bottom heats up to a maximum of 52 °C / 126 F, compared to the average of 43.2 °C / 110 F
(±) In idle usage, the average temperature for the upper side is 34.7 °C / 94 F, compared to the device average of 33.9 °C / 93 F.
(-) Playing The Witcher 3, the average temperature for the upper side is 40.1 °C / 104 F, compared to the device average of 33.9 °C / 93 F.
(±) The palmrests and touchpad can get very hot to the touch with a maximum of 39 °C / 102.2 F.
(-) The average temperature of the palmrest area of similar devices was 28.8 °C / 83.8 F (-10.2 °C / -18.4 F).
| HP Victus 16-e0179ng R7 5800H, GeForce RTX 3060 Laptop GPU | Lenovo Legion 5 15ACH-82JU00C6GE-FL R7 5800H, GeForce RTX 3060 Laptop GPU | Alienware m15 R5 Ryzen Edition R7 5800H, GeForce RTX 3060 Laptop GPU | Asus TUF Gaming F15 FX506HM i7-11800H, GeForce RTX 3060 Laptop GPU | Average of class Gaming | |
|---|---|---|---|---|---|
| Heat | 25% | 1% | 25% | 17% | |
| Maximum Upper Side * (°C) | 51 | 42.6 16% | 62 -22% | 46.4 9% | 45.3 ? 11% |
| Maximum Bottom * (°C) | 52 | 52.2 -0% | 61 -17% | 45.4 13% | 48.2 ? 7% |
| Idle Upper Side * (°C) | 46 | 24.9 46% | 36 22% | 26 43% | 31.2 ? 32% |
| Idle Bottom * (°C) | 41 | 25.3 38% | 33 20% | 27.4 33% | 34.4 ? 16% |
* ... smaller is better
Speaker
Our audio analysis attests the Victus 16 with a decent sound in the middle of the field. According to the current measurements, 40% of all the competing devices offer a better sound and 54% a worse one, with 6% being comparable. As usual, especially the bass is lacking. The Asus TUF F15 competitor, for example, is ahead here.
HP Victus 16-e0179ng audio analysis
(±) | speaker loudness is average but good (78 dB)
Bass 100 - 315 Hz
(-) | nearly no bass - on average 20.4% lower than median
(±) | linearity of bass is average (13.6% delta to prev. frequency)
Mids 400 - 2000 Hz
(+) | balanced mids - only 0.9% away from median
(+) | mids are linear (2.4% delta to prev. frequency)
Highs 2 - 16 kHz
(±) | higher highs - on average 5.5% higher than median
(+) | highs are linear (5.1% delta to prev. frequency)
Overall 100 - 16.000 Hz
(±) | linearity of overall sound is average (17.5% difference to median)
Compared to same class
» 49% of all tested devices in this class were better, 12% similar, 40% worse
» The best had a delta of 6%, average was 18%, worst was 132%
Compared to all devices tested
» 34% of all tested devices were better, 8% similar, 58% worse
» The best had a delta of 4%, average was 24%, worst was 134%
Asus TUF Gaming F15 FX506HM audio analysis
(±) | speaker loudness is average but good (77.1 dB)
Bass 100 - 315 Hz
(±) | reduced bass - on average 13.8% lower than median
(±) | linearity of bass is average (7.9% delta to prev. frequency)
Mids 400 - 2000 Hz
(+) | balanced mids - only 2.9% away from median
(+) | mids are linear (5.9% delta to prev. frequency)
Highs 2 - 16 kHz
(+) | balanced highs - only 1.8% away from median
(+) | highs are linear (2.7% delta to prev. frequency)
Overall 100 - 16.000 Hz
(+) | overall sound is linear (13.1% difference to median)
Compared to same class
» 18% of all tested devices in this class were better, 4% similar, 78% worse
» The best had a delta of 6%, average was 18%, worst was 132%
Compared to all devices tested
» 13% of all tested devices were better, 3% similar, 84% worse
» The best had a delta of 4%, average was 24%, worst was 134%
Power Management
Power Consumption
Most of the time, the power consumption is lower than that of the competitors. 5 to 20 watts during idle operation and 108 to 189 watts under load indicate a good battery life.
| Off / Standby | |
| Idle | |
| Load |
|
Key:
min: | |
| HP Victus 16-e0179ng R7 5800H, GeForce RTX 3060 Laptop GPU | Lenovo Legion 5 15ACH-82JU00C6GE-FL R7 5800H, GeForce RTX 3060 Laptop GPU | Alienware m15 R5 Ryzen Edition R7 5800H, GeForce RTX 3060 Laptop GPU | Asus TUF Gaming F15 FX506HM i7-11800H, GeForce RTX 3060 Laptop GPU | Average of class Gaming | |
|---|---|---|---|---|---|
| Power Consumption | -12% | -40% | -19% | -63% | |
| Idle Minimum * (Watt) | 5 | 7.3 -46% | 11 -120% | 9.5 -90% | 13.4 ? -168% |
| Idle Average * (Watt) | 10 | 10.5 -5% | 14 -40% | 12.1 -21% | 19.1 ? -91% |
| Idle Maximum * (Watt) | 20 | 15.7 22% | 25 -25% | 22.5 -13% | 24.7 ? -23% |
| Load Average * (Watt) | 108 | 108 -0% | 123 -14% | 99.5 8% | 108.4 ? -0% |
| Witcher 3 ultra * (Watt) | 145 | 175 -21% | 176 -21% | 157 -8% | |
| Load Maximum * (Watt) | 189 | 228 -21% | 226 -20% | 173.5 8% | 254 ? -34% |
* ... smaller is better
Power Consumption The Witcher 3
Battery Life
At 70 Wh, HP has equipped the Victus 16 with a battery capacity that is neither large nor particularly small. However, the competitors still reach a slightly higher 80 to 90 Wh capacity. Thanks to the moderate power consumption and integrated graphics switching, the 16-inch laptop lasts fairly long away from the charger during less demanding tasks. Almost 6 hours of surfing the Internet with the brightness reduced to about 150 cd/m² are only topped by the TUF F15. The Asus competitor lasted for almost 8 hours in this test.
| HP Victus 16-e0179ng R7 5800H, GeForce RTX 3060 Laptop GPU, 70 Wh | Lenovo Legion 5 15ACH-82JU00C6GE-FL R7 5800H, GeForce RTX 3060 Laptop GPU, 80 Wh | Alienware m15 R5 Ryzen Edition R7 5800H, GeForce RTX 3060 Laptop GPU, 86 Wh | Asus TUF Gaming F15 FX506HM i7-11800H, GeForce RTX 3060 Laptop GPU, 90 Wh | Average of class Gaming | |
|---|---|---|---|---|---|
| Battery runtime | 10% | 9% | 39% | 11% | |
| Reader / Idle (h) | 8.5 | 14.7 73% | 11 29% | 8.71 ? 2% | |
| WiFi v1.3 (h) | 5.9 | 4.8 -19% | 5.1 -14% | 7.9 34% | 6.94 ? 18% |
| Load (h) | 1.3 | 1.8 38% | 0.9 -31% | 2 54% | 1.47 ? 13% |
| H.264 (h) | 4.3 | 8.8 | 8.26 ? | ||
| Witcher 3 ultra (h) | 1.6 |
Pros
Cons
Verdict
If you disregard the slightly high noise level and fairly high temperatures in 3D operation, the HP Victus 16-e0179ng is a relatively successful and balanced gaming laptop.
Not only does the 16-inch laptop offer an interesting case design, but also good input devices and a convincing 144-Hz display. The combination of the Ryzen 7 5800H and GeForce RTX 3060 also runs all the current games smoothly at high to maximum detail levels – at least in the native Full-HD resolution.
Most buyers should also be satisfied with the offered battery life. HP could make some improvements in the connections. At least one USB 3.2 Gen2 port would have been good for the Victus 16. Overall, the 16-inch laptop is at eye level with the similarly-priced RTX 3060 competitors.
Those who are looking for a powerful gaming laptop in the price range between 1000 and 1500 Euros (~$1172-1759) can pick this without almost any hesitation.
Price and Availability
HP Victus 16-e0179ng
- 09/28/2021 v7 (old)
Florian Glaser
Price comparison

