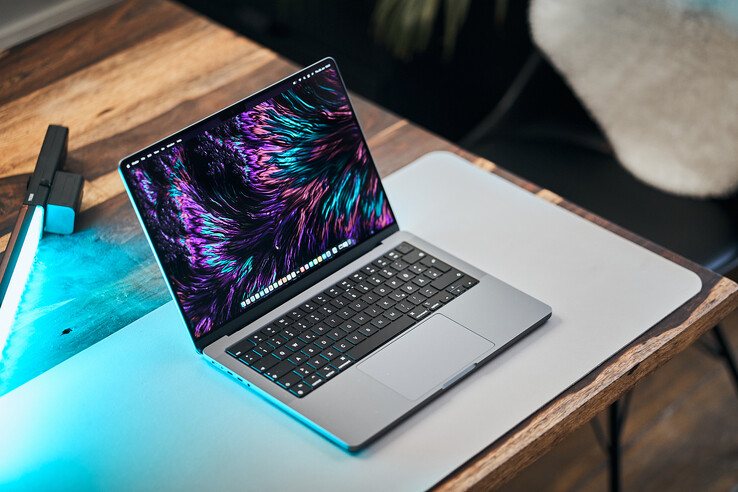
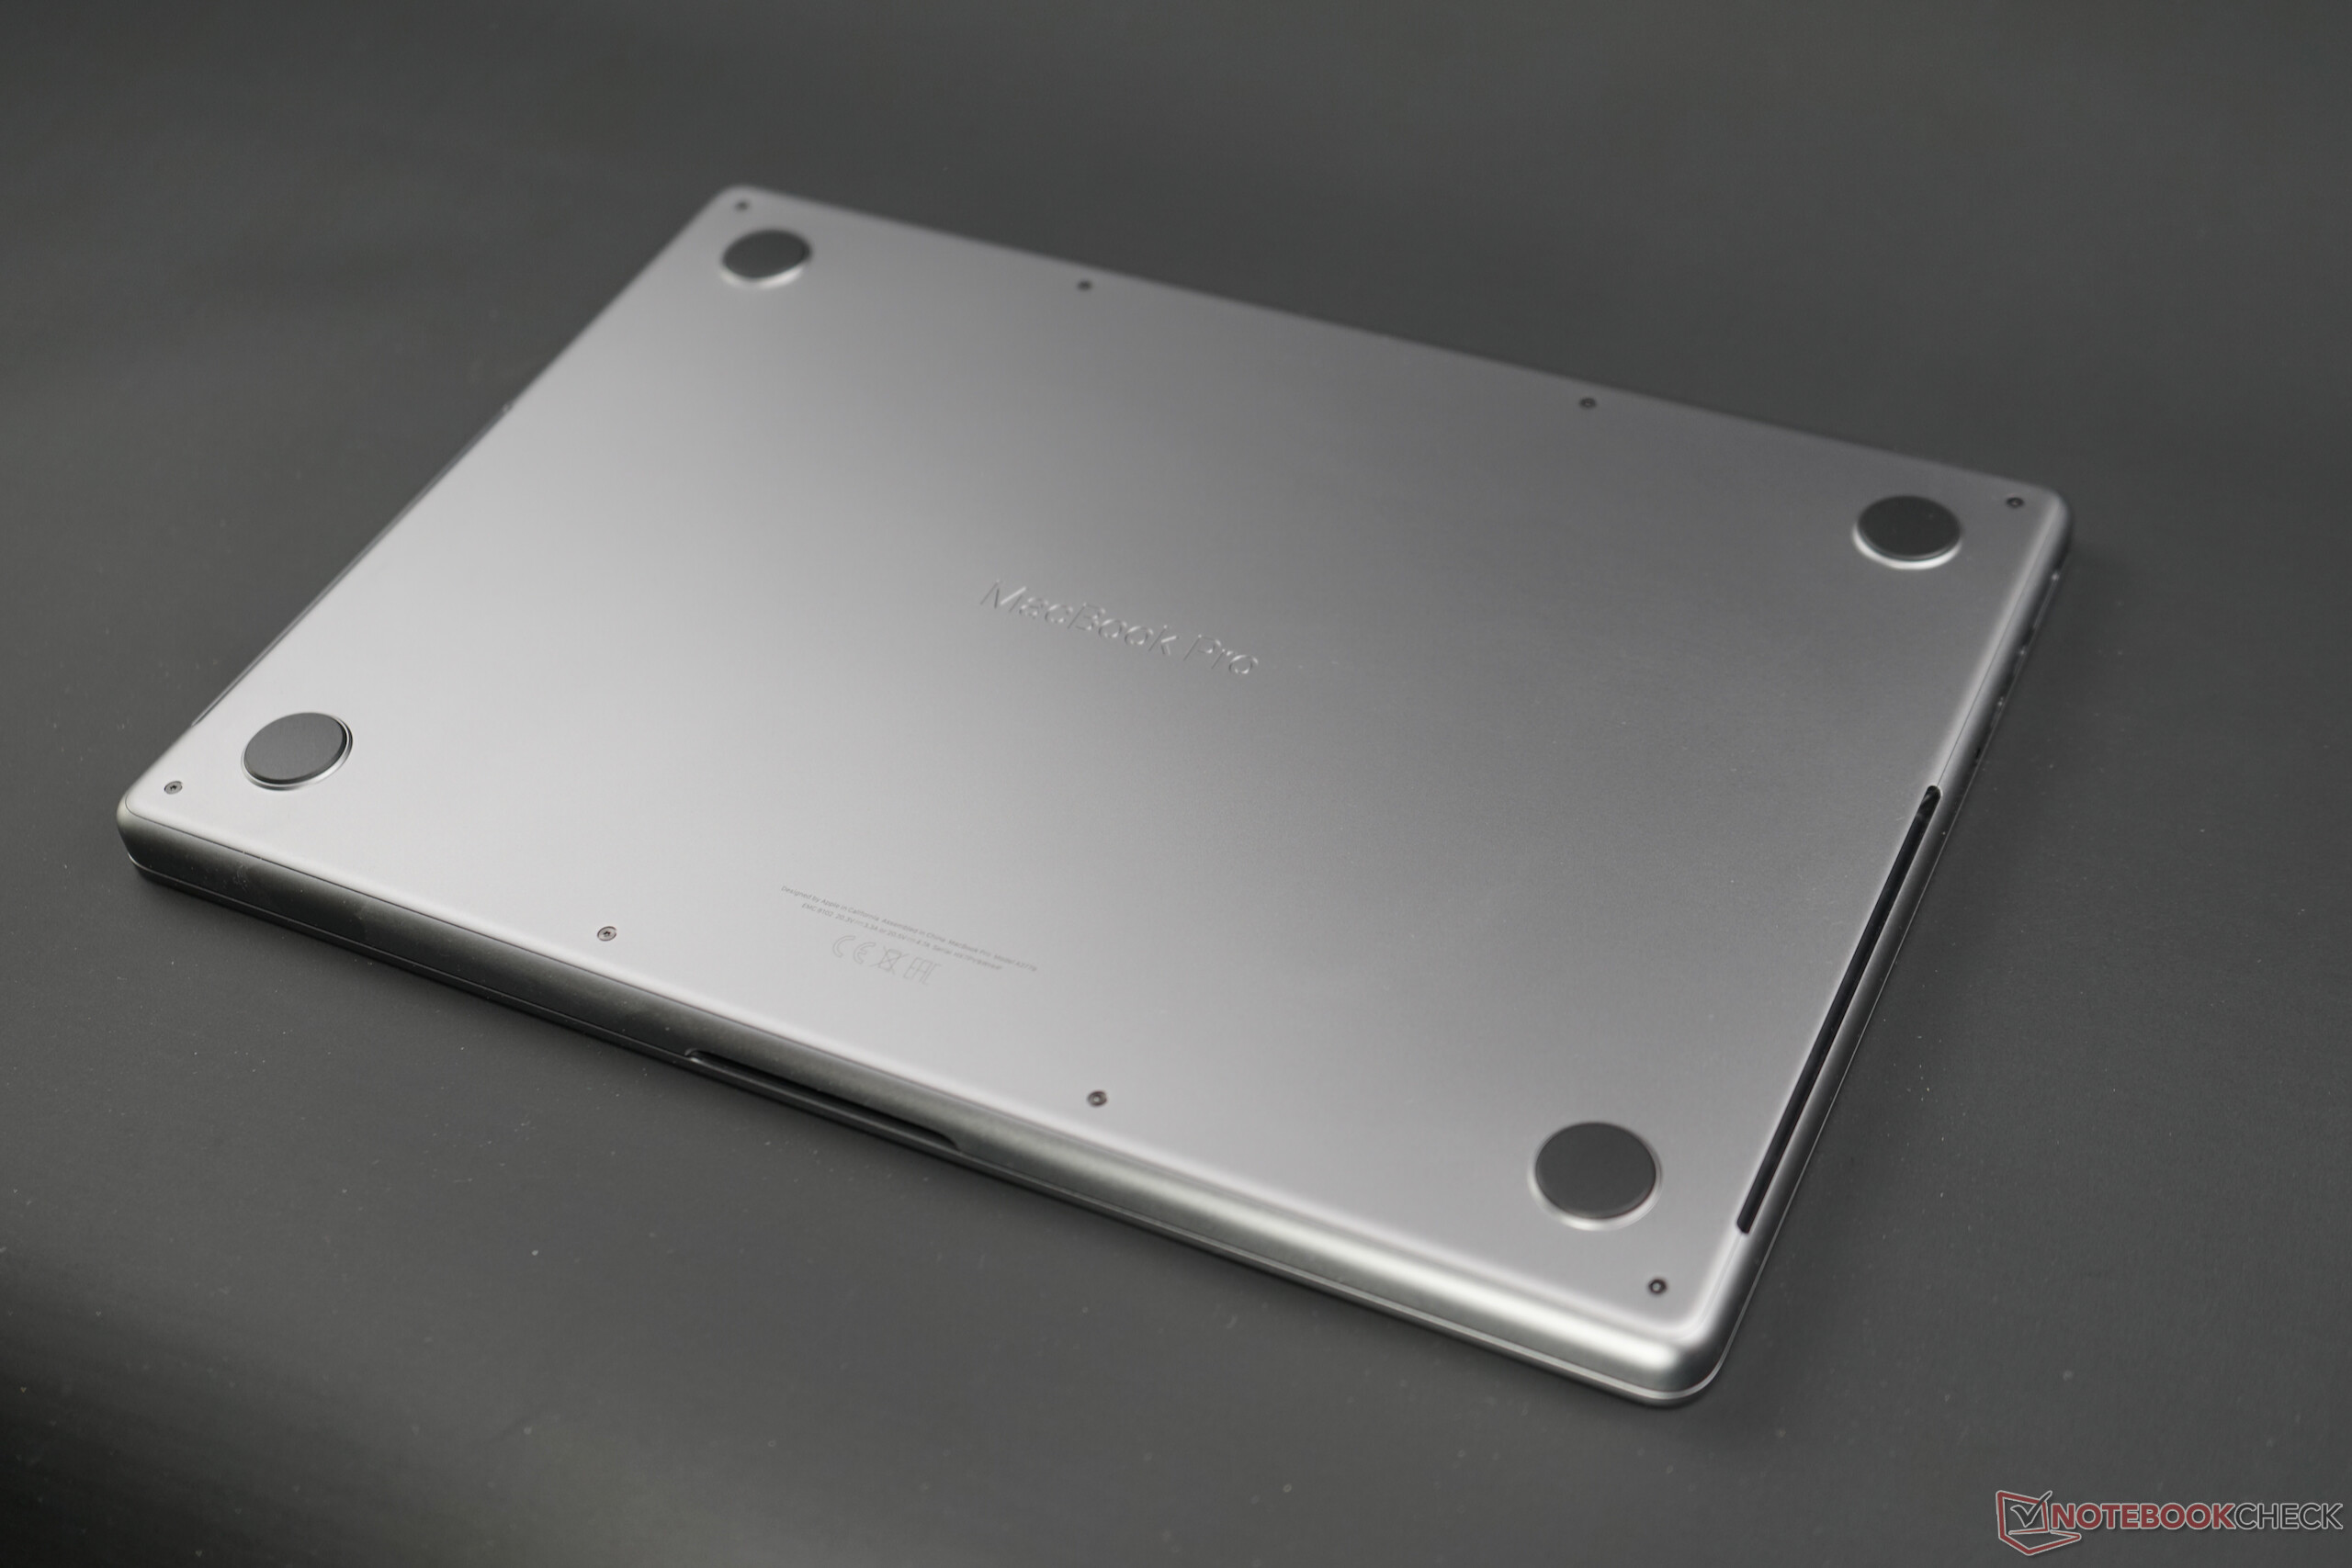
Apple MacBook Pro 14 2023 Entry Review: Base model with cut-down M2 Pro, SSD downgrade, and slightly higher power draws
Previously, we had reviewed the new 2023 MacBook Pro 14 with a full M2 Pro chip (12 CPU cores, 19 GPU cores), 32 GB RAM, and a 2 TB SSD. At close to €4,000 this turns out to be an expensive configuration.
Today, we take a look at the base model MacBook Pro 14 with a cut-down M2 Pro SoC (10 CPU cores, 16 GPU cores), 16 GB RAM, and a 512 GB SSD. The asking price of the base model has increased compared to the 2021 variants. Officially, the new MacBook Pro 14 starts from €2,399, which is dearer by €150 compared to what the 2021 variant costed back then. In the US, the base model 2023 MacBook Pro 14 works out to US$1,999 on Apple's website.
In this review, we focus mainly on the CPU, GPU, and SSD performance while taking a look at their impact on emissions. The chassis, connectivity, input devices, and display are the same as the 2023 MacBook Pro 14. More information on these aspects can be found in the link below:
Potential competitors in comparison
Rating | Date | Model | Weight | Height | Size | Resolution | Price |
|---|---|---|---|---|---|---|---|
| 93.4 % v7 (old) | 03 / 2023 | Apple MacBook Pro 14 2023 M2 Pro Entry M2 Pro 10-Core, M2 Pro 16-Core GPU | 1.6 kg | 15.5 mm | 14.20" | 3024x1964 | |
| 92 % v7 (old) | 08 / 2022 | Apple MacBook Air M2 10C GPU M2, M2 10-Core GPU | 1.2 kg | 11.3 mm | 13.60" | 2560x1664 | |
| 93.9 % v7 (old) | 03 / 2023 | Apple MacBook Pro 14 2023 M2 Pro M2 Pro, M2 Pro 19-Core GPU | 1.6 kg | 15.5 mm | 14.20" | 3024x1964 | |
| 92.7 % v7 (old) | 11 / 2021 | Apple MacBook Pro 14 2021 M1 Pro Entry M1 Pro 8-Core, M1 Pro 14-Core GPU | 1.6 kg | 15.5 mm | 14.20" | 3024x1964 | |
| 87.7 % v7 (old) | 12 / 2022 | Lenovo Yoga Slim 7 Pro X 14IAH7 82TK006CGE i7-12700H, GeForce RTX 3050 4GB Laptop GPU | 1.5 kg | 18 mm | 14.50" | 3072x1920 | |
| 88.8 % v7 (old) | 10 / 2022 | Schenker Vision 14 2022 RTX 3050 Ti i7-12700H, GeForce RTX 3050 Ti Laptop GPU | 1.3 kg | 16.6 mm | 14.00" | 2880x1800 | |
| 89 % v7 (old) | 03 / 2022 | Microsoft Surface Laptop Studio i7 RTX 3050 Ti i7-11370H, GeForce RTX 3050 Ti Laptop GPU | 1.8 kg | 19 mm | 14.40" | 2400x1600 |


Performance: M2 Pro with 10 cores
The base 2023 MacBook Pro 14 relies on a nerfed M2 Pro SoC with 10 cores (6x Performance cores + 4x Efficiency cores) while the GPU uses just 16 cores. 16 GB of RAM comes standard with the base model, but this can be optionally upgraded to 32 GB during configuration.
Processor
The M2 Pro continues to use the same 5 nm architecture as that of the M1 Pro but with the addition of two additional efficiency cores. The base variant of the M2 Pro offers just six performance cores while the high-end variants of the M2 Pro and M2 Max come with eight performance cores.
The efficiency cores reach a maximum of 2.4 GHz while the performance cores can attain 3.5 GHz in single-core or 3.26 GHz in multi-core. Check out our dedicated M2 Pro SoC page for more information and benchmarks.
Cinebench R15 Multi Loop
In our Cinebench R15 multi-core loop test, the CPU performance remains constant without any performance drops even on battery power (only at 3% battery do we see any performance limitations). Compared to the base M1 Pro, the single-core performance seems to have increased by 23% in the native Cinebench R23 test. This is at the same level as the higher-end M2 Pro and M2 Max chips.
Mutli-core performance of the M2 Pro entry is about 23% faster in Cinebench R23 compared to the M1 Pro entry. The M2 Pro with a 12-core CPU, on the other hand, is 25% faster than the base M2 Pro. Multi-core scores are more or less identical compared to the Intel Raptor Lake Core i7-1360P even with lower consumption in the Apple chip.
Intel, however, has a single-core advantage here while also requiring higher power.
AMD Zen 3 CPUs such as the Ryzen 7 6800U are at a disadvantage in single-core tests but nearly tie with the M2 Pro entry in multi-core. We will be testing laptops powered by 4 nm Zen 4 chips in the coming weeks.
Cinebench R20: CPU (Multi Core) | CPU (Single Core)
Cinebench R15: CPU Multi 64Bit | CPU Single 64Bit
Blender: v2.79 BMW27 CPU
Geekbench 5.5: Multi-Core | Single-Core
Blender: v3.3 Classroom CPU
| Cinebench R20 / CPU (Multi Core) | |
| Average of class Multimedia (1887 - 12912, n=64, last 2 years) | |
| Schenker Vision 14 2022 RTX 3050 Ti | |
| Lenovo Yoga Slim 7 Pro X 14IAH7 82TK006CGE | |
| Lenovo Yoga 7-14ARB G7 | |
| Lenovo Yoga 9 14IRP G8 | |
| Apple MacBook Pro 14 2023 M2 Pro | |
| Apple MacBook Pro 14 2023 M2 Pro Entry | |
| Average Apple M2 Pro 10-Core (n=1) | |
| Apple MacBook Pro 16 2021 M1 Pro | |
| Microsoft Surface Laptop Studio i7 RTX 3050 Ti | |
| Apple MacBook Air M2 10C GPU | |
| Cinebench R20 / CPU (Single Core) | |
| Lenovo Yoga 9 14IRP G8 | |
| Average of class Multimedia (425 - 853, n=64, last 2 years) | |
| Schenker Vision 14 2022 RTX 3050 Ti | |
| Lenovo Yoga Slim 7 Pro X 14IAH7 82TK006CGE | |
| Lenovo Yoga 7-14ARB G7 | |
| Microsoft Surface Laptop Studio i7 RTX 3050 Ti | |
| Apple MacBook Pro 14 2023 M2 Pro Entry | |
| Average Apple M2 Pro 10-Core (n=1) | |
| Apple MacBook Pro 14 2023 M2 Pro | |
| Apple MacBook Pro 16 2021 M1 Pro | |
| Apple MacBook Air M2 10C GPU | |
| Cinebench R15 / CPU Multi 64Bit | |
| Average of class Multimedia (856 - 5224, n=68, last 2 years) | |
| Lenovo Yoga Slim 7 Pro X 14IAH7 82TK006CGE | |
| Schenker Vision 14 2022 RTX 3050 Ti | |
| Lenovo Yoga 9 14IRP G8 | |
| Apple MacBook Pro 14 2023 M2 Pro | |
| Lenovo Yoga 7-14ARB G7 | |
| Apple MacBook Pro 16 2021 M1 Pro | |
| Apple MacBook Pro 14 2023 M2 Pro Entry | |
| Average Apple M2 Pro 10-Core (n=1) | |
| Apple MacBook Pro 14 2021 M1 Pro Entry | |
| Apple MacBook Air M2 10C GPU | |
| Microsoft Surface Laptop Studio i7 RTX 3050 Ti | |
| Cinebench R15 / CPU Single 64Bit | |
| Average of class Multimedia (184.8 - 326, n=66, last 2 years) | |
| Lenovo Yoga 9 14IRP G8 | |
| Schenker Vision 14 2022 RTX 3050 Ti | |
| Lenovo Yoga Slim 7 Pro X 14IAH7 82TK006CGE | |
| Lenovo Yoga 7-14ARB G7 | |
| Apple MacBook Pro 14 2023 M2 Pro Entry | |
| Average Apple M2 Pro 10-Core (n=1) | |
| Apple MacBook Pro 14 2023 M2 Pro | |
| Microsoft Surface Laptop Studio i7 RTX 3050 Ti | |
| Apple MacBook Air M2 10C GPU | |
| Apple MacBook Pro 14 2021 M1 Pro Entry | |
| Apple MacBook Pro 16 2021 M1 Pro | |
| Blender / v2.79 BMW27 CPU | |
| Apple MacBook Air M2 10C GPU | |
| Microsoft Surface Laptop Studio i7 RTX 3050 Ti | |
| Apple MacBook Pro 14 2023 M2 Pro Entry | |
| Average Apple M2 Pro 10-Core (n=1) | |
| Lenovo Yoga 9 14IRP G8 | |
| Lenovo Yoga 7-14ARB G7 | |
| Schenker Vision 14 2022 RTX 3050 Ti | |
| Average of class Multimedia (100 - 557, n=65, last 2 years) | |
| Lenovo Yoga Slim 7 Pro X 14IAH7 82TK006CGE | |
| Apple MacBook Pro 16 2021 M1 Pro | |
| Blender / v3.3 Classroom CPU | |
| Apple MacBook Air M2 10C GPU | |
| Lenovo Yoga 9 14IRP G8 | |
| Lenovo Yoga 7-14ARB G7 | |
| Schenker Vision 14 2022 RTX 3050 Ti | |
| Apple MacBook Pro 14 2023 M2 Pro Entry | |
| Average Apple M2 Pro 10-Core (n=1) | |
| Average of class Multimedia (134.5 - 1042, n=68, last 2 years) | |
| Lenovo Yoga Slim 7 Pro X 14IAH7 82TK006CGE | |
| Apple MacBook Pro 14 2023 M2 Pro | |
* ... smaller is better
When it comes to efficiency, the M2 Pro entry trails behind the faster M2 Pro in both single and multi-core measurements, and also behind the regular M2 SoC in the MacBook Air.
Intel cannot match up to the M2 Pro's efficiency with Raptor Lake, but the AMD Ryzen 7 6800U is just slightly behind the M2 Pro in multi-core efficiency tests.
We look into performance and power efficiency metrics of the M2 Pro and M2 Max SoCs in our comprehensive analysis.
| Power Consumption | |
| Cinebench R23 Multi Power Efficiency - external Monitor | |
| Apple MacBook Air M2 10C GPU | |
| Apple MacBook Pro 14 2023 M2 Pro | |
| Apple MacBook Pro 14 2023 M2 Pro Entry | |
| Lenovo Yoga 7-14ARB G7 | |
| Lenovo Yoga 9 14IRP G8 | |
| Schenker Vision 14 2022 RTX 3050 Ti | |
| Cinebench R23 Single Power Efficiency - external Monitor | |
| Apple MacBook Air M2 10C GPU | |
| Apple MacBook Pro 14 2023 M2 Pro | |
| Apple MacBook Pro 14 2023 M2 Pro Entry | |
| Lenovo Yoga 7-14ARB G7 | |
| Lenovo Yoga 9 14IRP G8 | |
| Schenker Vision 14 2022 RTX 3050 Ti | |
System Performance
Subjectively, the base 2023 MacBook Pro 14 seems similar to the more advanced MacBook Pro 14 and MacBook Pro 16 models in overall system performance. While native applications indeed ran better, we did not experience any problems with emulated apps during testing.
This is best illustrated by Adobe apps such as Photoshop and Premiere Pro. The PugetBench results shown here were obtained via emulated x86 versions of these apps and not reflect actual performance. Results are excellent in the cross-platform CrossMark test.
Premiere Pro PugetBench: Overall Score 0.9
Photoshop PugetBench: Overall Score
Blackmagic RAW Speed Test: 12:1 8K Metal | 12:1 8K CPU
Jetstream 2: 2.0 Total
Speedometer 2.0: Result 2.0
WebXPRT 4: Overall
WebXPRT 3: Overall
| CrossMark / Overall | |
| Average of class Multimedia (866 - 2728, n=67, last 2 years) | |
| Apple MacBook Pro 14 2023 M2 Pro | |
| Lenovo Yoga Slim 7 Pro X 14IAH7 82TK006CGE | |
| Apple MacBook Pro 14 2023 M2 Pro Entry | |
| Average Apple M2 Pro 10-Core, Apple M2 Pro 16-Core GPU (n=1) | |
| Lenovo Yoga 9 14IRP G8 | |
| Schenker Vision 14 2022 RTX 3050 Ti | |
| Lenovo Yoga 7-14ARB G7 | |
| Apple MacBook Air M2 10C GPU | |
| Apple MacBook Pro 14 2021 M1 Pro Entry | |
| Microsoft Surface Laptop Studio i7 RTX 3050 Ti | |
| CrossMark / Productivity | |
| Average of class Multimedia (931 - 2489, n=67, last 2 years) | |
| Lenovo Yoga 9 14IRP G8 | |
| Lenovo Yoga Slim 7 Pro X 14IAH7 82TK006CGE | |
| Schenker Vision 14 2022 RTX 3050 Ti | |
| Apple MacBook Pro 14 2023 M2 Pro | |
| Lenovo Yoga 7-14ARB G7 | |
| Apple MacBook Pro 14 2023 M2 Pro Entry | |
| Average Apple M2 Pro 10-Core, Apple M2 Pro 16-Core GPU (n=1) | |
| Microsoft Surface Laptop Studio i7 RTX 3050 Ti | |
| Apple MacBook Air M2 10C GPU | |
| Apple MacBook Pro 14 2021 M1 Pro Entry | |
| CrossMark / Creativity | |
| Apple MacBook Pro 14 2023 M2 Pro | |
| Apple MacBook Pro 14 2023 M2 Pro Entry | |
| Average Apple M2 Pro 10-Core, Apple M2 Pro 16-Core GPU (n=1) | |
| Average of class Multimedia (907 - 3465, n=67, last 2 years) | |
| Lenovo Yoga Slim 7 Pro X 14IAH7 82TK006CGE | |
| Lenovo Yoga 9 14IRP G8 | |
| Apple MacBook Pro 14 2021 M1 Pro Entry | |
| Apple MacBook Air M2 10C GPU | |
| Schenker Vision 14 2022 RTX 3050 Ti | |
| Lenovo Yoga 7-14ARB G7 | |
| Microsoft Surface Laptop Studio i7 RTX 3050 Ti | |
| CrossMark / Responsiveness | |
| Schenker Vision 14 2022 RTX 3050 Ti | |
| Average of class Multimedia (605 - 2024, n=67, last 2 years) | |
| Lenovo Yoga 9 14IRP G8 | |
| Lenovo Yoga Slim 7 Pro X 14IAH7 82TK006CGE | |
| Apple MacBook Pro 14 2023 M2 Pro | |
| Apple MacBook Pro 14 2023 M2 Pro Entry | |
| Average Apple M2 Pro 10-Core, Apple M2 Pro 16-Core GPU (n=1) | |
| Lenovo Yoga 7-14ARB G7 | |
| Microsoft Surface Laptop Studio i7 RTX 3050 Ti | |
| Apple MacBook Air M2 10C GPU | |
| Apple MacBook Pro 14 2021 M1 Pro Entry | |
| Premiere Pro PugetBench / Overall Score 0.9 | |
| Apple MacBook Pro 14 2023 M2 Pro | |
| Apple MacBook Pro 14 2023 M2 Pro Entry | |
| Average Apple M2 Pro 10-Core, Apple M2 Pro 16-Core GPU (n=1) | |
| Apple MacBook Pro 14 2021 M1 Pro Entry | |
| Apple MacBook Air M2 10C GPU | |
| Microsoft Surface Laptop Studio i7 RTX 3050 Ti | |
| Photoshop PugetBench / Overall Score | |
| Apple MacBook Pro 14 2023 M2 Pro | |
| Apple MacBook Pro 14 2023 M2 Pro Entry | |
| Average Apple M2 Pro 10-Core, Apple M2 Pro 16-Core GPU (n=1) | |
| Apple MacBook Air M2 10C GPU | |
| Microsoft Surface Laptop Studio i7 RTX 3050 Ti | |
| Apple MacBook Pro 14 2021 M1 Pro Entry | |
| Blackmagic RAW Speed Test / 12:1 8K Metal | |
| Average of class Multimedia (78 - 430, n=7, last 2 years) | |
| Apple MacBook Pro 14 2023 M2 Pro | |
| Apple MacBook Pro 14 2023 M2 Pro Entry | |
| Average Apple M2 Pro 10-Core, Apple M2 Pro 16-Core GPU (n=1) | |
| Apple MacBook Pro 14 2021 M1 Pro Entry | |
| Apple MacBook Air M2 10C GPU | |
| Blackmagic RAW Speed Test / 12:1 8K CPU | |
| Average of class Multimedia (44 - 102, n=7, last 2 years) | |
| Apple MacBook Pro 14 2023 M2 Pro | |
| Apple MacBook Pro 14 2023 M2 Pro Entry | |
| Average Apple M2 Pro 10-Core, Apple M2 Pro 16-Core GPU (n=1) | |
| Apple MacBook Air M2 10C GPU | |
| Apple MacBook Pro 14 2021 M1 Pro Entry | |
| Jetstream 2 / 2.0 Total | |
| Average of class Multimedia (261 - 481, n=36, last 2 years) | |
| Lenovo Yoga 9 14IRP G8 | |
| Schenker Vision 14 2022 RTX 3050 Ti | |
| Apple MacBook Pro 14 2023 M2 Pro | |
| Lenovo Yoga 7-14ARB G7 | |
| Average Apple M2 Pro 10-Core, Apple M2 Pro 16-Core GPU (n=1) | |
| Apple MacBook Pro 14 2023 M2 Pro Entry | |
| Apple MacBook Air M2 10C GPU | |
| Apple MacBook Pro 14 2021 M1 Pro Entry | |
| Microsoft Surface Laptop Studio i7 RTX 3050 Ti | |
| Speedometer 2.0 / Result 2.0 | |
| Average of class Multimedia (337 - 946, n=35, last 2 years) | |
| Apple MacBook Pro 14 2023 M2 Pro | |
| Apple MacBook Pro 14 2023 M2 Pro Entry | |
| Average Apple M2 Pro 10-Core, Apple M2 Pro 16-Core GPU (n=1) | |
| Apple MacBook Air M2 10C GPU | |
| Schenker Vision 14 2022 RTX 3050 Ti | |
| Lenovo Yoga 9 14IRP G8 | |
| Apple MacBook Pro 14 2021 M1 Pro Entry | |
| Lenovo Yoga 7-14ARB G7 | |
| Microsoft Surface Laptop Studio i7 RTX 3050 Ti | |
| WebXPRT 4 / Overall | |
| Average of class Multimedia (167.3 - 402, n=71, last 2 years) | |
| Lenovo Yoga 9 14IRP G8 | |
| Schenker Vision 14 2022 RTX 3050 Ti | |
| Apple MacBook Pro 14 2023 M2 Pro | |
| Apple MacBook Pro 14 2023 M2 Pro Entry | |
| Average Apple M2 Pro 10-Core, Apple M2 Pro 16-Core GPU (n=1) | |
| Lenovo Yoga Slim 7 Pro X 14IAH7 82TK006CGE | |
| Apple MacBook Air M2 10C GPU | |
| Lenovo Yoga 7-14ARB G7 | |
| WebXPRT 3 / Overall | |
| Apple MacBook Pro 14 2023 M2 Pro Entry | |
| Average Apple M2 Pro 10-Core, Apple M2 Pro 16-Core GPU (n=1) | |
| Apple MacBook Pro 14 2023 M2 Pro | |
| Apple MacBook Air M2 10C GPU | |
| Apple MacBook Pro 14 2021 M1 Pro Entry | |
| Average of class Multimedia (136.4 - 596, n=70, last 2 years) | |
| Lenovo Yoga 9 14IRP G8 | |
| Schenker Vision 14 2022 RTX 3050 Ti | |
| Lenovo Yoga 7-14ARB G7 | |
| Microsoft Surface Laptop Studio i7 RTX 3050 Ti | |
Storage Devices
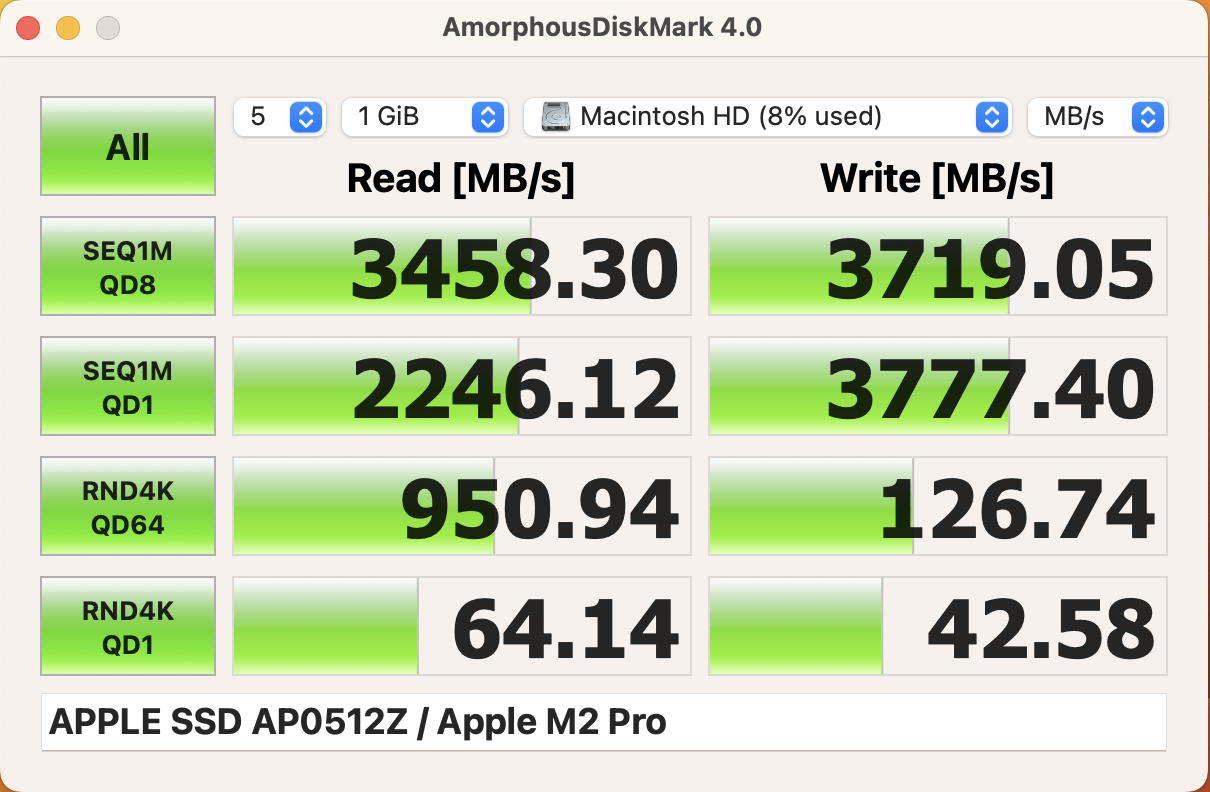
We now come to the contentious issue of MacBook SSD performance. Apple installed a larger SSD in the new MacBook Air entry, which led to slower performance compared to the older model. This is because macOS can offload data to the SSD when the RAM is full, which can negatively impact overall performance.
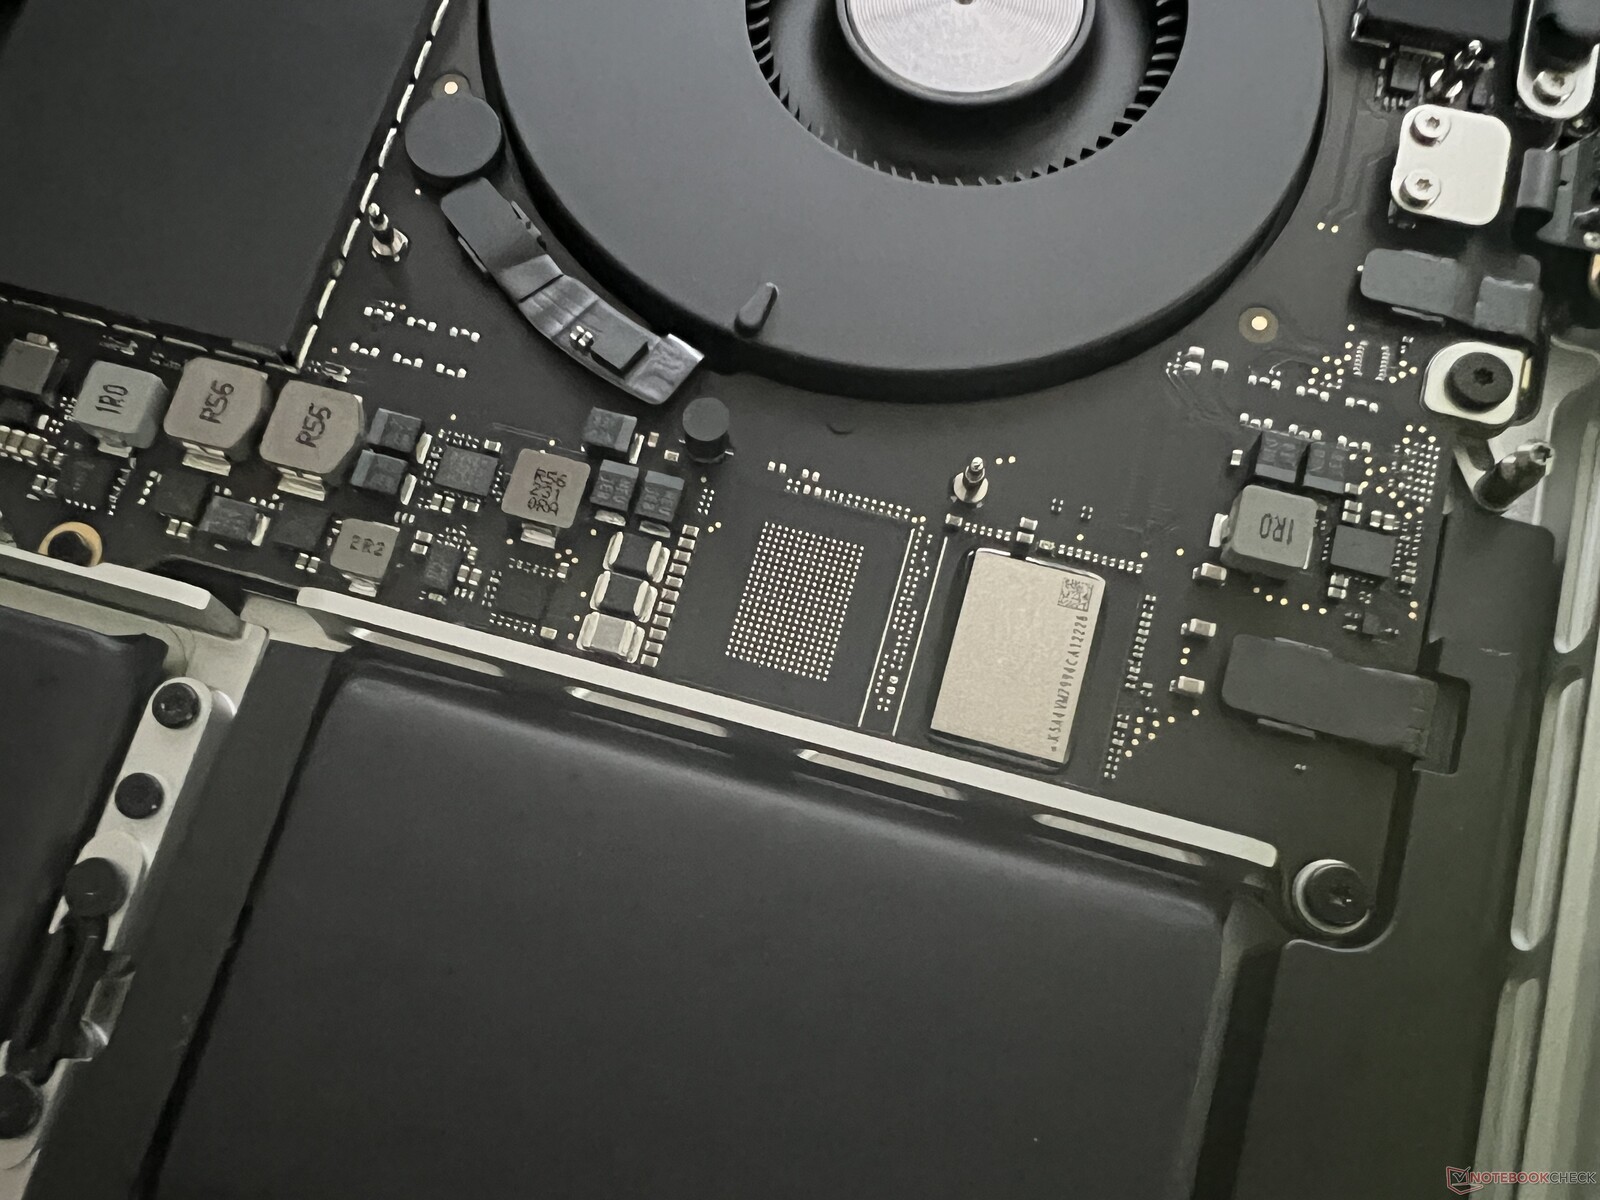
In the new 2023 MacBook Pro 14 only a single 512 GB SSD chip is used. The bad news is that the performance is significantly worse than the 2021 MacBook Pro 14 and current models with 1 TB storage. It is clear that PCIe Gen 4 speeds are not being fully exploited here.
That being said, the positive aspect is that the overall performance is still much better than the M2 MacBook Air entry with a 256 GB SSD. Of course, one can argue that the Pro model is supposed to have faster storage and that Apple could have very well offered a 1 TB drive as standard considering the increased MSRP. In practice, however, 512 GB should still be pretty sufficient and faster than the 1 TB flash in the M2 MacBook Air.
More SSD benchmarks can be found here.
GPU Performance
The GPU in the base M2 Pro now features 16 instead of 14 cores with a maximum clock of 1.4 GHz. This allows the M2 Pro entry GPU to position itself about 7% ahead of the 16-core GPU of the M1 Pro. The M2 Pro with a 19-core GPU is about 12-17% faster depending on the test.
In 3DMark WildLife, which runs natively on Apple silicon, even the Nvidia GeForce RTX 3050 Ti Laptop GPU in the Microsoft Surface Laptop Studio and Schenker Vision 14 are beaten by the entry M2 Pro GPU. Integrated GPUs from Intel and AMD are at a clear disadvantage.
The graphics performance of the entry M2 Pro remains completely stable both under prolonged load and on battery power.
More GPU benchmarks and performance comparisons are available here.
| Geekbench 6.0 | |
| GPU Metal | |
| Apple MacBook Pro 14 2023 M2 Pro Entry | |
| Apple MacBook Pro 16 2021 M1 Pro | |
| GPU OpenCL 6.0 | |
| Apple MacBook Pro 14 2023 M2 Pro Entry | |
| Apple MacBook Pro 16 2021 M1 Pro | |
| Blender / v3.3 Classroom METAL | |
| Apple MacBook Pro 14 2023 M2 Pro Entry | |
| Average Apple M2 Pro 16-Core GPU (n=1) | |
| Apple MacBook Pro 14 2023 M2 Pro | |
| Apple MacBook Pro 16 2023 M2 Max | |
| Average of class Multimedia (17.8 - 68, n=5, last 2 years) | |
| Blender / v3.3 Classroom HIP/AMD | |
| Lenovo Yoga 7-14ARB G7 | |
| Blender / v3.3 Classroom OPTIX/RTX | |
| Lenovo Yoga Slim 7 Pro X 14IAH7 82TK006CGE | |
| Schenker Vision 14 2022 RTX 3050 Ti | |
| Average of class Multimedia (12 - 105, n=24, last 2 years) | |
| Blender / v3.3 Classroom CUDA | |
| Lenovo Yoga Slim 7 Pro X 14IAH7 82TK006CGE | |
| Schenker Vision 14 2022 RTX 3050 Ti | |
| Average of class Multimedia (20 - 186, n=24, last 2 years) | |
| Blender / v3.3 Classroom CPU | |
| Apple MacBook Air M2 10C GPU | |
| Lenovo Yoga 9 14IRP G8 | |
| Lenovo Yoga 7-14ARB G7 | |
| Schenker Vision 14 2022 RTX 3050 Ti | |
| Apple MacBook Pro 14 2023 M2 Pro Entry | |
| Average Apple M2 Pro 16-Core GPU (n=1) | |
| Average of class Multimedia (134.5 - 1042, n=68, last 2 years) | |
| Lenovo Yoga Slim 7 Pro X 14IAH7 82TK006CGE | |
| Apple MacBook Pro 14 2023 M2 Pro | |
| Apple MacBook Pro 16 2023 M2 Max | |
* ... smaller is better
Gaming Performance
It is still quite difficult to assess the gaming performance of MacBooks or compare them to Windows laptops. Native games like Resident Evil Village run without problems at 1080p on the entry M2 Pro, but we do not have the possibility of recording and evaluating the fps numbers.
The following benchmarks, therefore, only show results of emulated titles such as Shadow of the Tomb Raider or Windows games tested with CrossOver. This is the case with games such as GTA V, wherein we can run even our regular Windows benchmark, but you should always keep in mind that these games are not optimized for ARM SoCs.
We could test power efficiency of the entry M2 Pro with The Witcher 3 (run via CrossOver) and compare it with Windows laptops. However, the Ultra setting in the game only runs with SSAO and Nvidia Hairworks disabled on the MacBook Pro (in Windows, we enable both HBAO and Hairworks in Ultra).
Thus, the results are not exactly an apples-to-apples (pun intended) comparison, but they still provide an idea of where the new SoC stands. The entry M2 Pro GPU is ahead of its competition from Nvidia and AMD. The outdated Intel Iris Xe Graphics G7 in Raptor Lake mobile is left even further behind.
| Power Consumption - Witcher 3 ultra Efficiency (external Monitor) | |
| Apple MacBook Pro 14 2023 M2 Pro | |
| Apple MacBook Pro 14 2023 M2 Pro Entry | |
| Lenovo Yoga 7-14ARB G7 | |
| Microsoft Surface Laptop Studio i7 RTX 3050 Ti | |
| Schenker Vision 14 2022 RTX 3050 Ti | |
| Lenovo Yoga Slim 7 Pro X 14IAH7 82TK006CGE | |
| Lenovo Yoga 9 14IRP G8 | |
| low | med. | high | ultra | QHD | |
|---|---|---|---|---|---|
| GTA V (2015) | 76 | 73 | 46 | ||
| The Witcher 3 (2015) | 51 | 45 | |||
| Shadow of the Tomb Raider (2018) | 159 | 72 | 65 | 57 | 36 |
| Total War: Three Kingdoms (2019) | 258 | 75 | 48 | 36 | 22 |
| Borderlands 3 (2019) | 80.8 | 52 | 38 | 28.9 |
Emissions: CPU load determines fan noise
System Noise
The fan behavior in the base 2023 MacBook Pro 14 is slightly different from that of the full configuration M2 Pro. The base model is extremely quiet in daily use and fans are generally not audible for the most part. This is also true in pure GPU loads, wherein the fans kick in after a few minutes but are practically inaudible at a sound pressure level (SPL) of just over 24 dB(A).
The fan noise does increase under full CPU load. However, due to the very conservative fan curve, the fan noise SPL increases briefly up to 47.5 dB(A) to get the chip temperature under control and then levels off around 36-38 dB(A). This applies to scenarios of combined load as well where the CPU is more heavily strained.
That being said, when the GPU is subjected to higher loads (for example, in our combined load with Cinebench R23 multi-core and 3DMark WildLife Extreme Stress test), we do not see this peak noise and the SPL stays at about 36-38 dB(A) from the start.
We couldn't hear any other random electronic noise.
Noise level
| Idle |
| 23.6 / 23.6 / 23.6 dB(A) |
| Load |
| 24.2 / 47.5 dB(A) |
 | ||
30 dB silent 40 dB(A) audible 50 dB(A) loud |
||
min: | ||
| Apple MacBook Pro 14 2023 M2 Pro Entry M2 Pro 16-Core GPU, M2 Pro 10-Core, Apple SSD AP0512Z | Apple MacBook Air M2 10C GPU M2 10-Core GPU, M2, Apple SSD AP1024Z | Apple MacBook Pro 14 2023 M2 Pro M2 Pro 19-Core GPU, M2 Pro, Apple SSD AP2048Z | Apple MacBook Pro 14 2021 M1 Pro Entry M1 Pro 14-Core GPU, M1 Pro 8-Core, Apple SSD AP0512 | Lenovo Yoga Slim 7 Pro X 14IAH7 82TK006CGE GeForce RTX 3050 4GB Laptop GPU, i7-12700H, Micron 3400 1TB MTFDKBA1T0TFH | Schenker Vision 14 2022 RTX 3050 Ti GeForce RTX 3050 Ti Laptop GPU, i7-12700H, Samsung SSD 980 Pro 1TB MZ-V8P1T0BW | Microsoft Surface Laptop Studio i7 RTX 3050 Ti GeForce RTX 3050 Ti Laptop GPU, i7-11370H, SK Hynix PC711 1TB HFS001TDE9X084N | |
|---|---|---|---|---|---|---|---|
| Noise | -0% | -7% | -18% | -18% | -9% | ||
| off / environment * (dB) | 23.6 | 23.9 -1% | 24.8 -5% | 24.6 -4% | 24.4 -3% | 24.7 -5% | |
| Idle Minimum * (dB) | 23.6 | 23.9 -1% | 24.8 -5% | 24.6 -4% | 24.4 -3% | 24.7 -5% | |
| Idle Average * (dB) | 23.6 | 23.9 -1% | 24.8 -5% | 24.6 -4% | 24.4 -3% | 24.7 -5% | |
| Idle Maximum * (dB) | 23.6 | 23.9 -1% | 24.8 -5% | 24.6 -4% | 27.8 -18% | 24.7 -5% | |
| Load Average * (dB) | 24.2 | 26 -7% | 27.8 -15% | 45.1 -86% | 43.3 -79% | 33.2 -37% | |
| Load Maximum * (dB) | 47.5 | 43.2 9% | 49.5 -4% | 50.4 -6% | 48.8 -3% | 46.7 2% | |
| Witcher 3 ultra * (dB) | 27.8 | 49.1 | 48.2 | 44.5 |
* ... smaller is better
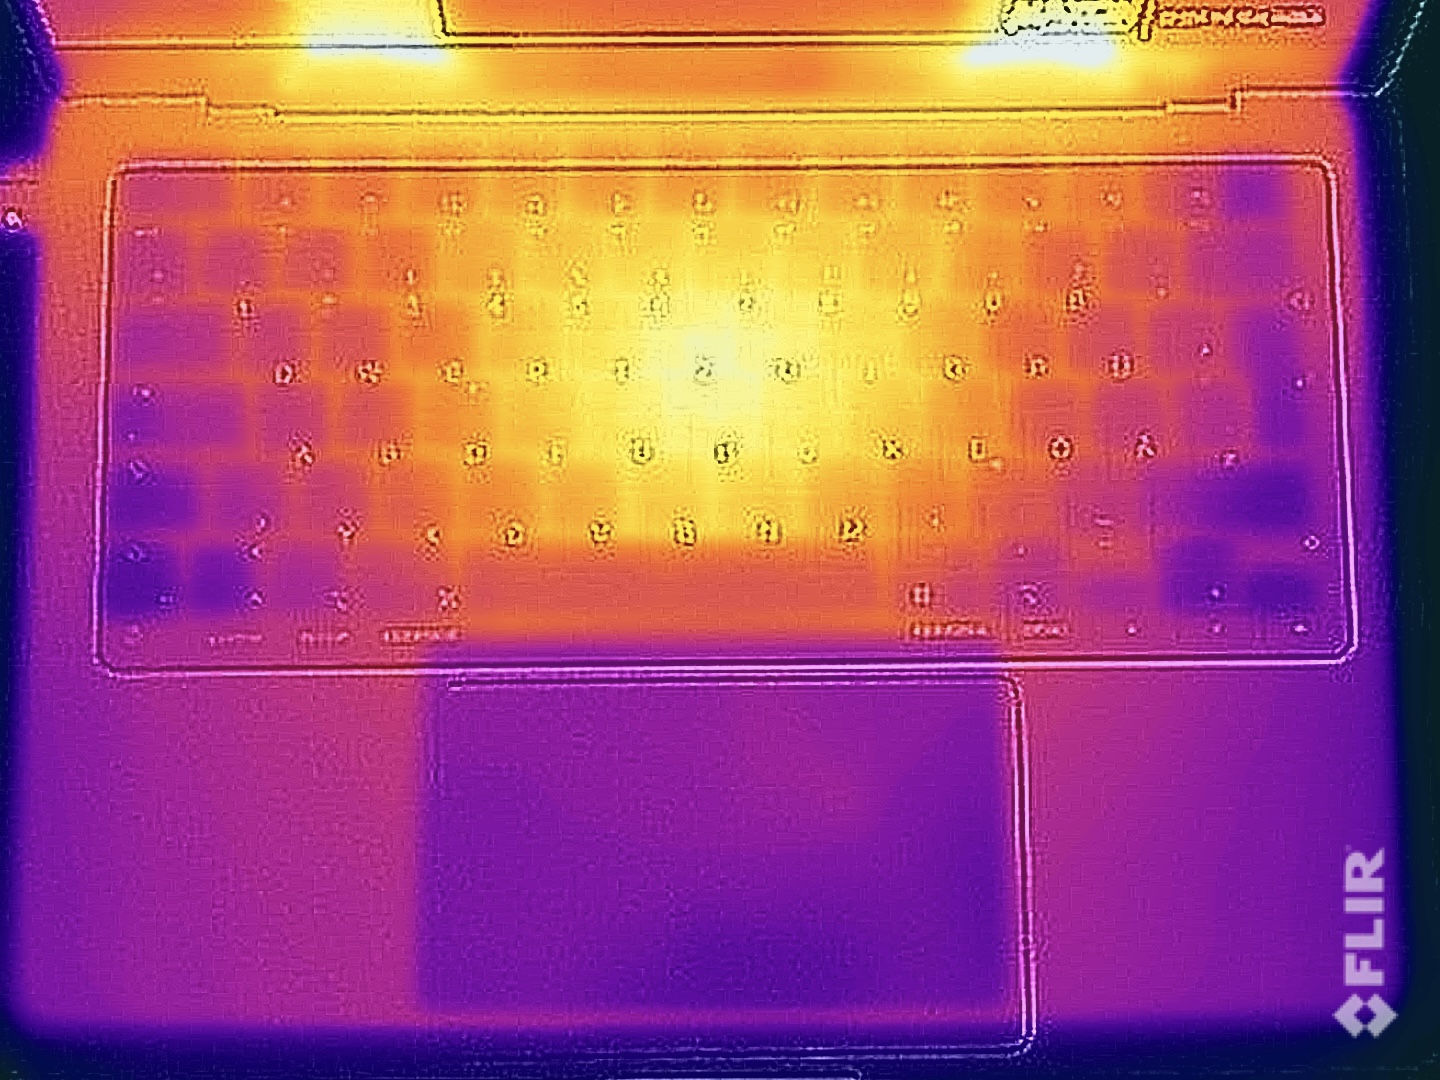
Temperature
The conservative fan behavior is reflected in surface temperatures. The keyboard area gets uncomfortably warm, especially while playing games, measuring over 45 °C. We also recorded a similar temperature near the central area at the back of the laptop, which does not really bode well for placing the device on the lap under such loads. That being said, the metal chassis hardly heats up in everyday usage and poses no such restrictions.
The behavior in the stress test seems a bit strange as the base model seems to consume slightly more power than the full M2 Pro. The CPU and GPU consume 10 W and 25 W, respectively in the base M2 Pro while we've correspondingly noted 8 W and 25 W with the full chip.
(-) The maximum temperature on the upper side is 47 °C / 117 F, compared to the average of 36.8 °C / 98 F, ranging from 21 to 71 °C for the class Multimedia.
(±) The bottom heats up to a maximum of 42.8 °C / 109 F, compared to the average of 39.1 °C / 102 F
(+) In idle usage, the average temperature for the upper side is 22 °C / 72 F, compared to the device average of 31.3 °C / 88 F.
(-) Playing The Witcher 3, the average temperature for the upper side is 39.7 °C / 103 F, compared to the device average of 31.3 °C / 88 F.
(+) The palmrests and touchpad are reaching skin temperature as a maximum (34.2 °C / 93.6 F) and are therefore not hot.
(-) The average temperature of the palmrest area of similar devices was 28.7 °C / 83.7 F (-5.5 °C / -9.9 F).

| Apple MacBook Pro 14 2023 M2 Pro Entry Apple M2 Pro 10-Core, Apple M2 Pro 16-Core GPU | Apple MacBook Air M2 10C GPU Apple M2, Apple M2 10-Core GPU | Apple MacBook Pro 14 2023 M2 Pro Apple M2 Pro, Apple M2 Pro 19-Core GPU | Apple MacBook Pro 14 2021 M1 Pro Entry Apple M1 Pro 8-Core, Apple M1 Pro 14-Core GPU | Lenovo Yoga Slim 7 Pro X 14IAH7 82TK006CGE Intel Core i7-12700H, NVIDIA GeForce RTX 3050 4GB Laptop GPU | Schenker Vision 14 2022 RTX 3050 Ti Intel Core i7-12700H, NVIDIA GeForce RTX 3050 Ti Laptop GPU | Microsoft Surface Laptop Studio i7 RTX 3050 Ti Intel Core i7-11370H, NVIDIA GeForce RTX 3050 Ti Laptop GPU | |
|---|---|---|---|---|---|---|---|
| Heat | -7% | 2% | -4% | -21% | -24% | 2% | |
| Maximum Upper Side * (°C) | 47 | 44.7 5% | 46.9 -0% | 46.8 -0% | 48 -2% | 48.4 -3% | 42.3 10% |
| Maximum Bottom * (°C) | 42.8 | 44.6 -4% | 41.7 3% | 40.9 4% | 50.2 -17% | 57.1 -33% | 38.2 11% |
| Idle Upper Side * (°C) | 22.3 | 25.1 -13% | 21.4 4% | 24.2 -9% | 27.7 -24% | 28.1 -26% | 23.4 -5% |
| Idle Bottom * (°C) | 21.7 | 25.3 -17% | 21.4 1% | 24.2 -12% | 30.1 -39% | 29 -34% | 23.5 -8% |
* ... smaller is better
Power Management: Base M2 Pro with slightly higher power consumption
Power Consumption
Our 2023 MacBook Pro 14 unit seems to be having a slightly higher power draw when idling compared to the variant with the full M2 Pro chip. Whether this is a general trend or simply an issue with our unit cannot be judged at this point.
Power consumption can increase with HDR content, and we were able to measure 25-26 W maximum. Under load, however, the base model is a bit more economical but runs into power supply limits at the beginning of the stress test. We could not measure increased power consumption with a larger power supply — the base MacBook Pro 14 settles at 66 W after a few seconds. Standby and off power draws are very low.
The provided power supply is just about sufficient and is not capable of charging the battery properly under load. If you plan on using the MacBook Pro 14 for demanding tasks, you should get a higher wattage power supply.
| Off / Standby | |
| Idle | |
| Load |
|
Key:
min: | |
| Apple MacBook Pro 14 2023 M2 Pro Entry M2 Pro 10-Core, M2 Pro 16-Core GPU, Apple SSD AP0512Z, Mini-LED, 3024x1964, 14.2" | Apple MacBook Air M2 10C GPU M2, M2 10-Core GPU, Apple SSD AP1024Z, IPS, 2560x1664, 13.6" | Apple MacBook Pro 14 2023 M2 Pro M2 Pro, M2 Pro 19-Core GPU, Apple SSD AP2048Z, Mini-LED, 3024x1964, 14.2" | Apple MacBook Pro 14 2021 M1 Pro Entry M1 Pro 8-Core, M1 Pro 14-Core GPU, Apple SSD AP0512, Mini-LED, 3024x1964, 14.2" | Lenovo Yoga Slim 7 Pro X 14IAH7 82TK006CGE i7-12700H, GeForce RTX 3050 4GB Laptop GPU, Micron 3400 1TB MTFDKBA1T0TFH, IPS, 3072x1920, 14.5" | Schenker Vision 14 2022 RTX 3050 Ti i7-12700H, GeForce RTX 3050 Ti Laptop GPU, Samsung SSD 980 Pro 1TB MZ-V8P1T0BW, IPS, 2880x1800, 14" | Microsoft Surface Laptop Studio i7 RTX 3050 Ti i7-11370H, GeForce RTX 3050 Ti Laptop GPU, SK Hynix PC711 1TB HFS001TDE9X084N, IPS, 2400x1600, 14.4" | Average Apple M2 Pro 16-Core GPU | Average of class Multimedia | |
|---|---|---|---|---|---|---|---|---|---|
| Power Consumption | 31% | -10% | -5% | -62% | -67% | -16% | 0% | -40% | |
| Idle Minimum * (Watt) | 2.5 | 1.9 24% | 2.4 4% | 2.9 -16% | 7.1 -184% | 7.5 -200% | 2.6 -4% | 2.5 ? -0% | 5.71 ? -128% |
| Idle Average * (Watt) | 12.1 | 9.6 21% | 11.3 7% | 11.6 4% | 10.8 11% | 10.4 14% | 7.1 41% | 12.1 ? -0% | 10.1 ? 17% |
| Idle Maximum * (Watt) | 12.3 | 9.7 21% | 11.5 7% | 11.9 3% | 11.6 6% | 11.4 7% | 7.9 36% | 12.3 ? -0% | 12.4 ? -1% |
| Load Average * (Watt) | 49.8 | 32.4 35% | 59.6 -20% | 49.5 1% | 84.8 -70% | 83.3 -67% | 76.8 -54% | 49.8 ? -0% | 65 ? -31% |
| Witcher 3 ultra * (Watt) | 46.6 | 30.8 34% | 55.9 -20% | 58.2 -25% | 91.3 -96% | 92.7 -99% | 83 -78% | ||
| Load Maximum * (Watt) | 71.4 | 35.7 50% | 100 -40% | 68.5 4% | 100.8 -41% | 110.3 -54% | 97.3 -36% | 71.4 ? -0% | 112.2 ? -57% |
* ... smaller is better
Energieaufnahme Witcher 3 / Stresstest
Energieaufnahme mit externem Monitor
Battery Life
The effects of a slightly higher idle power consumption are also noticeable in our battery tests. The results are still pretty good at about 16.5 hours in the video loop test and nearly 13 hours while web browsing at 150 cd/m2.
At a full SDR brightness of 500 cd/m2, the battery life during web browsing drops to just short of seven hours.
| Apple MacBook Pro 14 2023 M2 Pro Entry M2 Pro 10-Core, M2 Pro 16-Core GPU, 70 Wh | Apple MacBook Air M2 10C GPU M2, M2 10-Core GPU, 52.6 Wh | Apple MacBook Pro 14 2023 M2 Pro M2 Pro, M2 Pro 19-Core GPU, 70 Wh | Apple MacBook Pro 14 2021 M1 Pro Entry M1 Pro 8-Core, M1 Pro 14-Core GPU, 69.9 Wh | Lenovo Yoga Slim 7 Pro X 14IAH7 82TK006CGE i7-12700H, GeForce RTX 3050 4GB Laptop GPU, 70 Wh | Schenker Vision 14 2022 RTX 3050 Ti i7-12700H, GeForce RTX 3050 Ti Laptop GPU, 99.8 Wh | Microsoft Surface Laptop Studio i7 RTX 3050 Ti i7-11370H, GeForce RTX 3050 Ti Laptop GPU, 58 Wh | Average of class Multimedia | |
|---|---|---|---|---|---|---|---|---|
| Battery runtime | 5% | -1% | -2% | -45% | -27% | -32% | -4% | |
| H.264 (h) | 16.4 | 15.8 -4% | 15.3 -7% | 15 -9% | 8.9 -46% | 11.1 -32% | 12.3 -25% | 16.4 ? 0% |
| WiFi v1.3 (h) | 12.9 | 14.7 14% | 13.5 5% | 13.6 5% | 7.2 -44% | 10.1 -22% | 8 -38% | 12 ? -7% |
| Load (h) | 1.2 | 1.2 | 1.5 | 2.1 | 1 | 1.675 ? |
Pros
Cons
Verdict: The MacBook Pro 14 can be recommended in its base variant

After all the bad press about the MacBook Air's SSD performance and after first reports of the MacBook Pro 14's reduced disk speeds, we were curious to see how the base variant of the 2023 MacBook Pro 14 would fare. Our test results were positively surprising since the provided 512 GB SSD is slower than the 2021 MacBook Pro 14 but is still better than most PCIe Gen 3 SSDs and also the 1 TB SSD in the current MacBook Air.
Of course, we would have liked a 1 TB SSD as standard for the higher asking price, but Apple probably does not want to give up the profits from SSD upgrades. That being said, the street prices seem to have fallen shortly after release, and you can now get the new MacBook Pro 14 for about €300 less than the recommended retail price (RRP).
Despite featuring a cut-down version of the M2 Pro SoC, the 2023 MacBook Pro 14 entry's CPU and GPU performance is still higher than the 2021 MacBook Pro 16 with a full M1 Pro. Therefore, the new MacBook Pro 14 is still a decent upgrade even if the supposed efficiency leaps do not completely materialize. The increase in CPU performance comes with increased power consumption as well, but the values are nonetheless still very good.
The base variant of the 2023 MacBook Pro 14 has a slower SSD, but that doesn't matter in daily usage. Instead, you can look forward to a faster M2 Pro SoC and Wi-Fi 6E. The excellent mini-LED display, good onboard speakers, and high system performance has not changed, making the base MacBook Pro 14 an excellent overall package.
The general positive aspects of the MacBook Pro 14, including the great mini-LED screen, excellent speakers, and low fan noise in daily usage, also apply to the base variant. There is little criticism, and the entry MacBook Pro 14 offers an excellent overall package. Native apps run extremely well, including complex ones such as Photoshop and Premiere Pro. If you are not necessarily tied to or dependent on Windows-exclusive apps, you should definitely take a closer look at the base 2023 MacBook Pro 14.
If you already own a 2021 MacBook Pro 14, the upgrade to the 2023 version may not really worthwhile. However, if you are coming from an older Intel-based MacBook, the newer Apple silicon MacBook Pros can be considered without hesitation.
Windows laptops with dedicated GPUs are better for gaming given the sheer number of titles, but there are some compromises to be made. The Microsoft Surface Laptop Studio, for example, is equipped with a much slower CPU while the Schenker Vision 14 simply cannot match the MacBook Pro's mini-LED panel in terms of visual quality.
That being said, the Schenker Vision 14 is more portable due to its lower weight and offers good maintenance and upgrade options for the RAM and SSD, which is simply not possible with the MacBook Pro 14.
Price and Availability
The RRP for the base model of the 2023 MacBook Pro 14 is €2,399, but street prices have fallen significantly. Our test configuration is available on Amazon.de for €300 less i.e., for €2,099. An upgraded configuration with a faster M2 Pro and 1 TB SSD is available for €2,660 (RRP €2,999).
The tested 2023 MacBook Pro 14 entry is also available on Amazon US for US$1,948.94.
Apple MacBook Pro 14 2023 M2 Pro Entry
- 03/09/2023 v7 (old)
Andreas Osthoff
Transparency
The selection of devices to be reviewed is made by our editorial team. The test sample was provided to the author as a loan by the manufacturer or retailer for the purpose of this review. The lender had no influence on this review, nor did the manufacturer receive a copy of this review before publication. There was no obligation to publish this review. As an independent media company, Notebookcheck is not subjected to the authority of manufacturers, retailers or publishers.
This is how Notebookcheck is testing
Every year, Notebookcheck independently reviews hundreds of laptops and smartphones using standardized procedures to ensure that all results are comparable. We have continuously developed our test methods for around 20 years and set industry standards in the process. In our test labs, high-quality measuring equipment is utilized by experienced technicians and editors. These tests involve a multi-stage validation process. Our complex rating system is based on hundreds of well-founded measurements and benchmarks, which maintains objectivity. Further information on our test methods can be found here.
Price comparison

