 Deutsch
 English
 Español
 Français
 Italiano
 Nederlands
 Polski
 Português
 Русский
 Türkçe
 Svenska
 Chinese
 Magyar
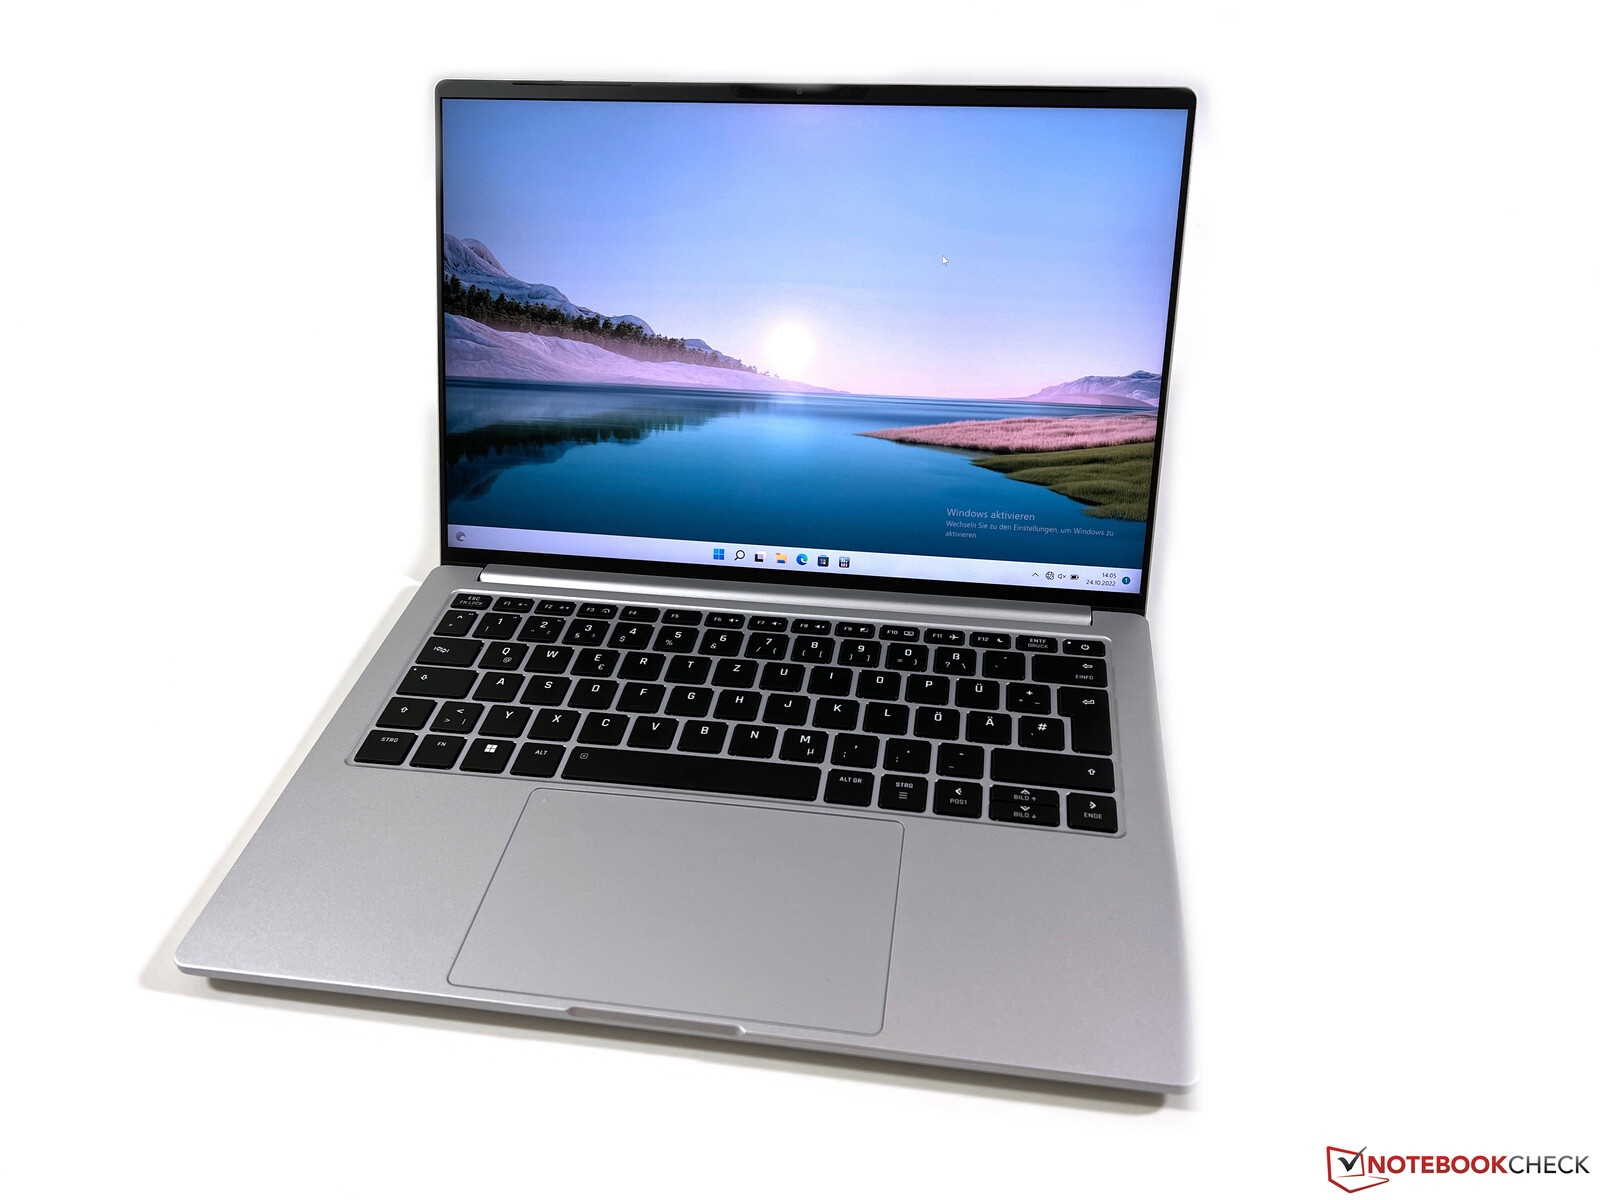
Schenker Vision 14 Laptop in review - Massive Core i7-12700H performance upgrade
Last year, Schenker released a very exciting 14-inch laptop that shines with extreme portability thanks to its low weight of just above 1 kg (2.2 lbs) called the Vision 14, while not compromising in terms of a good port selection or performance. Earlier this year, the device was refreshed with an Intel Tiger Lake-H35 processor including a more effective cooling solution that features liquid metal as well as a dedicated GeForce RTX 3050 Ti GPU option. Our main qualms with the aforementioned laptop were the mediocre performance of the 11th gen Intel processor and the relatively short battery life.
Although Schenker announced the Vision 14 refresh a couple of months ago, we just now got the chance to review it due to supply chain issues. Contrary to our first impression, the new device is a fairly major upgrade that also comes with a massive 99-Wh battery option and required certain changes to the interal layout. Additionally, the older quad-core processor from the Tiger Lake generation has been replaced by an up-to-date Alder Lake model. Unlike most other devices in this category, Schenker did not opt for an Alder Lake-P processor (28W TDP) and instead went with the 45-watt processor Core i7-12700H.
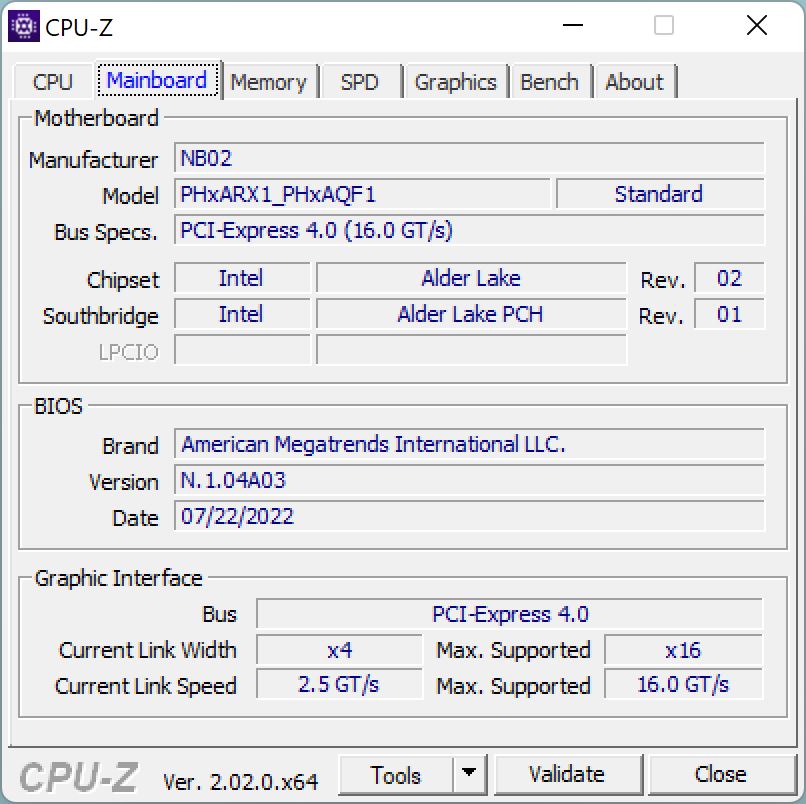
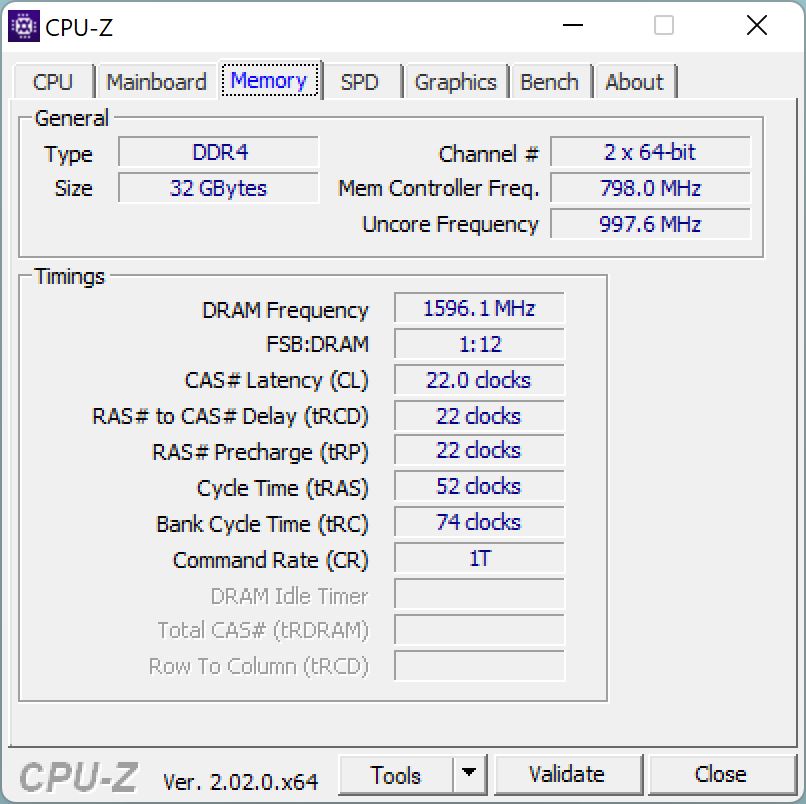
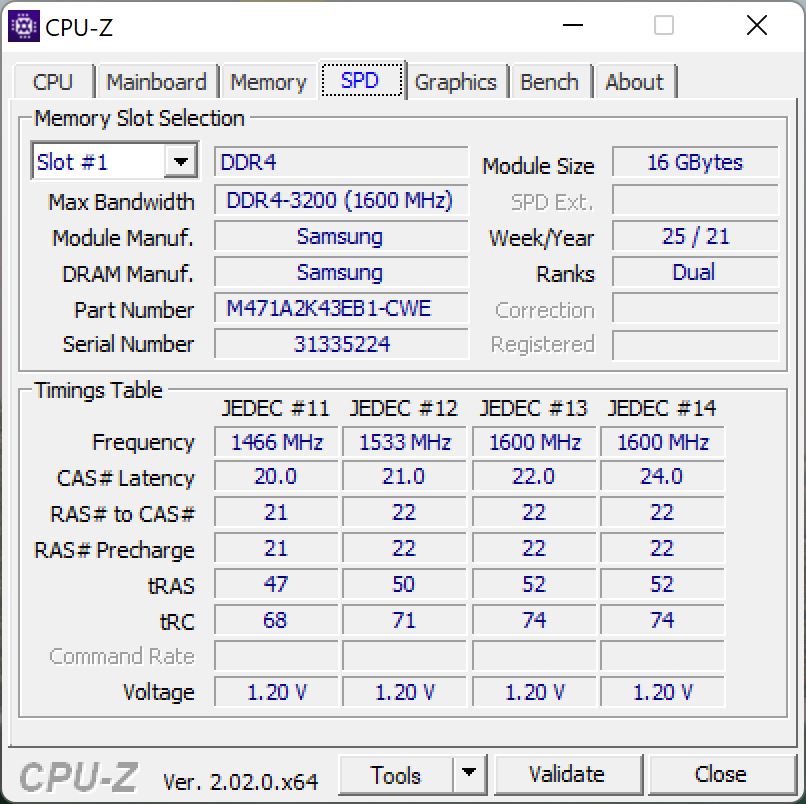
We received two versions of the Vision 14 courtesy of Schenker; one with and one without the dedicated GeForce GPU. Since they are otherwise identical (Core i7-12700H, 3K panel, 99-Wh battery), we will list the small differences in this review instead of reviewing both devices separately. The new Vision 14 with an iGPU starts at ~1659 USD, while the RTX 3050 Ti model can be purchased starting from around 1931 USD. The models can be configured with a wide range of available RAM and SSD options; our test device comes with 32 GB of RAM and a 1-TB PCIe-4.0 SSD (Samsung 980 Pro) for about 2200 USD.
Potential Competitors in Comparison
Rating | Date | Model | Weight | Height | Size | Resolution | Best Price |
|---|---|---|---|---|---|---|---|
| 88.8 % | 10/2022 | SCHENKER Vision 14 2022 RTX 3050 Ti i7-12700H, GeForce RTX 3050 Ti Laptop GPU | 1.3 kg | 16.6 mm | 14.00" | 2880x1800 | |
| 90.3 % | 09/2022 | Huawei MateBook X Pro 2022 i7-1260P, Iris Xe G7 96EUs | 1.3 kg | 15.6 mm | 14.20" | 3120x2080 | |
| 90.6 % | 05/2022 | Lenovo Yoga 9i 14 2022 i7-1260P i7-1260P, Iris Xe G7 96EUs | 1.4 kg | 15.25 mm | 14.00" | 3840x2400 | |
| 87.2 % | 08/2022 | Dell Inspiron 14 Plus 7420 i7-12700H, GeForce RTX 3050 4GB Laptop GPU | 1.7 kg | 18.87 mm | 14.00" | 2240x1400 | |
| 86.3 % | 07/2022 | Asus Vivobook Pro 14 M3401QC-KM007T R5 5600H, GeForce RTX 3050 4GB Laptop GPU | 1.5 kg | 19 mm | 14.00" | 2880x1800 | |
| 92.7 % | 11/2021 | Apple MacBook Pro 14 2021 M1 Pro Entry M1 Pro 8-Core, M1 Pro 14-Core GPU | 1.6 kg | 15.5 mm | 14.20" | 3024x1964 |
Case - Magnesium Vision 14 in Two Colors
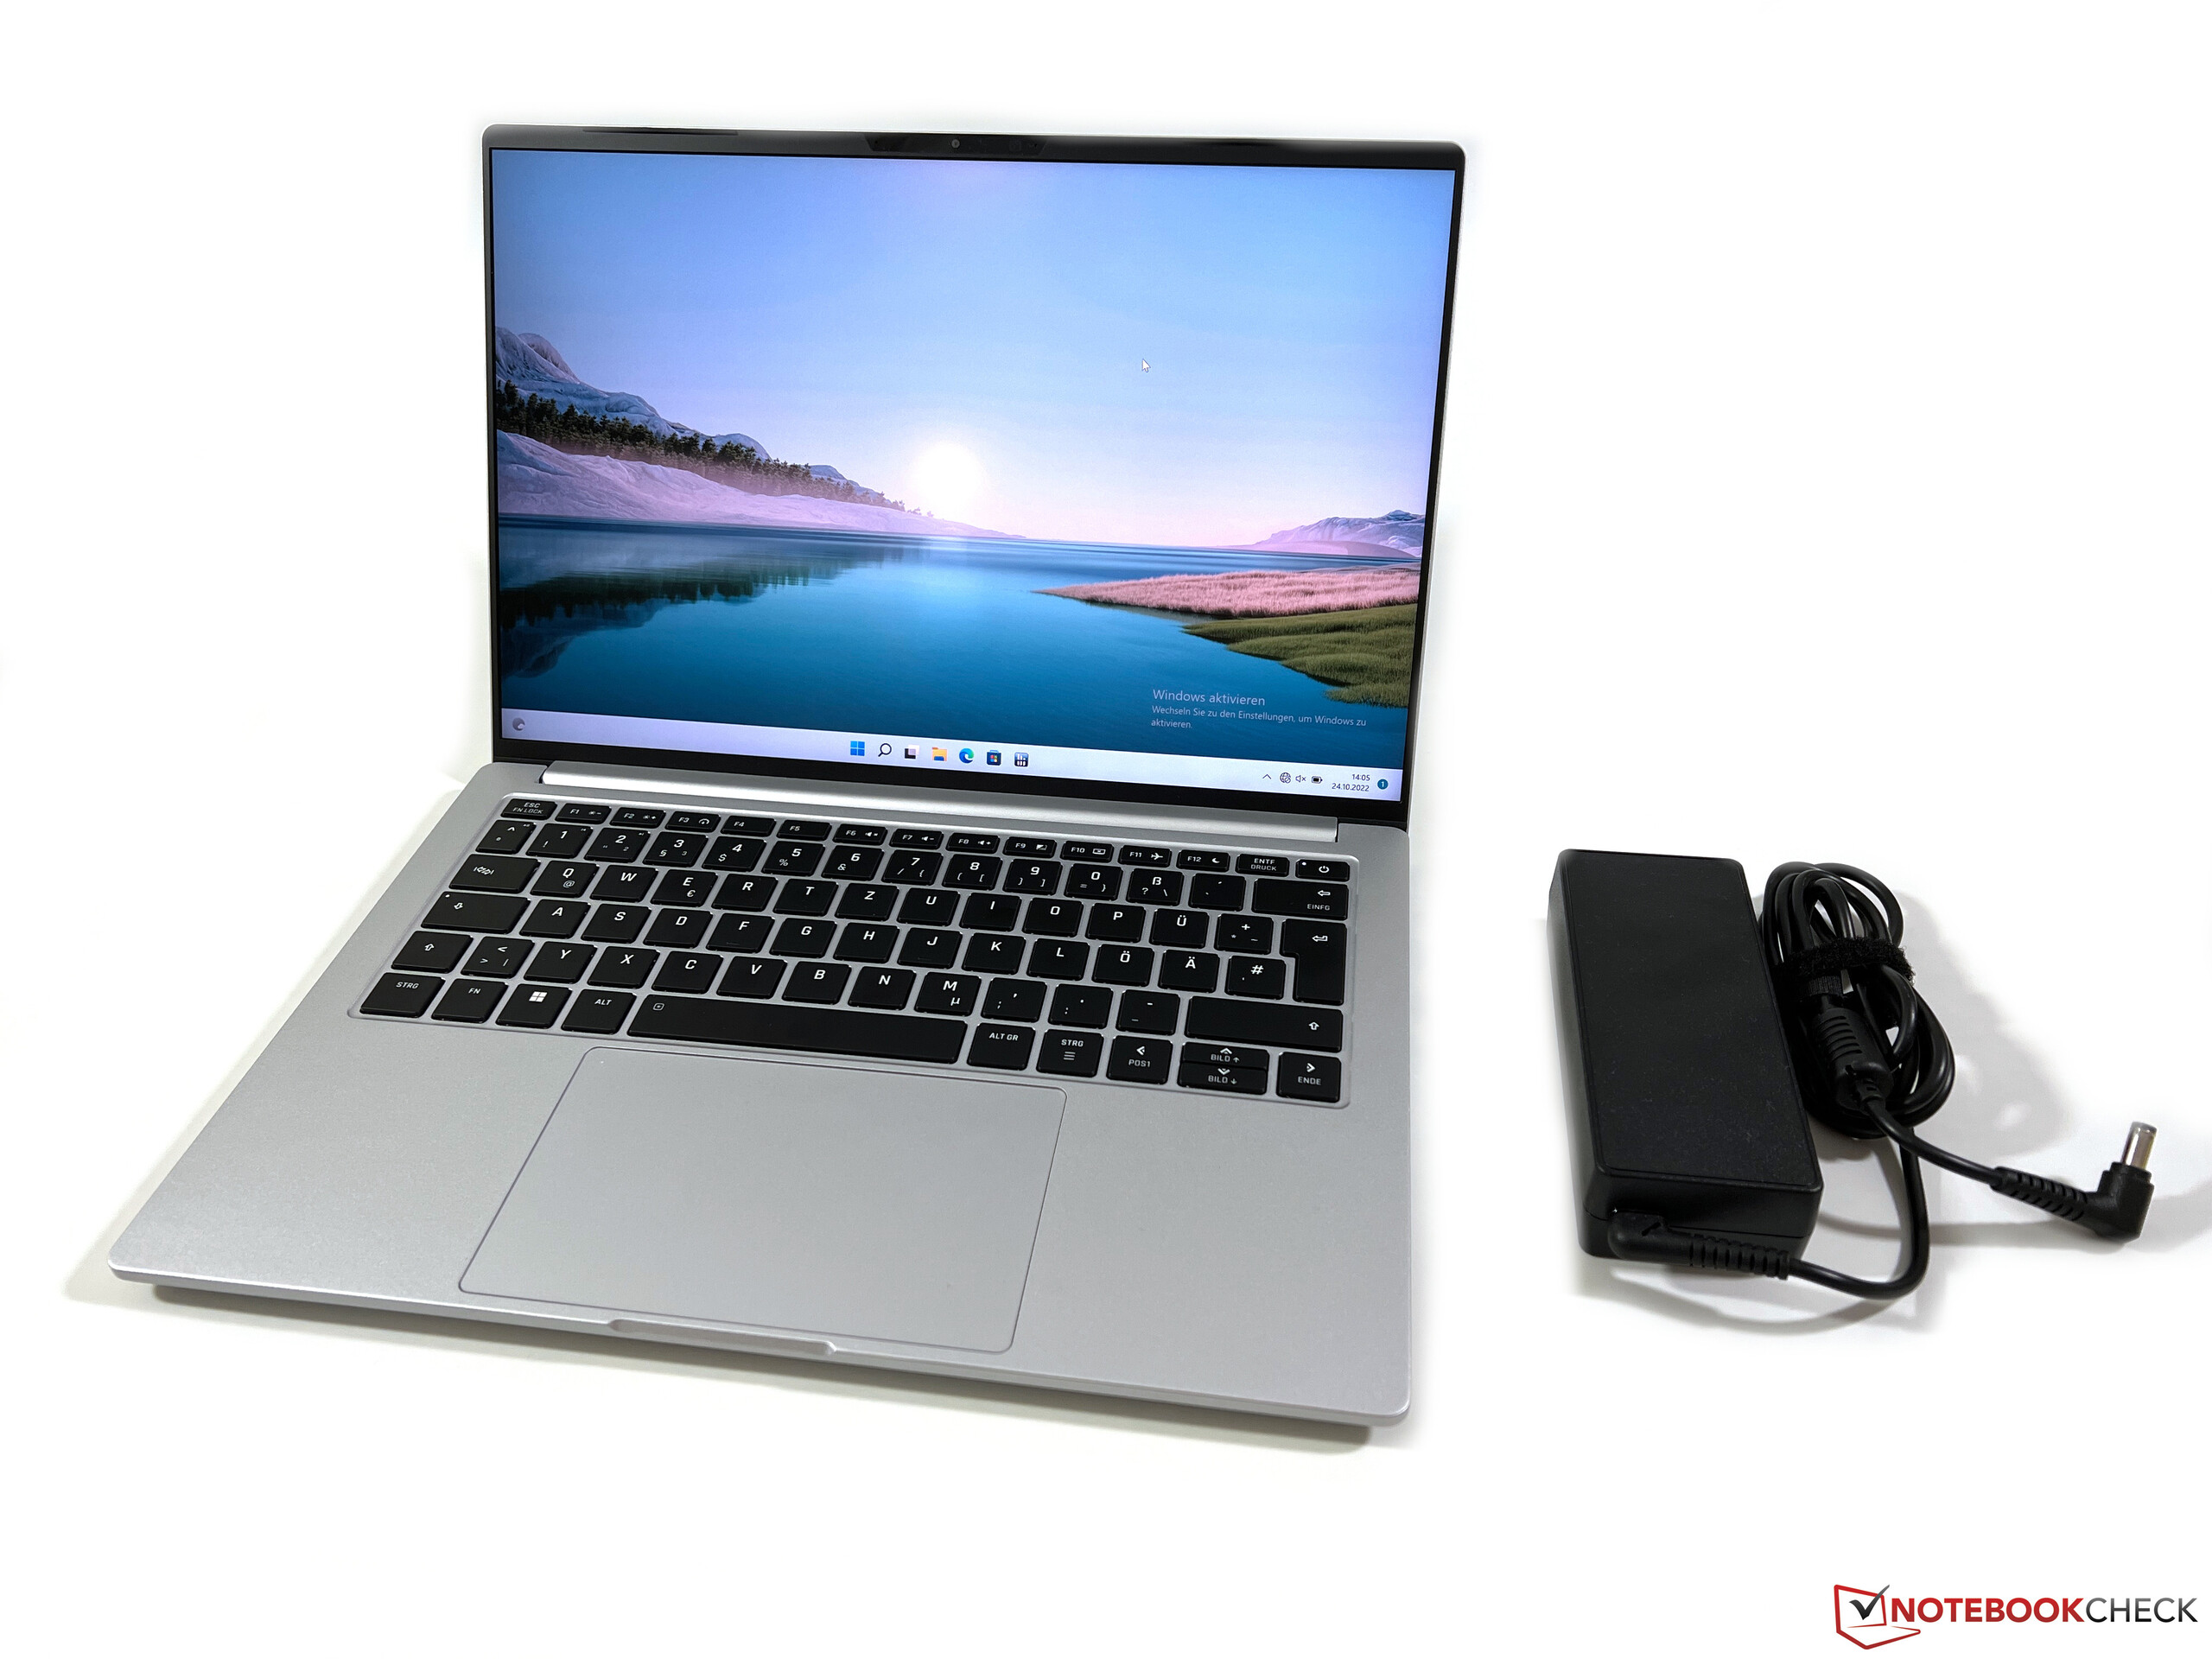
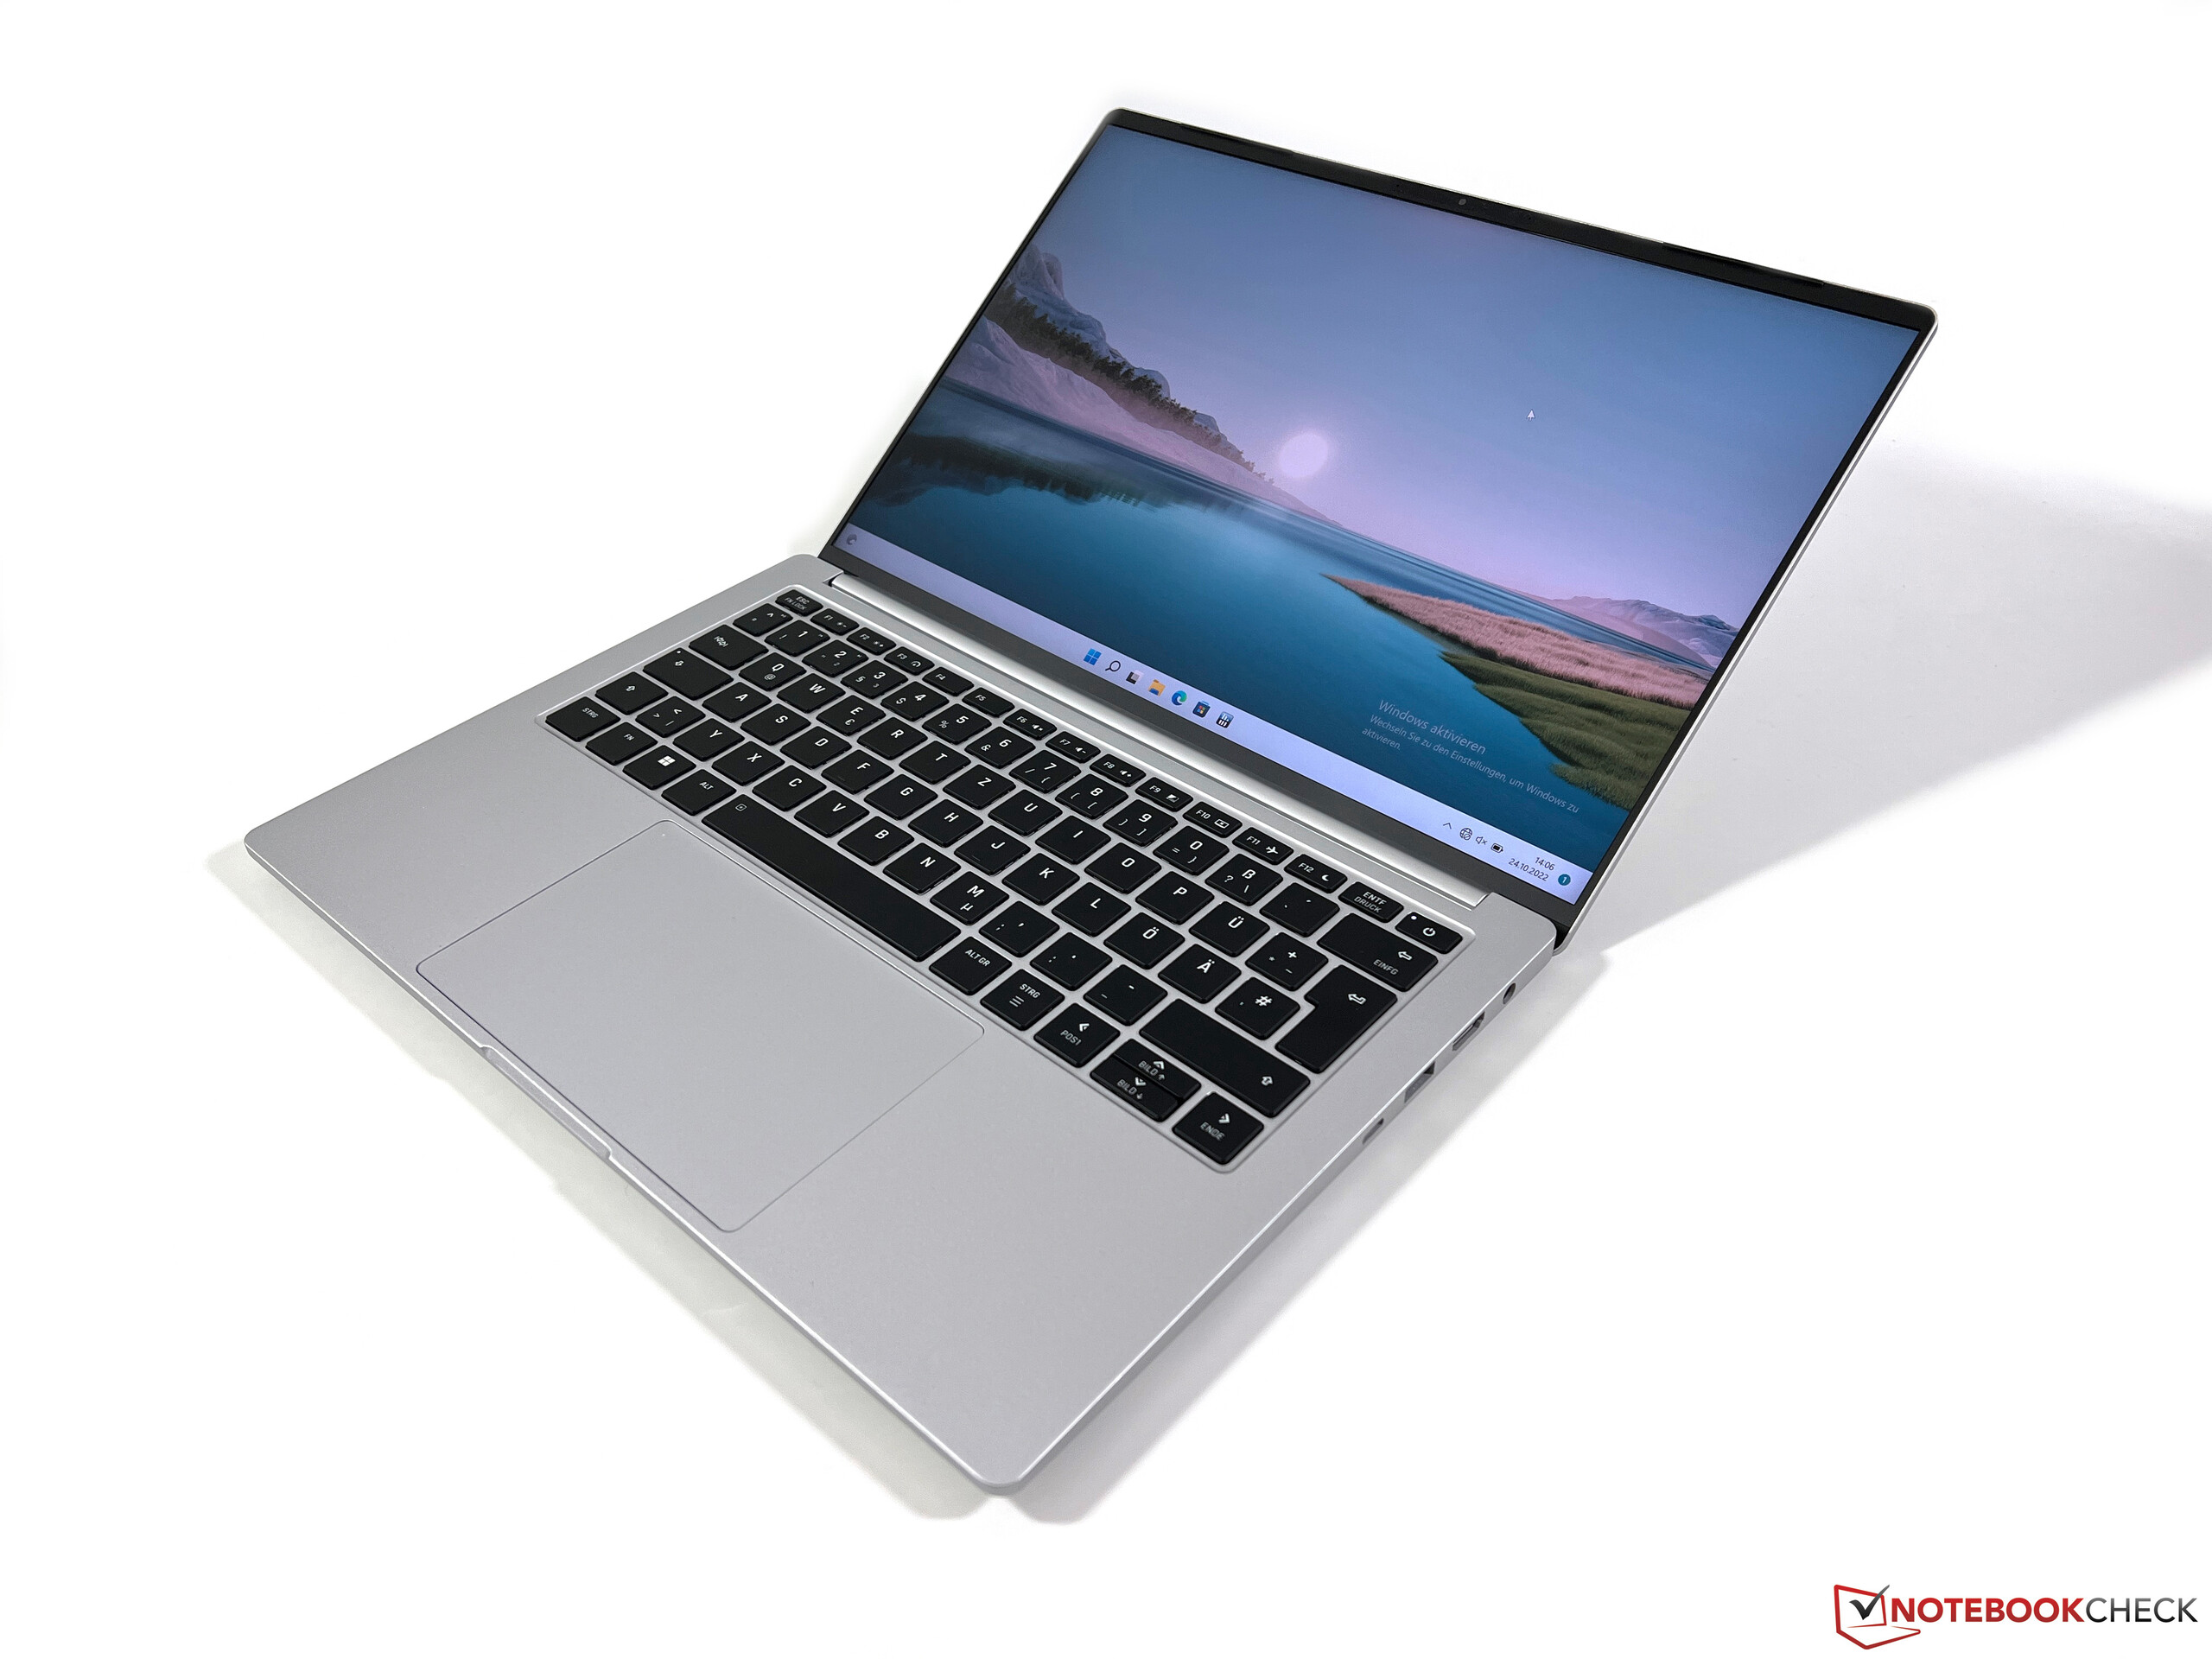
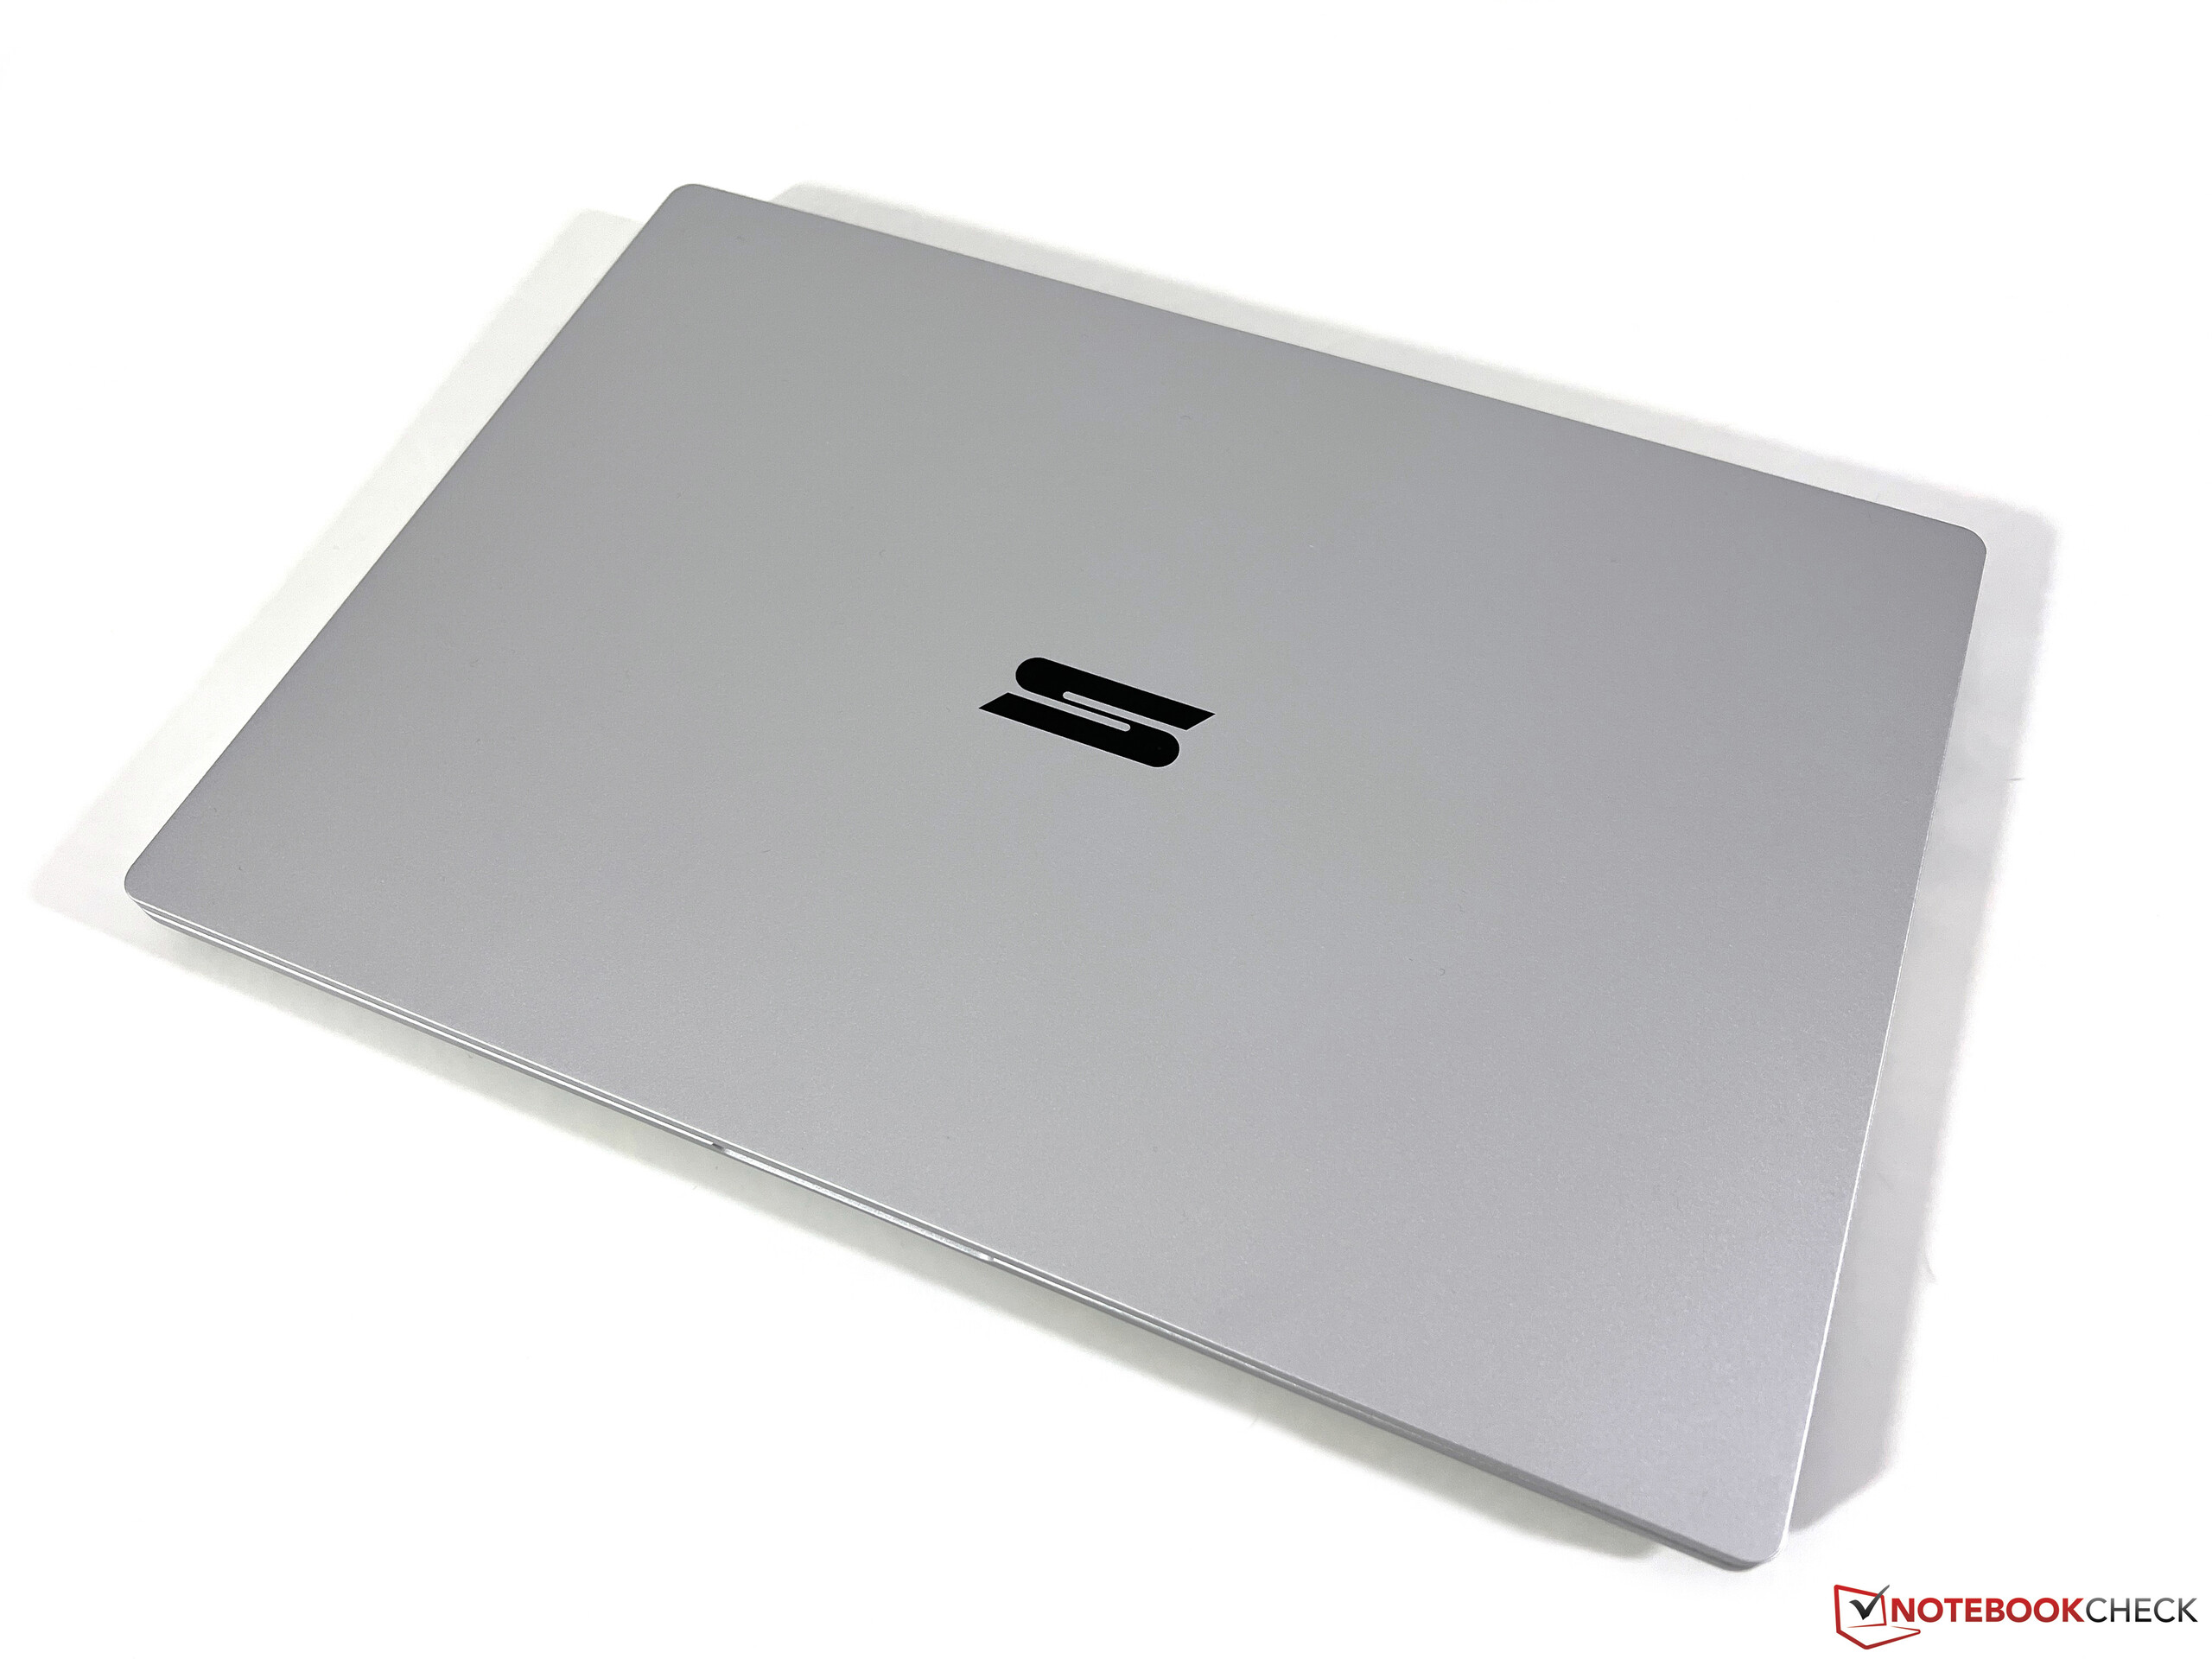
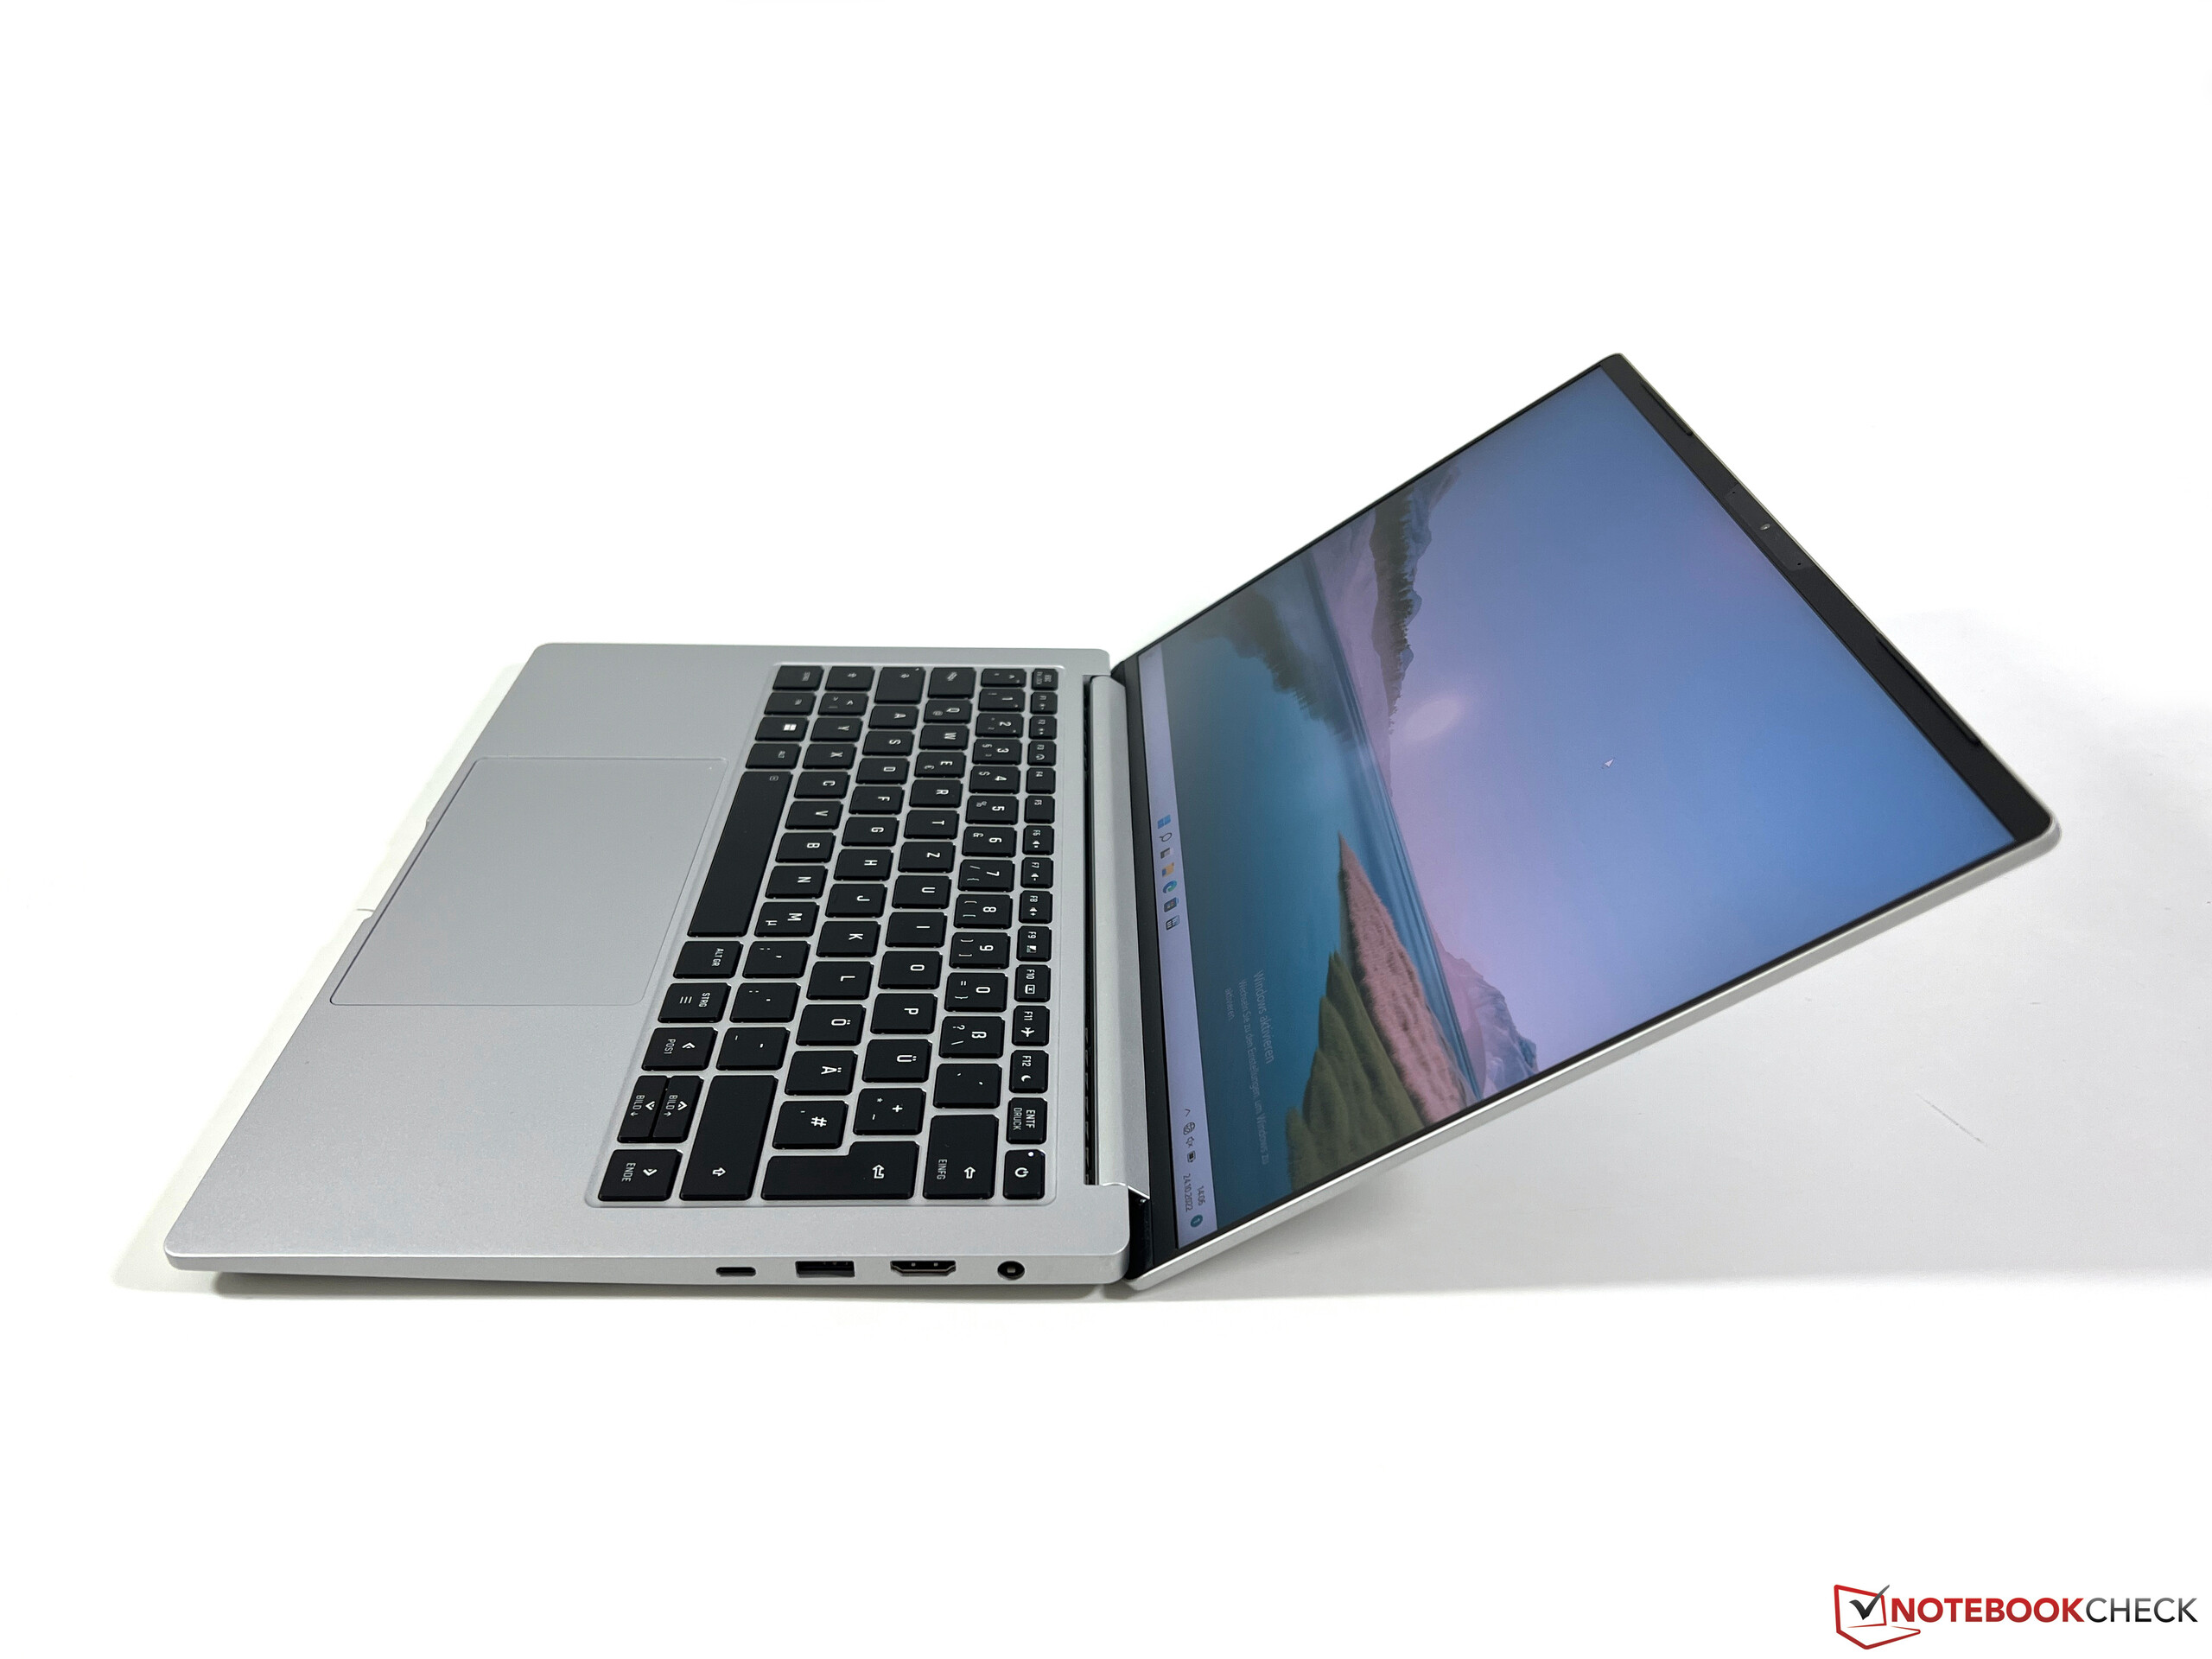
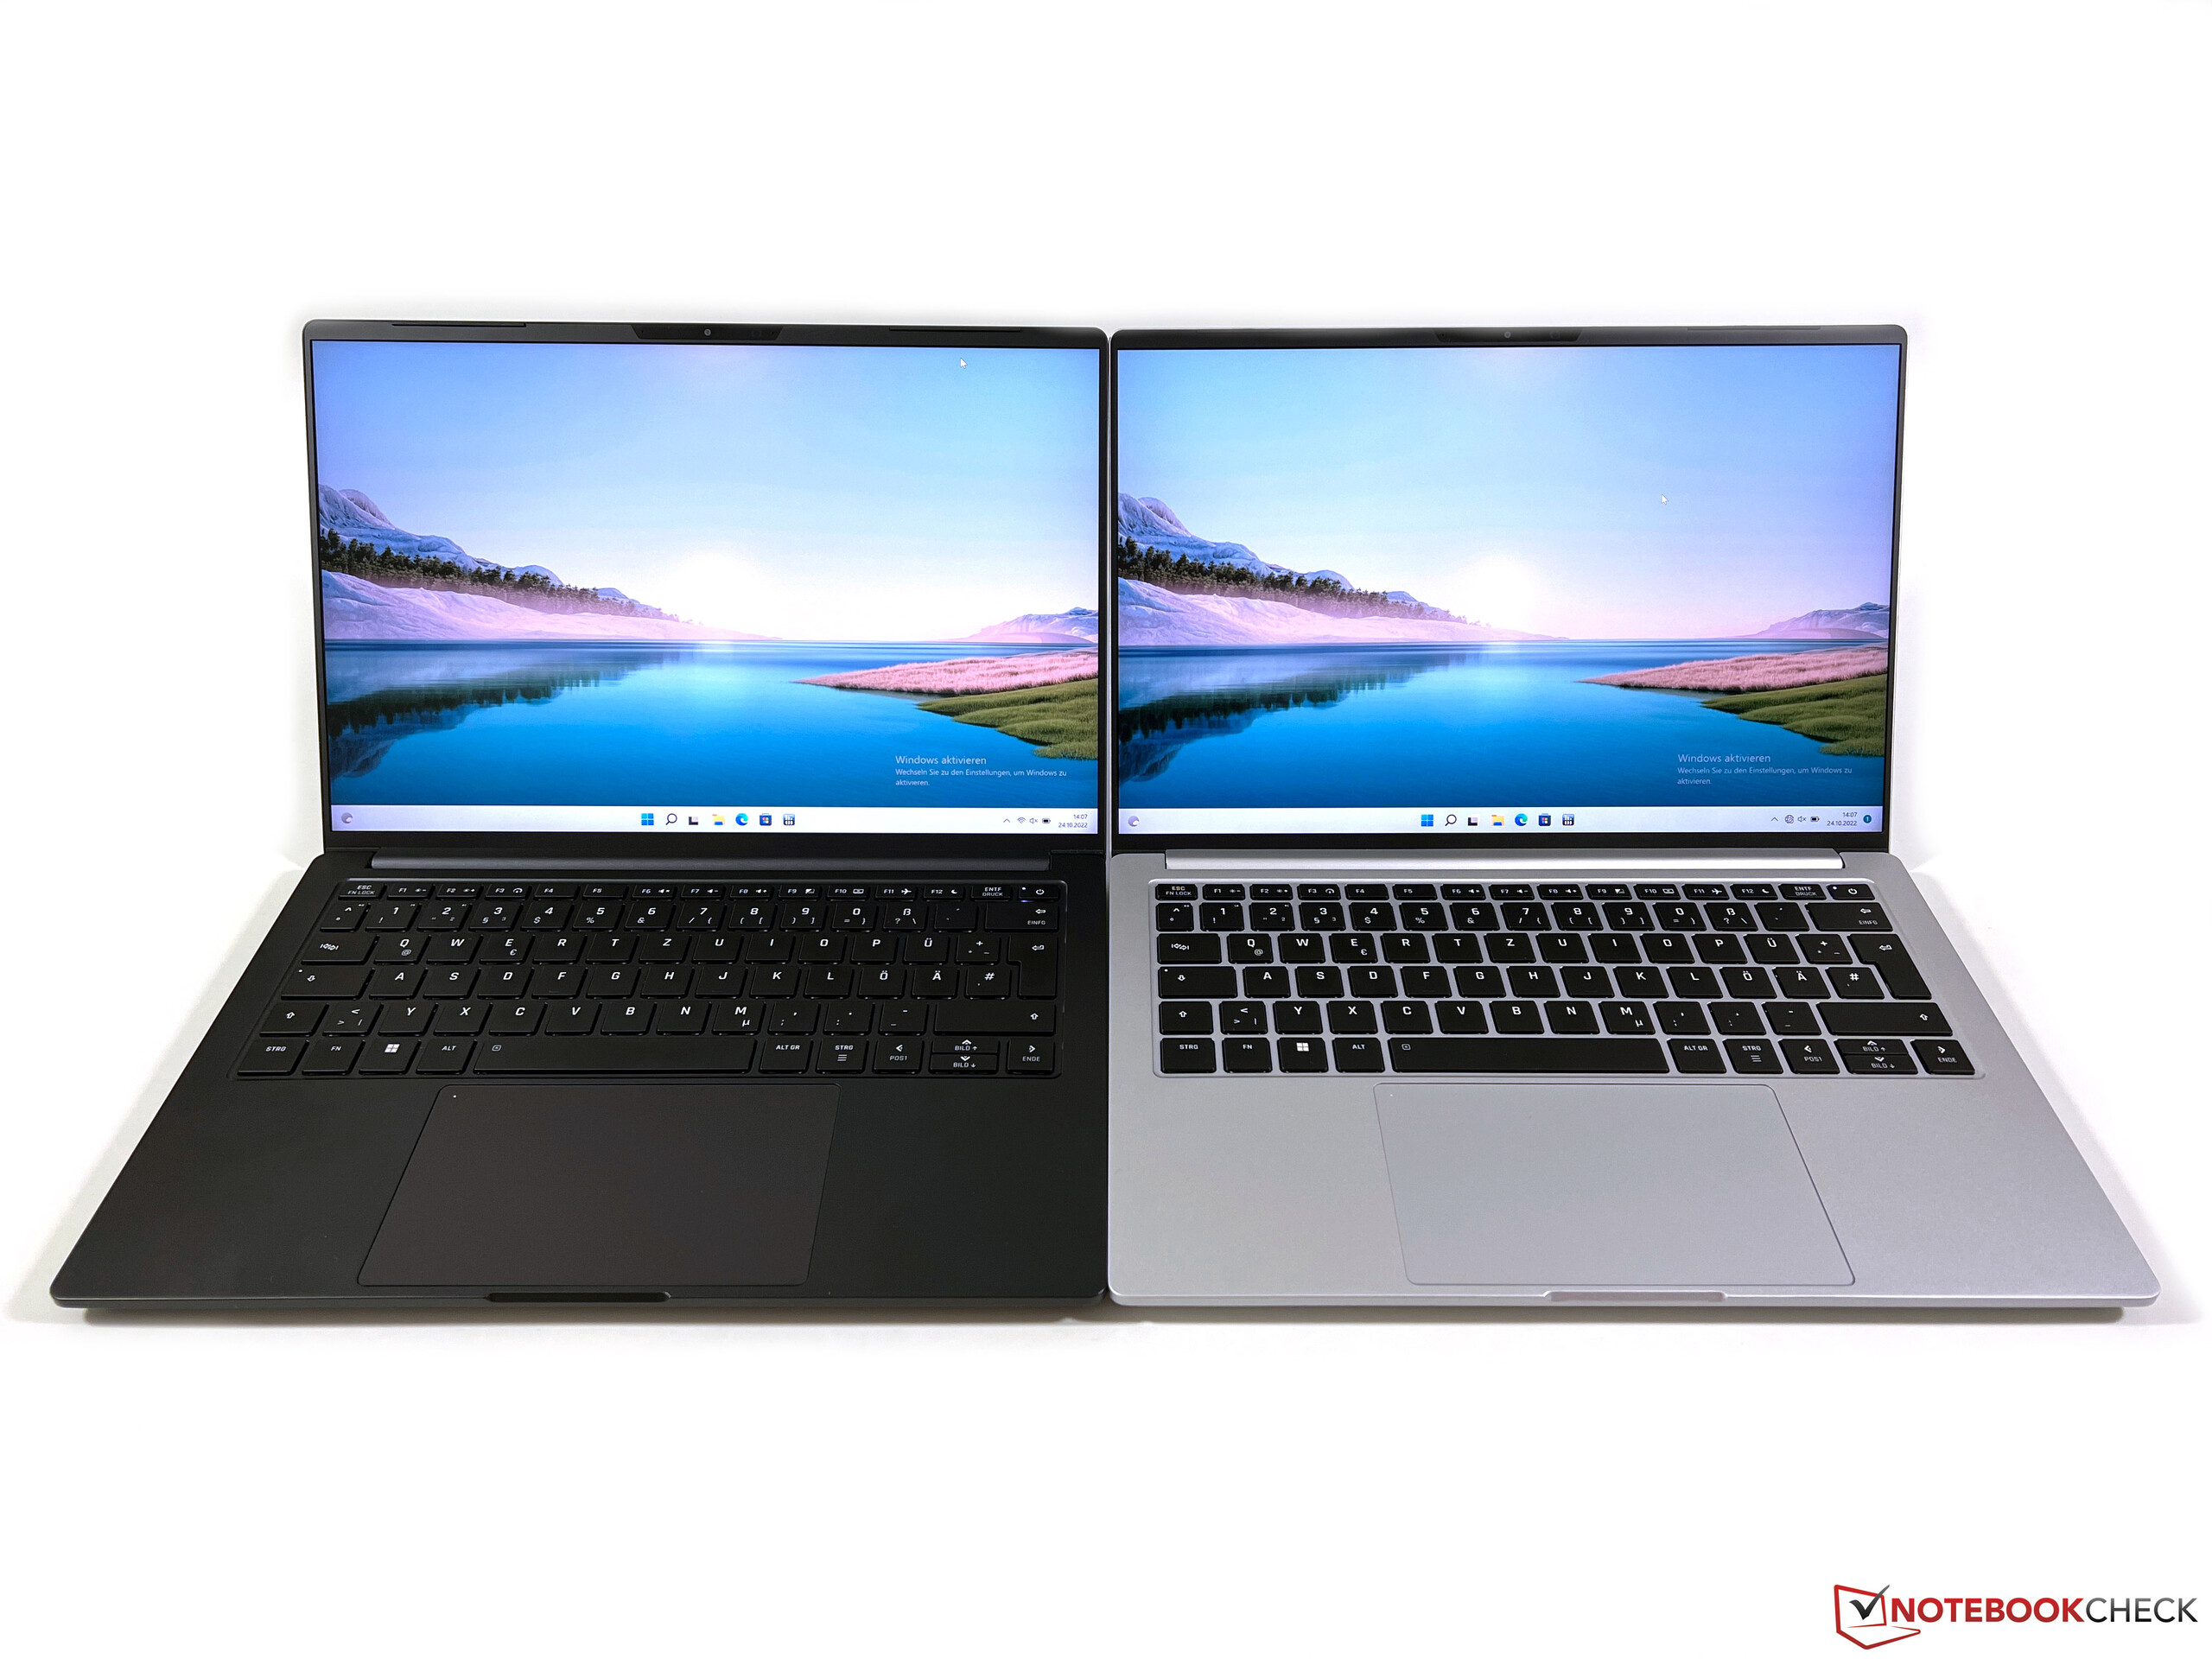
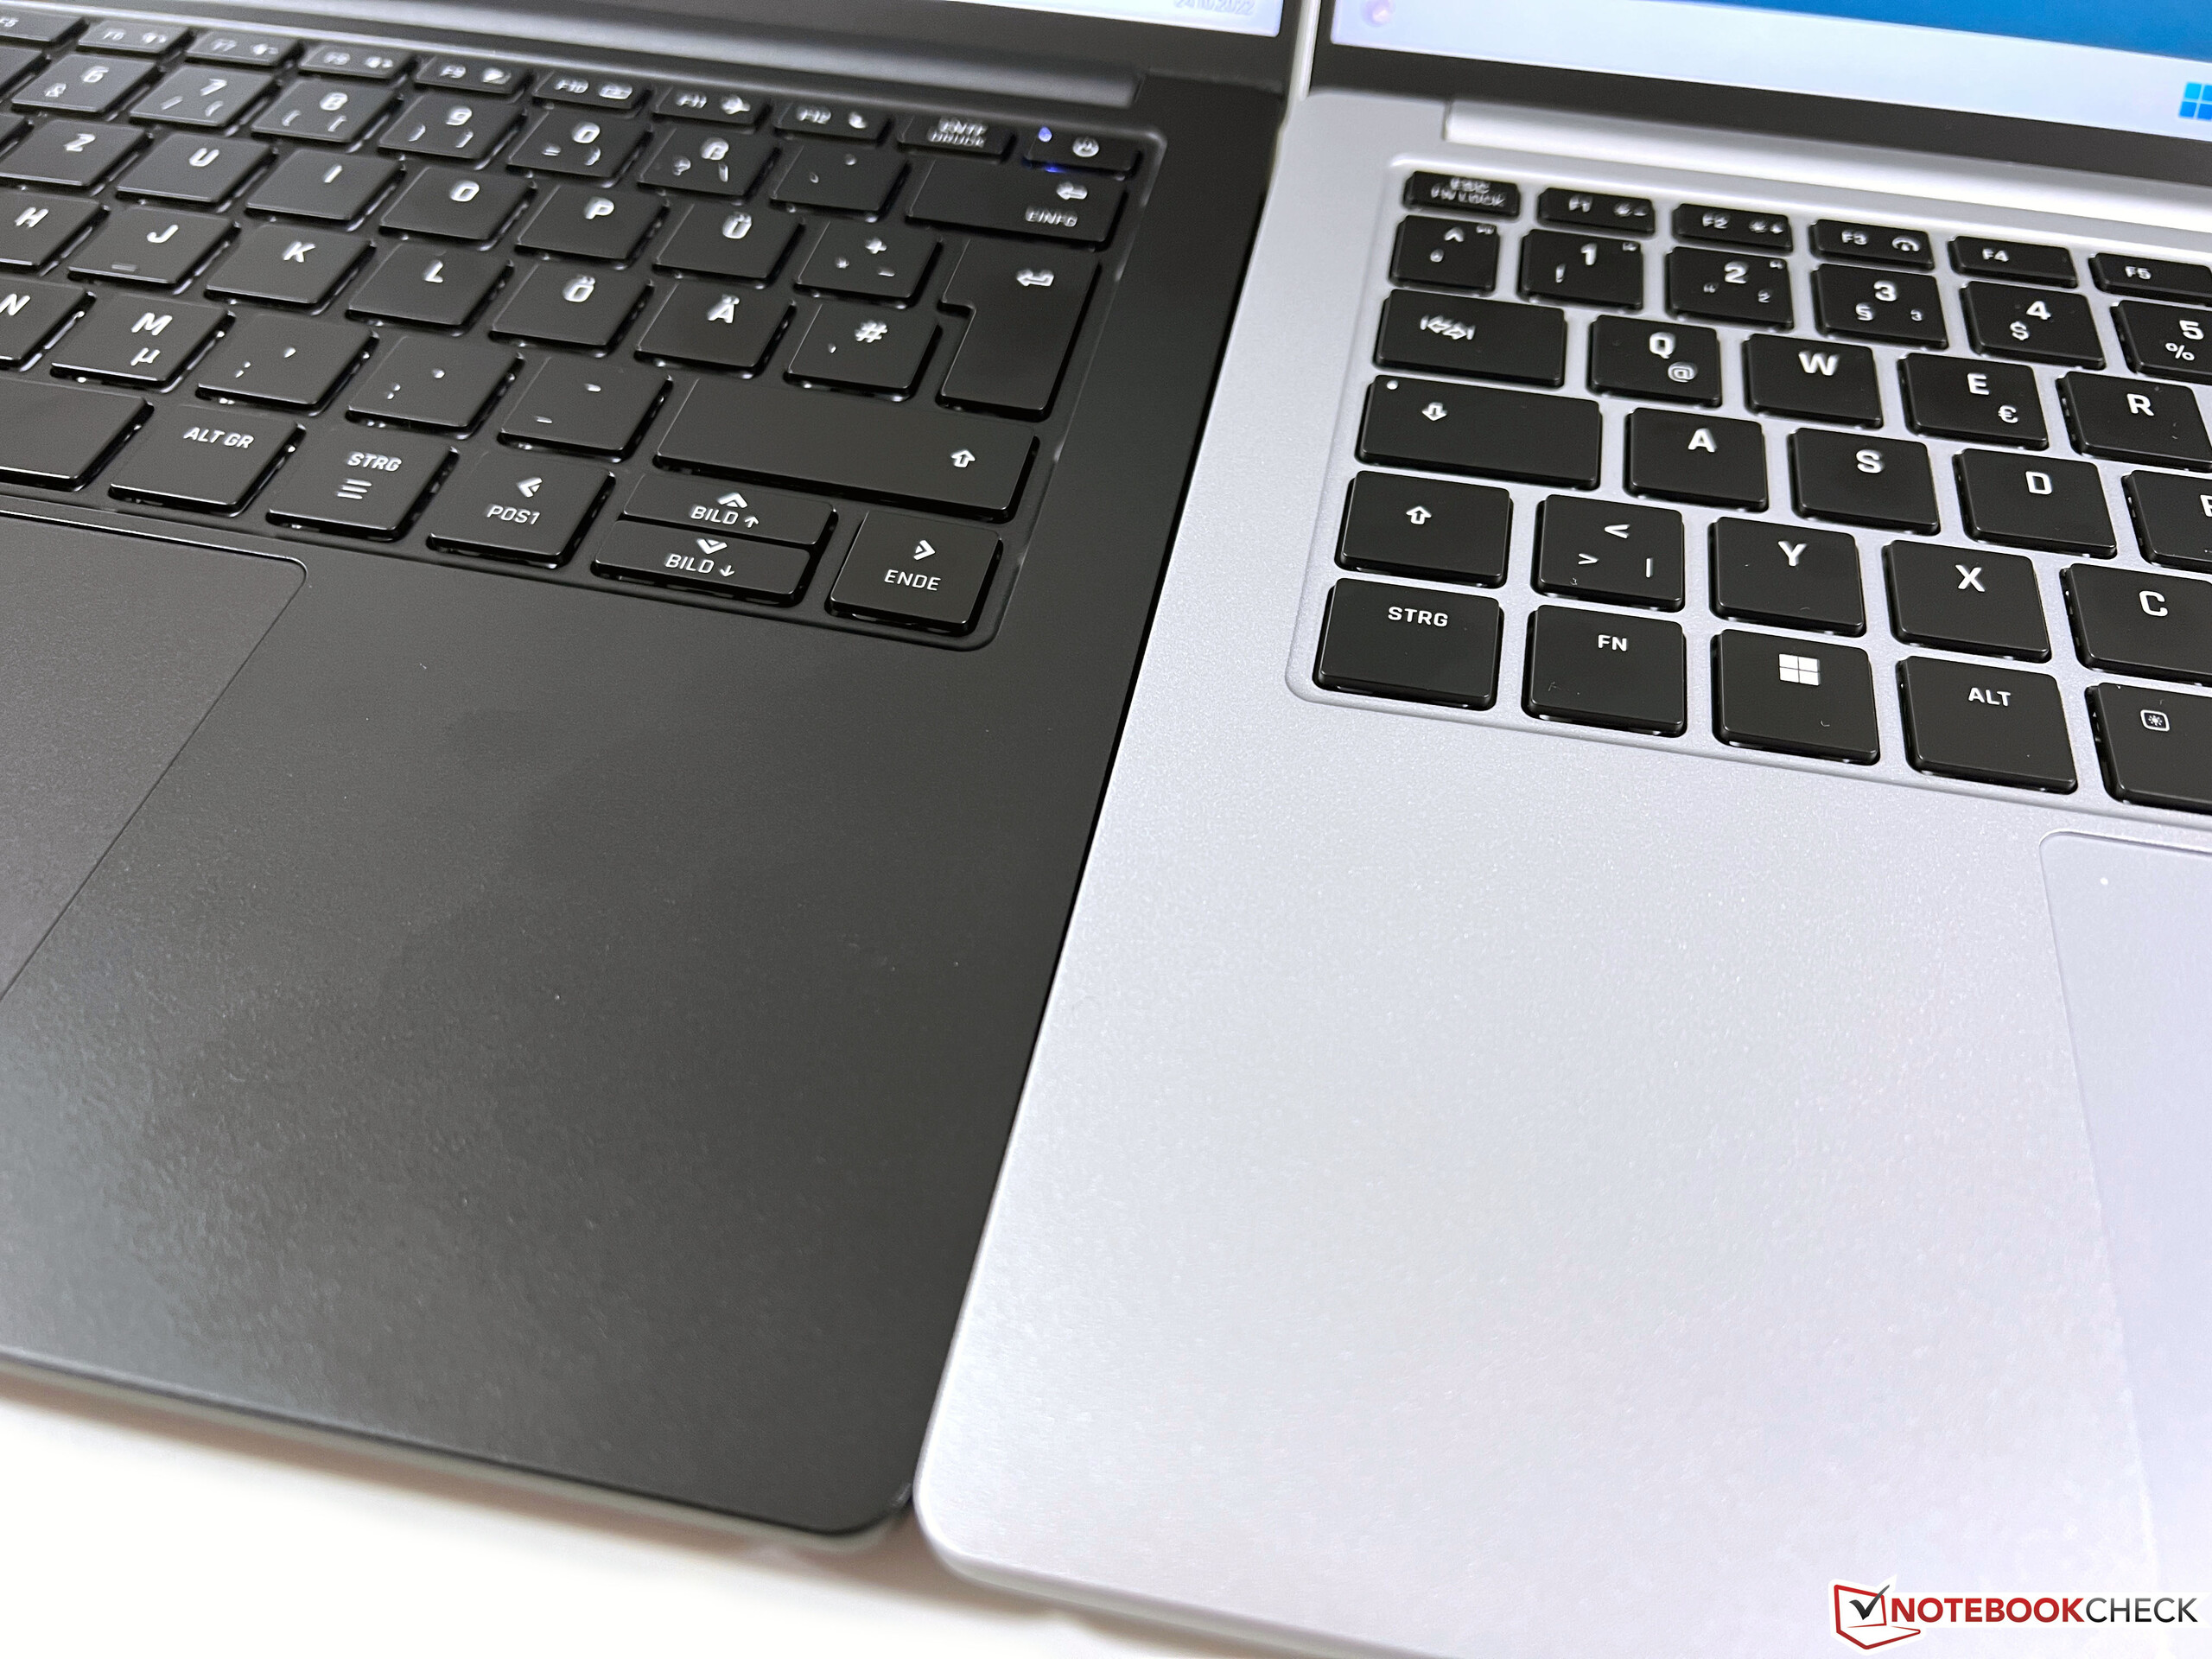
The overall design of the Schenker Vision 14 has remained unchanged and there are black and silver models available. While the display bezels consist of plastic, the remaining parts (lid, base unit) are made of a magnesium alloy. The rigidity continues to be excellent, but the screen is very thin, which makes it quite flexible as evidenced by the distortions that occur when applying focused pressure on the back of the lid. During daily use, there are no limitations.
The hinge is still a weakness of the Vision 14. Although the firmness of the hinge has been improved (~0.32 Nm vs. 0.25 Nm on the predecessor) according to Schenker, there is still noticeable teetering when adjusting the angle (up to 160 degrees). Opening the display with one hand is possible on both the new and the old model. The silver version less susceptible to fingerprints and grease than the black model during daily use.
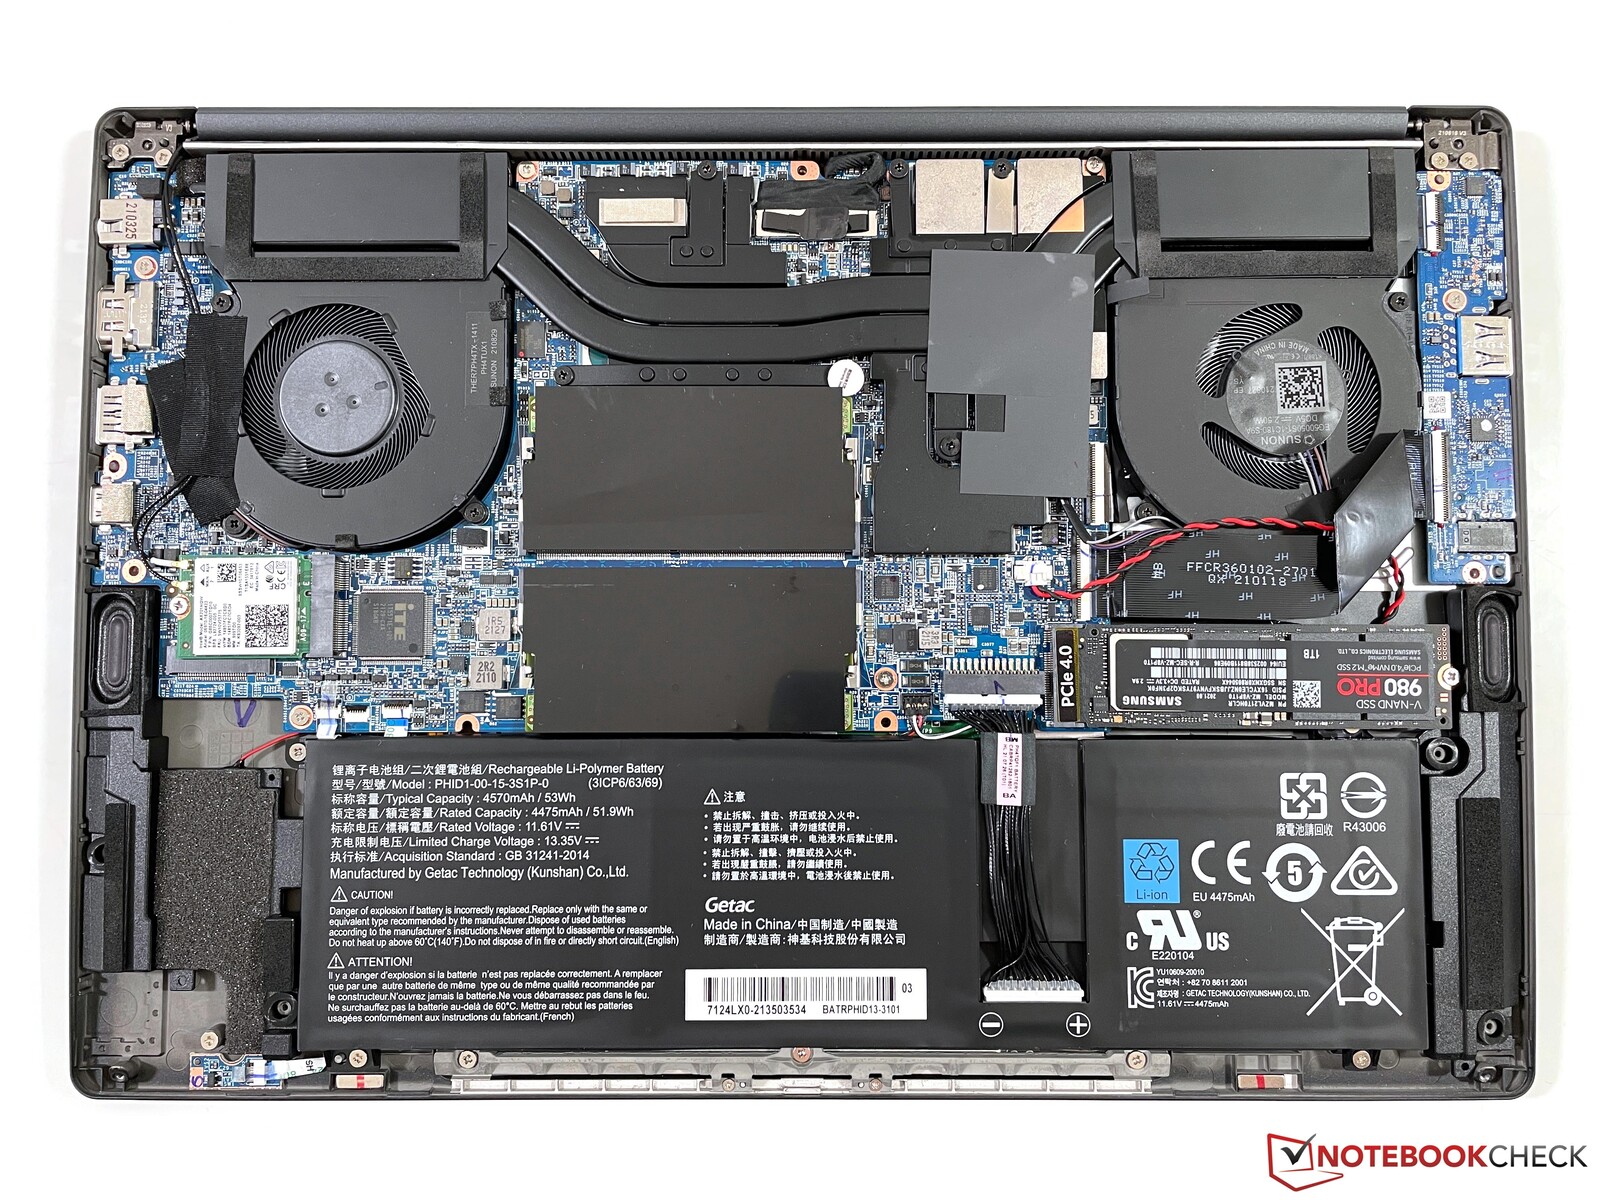
With a 99-Wh battery and a GeForce RTX 3050 Ti, our test device's weight of 1310 g (~2.89 lbs) exceeds that of its predecessor by almost 200 g (~0.44 lbs), which makes it the heaviest skew of the Vision 14. The lighter 53-Wh model (~1.1 kg / ~2.43 lbs). At 1269 g (~2.80 lbs), the 99-Wh variant of the Vision 14 without the RTX 3050 Ti is just marginally lighter. Meanwhile, the new 99-Wh models are also thicker by 1 mm (16.6 vs. 15.6 mm / 0.65 vs. 0.61 in).
Comparatively, even the highest configuration of our test device weighs noticeably less than other devices in our comparison with dedicated graphics cards. With 513 g (~1.13 lbs), the included AC adapter is relatively heavy.
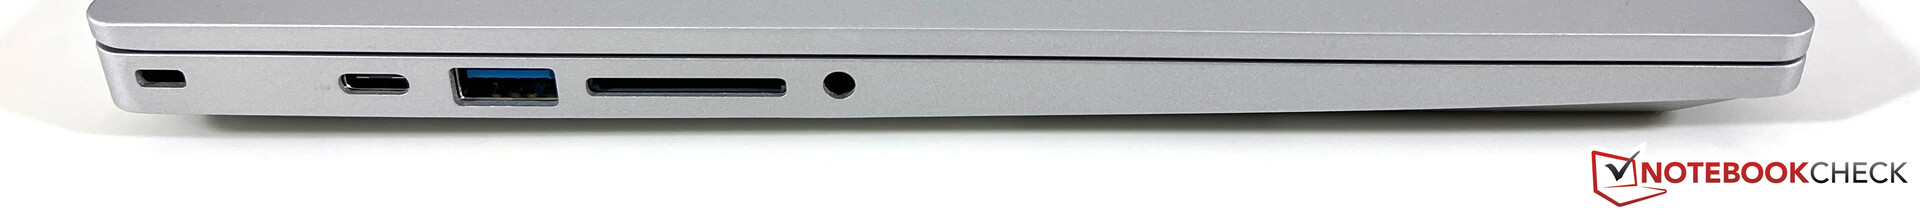
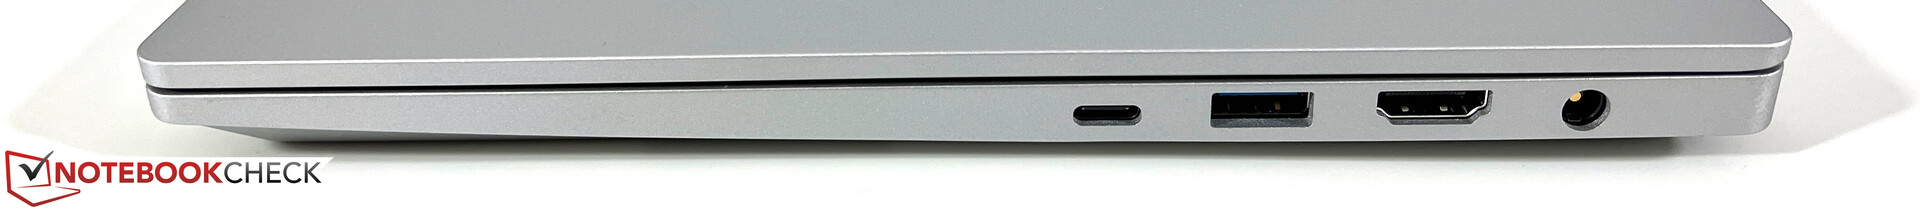
Connectivity - Vision 14 with Thunderbolt 4 and Card Reader
There have been no changes in terms of the connectivity, which means users continue to benefit from the same, generous port selection that includes Thunderbolt 4. A fullsize card reader is also available. Schenker still uses the Intel AX201 Wi-Fi module, which reaches good transfer speeds in our testing. Since the antenna setup of the Vision 14 does not support 6-GHz networks, Wi-Fi 6E modules (such as the AX211) are not available.
| SD Card Reader | |
| average JPG Copy Test (av. of 3 runs) | |
| Apple MacBook Pro 14 2021 M1 Pro Entry (AV PRO V60) | |
| SCHENKER Vision 14 (Angelbird AV Pro V60) | |
| Average of class Subnotebook (18.9 - 193.9, n=17, last 2 years) | |
| SCHENKER Vision 14 2022 RTX 3050 Ti | |
| Asus Vivobook Pro 14 M3401QC-KM007T (AV Pro SD microSD 128 GB V60) | |
| Dell Inspiron 14 Plus 7420 (AV PRO microSD 128 GB V60) | |
| maximum AS SSD Seq Read Test (1GB) | |
| SCHENKER Vision 14 (Angelbird AV Pro V60) | |
| Average of class Subnotebook (23.6 - 239, n=17, last 2 years) | |
| SCHENKER Vision 14 2022 RTX 3050 Ti | |
| Asus Vivobook Pro 14 M3401QC-KM007T (AV Pro SD microSD 128 GB V60) | |
| Dell Inspiron 14 Plus 7420 (AV PRO microSD 128 GB V60) | |
Webcam
The sensor of the webcam has been upgraded from the older 720p to a 1080p version. This slightly improves the image sharpness, while keeping the color deviations fairly low overall.


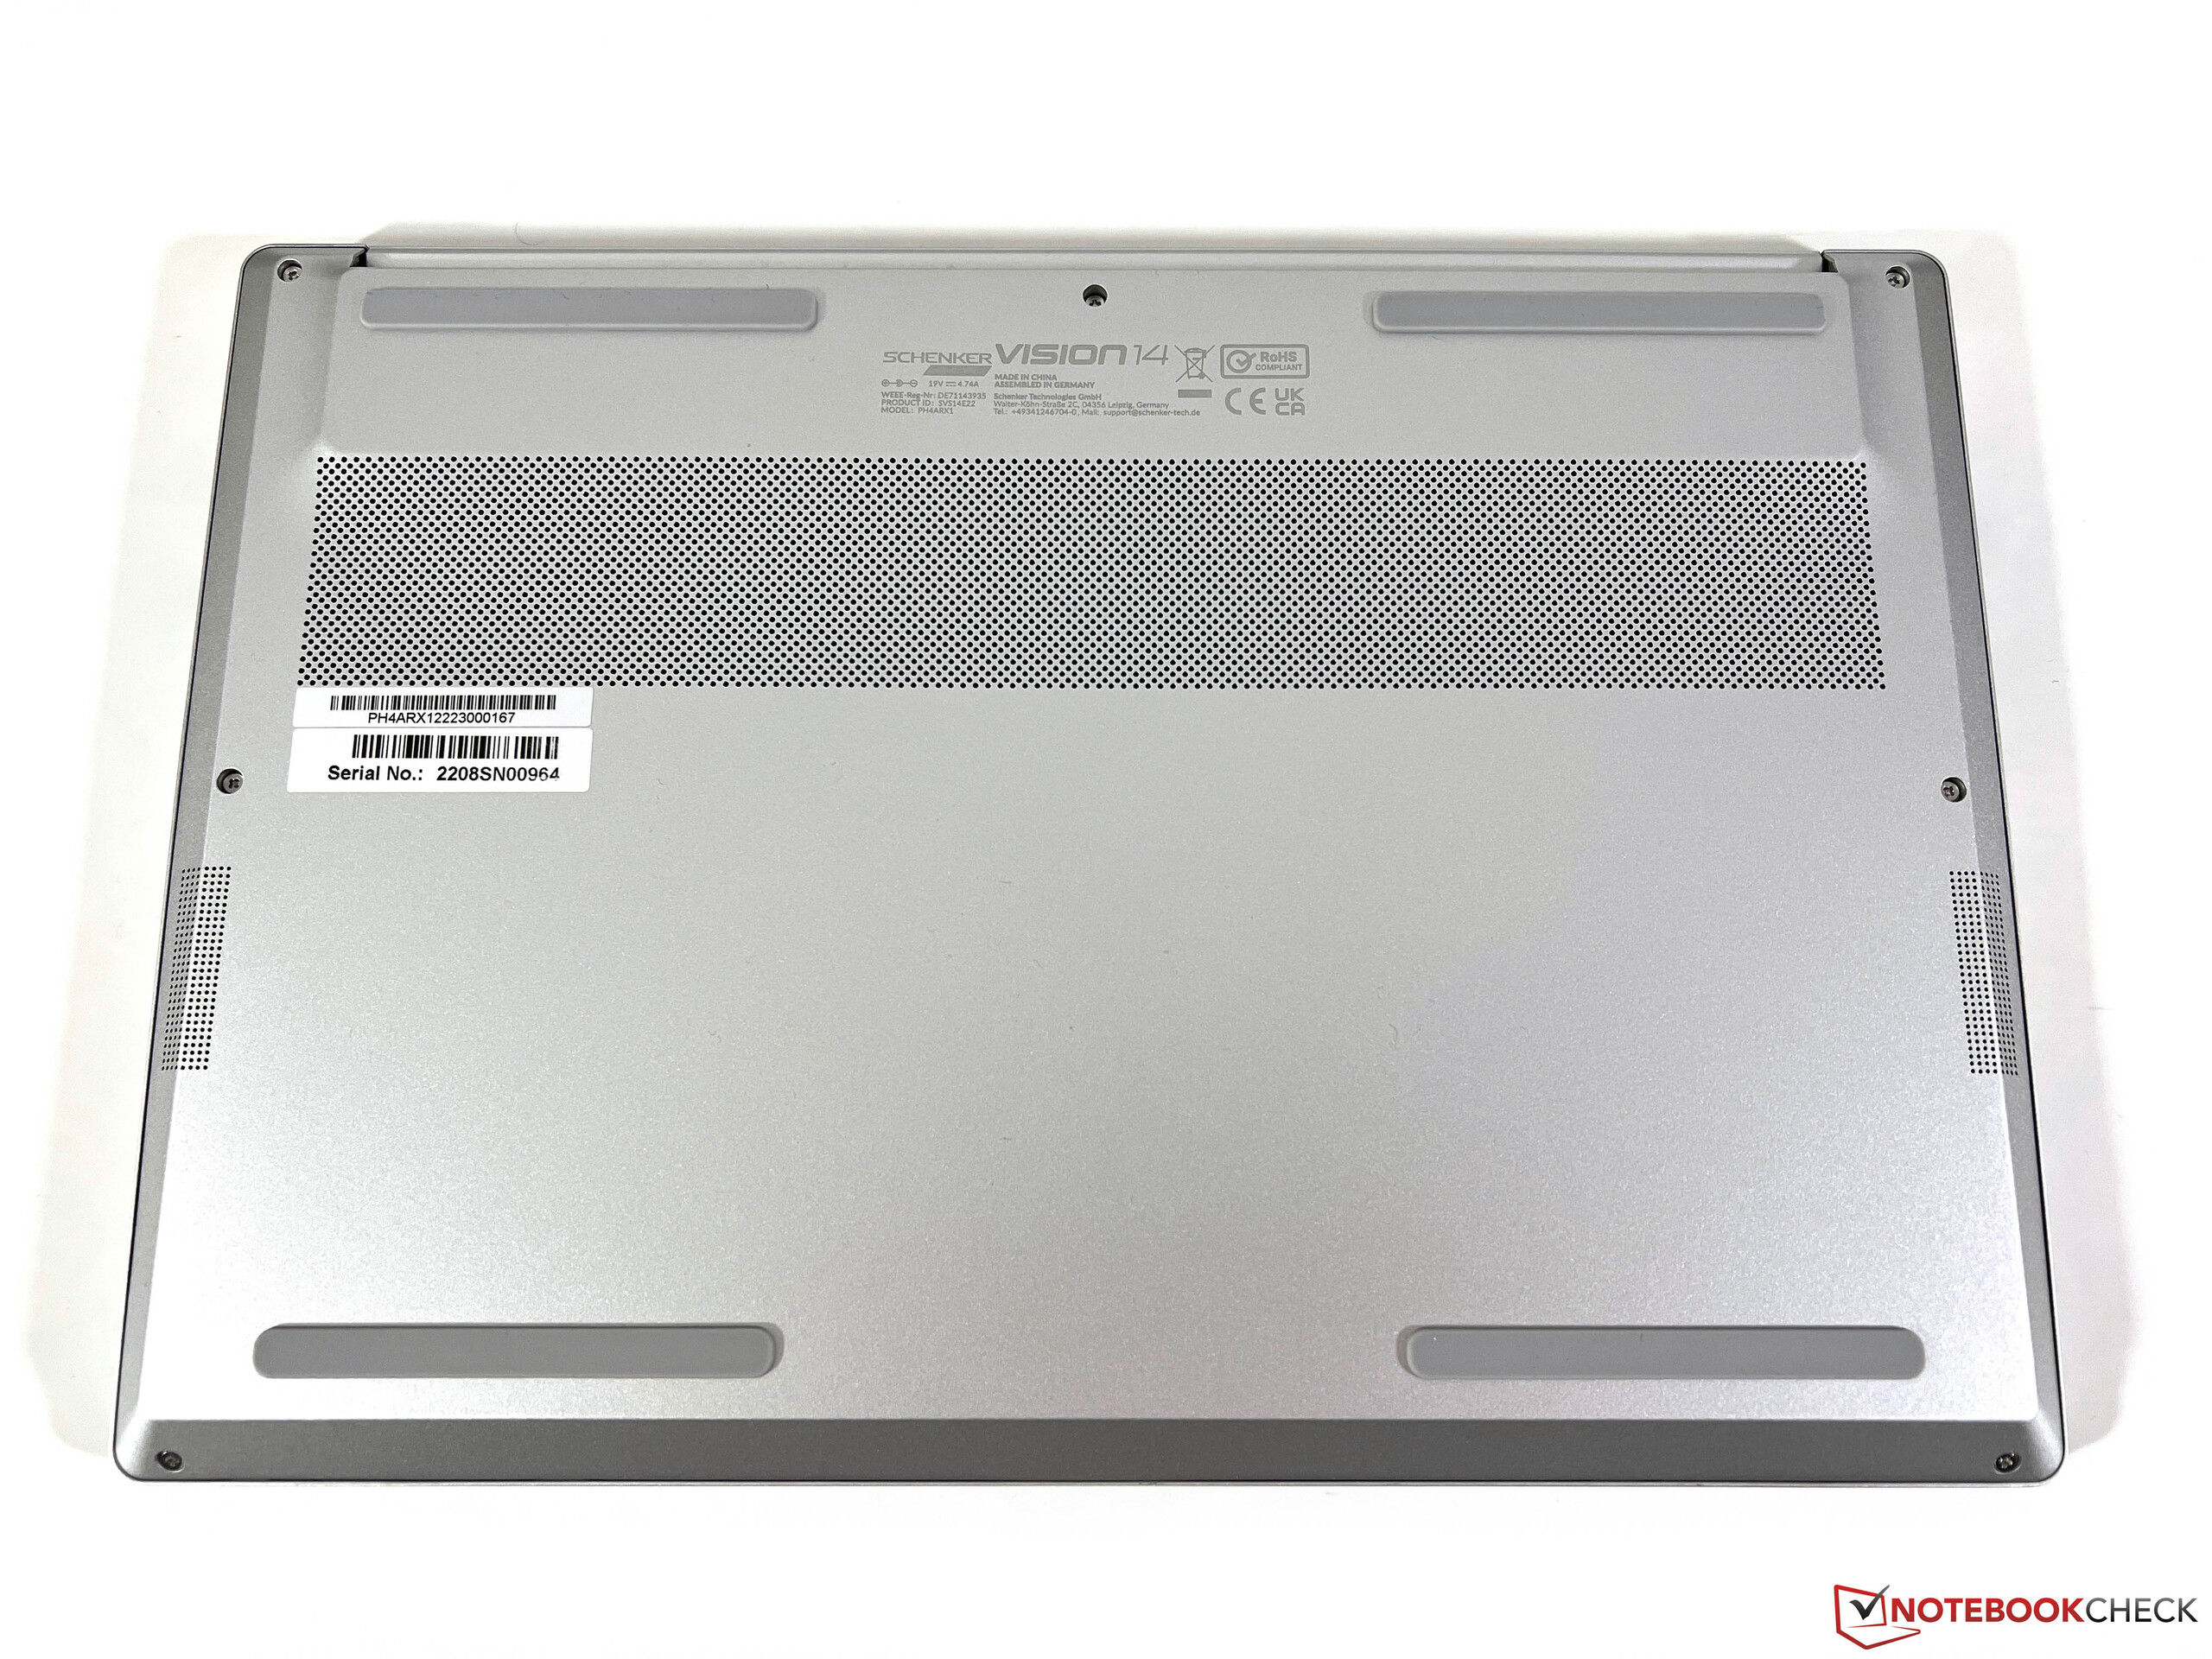
Maintenance
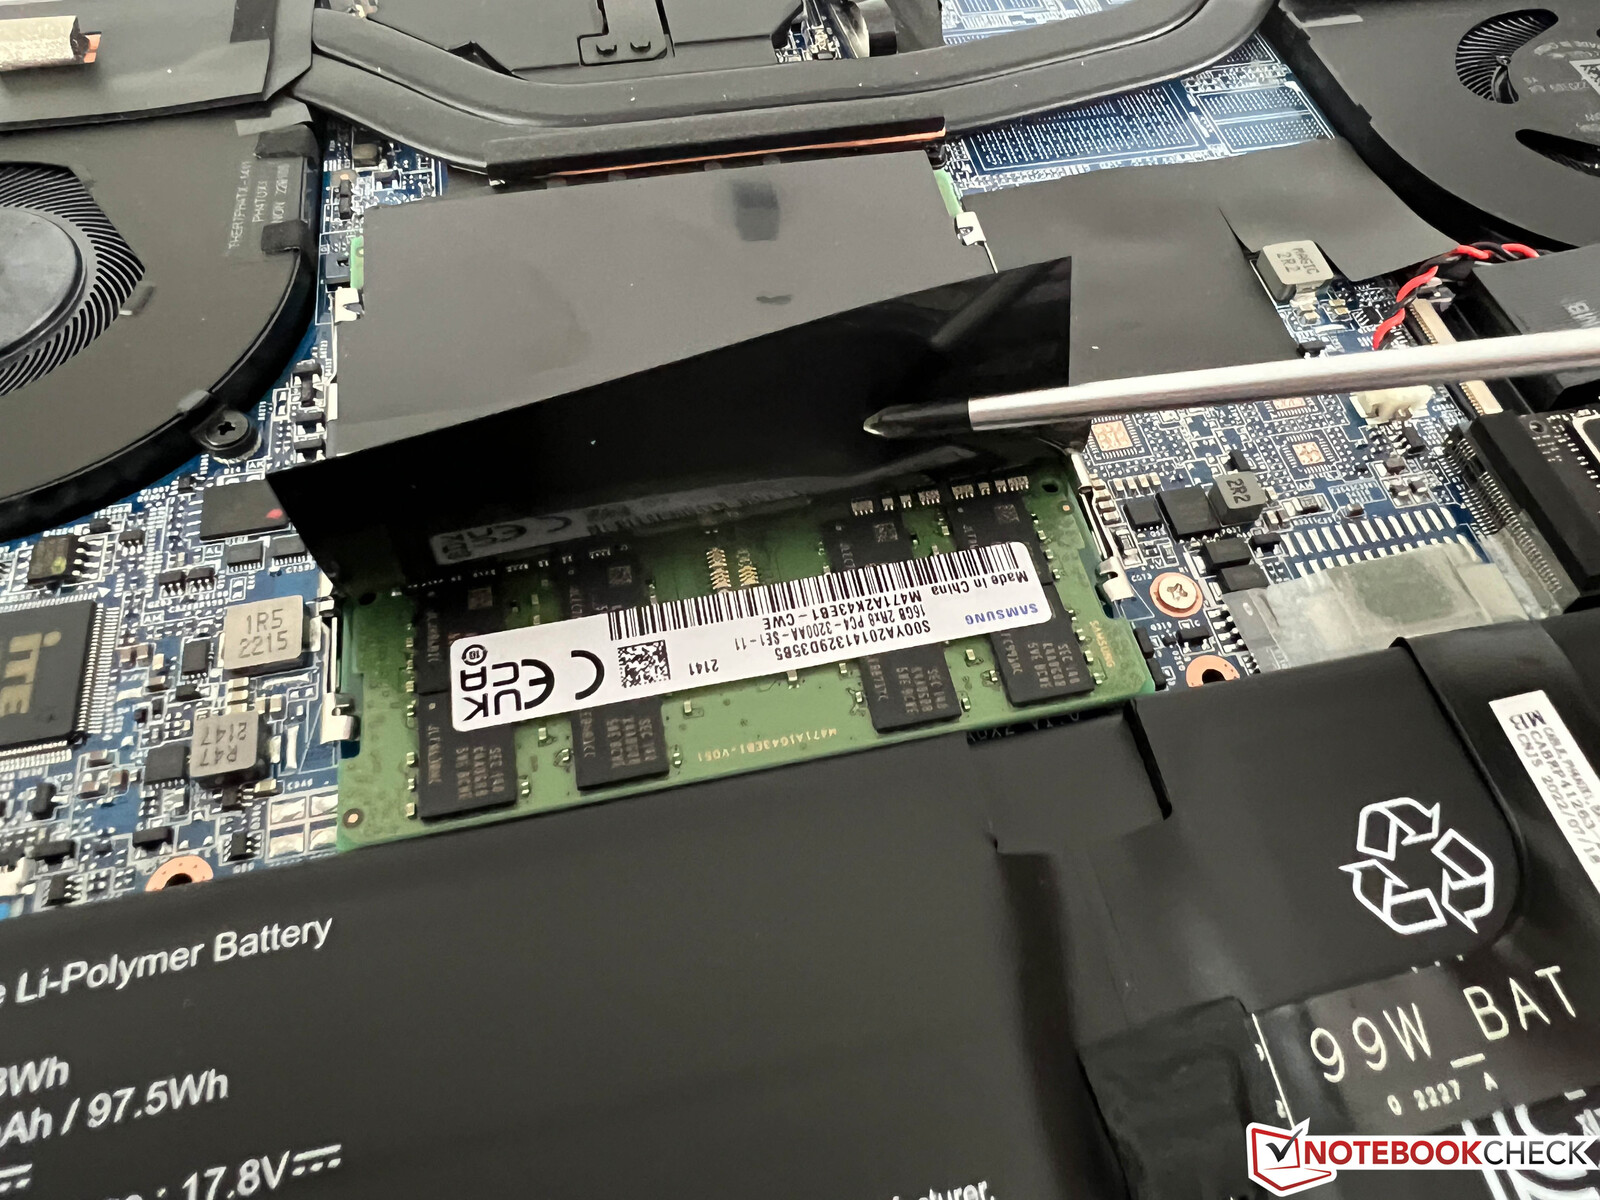
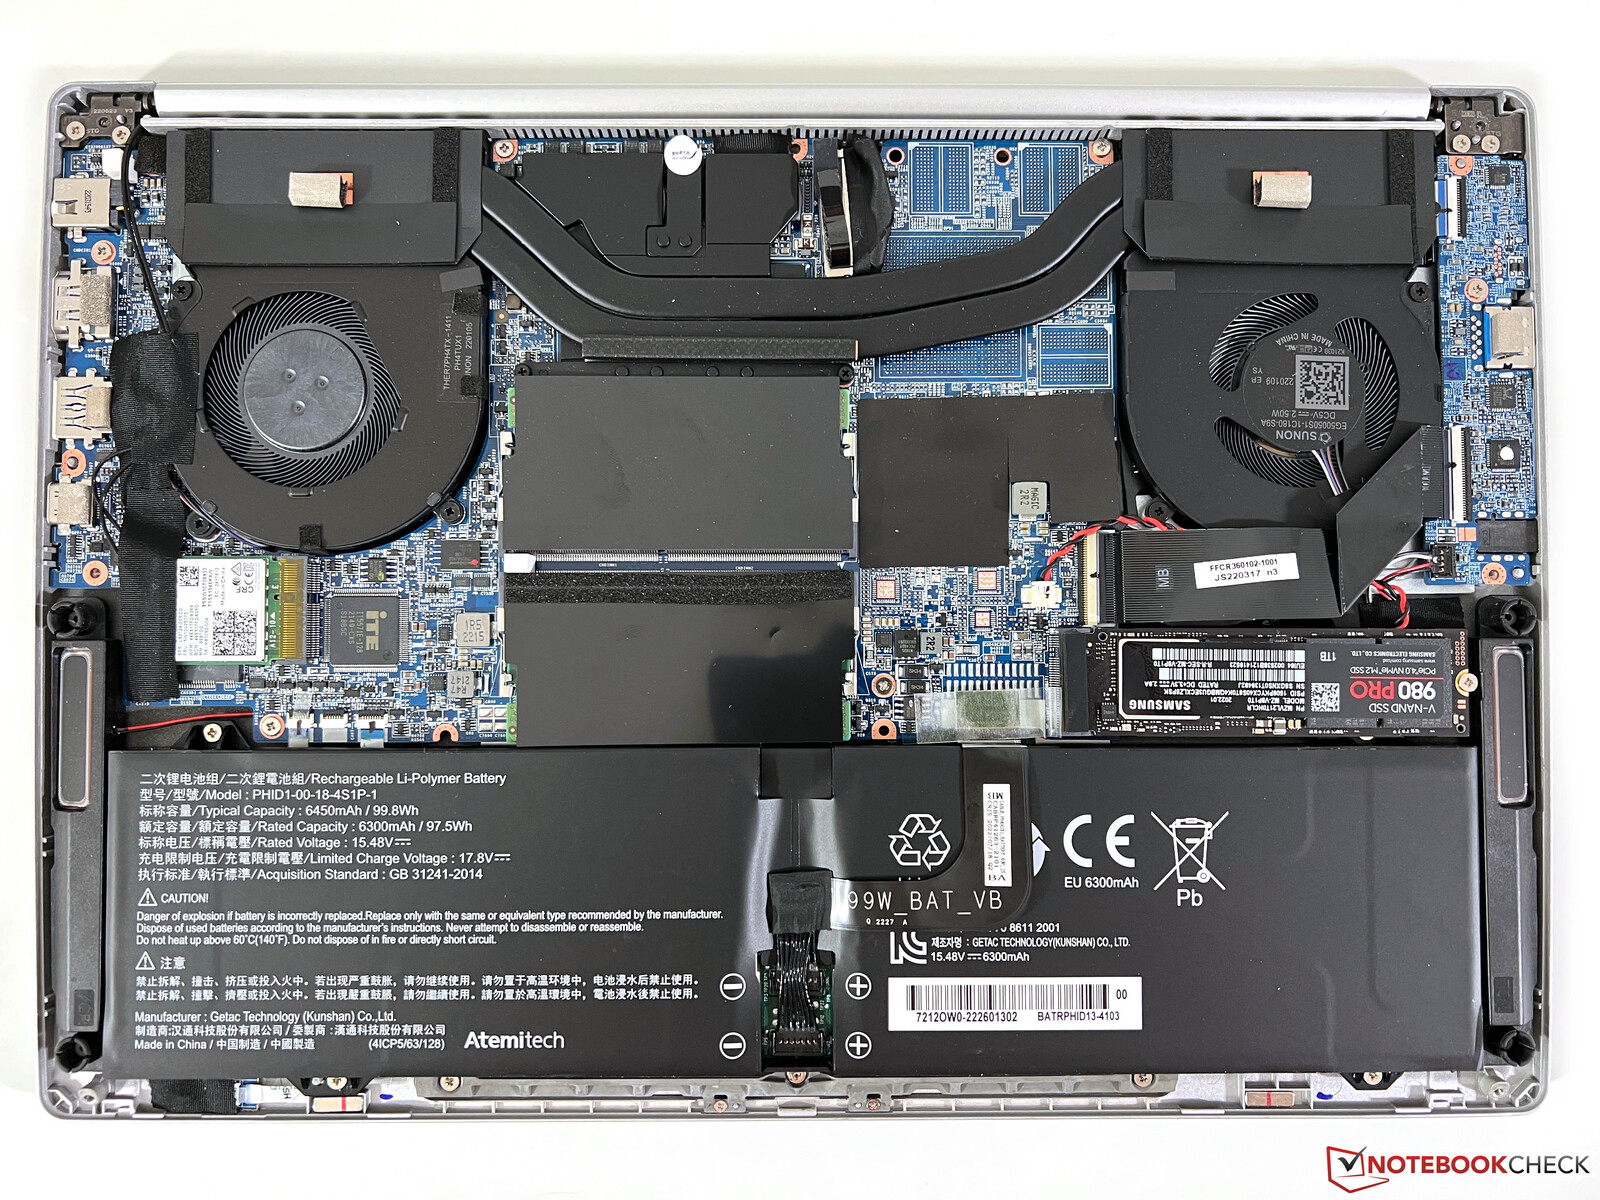
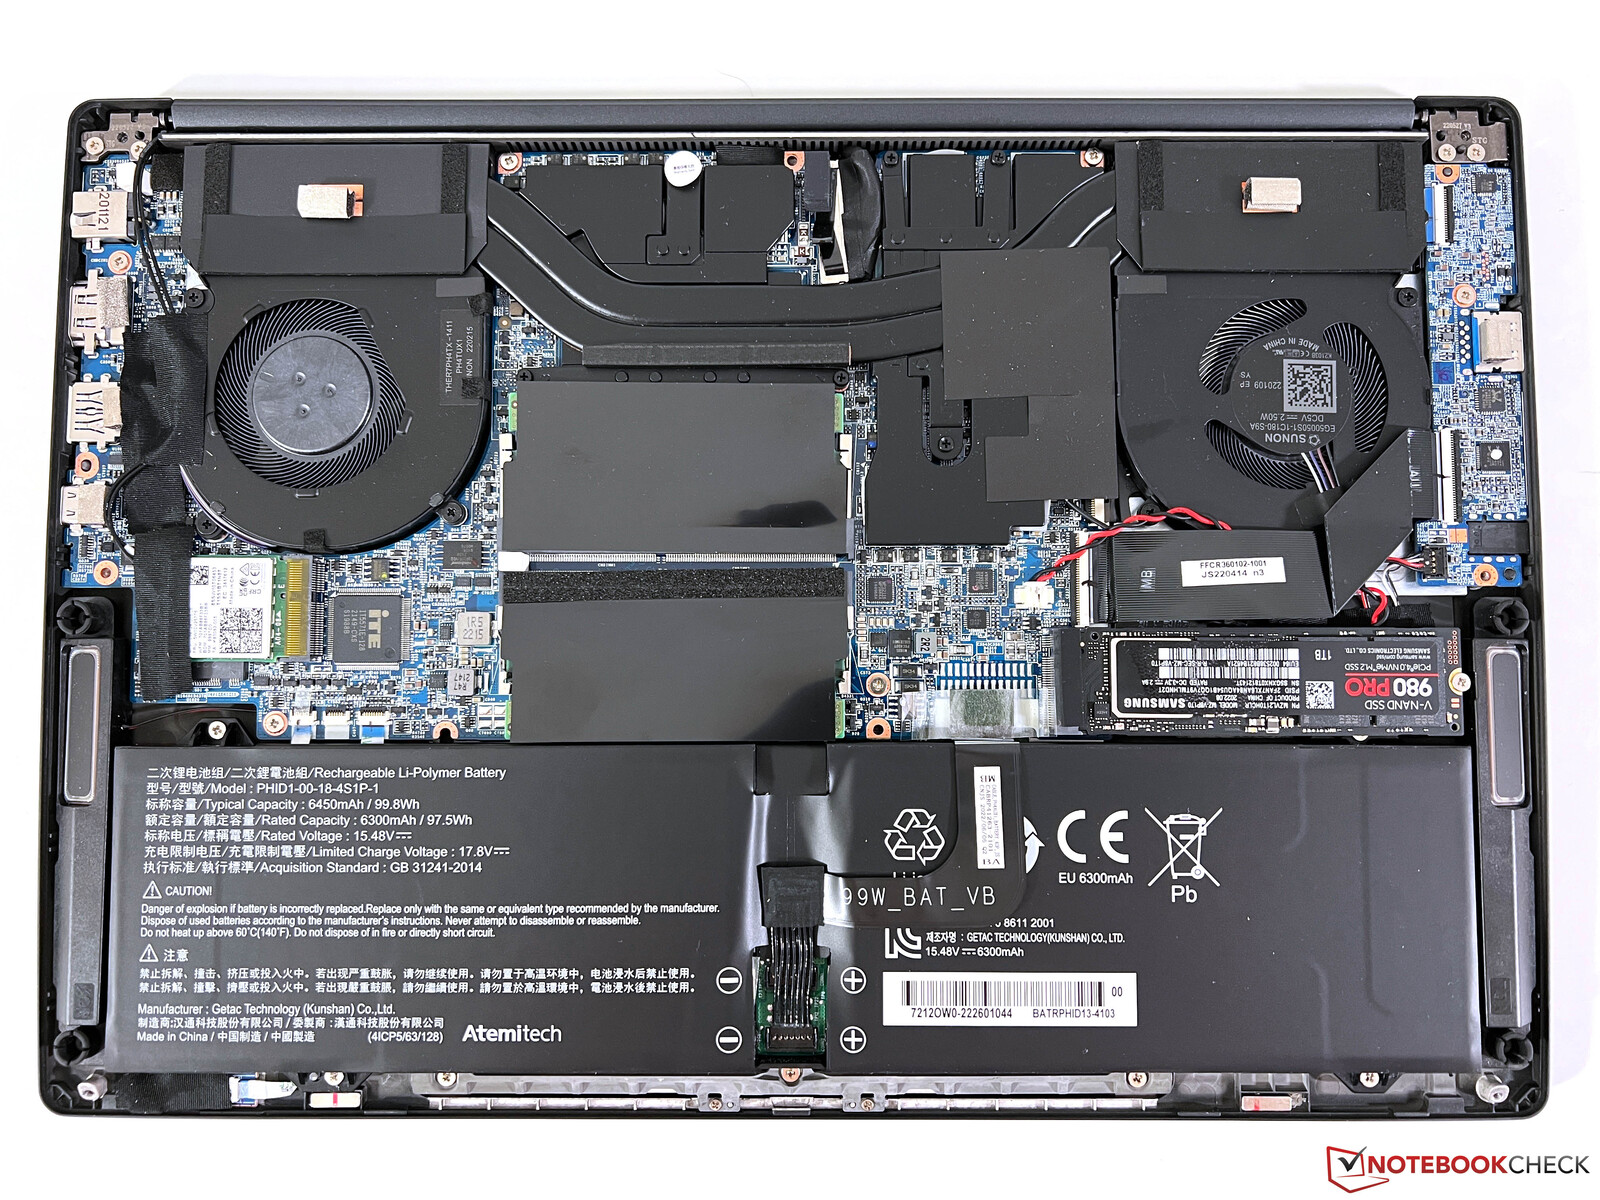
The bottom plate can be easily removed to immediately reveal the new 99-Wh on the inside as well as several coinciding changes to the mainboard and the speakers. This means that the new battery does not fit previous Vision 14 models. It should be noted that the secondary M.2-2280 slot is not available on models with the bigger battery. The RAM and the Wi-Fi module are still upgradeable.
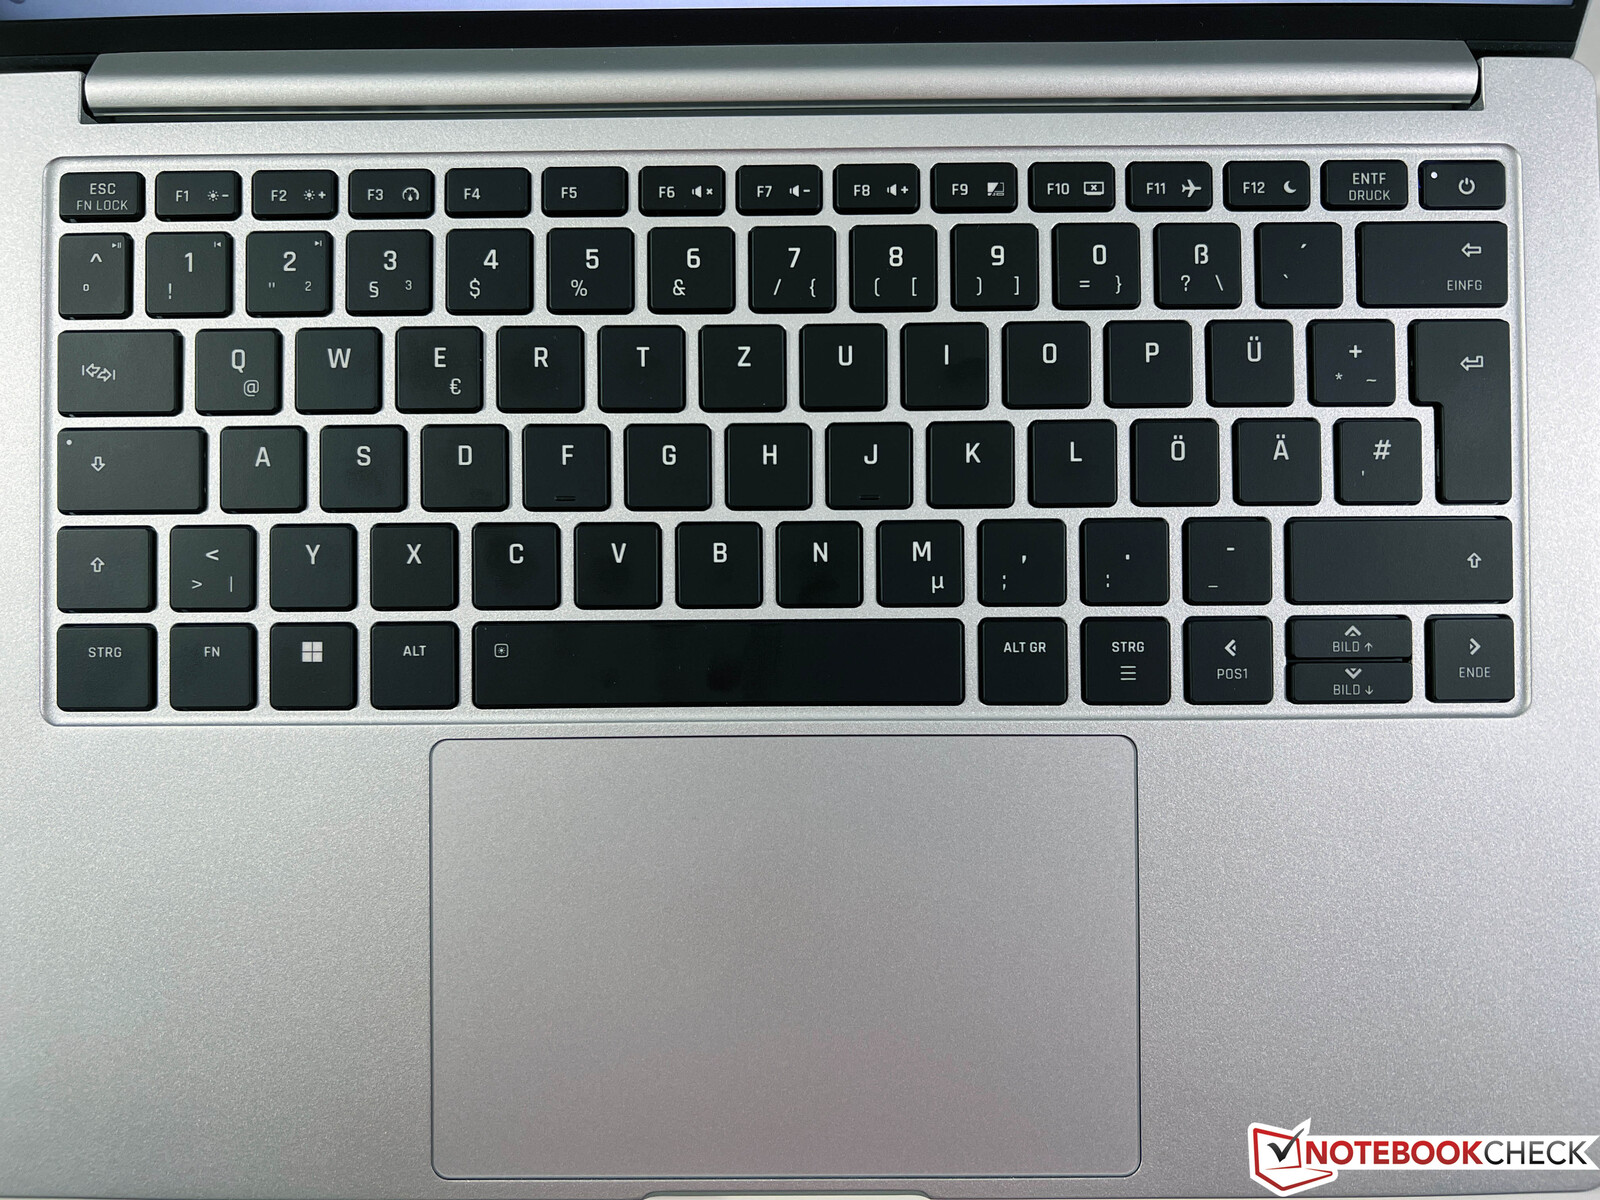
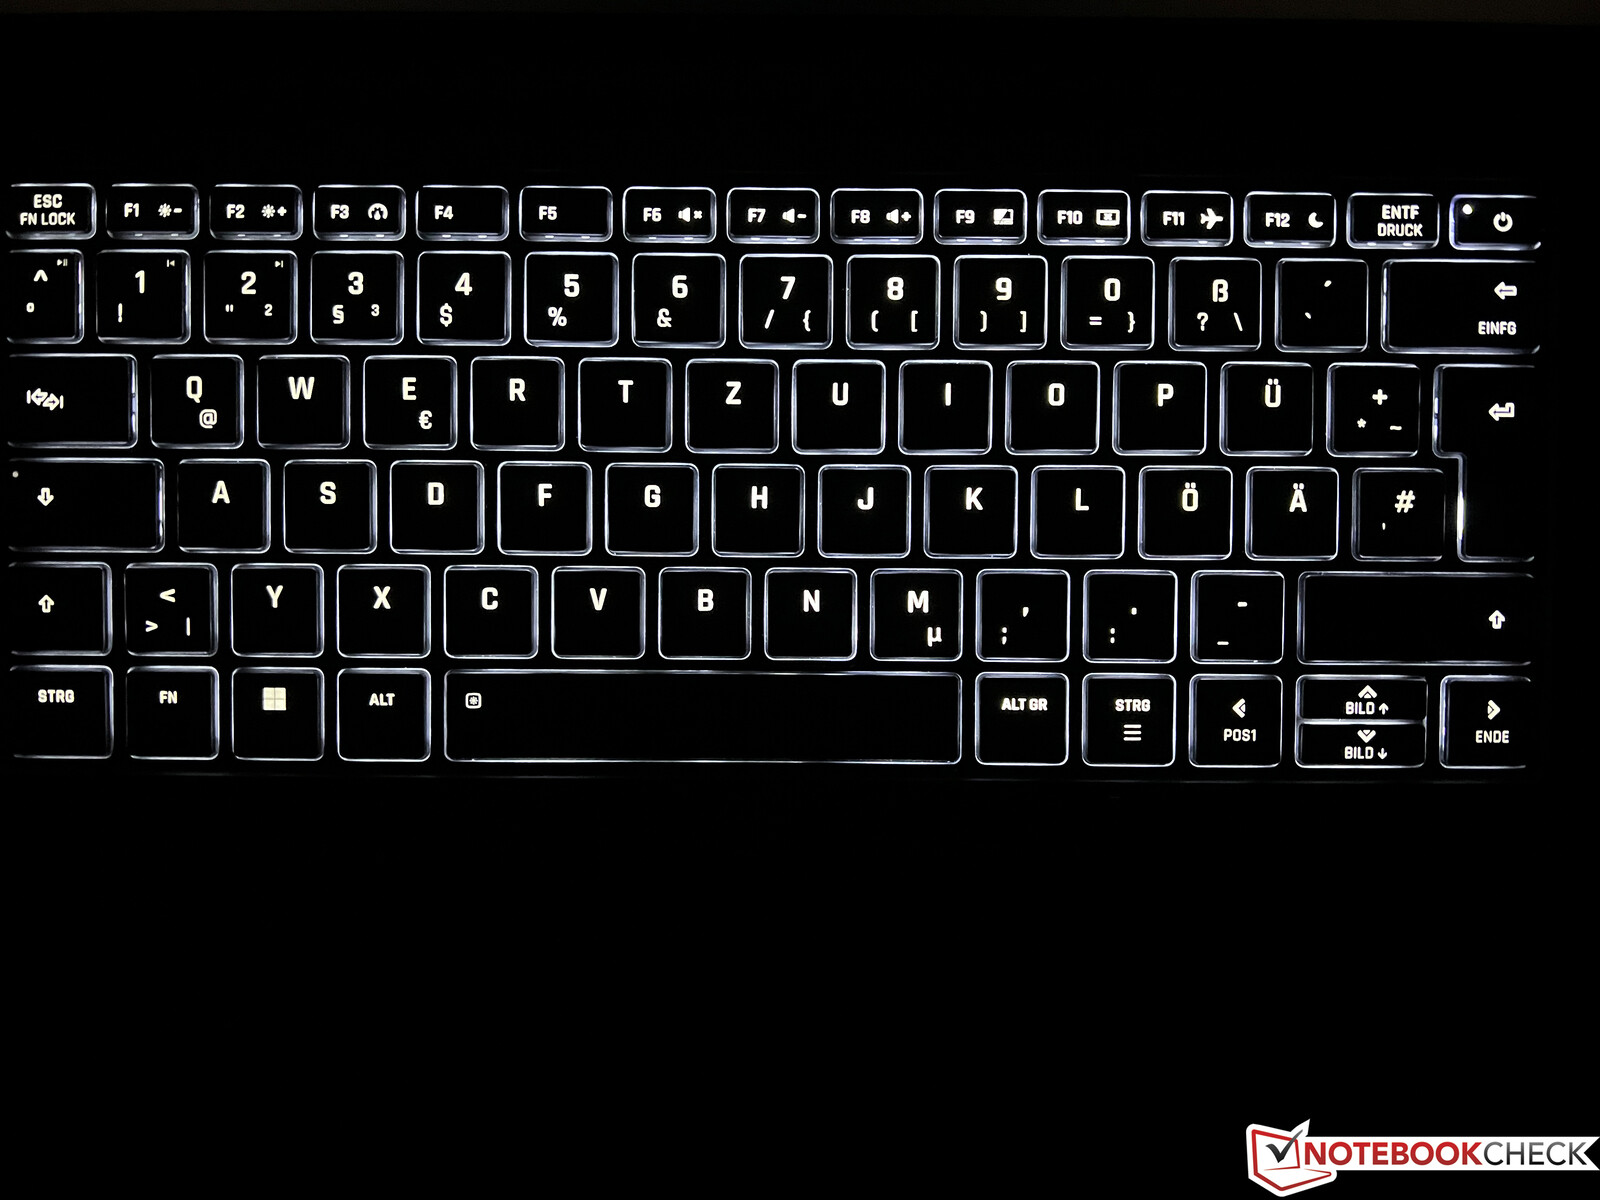
Input Devices - Backlit Keyboard and Glass Touchpad
The input devices remain unchanged compared to the previous model. The backlit keyboard offers a comfortable typing experience with quiet key clatter. While the glass touchpad (13 x 8 cm / 5.12 x 3.15 in) is good as well, its clicks are very loud.
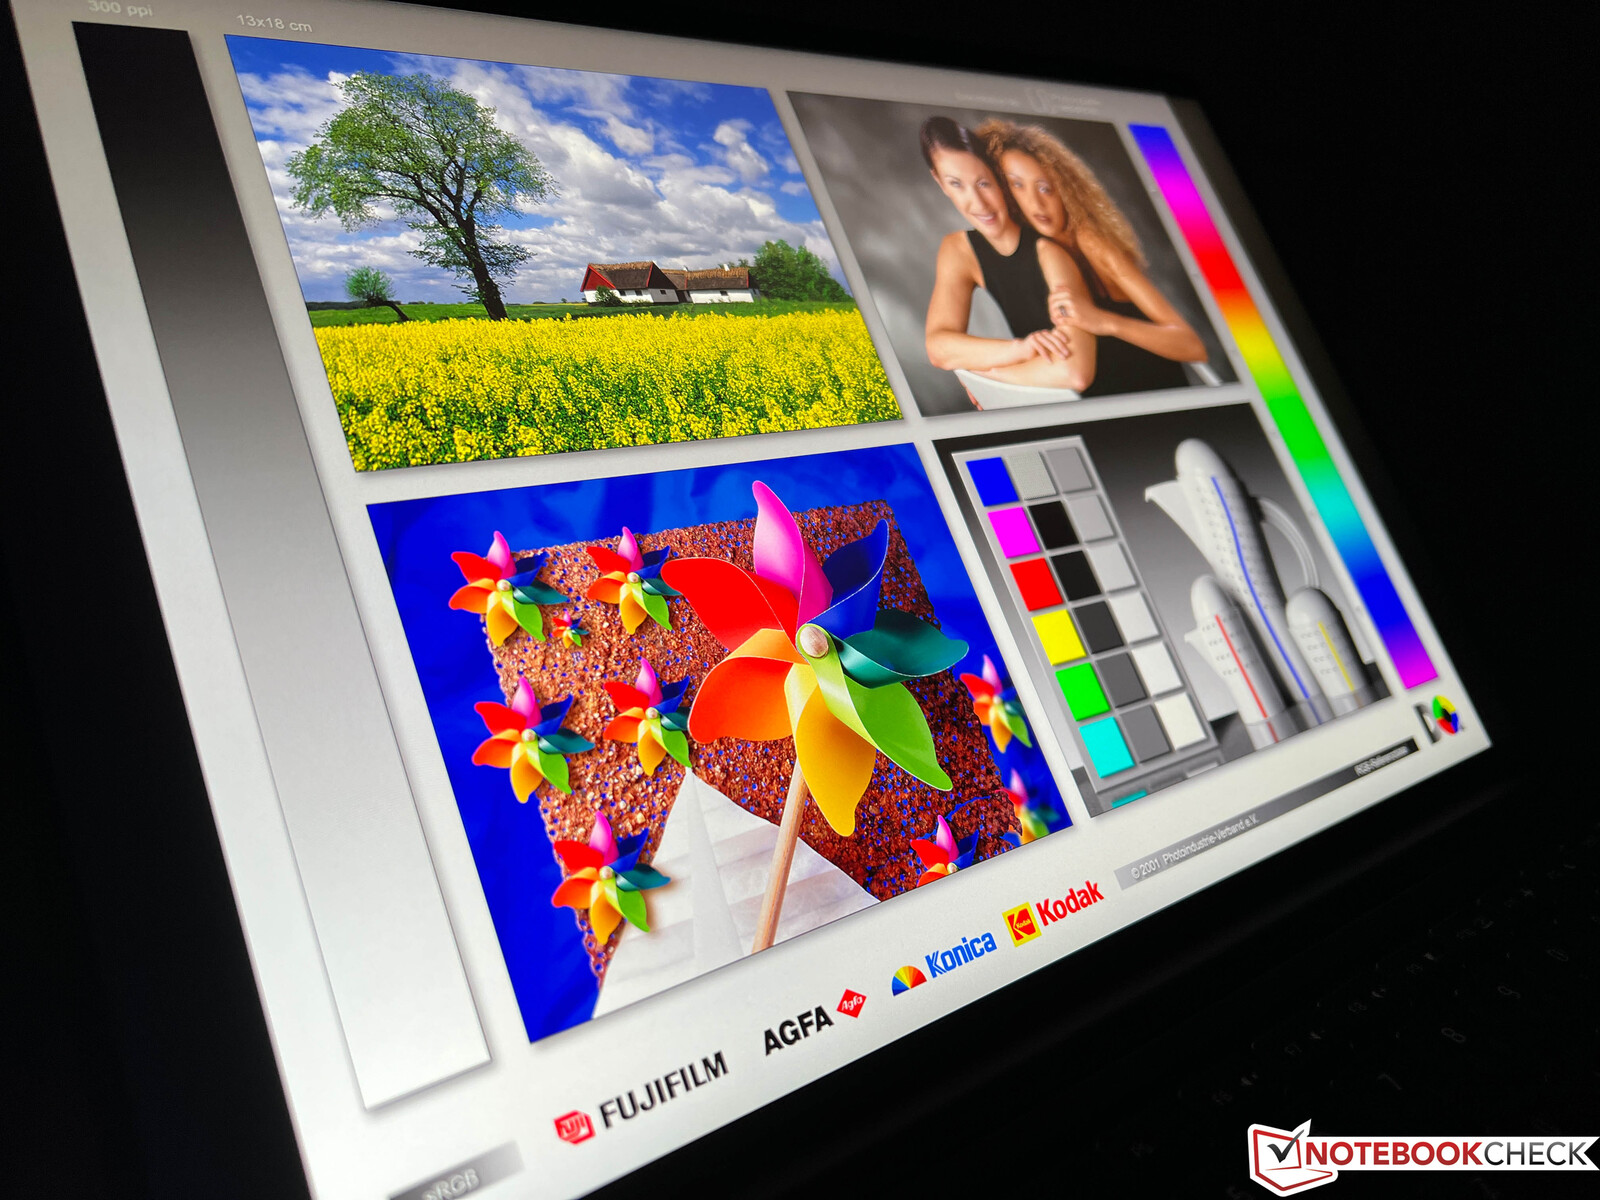
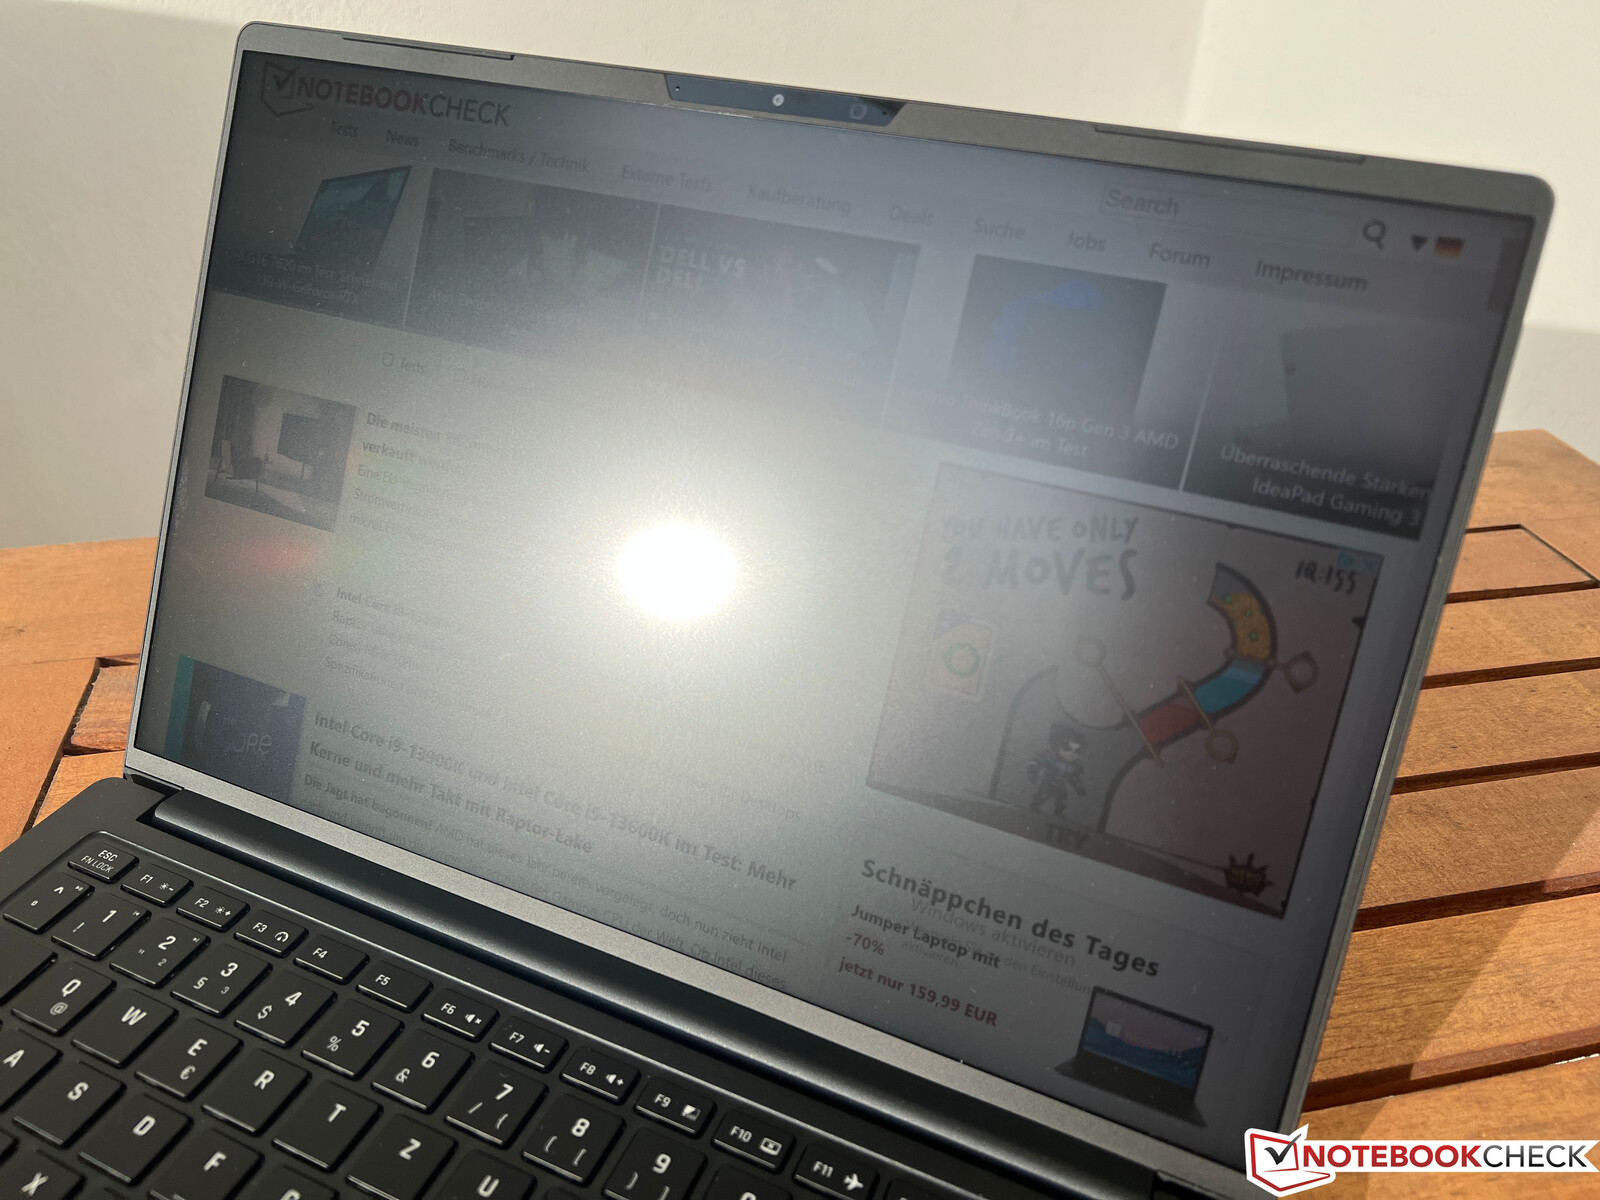
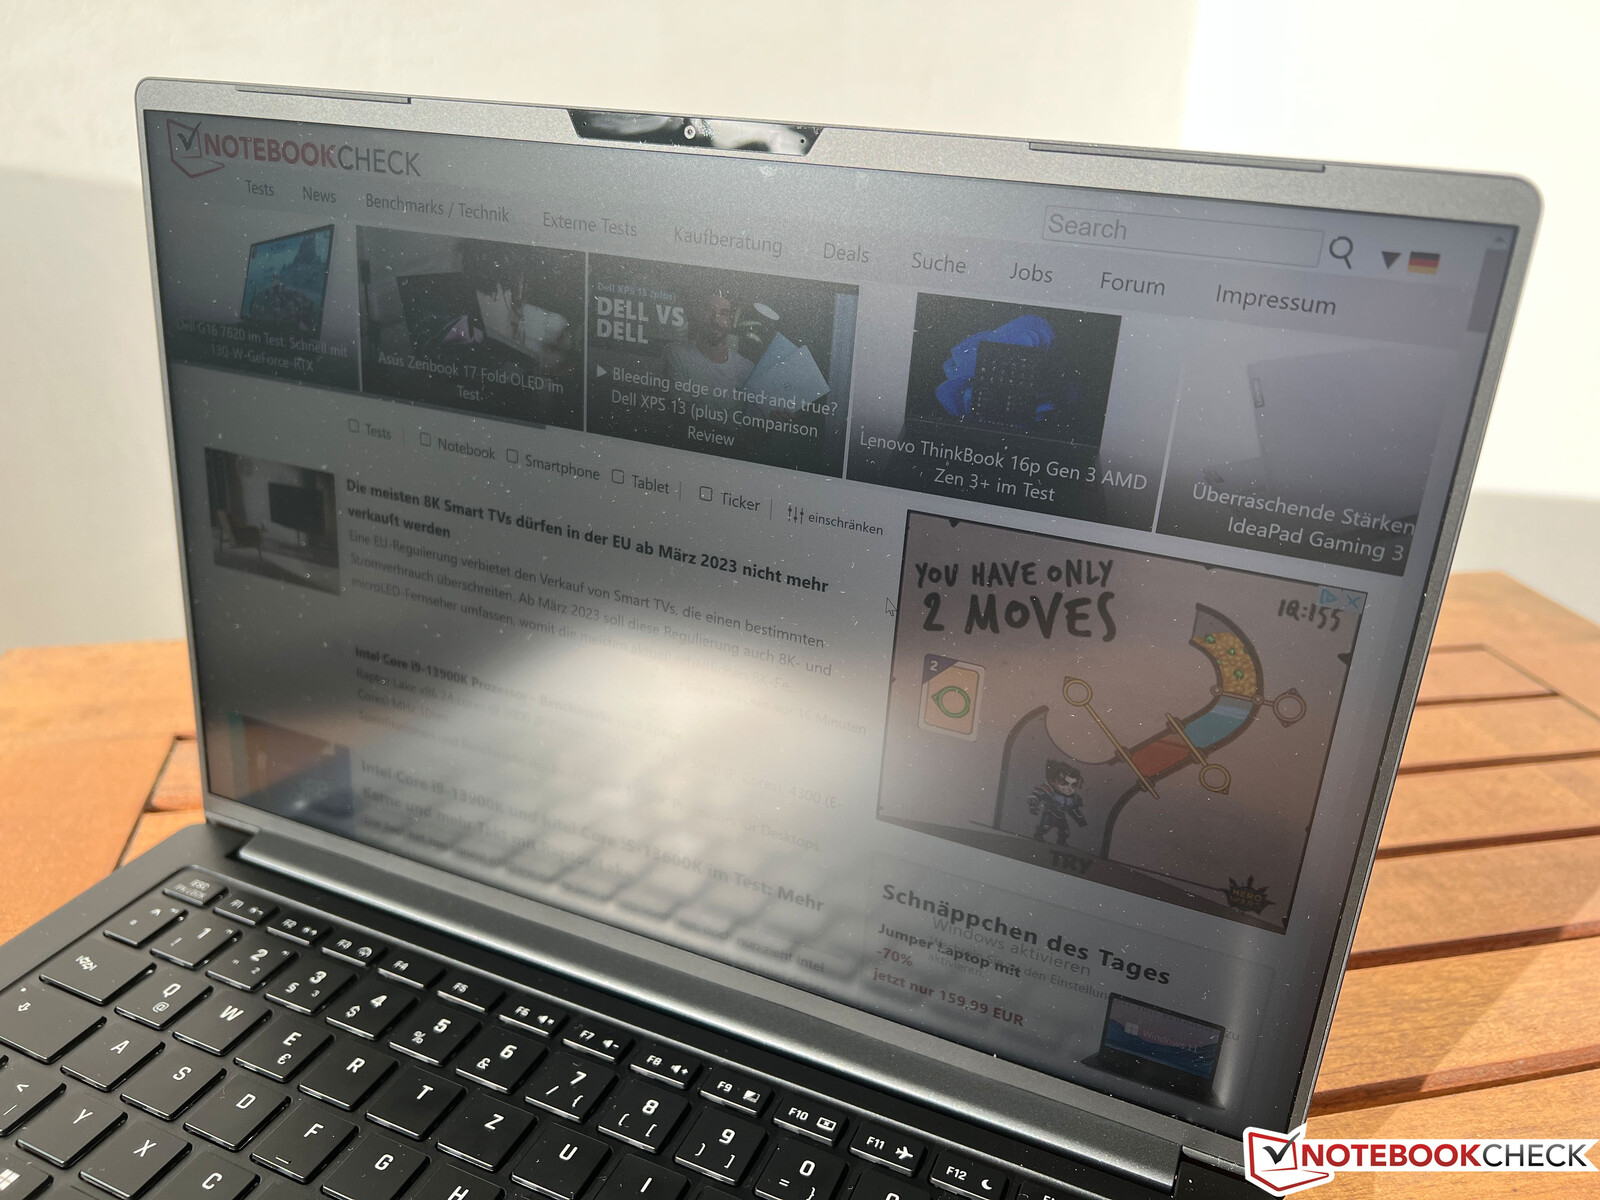
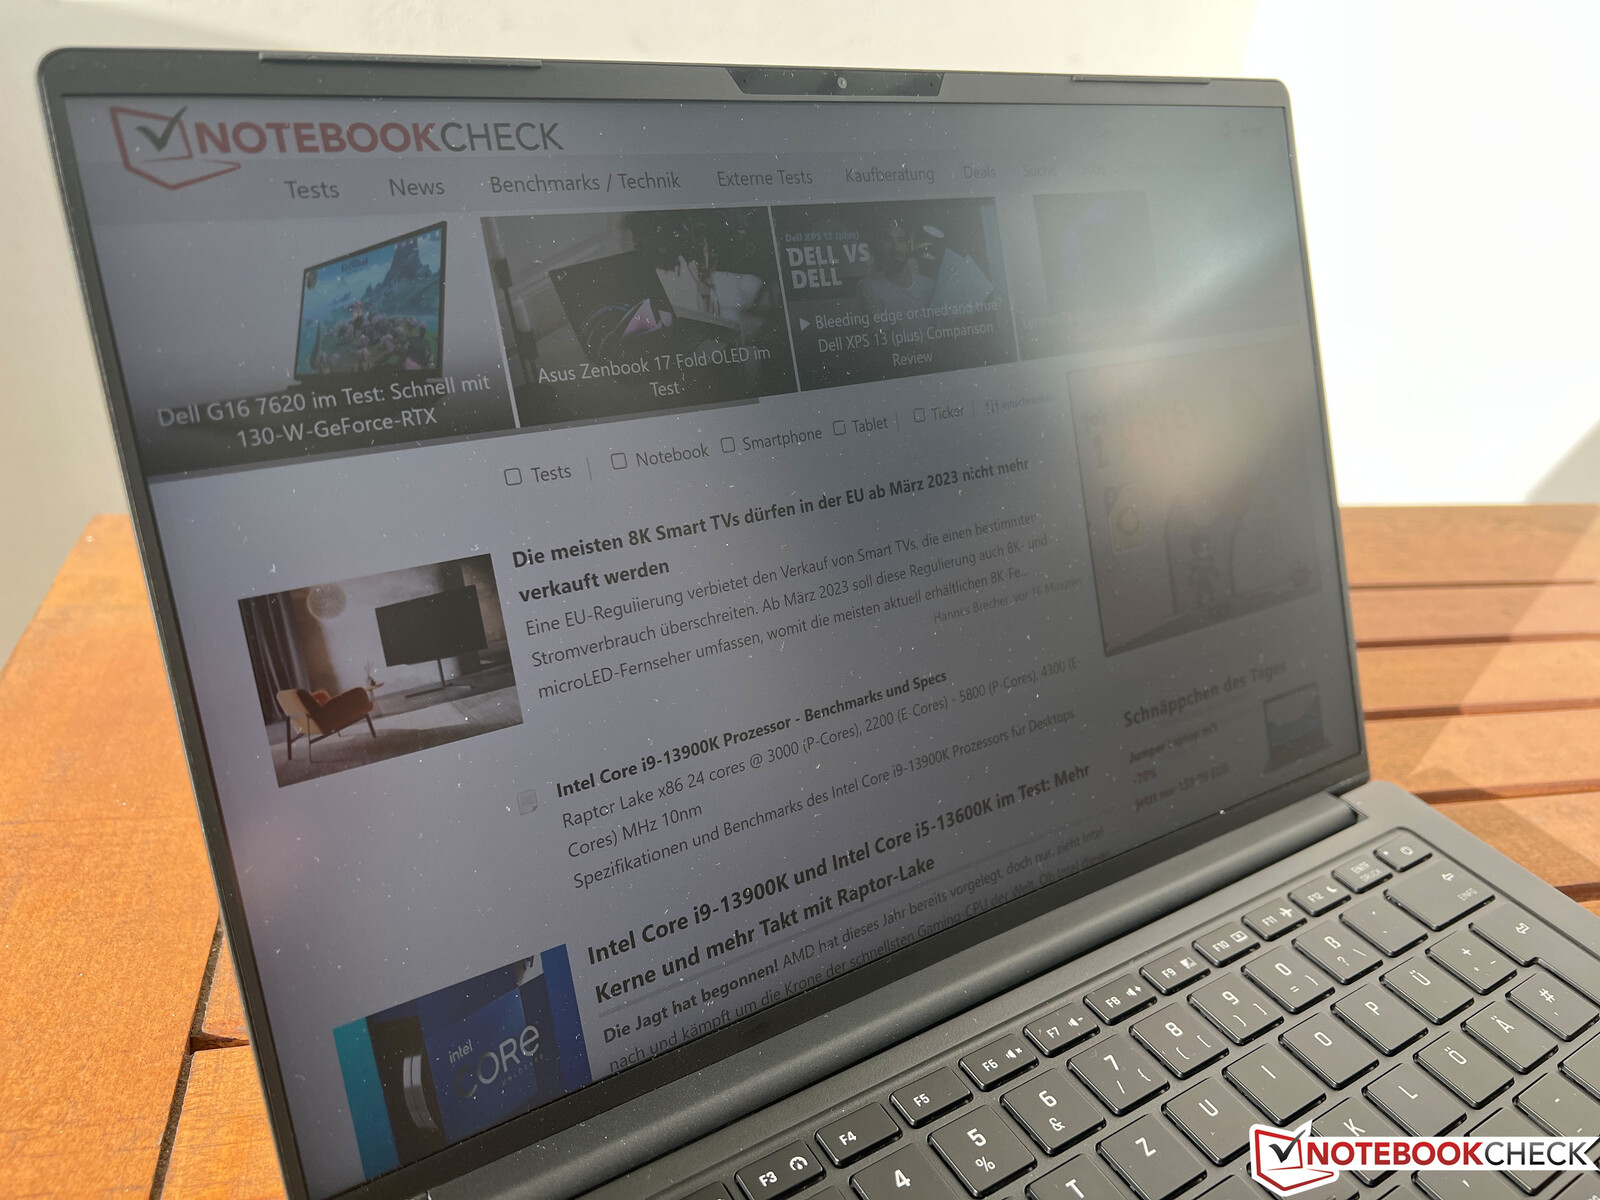
Display - Vision 14 Still with 3K IPS and 90 Hz
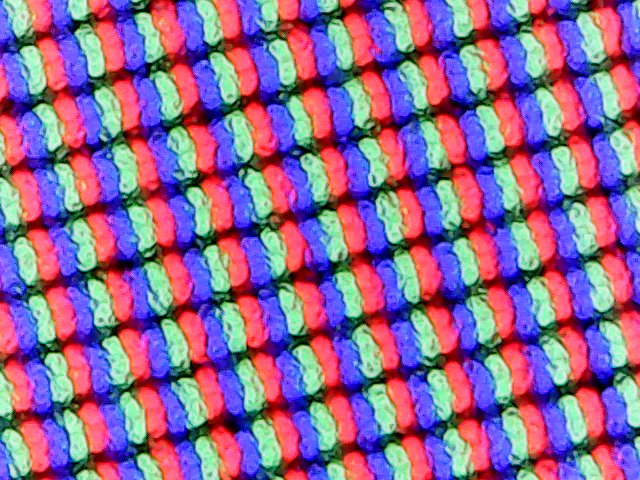
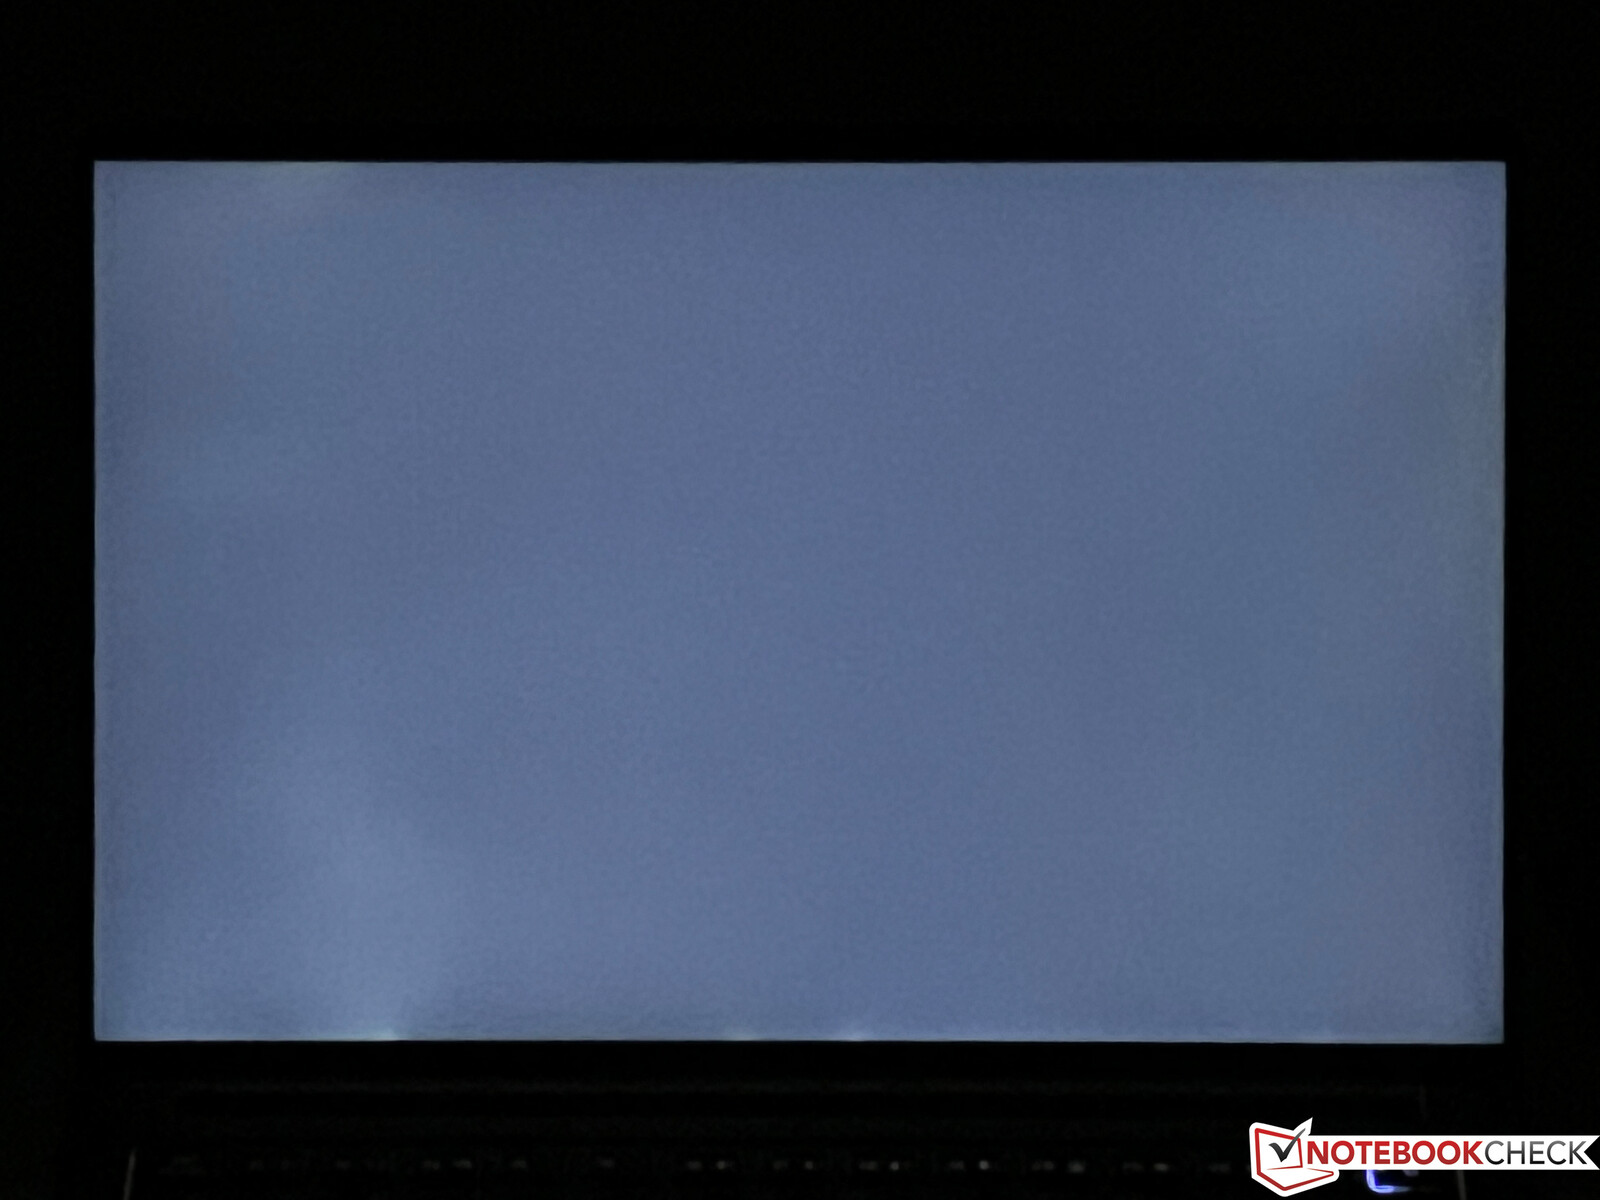
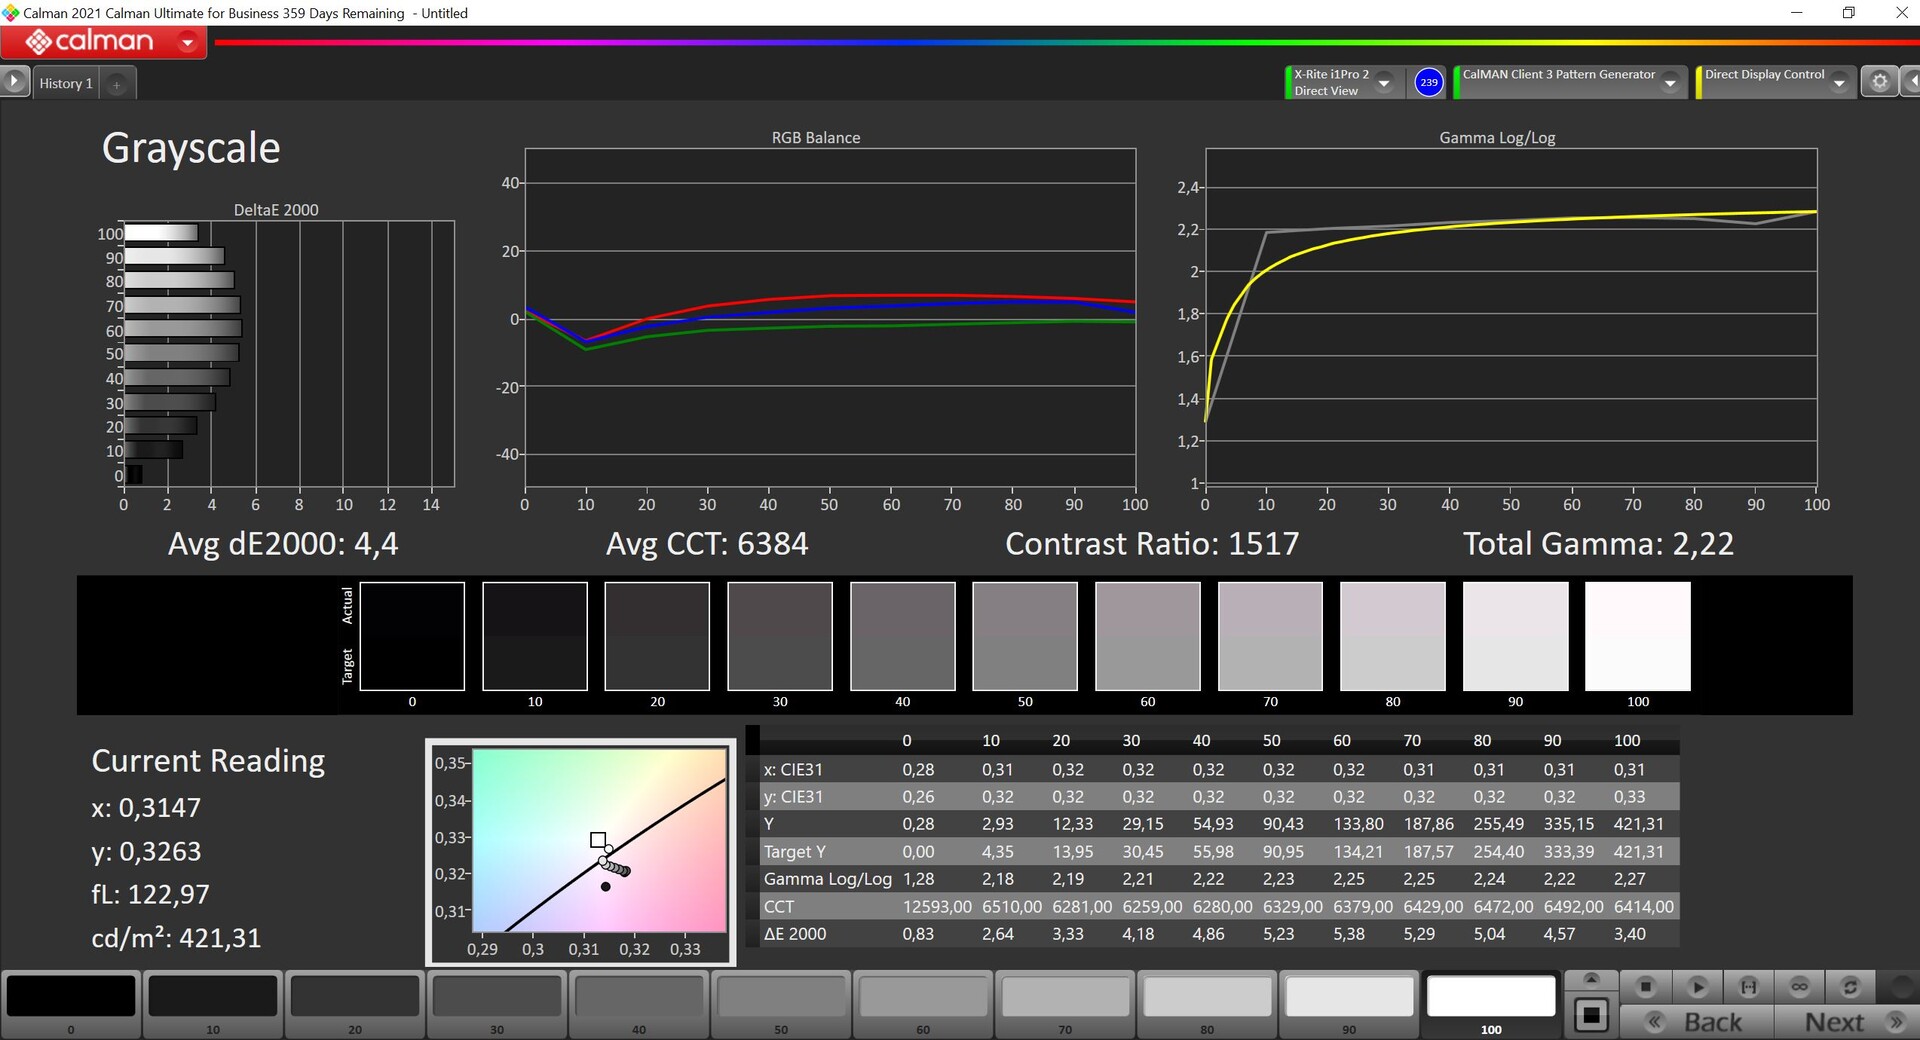
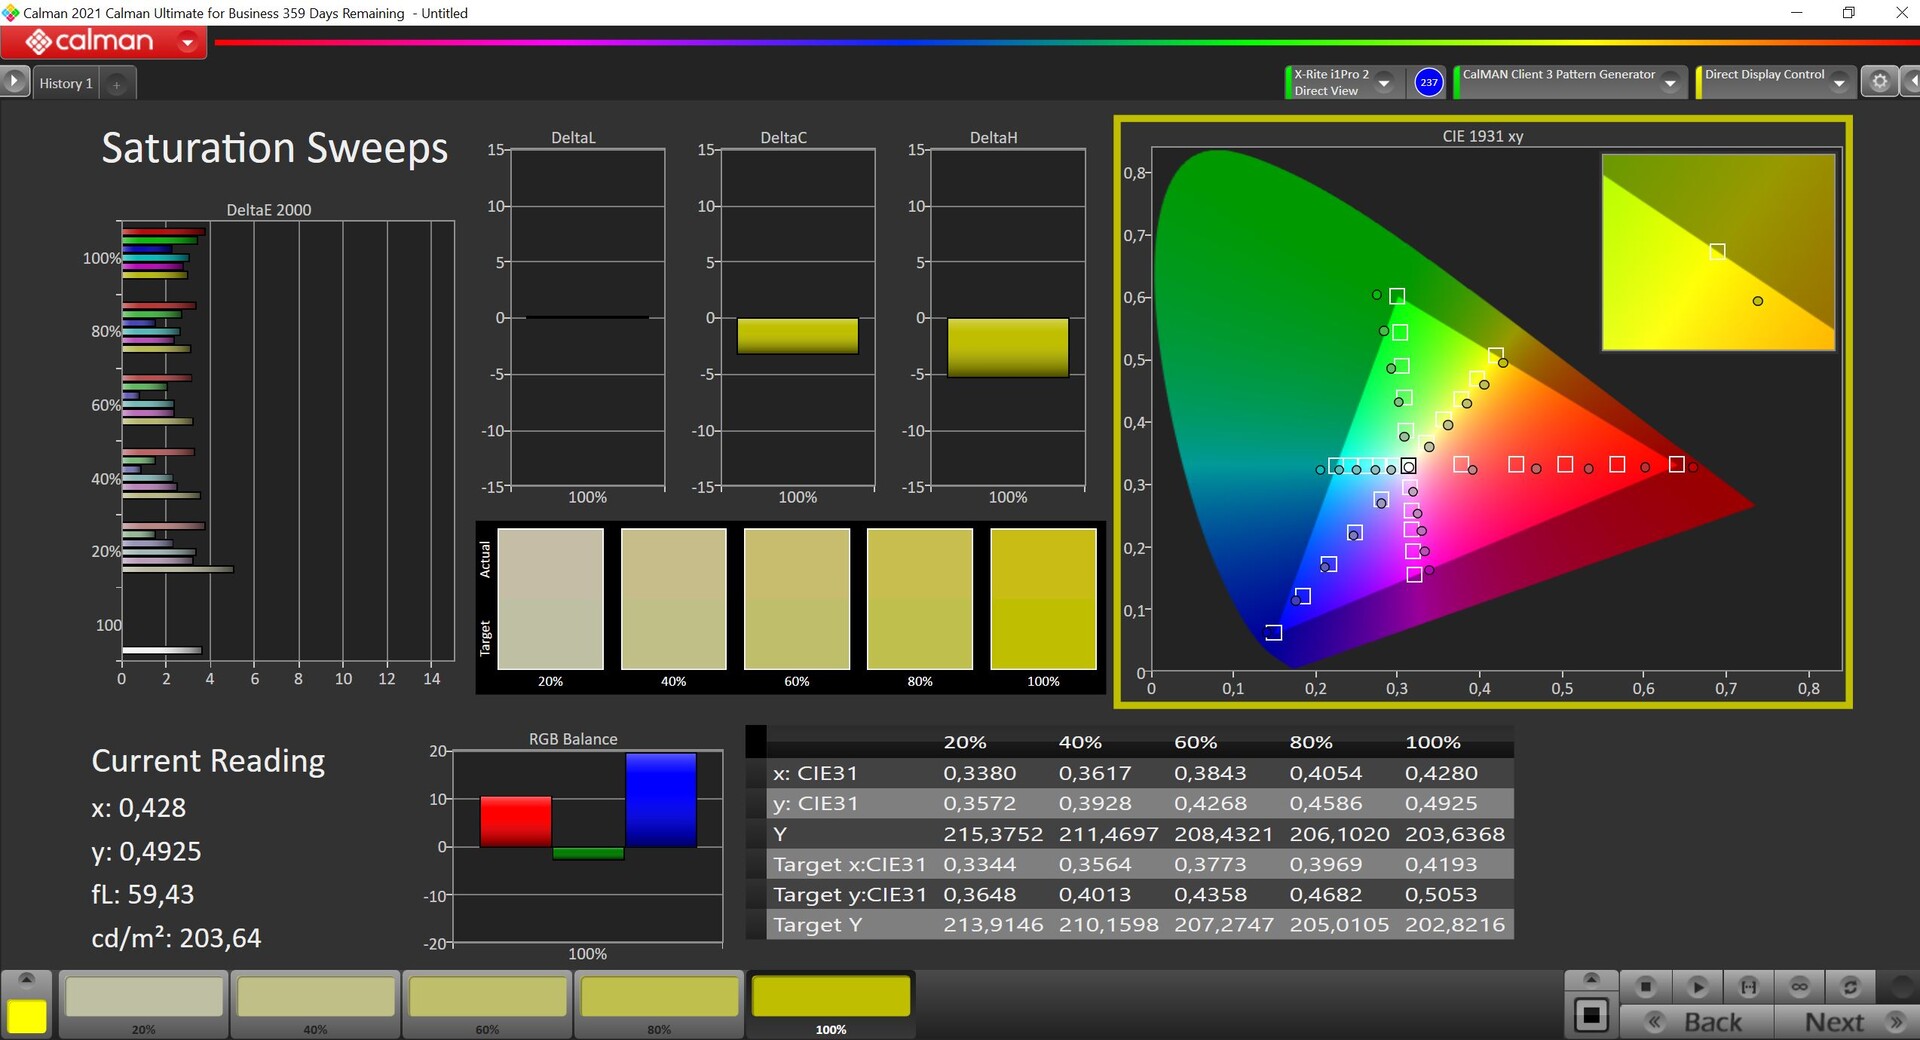
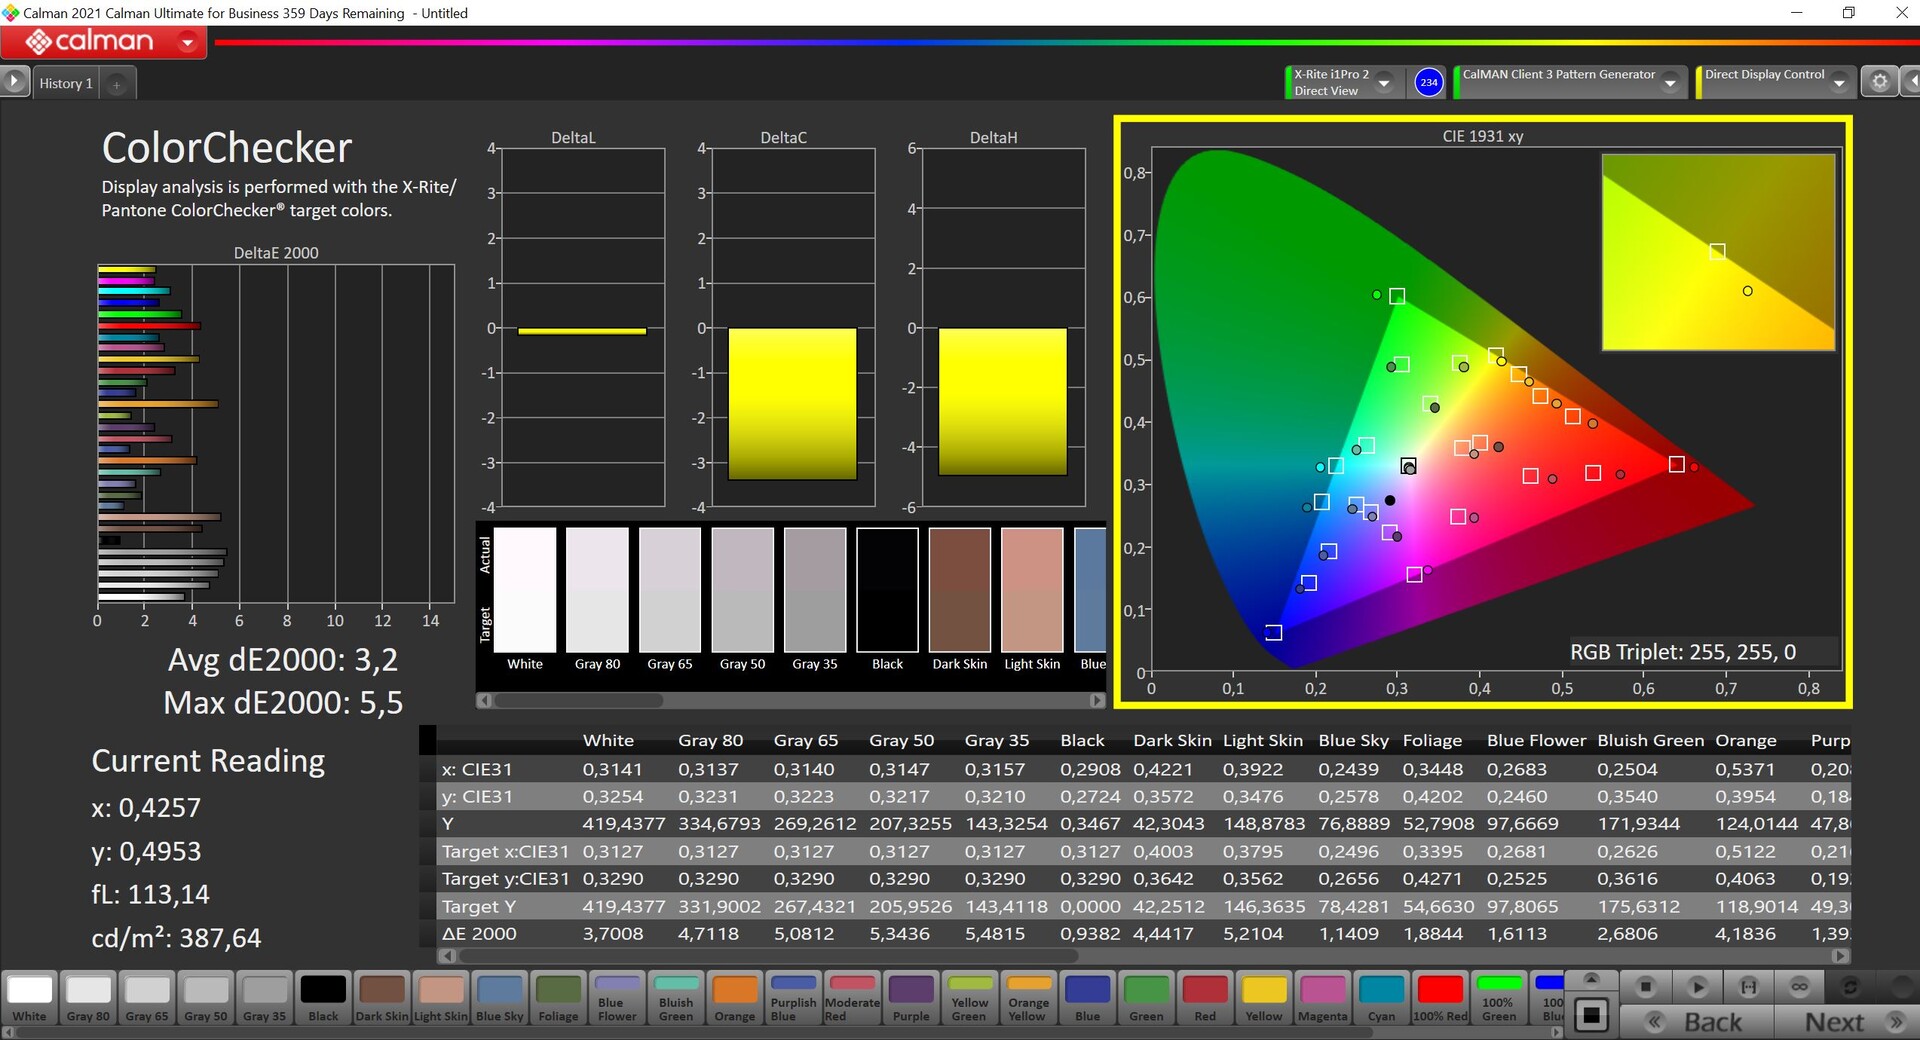
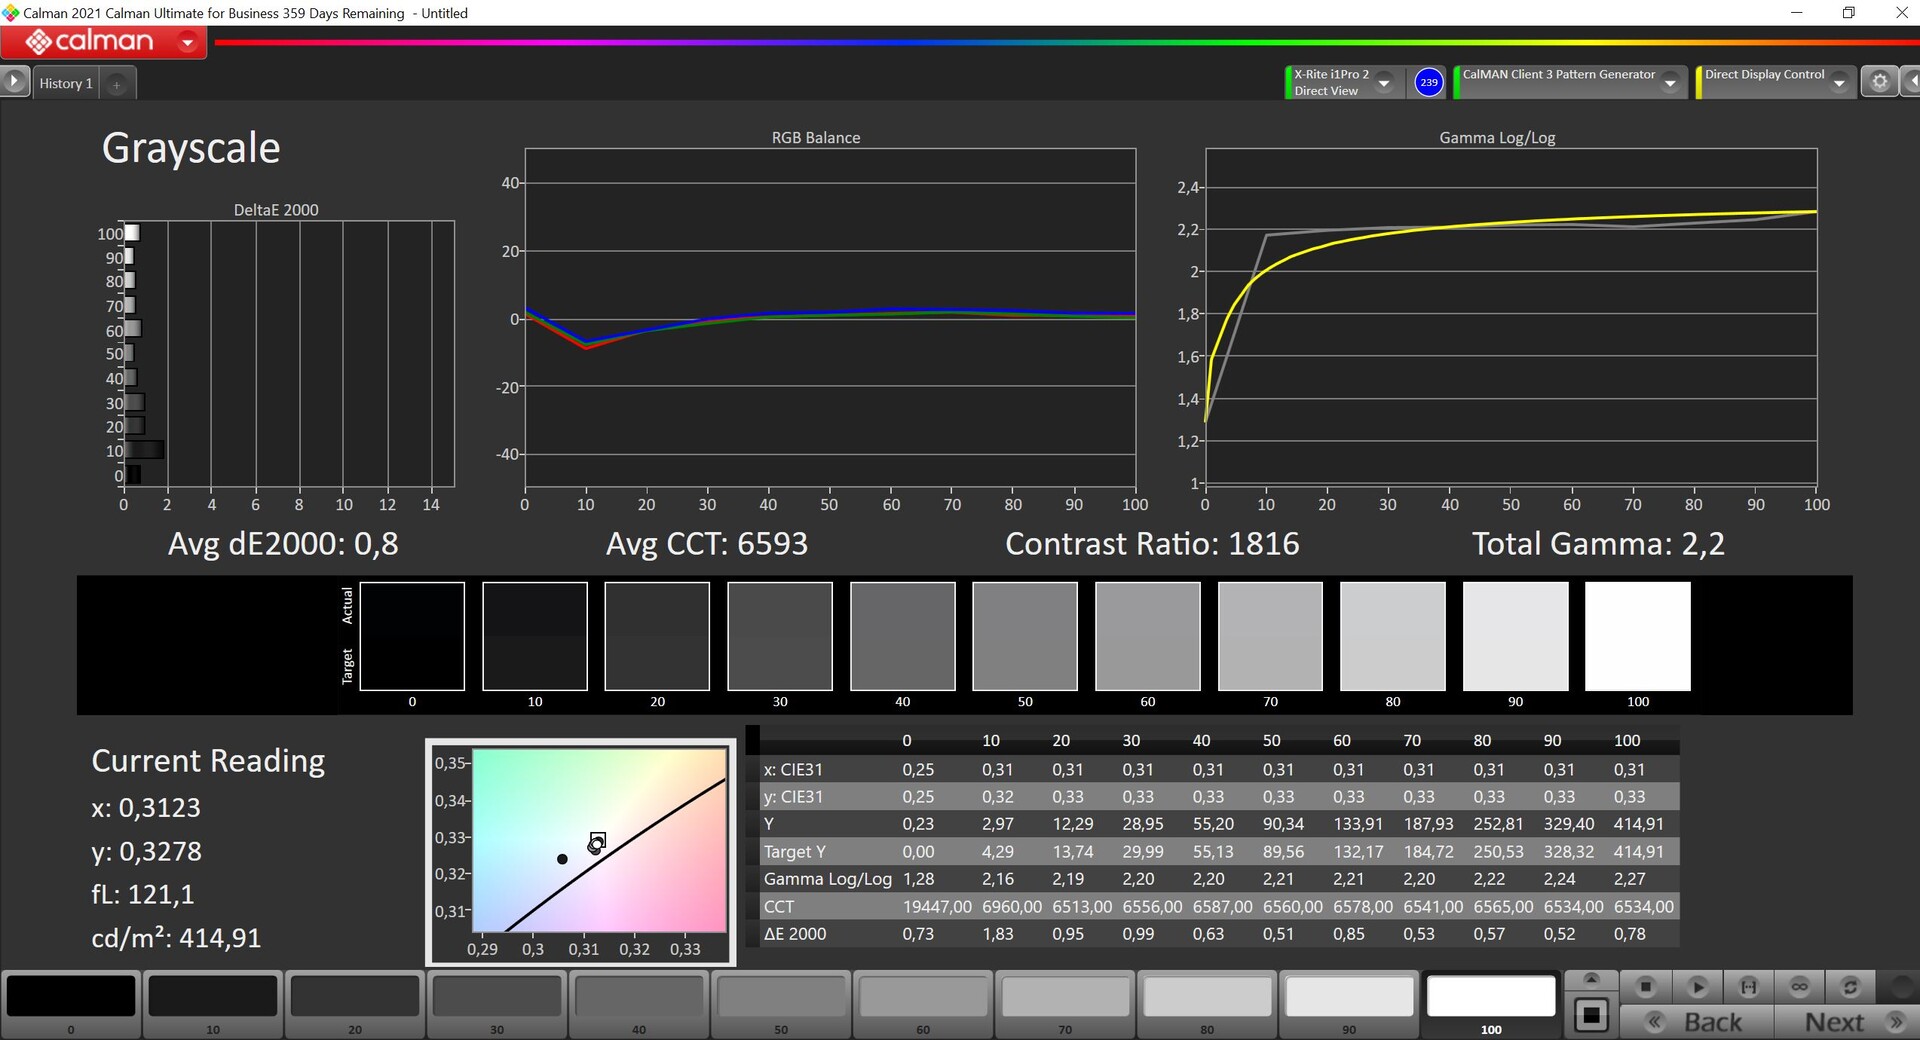
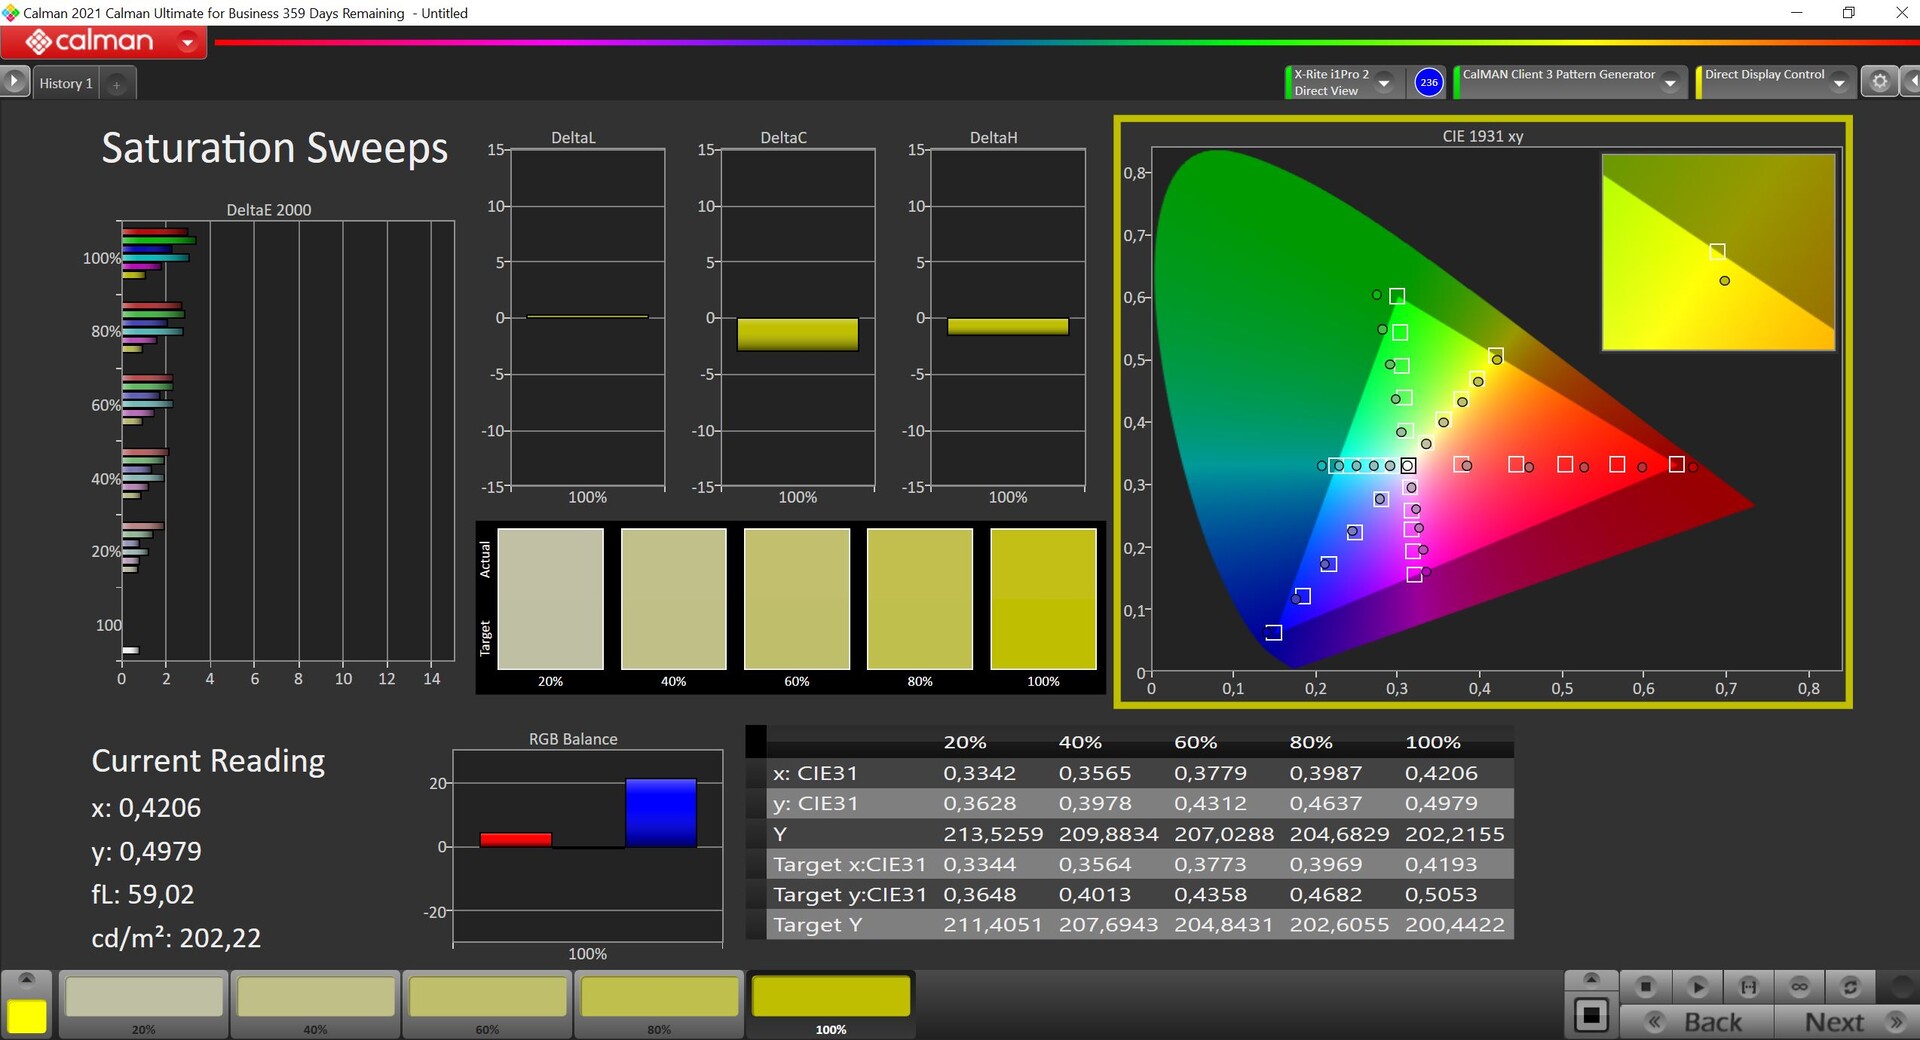
There is not much to say for the display, since the manufacturer still relies on the same, matte 3K panel (16:10, 2880 x 1800 pixels). The display quality is excellent and bright areas do not look grainy despite the matte layer. In our professional CalMAN software analysis, the panel fares well, too. It reaches an average brightness of ~415 nits and a good contrast ratio of 1500:1. Ex-factory, there is a faint tint, although we were able to fix this through our calibration. With a full sRGB coverage, photo editing is also possible. The panel does not rely on PWM.
| |||||||||||||||||||||||||
Brightness Distribution: 89 %
Center on Battery: 424 cd/m²
Contrast: 1504:1 (Black: 0.28 cd/m²)
ΔE Color 3.2 | 0.5-29.43 Ø5, calibrated: 2
ΔE Greyscale 4.4 | 0.57-98 Ø5.3
75.3% AdobeRGB 1998 (Argyll 2.2.0 3D)
97.4% sRGB (Argyll 2.2.0 3D)
74.1% Display P3 (Argyll 2.2.0 3D)
Gamma: 2.22
| SCHENKER Vision 14 2022 RTX 3050 Ti MNE007ZA1-1, IPS, 2880x1800, 14.00 | SCHENKER Vision 14 MNE007ZA1, IPS, 2880x1800, 14.00 | Huawei MateBook X Pro 2022 TMX1422, IPS, 3120x2080, 14.20 | Lenovo Yoga 9i 14 2022 i7-1260P LEN140WQUXGA, OLED, 3840x2400, 14.00 | Dell Inspiron 14 Plus 7420 InfoVision 140NWHE, IPS, 2240x1400, 14.00 | Asus Vivobook Pro 14 M3401QC-KM007T SAMSUNG: SDC4171, OLED, 2880x1800, 14.00 | Apple MacBook Pro 14 2021 M1 Pro Entry Mini-LED, 3024x1964, 14.20 | |
|---|---|---|---|---|---|---|---|
| Display | 0% | 15% | 22% | -4% | 21% | 34% | |
| Display P3 Coverage | 74.1 | 74.3 0% | 94.6 28% | 98.7 33% | 68.8 -7% | 99.41 34% | 99.3 34% |
| sRGB Coverage | 97.4 | 97.6 0% | 99.5 2% | 99.8 2% | 99.3 2% | 99.94 3% | |
| AdobeRGB 1998 Coverage | 75.3 | 75.7 1% | 86.5 15% | 98.5 31% | 69.5 -8% | 94.79 26% | |
| Response Times | -28% | 1% | 86% | -31% | 85% | -132% | |
| Response Time Grey 50% / Grey 80% * | 31.5 ? | 40.4 ? -28% | 25.4 ? 19% | 2.8 ? 91% | 32.8 ? -4% | 3 ? 90% | 58.4 ? -85% |
| Response Time Black / White * | 14.5 ? | 18.4 ? -27% | 17.1 ? -18% | 2.8 ? 81% | 22.8 ? -57% | 3 ? 79% | 40.4 ? -179% |
| PWM Frequency | 239.2 ? | 360 | 14880 | ||||
| Screen | 11% | 31% | 3006% | 5% | 53% | 439% | |
| Brightness middle | 421 | 407 -3% | 603 43% | 361 -14% | 331.1 -21% | 384 -9% | 489 16% |
| Brightness | 416 | 407 -2% | 586 41% | 362 -13% | 326 -22% | 385 -7% | 479 15% |
| Brightness Distribution | 89 | 94 6% | 91 2% | 98 10% | 85 -4% | 98 10% | 94 6% |
| Black Level * | 0.28 | 0.25 11% | 0.39 -39% | 0.001 100% | 0.29 -4% | 0.07 75% | 0.01 96% |
| Contrast | 1504 | 1628 8% | 1546 3% | 361000 23903% | 1142 -24% | 5486 265% | 48900 3151% |
| Colorchecker dE 2000 * | 3.2 | 2.6 19% | 1.1 66% | 2.8 12% | 2.23 30% | 1.75 45% | 0.8 75% |
| Colorchecker dE 2000 max. * | 5.5 | 4.4 20% | 2.2 60% | 5.8 -5% | 5.44 1% | 3.41 38% | 1.3 76% |
| Colorchecker dE 2000 calibrated * | 2 | 2 -0% | 1.2 40% | 0.63 68% | 2.32 -16% | ||
| Greyscale dE 2000 * | 4.4 | 2.7 39% | 1.5 66% | 1.9 57% | 3.6 18% | 1.06 76% | 1.1 75% |
| Gamma | 2.22 99% | 2.18 101% | 2.17 101% | 2.16 102% | 2.21 100% | 2.39 92% | 2.24 98% |
| CCT | 6384 102% | 6316 103% | 6549 99% | 6181 105% | 6022 108% | 6440 101% | |
| Total Average (Program / Settings) | -6% /
3% | 16% /
23% | 1038% /
1868% | -10% /
-2% | 53% /
51% | 114% /
298% |
* ... smaller is better

Display Response Times
| ↔ Response Time Black to White | ||
|---|---|---|
| 14.5 ms ... rise ↗ and fall ↘ combined | ↗ 4.7 ms rise | 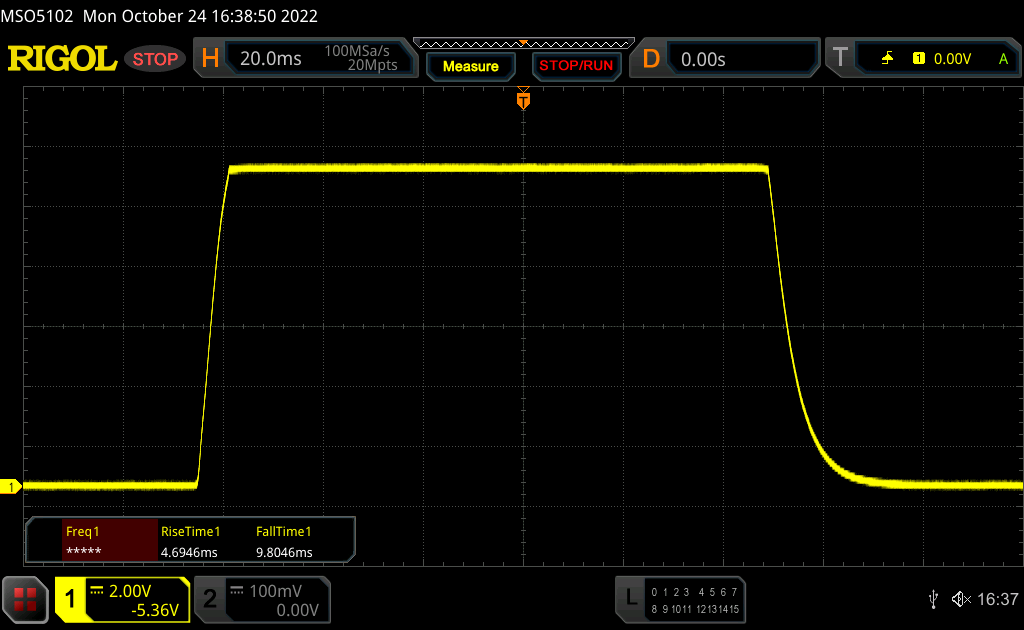 |
| ↘ 9.8 ms fall | ||
| The screen shows good response rates in our tests, but may be too slow for competitive gamers. In comparison, all tested devices range from 0.1 (minimum) to 240 (maximum) ms. » 30 % of all devices are better. This means that the measured response time is better than the average of all tested devices (21.5 ms). | ||
| ↔ Response Time 50% Grey to 80% Grey | ||
| 31.5 ms ... rise ↗ and fall ↘ combined | ↗ 14 ms rise | 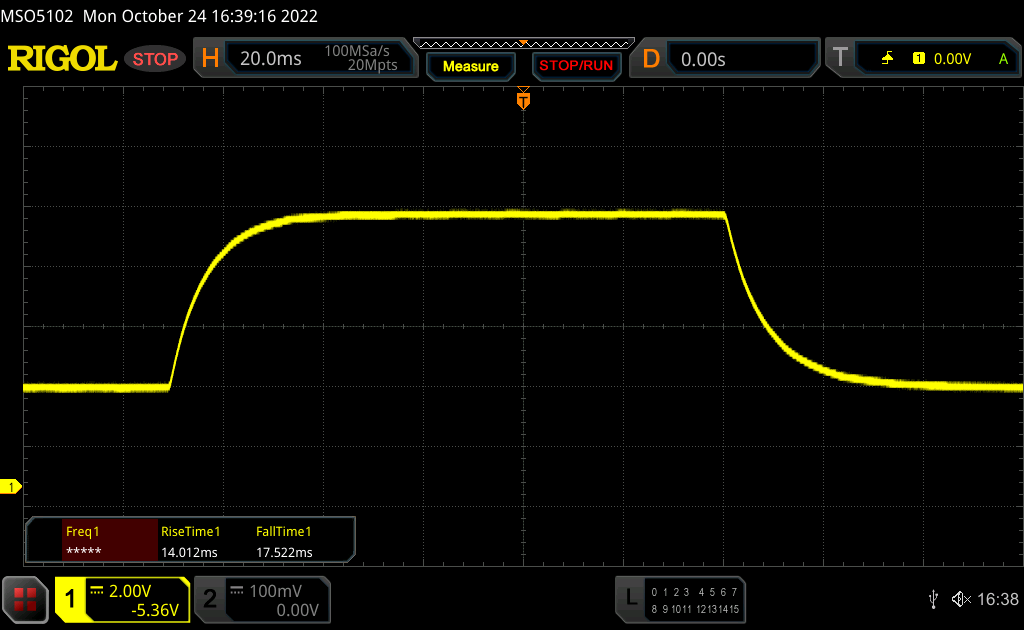 |
| ↘ 17.5 ms fall | ||
| The screen shows slow response rates in our tests and will be unsatisfactory for gamers. In comparison, all tested devices range from 0.2 (minimum) to 636 (maximum) ms. » 36 % of all devices are better. This means that the measured response time is similar to the average of all tested devices (33.7 ms). | ||
Screen Flickering / PWM (Pulse-Width Modulation)
| Screen flickering / PWM not detected | 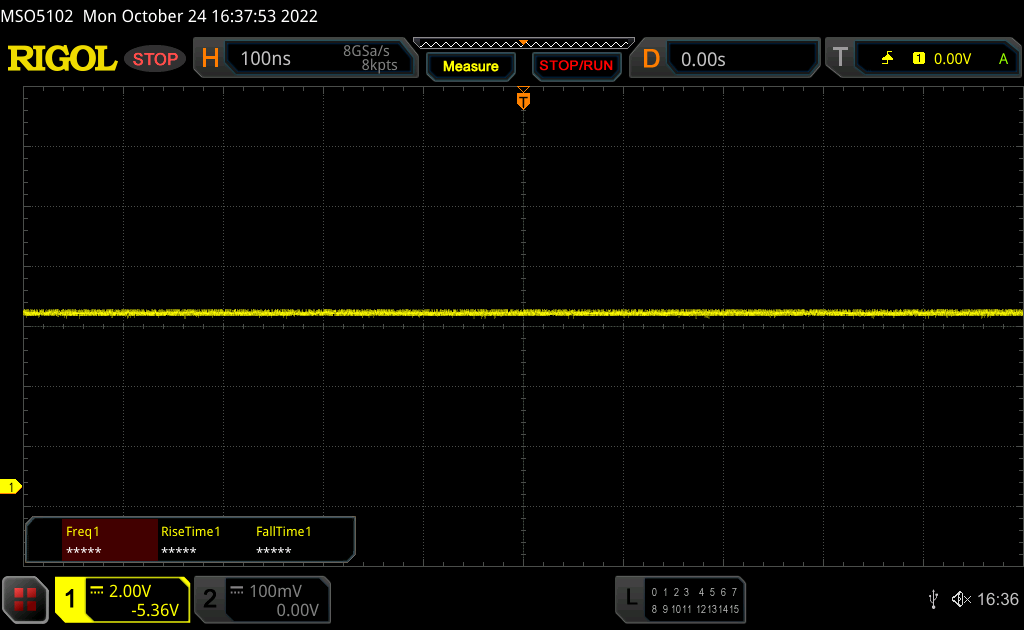 | ||
In comparison: 53 % of all tested devices do not use PWM to dim the display. If PWM was detected, an average of 17903 (minimum: 5 - maximum: 3846000) Hz was measured. | |||
Performance - Alder Lake-H & GeForce RTX 3050 Ti
Testing Conditions
There are once again two base profiles with three subprofiles, each, available on the preinstalled Control Center software (quiet & performance). Conveniently, the base profiles can be switched between via the F3 key. The following table lists the performance data for various power profiles.
| Profile | CPU Stress | GPU Stress | Combined CPU+GPU Stress | Max. fan noise |
|---|---|---|---|---|
| Quiet 20 dB | 10 watts | 20 watts | CPU: 10 watts GPU: 20 watts |
32.5 dB(A) |
| Quiet 30 dB | 13 watts | 25 watts | CPU: 13 watts GPU: 25 watts |
40 dB(A) |
| Quiet 40 dB | 15 watts | 35 watts | CPU: 15 watts GPU: 35 watts |
45.8 dB(A) |
| Performance Balanced | 60 -> 20 watts | 45 watts | CPU: 20 watts GPU: 40 watts |
45.8 dB(A) |
| Performance Enthusiast | 60 -> 40 watts | 45 watts | CPU: 25 watts GPU: 35 watts |
48.8 dB(A) |
| Performance Overboost | 60 -> 45 watts | 45 watts | CPU: 25 watts GPU: 35 watts |
51.1 dB(A) |
There are two noticeable differences between our test device and the older model. While the older Tiger Lake Core i7-11370H was limited to 46 watts, the newer Core i7-12700H has access to up to 60 W. Meanwhile, the RTX 3050 Ti now has to make do with 45 watts (35-watt TGP + 10 watts Dynamic Boost), whereas up to 50 watts was available to the GPU on the older model.
Since the Performance Enthusiast profile offers the best compromises overall, we chose it for our tests. In some of the following sections (and the system noisie section in particular), we will take a closer look at other profiles as well, although users may want to choose one of the weaker profiles to benefit from quieter fan noise in undemanding day-to-day scenrio.
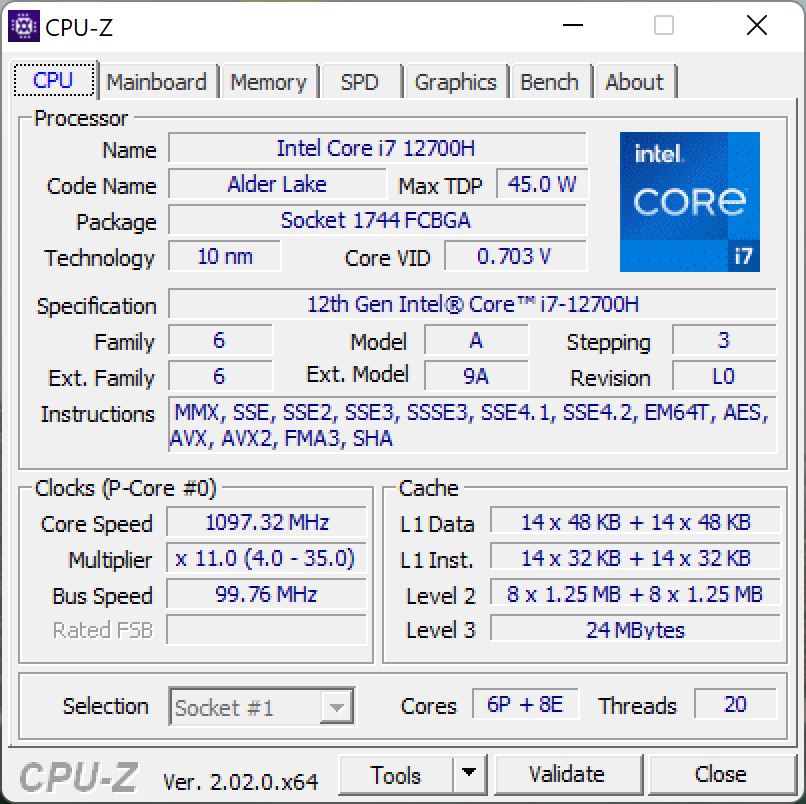
Processor - Intel Core i7-12700H
The Core i7-12700H is a 45-watt processor with 6 performance and 8 efficiency cores, enabling it to simultaneously process up to 20 threads. The TDP limits (60/40 watts) are held firmly and the performance is excellent overall. The older Core i7-11370H not only falls behind significantly in the multi-thread tests (the newer model is essentially twice as fast here), but also in the single-thread tests thanks to the new performance cores.
Cinebench R15 Multi Loop
Now for the question whether the Core i7-12700H makes more sense at these TDP values than an Alder Lake-P processor such as the Core i7-1260P (with 4 performance cores). The answer is unequivocally yes, since the number of performance cores is what ultimately matters. As we know, the performance cores become more and more inefficient at higher clock speeds. Although distributing the available TDP between more performance cores results in slightly lower clock speeds, it also results in lower temperatures which in turn benefit the performance. Additionally, the two additional cores more than compensate for the slightly lower clock speeds. While this would also be the case for a Core i7-1280P (same core configuration as the i7-12700H), the OEM does not offer Alder Lake-P chips for the barebone version of the Vision 14 with dual heatpipes.
The advantage of the Core i7-12700H becomes very apparent in a comparison with the Lenovo Yoga 9i 14, which runs the Core i7-1260P at a very similar TDP of 64/38 watts. Regardless, the Core i7-12700H outperforms it dramatically in the multi-thread tests (~18 % in our CB R15 multi loop). That being said, it should be noted that the Core i7-12700H is not able to unleash its full potential here, which would require over 120 watts for the maximum all-core clock speeds. The CPU performance of the iGPU version of the Vision 14 is identical.
In battery mode, the processor is limited to 45 and subsequently 40 watts, meaning the performance level remains fairly high. The performance dropoff becomes more significant at battery levels below 20 %. More CPU benchmarks can be found in our tech section.
Cinebench R23: Multi Core | Single Core
Cinebench R20: CPU (Multi Core) | CPU (Single Core)
Cinebench R15: CPU Multi 64Bit | CPU Single 64Bit
Blender: v2.79 BMW27 CPU
7-Zip 18.03: 7z b 4 | 7z b 4 -mmt1
Geekbench 5.5: Multi-Core | Single-Core
HWBOT x265 Benchmark v2.2: 4k Preset
LibreOffice : 20 Documents To PDF
R Benchmark 2.5: Overall mean
| CPU Performance Rating | |
| Average Intel Core i7-12700H | |
| Dell Inspiron 14 Plus 7420 | |
| SCHENKER Vision 14 2022 RTX 3050 Ti | |
| Apple MacBook Pro 14 2021 M1 Pro Entry -8! | |
| Lenovo Yoga 9i 14 2022 i7-1260P | |
| Huawei MateBook X Pro 2022 | |
| Average of class Subnotebook | |
| Asus Vivobook Pro 14 M3401QC-KM007T | |
| SCHENKER Vision 14 | |
| Cinebench R23 / Multi Core | |
| Average Intel Core i7-12700H (4032 - 19330, n=63) | |
| SCHENKER Vision 14 2022 RTX 3050 Ti | |
| Dell Inspiron 14 Plus 7420 | |
| Lenovo Yoga 9i 14 2022 i7-1260P | |
| Average of class Subnotebook (2485 - 16201, n=68, last 2 years) | |
| Apple MacBook Pro 14 2021 M1 Pro Entry | |
| Huawei MateBook X Pro 2022 | |
| Asus Vivobook Pro 14 M3401QC-KM007T | |
| SCHENKER Vision 14 | |
| Cinebench R23 / Single Core | |
| Lenovo Yoga 9i 14 2022 i7-1260P | |
| Dell Inspiron 14 Plus 7420 | |
| Average Intel Core i7-12700H (778 - 1826, n=62) | |
| SCHENKER Vision 14 2022 RTX 3050 Ti | |
| Huawei MateBook X Pro 2022 | |
| Average of class Subnotebook (598 - 1934, n=68, last 2 years) | |
| Apple MacBook Pro 14 2021 M1 Pro Entry | |
| SCHENKER Vision 14 | |
| Asus Vivobook Pro 14 M3401QC-KM007T | |
| Cinebench R20 / CPU (Multi Core) | |
| Average Intel Core i7-12700H (1576 - 7407, n=63) | |
| SCHENKER Vision 14 2022 RTX 3050 Ti | |
| Dell Inspiron 14 Plus 7420 | |
| Lenovo Yoga 9i 14 2022 i7-1260P | |
| Average of class Subnotebook (810 - 6314, n=64, last 2 years) | |
| Huawei MateBook X Pro 2022 | |
| Asus Vivobook Pro 14 M3401QC-KM007T | |
| SCHENKER Vision 14 | |
| Cinebench R20 / CPU (Single Core) | |
| SCHENKER Vision 14 2022 RTX 3050 Ti | |
| Dell Inspiron 14 Plus 7420 | |
| Average Intel Core i7-12700H (300 - 704, n=63) | |
| Huawei MateBook X Pro 2022 | |
| Lenovo Yoga 9i 14 2022 i7-1260P | |
| Average of class Subnotebook (216 - 738, n=64, last 2 years) | |
| SCHENKER Vision 14 | |
| Asus Vivobook Pro 14 M3401QC-KM007T | |
| Cinebench R15 / CPU Multi 64Bit | |
| Average Intel Core i7-12700H (1379 - 2916, n=69) | |
| Dell Inspiron 14 Plus 7420 | |
| SCHENKER Vision 14 2022 RTX 3050 Ti | |
| Huawei MateBook X Pro 2022 | |
| Huawei MateBook X Pro 2022 | |
| Lenovo Yoga 9i 14 2022 i7-1260P | |
| Average of class Subnotebook (514 - 2581, n=70, last 2 years) | |
| Asus Vivobook Pro 14 M3401QC-KM007T | |
| Apple MacBook Pro 14 2021 M1 Pro Entry | |
| SCHENKER Vision 14 | |
| SCHENKER Vision 14 | |
| Cinebench R15 / CPU Single 64Bit | |
| SCHENKER Vision 14 2022 RTX 3050 Ti | |
| Dell Inspiron 14 Plus 7420 | |
| Average Intel Core i7-12700H (113 - 263, n=64) | |
| Huawei MateBook X Pro 2022 | |
| Lenovo Yoga 9i 14 2022 i7-1260P | |
| Average of class Subnotebook (91.8 - 280, n=62, last 2 years) | |
| SCHENKER Vision 14 | |
| Asus Vivobook Pro 14 M3401QC-KM007T | |
| Apple MacBook Pro 14 2021 M1 Pro Entry | |
| Blender / v2.79 BMW27 CPU | |
| SCHENKER Vision 14 | |
| Average of class Subnotebook (201 - 1600, n=66, last 2 years) | |
| Asus Vivobook Pro 14 M3401QC-KM007T | |
| Huawei MateBook X Pro 2022 | |
| Lenovo Yoga 9i 14 2022 i7-1260P | |
| SCHENKER Vision 14 2022 RTX 3050 Ti | |
| Dell Inspiron 14 Plus 7420 | |
| Average Intel Core i7-12700H (168 - 732, n=62) | |
| 7-Zip 18.03 / 7z b 4 | |
| Average Intel Core i7-12700H (22844 - 73067, n=62) | |
| Dell Inspiron 14 Plus 7420 | |
| SCHENKER Vision 14 2022 RTX 3050 Ti | |
| Lenovo Yoga 9i 14 2022 i7-1260P | |
| Average of class Subnotebook (16223 - 67444, n=57, last 2 years) | |
| Huawei MateBook X Pro 2022 | |
| Asus Vivobook Pro 14 M3401QC-KM007T | |
| SCHENKER Vision 14 | |
| 7-Zip 18.03 / 7z b 4 -mmt1 | |
| SCHENKER Vision 14 2022 RTX 3050 Ti | |
| Average Intel Core i7-12700H (2743 - 5972, n=62) | |
| Dell Inspiron 14 Plus 7420 | |
| SCHENKER Vision 14 | |
| Huawei MateBook X Pro 2022 | |
| Average of class Subnotebook (2197 - 6403, n=58, last 2 years) | |
| Asus Vivobook Pro 14 M3401QC-KM007T | |
| Lenovo Yoga 9i 14 2022 i7-1260P | |
| Geekbench 5.5 / Multi-Core | |
| Average Intel Core i7-12700H (5144 - 13745, n=63) | |
| Dell Inspiron 14 Plus 7420 | |
| SCHENKER Vision 14 2022 RTX 3050 Ti | |
| Lenovo Yoga 9i 14 2022 i7-1260P | |
| Huawei MateBook X Pro 2022 | |
| Apple MacBook Pro 14 2021 M1 Pro Entry | |
| Average of class Subnotebook (4274 - 12580, n=65, last 2 years) | |
| Asus Vivobook Pro 14 M3401QC-KM007T | |
| SCHENKER Vision 14 | |
| Geekbench 5.5 / Single-Core | |
| SCHENKER Vision 14 2022 RTX 3050 Ti | |
| Apple MacBook Pro 14 2021 M1 Pro Entry | |
| Lenovo Yoga 9i 14 2022 i7-1260P | |
| Huawei MateBook X Pro 2022 | |
| Average Intel Core i7-12700H (803 - 1851, n=63) | |
| Average of class Subnotebook (672 - 2350, n=65, last 2 years) | |
| Dell Inspiron 14 Plus 7420 | |
| SCHENKER Vision 14 | |
| Asus Vivobook Pro 14 M3401QC-KM007T | |
| HWBOT x265 Benchmark v2.2 / 4k Preset | |
| Average Intel Core i7-12700H (4.67 - 21.8, n=63) | |
| Dell Inspiron 14 Plus 7420 | |
| SCHENKER Vision 14 2022 RTX 3050 Ti | |
| Lenovo Yoga 9i 14 2022 i7-1260P | |
| Average of class Subnotebook (1.5 - 19.4, n=56, last 2 years) | |
| Huawei MateBook X Pro 2022 | |
| Asus Vivobook Pro 14 M3401QC-KM007T | |
| SCHENKER Vision 14 | |
| LibreOffice / 20 Documents To PDF | |
| Asus Vivobook Pro 14 M3401QC-KM007T | |
| Average of class Subnotebook (40.1 - 120.5, n=57, last 2 years) | |
| Dell Inspiron 14 Plus 7420 | |
| SCHENKER Vision 14 | |
| Lenovo Yoga 9i 14 2022 i7-1260P | |
| Average Intel Core i7-12700H (34.2 - 95.3, n=62) | |
| SCHENKER Vision 14 2022 RTX 3050 Ti | |
| Huawei MateBook X Pro 2022 | |
| R Benchmark 2.5 / Overall mean | |
| Asus Vivobook Pro 14 M3401QC-KM007T | |
| SCHENKER Vision 14 | |
| Average of class Subnotebook (0.4397 - 1.236, n=57, last 2 years) | |
| Lenovo Yoga 9i 14 2022 i7-1260P | |
| Huawei MateBook X Pro 2022 | |
| Dell Inspiron 14 Plus 7420 | |
| Average Intel Core i7-12700H (0.4441 - 1.052, n=62) | |
| SCHENKER Vision 14 2022 RTX 3050 Ti | |
* ... smaller is better
AIDA64: FP32 Ray-Trace | FPU Julia | CPU SHA3 | CPU Queen | FPU SinJulia | FPU Mandel | CPU AES | CPU ZLib | FP64 Ray-Trace | CPU PhotoWorxx
| Performance Rating | |
| Average Intel Core i7-12700H | |
| Dell Inspiron 14 Plus 7420 | |
| SCHENKER Vision 14 2022 RTX 3050 Ti | |
| Asus Vivobook Pro 14 M3401QC-KM007T | |
| Average of class Subnotebook | |
| Huawei MateBook X Pro 2022 | |
| Lenovo Yoga 9i 14 2022 i7-1260P | |
| AIDA64 / FP32 Ray-Trace | |
| SCHENKER Vision 14 2022 RTX 3050 Ti | |
| Dell Inspiron 14 Plus 7420 | |
| Asus Vivobook Pro 14 M3401QC-KM007T | |
| Average Intel Core i7-12700H (2585 - 17957, n=62) | |
| Average of class Subnotebook (343 - 25961, n=57, last 2 years) | |
| Lenovo Yoga 9i 14 2022 i7-1260P | |
| Huawei MateBook X Pro 2022 | |
| AIDA64 / FPU Julia | |
| Asus Vivobook Pro 14 M3401QC-KM007T | |
| SCHENKER Vision 14 2022 RTX 3050 Ti | |
| Dell Inspiron 14 Plus 7420 | |
| Average Intel Core i7-12700H (12439 - 90760, n=62) | |
| Average of class Subnotebook (11867 - 111109, n=57, last 2 years) | |
| Huawei MateBook X Pro 2022 | |
| Lenovo Yoga 9i 14 2022 i7-1260P | |
| AIDA64 / CPU SHA3 | |
| Average Intel Core i7-12700H (833 - 4242, n=62) | |
| SCHENKER Vision 14 2022 RTX 3050 Ti | |
| Dell Inspiron 14 Plus 7420 | |
| Average of class Subnotebook (453 - 4646, n=57, last 2 years) | |
| Asus Vivobook Pro 14 M3401QC-KM007T | |
| Lenovo Yoga 9i 14 2022 i7-1260P | |
| Huawei MateBook X Pro 2022 | |
| AIDA64 / CPU Queen | |
| Average Intel Core i7-12700H (57923 - 103202, n=62) | |
| Dell Inspiron 14 Plus 7420 | |
| SCHENKER Vision 14 2022 RTX 3050 Ti | |
| Average of class Subnotebook (15447 - 115300, n=57, last 2 years) | |
| Huawei MateBook X Pro 2022 | |
| Asus Vivobook Pro 14 M3401QC-KM007T | |
| Lenovo Yoga 9i 14 2022 i7-1260P | |
| AIDA64 / FPU SinJulia | |
| Average Intel Core i7-12700H (3249 - 9939, n=62) | |
| Asus Vivobook Pro 14 M3401QC-KM007T | |
| SCHENKER Vision 14 2022 RTX 3050 Ti | |
| Dell Inspiron 14 Plus 7420 | |
| Average of class Subnotebook (1223 - 14944, n=57, last 2 years) | |
| Huawei MateBook X Pro 2022 | |
| Lenovo Yoga 9i 14 2022 i7-1260P | |
| AIDA64 / FPU Mandel | |
| Asus Vivobook Pro 14 M3401QC-KM007T | |
| Dell Inspiron 14 Plus 7420 | |
| SCHENKER Vision 14 2022 RTX 3050 Ti | |
| Average Intel Core i7-12700H (7135 - 44760, n=62) | |
| Average of class Subnotebook (6379 - 59053, n=57, last 2 years) | |
| Huawei MateBook X Pro 2022 | |
| Lenovo Yoga 9i 14 2022 i7-1260P | |
| AIDA64 / CPU AES | |
| Asus Vivobook Pro 14 M3401QC-KM007T | |
| Average Intel Core i7-12700H (31839 - 144360, n=62) | |
| SCHENKER Vision 14 2022 RTX 3050 Ti | |
| Dell Inspiron 14 Plus 7420 | |
| Huawei MateBook X Pro 2022 | |
| Average of class Subnotebook (638 - 161430, n=57, last 2 years) | |
| Lenovo Yoga 9i 14 2022 i7-1260P | |
| AIDA64 / CPU ZLib | |
| Average Intel Core i7-12700H (305 - 1171, n=62) | |
| SCHENKER Vision 14 2022 RTX 3050 Ti | |
| Dell Inspiron 14 Plus 7420 | |
| Average of class Subnotebook (270 - 1123, n=57, last 2 years) | |
| Lenovo Yoga 9i 14 2022 i7-1260P | |
| Huawei MateBook X Pro 2022 | |
| Asus Vivobook Pro 14 M3401QC-KM007T | |
| AIDA64 / FP64 Ray-Trace | |
| SCHENKER Vision 14 2022 RTX 3050 Ti | |
| Dell Inspiron 14 Plus 7420 | |
| Average Intel Core i7-12700H (1437 - 9692, n=62) | |
| Asus Vivobook Pro 14 M3401QC-KM007T | |
| Average of class Subnotebook (204 - 14018, n=57, last 2 years) | |
| Lenovo Yoga 9i 14 2022 i7-1260P | |
| Huawei MateBook X Pro 2022 | |
| AIDA64 / CPU PhotoWorxx | |
| Huawei MateBook X Pro 2022 | |
| Average of class Subnotebook (7622 - 53954, n=57, last 2 years) | |
| Dell Inspiron 14 Plus 7420 | |
| Average Intel Core i7-12700H (12863 - 52207, n=62) | |
| SCHENKER Vision 14 2022 RTX 3050 Ti | |
| Lenovo Yoga 9i 14 2022 i7-1260P | |
| Asus Vivobook Pro 14 M3401QC-KM007T | |
System Performance
The Vision 14's very responsive subjective impression is confirmed by our synthetic benchmarks. During our testing, we did not encounter any issues. Schenker's decision not to use DDR5 RAM (due to cost, according to the manufacturer), does not impact daily use.
CrossMark: Overall | Productivity | Creativity | Responsiveness
| PCMark 10 / Score | |
| Average Intel Core i7-12700H, NVIDIA GeForce RTX 3050 Ti Laptop GPU (6623 - 7075, n=5) | |
| Dell Inspiron 14 Plus 7420 | |
| SCHENKER Vision 14 2022 RTX 3050 Ti | |
| Huawei MateBook X Pro 2022 | |
| Average of class Subnotebook (4384 - 7428, n=55, last 2 years) | |
| SCHENKER Vision 14 | |
| Asus Vivobook Pro 14 M3401QC-KM007T | |
| Lenovo Yoga 9i 14 2022 i7-1260P | |
| PCMark 10 / Essentials | |
| Lenovo Yoga 9i 14 2022 i7-1260P | |
| Huawei MateBook X Pro 2022 | |
| SCHENKER Vision 14 2022 RTX 3050 Ti | |
| Average Intel Core i7-12700H, NVIDIA GeForce RTX 3050 Ti Laptop GPU (9540 - 10970, n=5) | |
| Average of class Subnotebook (8890 - 11168, n=55, last 2 years) | |
| Dell Inspiron 14 Plus 7420 | |
| Asus Vivobook Pro 14 M3401QC-KM007T | |
| SCHENKER Vision 14 | |
| PCMark 10 / Productivity | |
| Average Intel Core i7-12700H, NVIDIA GeForce RTX 3050 Ti Laptop GPU (8530 - 9555, n=5) | |
| Dell Inspiron 14 Plus 7420 | |
| SCHENKER Vision 14 | |
| Huawei MateBook X Pro 2022 | |
| SCHENKER Vision 14 2022 RTX 3050 Ti | |
| Asus Vivobook Pro 14 M3401QC-KM007T | |
| Average of class Subnotebook (6213 - 10279, n=55, last 2 years) | |
| Lenovo Yoga 9i 14 2022 i7-1260P | |
| PCMark 10 / Digital Content Creation | |
| Average Intel Core i7-12700H, NVIDIA GeForce RTX 3050 Ti Laptop GPU (8855 - 9542, n=5) | |
| SCHENKER Vision 14 2022 RTX 3050 Ti | |
| Dell Inspiron 14 Plus 7420 | |
| Average of class Subnotebook (4093 - 9749, n=55, last 2 years) | |
| Asus Vivobook Pro 14 M3401QC-KM007T | |
| Lenovo Yoga 9i 14 2022 i7-1260P | |
| SCHENKER Vision 14 | |
| Huawei MateBook X Pro 2022 | |
| CrossMark / Overall | |
| Huawei MateBook X Pro 2022 | |
| Average Intel Core i7-12700H, NVIDIA GeForce RTX 3050 Ti Laptop GPU (1654 - 1872, n=5) | |
| Dell Inspiron 14 Plus 7420 | |
| Lenovo Yoga 9i 14 2022 i7-1260P | |
| SCHENKER Vision 14 2022 RTX 3050 Ti | |
| Average of class Subnotebook (718 - 1876, n=61, last 2 years) | |
| SCHENKER Vision 14 | |
| Apple MacBook Pro 14 2021 M1 Pro Entry | |
| Asus Vivobook Pro 14 M3401QC-KM007T | |
| CrossMark / Productivity | |
| Huawei MateBook X Pro 2022 | |
| Average Intel Core i7-12700H, NVIDIA GeForce RTX 3050 Ti Laptop GPU (1595 - 1792, n=5) | |
| SCHENKER Vision 14 2022 RTX 3050 Ti | |
| Dell Inspiron 14 Plus 7420 | |
| Lenovo Yoga 9i 14 2022 i7-1260P | |
| SCHENKER Vision 14 | |
| Average of class Subnotebook (685 - 1829, n=61, last 2 years) | |
| Asus Vivobook Pro 14 M3401QC-KM007T | |
| Apple MacBook Pro 14 2021 M1 Pro Entry | |
| CrossMark / Creativity | |
| Apple MacBook Pro 14 2021 M1 Pro Entry | |
| Dell Inspiron 14 Plus 7420 | |
| Huawei MateBook X Pro 2022 | |
| Average Intel Core i7-12700H, NVIDIA GeForce RTX 3050 Ti Laptop GPU (1699 - 1993, n=5) | |
| Lenovo Yoga 9i 14 2022 i7-1260P | |
| SCHENKER Vision 14 2022 RTX 3050 Ti | |
| Average of class Subnotebook (776 - 2210, n=61, last 2 years) | |
| SCHENKER Vision 14 | |
| Asus Vivobook Pro 14 M3401QC-KM007T | |
| CrossMark / Responsiveness | |
| Huawei MateBook X Pro 2022 | |
| Average Intel Core i7-12700H, NVIDIA GeForce RTX 3050 Ti Laptop GPU (1383 - 1768, n=5) | |
| Lenovo Yoga 9i 14 2022 i7-1260P | |
| SCHENKER Vision 14 2022 RTX 3050 Ti | |
| SCHENKER Vision 14 | |
| Dell Inspiron 14 Plus 7420 | |
| Average of class Subnotebook (652 - 1899, n=61, last 2 years) | |
| Asus Vivobook Pro 14 M3401QC-KM007T | |
| Apple MacBook Pro 14 2021 M1 Pro Entry | |
| PCMark 10 Score | 6623 points | |
Help | ||
| AIDA64 / Memory Copy | |
| Average of class Subnotebook (22781 - 95353, n=57, last 2 years) | |
| Huawei MateBook X Pro 2022 | |
| Dell Inspiron 14 Plus 7420 | |
| Average Intel Core i7-12700H (25615 - 80511, n=62) | |
| SCHENKER Vision 14 2022 RTX 3050 Ti | |
| Asus Vivobook Pro 14 M3401QC-KM007T | |
| AIDA64 / Memory Read | |
| Huawei MateBook X Pro 2022 | |
| Dell Inspiron 14 Plus 7420 | |
| Average Intel Core i7-12700H (25586 - 79442, n=62) | |
| Average of class Subnotebook (23831 - 86433, n=57, last 2 years) | |
| Asus Vivobook Pro 14 M3401QC-KM007T | |
| SCHENKER Vision 14 2022 RTX 3050 Ti | |
| AIDA64 / Memory Write | |
| Average of class Subnotebook (23474 - 93382, n=57, last 2 years) | |
| Huawei MateBook X Pro 2022 | |
| Dell Inspiron 14 Plus 7420 | |
| Average Intel Core i7-12700H (23679 - 88660, n=62) | |
| SCHENKER Vision 14 2022 RTX 3050 Ti | |
| Asus Vivobook Pro 14 M3401QC-KM007T | |
| AIDA64 / Memory Latency | |
| Dell Inspiron 14 Plus 7420 | |
| Huawei MateBook X Pro 2022 | |
| Average of class Subnotebook (18.8 - 172, n=52, last 2 years) | |
| SCHENKER Vision 14 2022 RTX 3050 Ti | |
| Asus Vivobook Pro 14 M3401QC-KM007T | |
| Average Intel Core i7-12700H (76.2 - 133.9, n=60) | |
* ... smaller is better
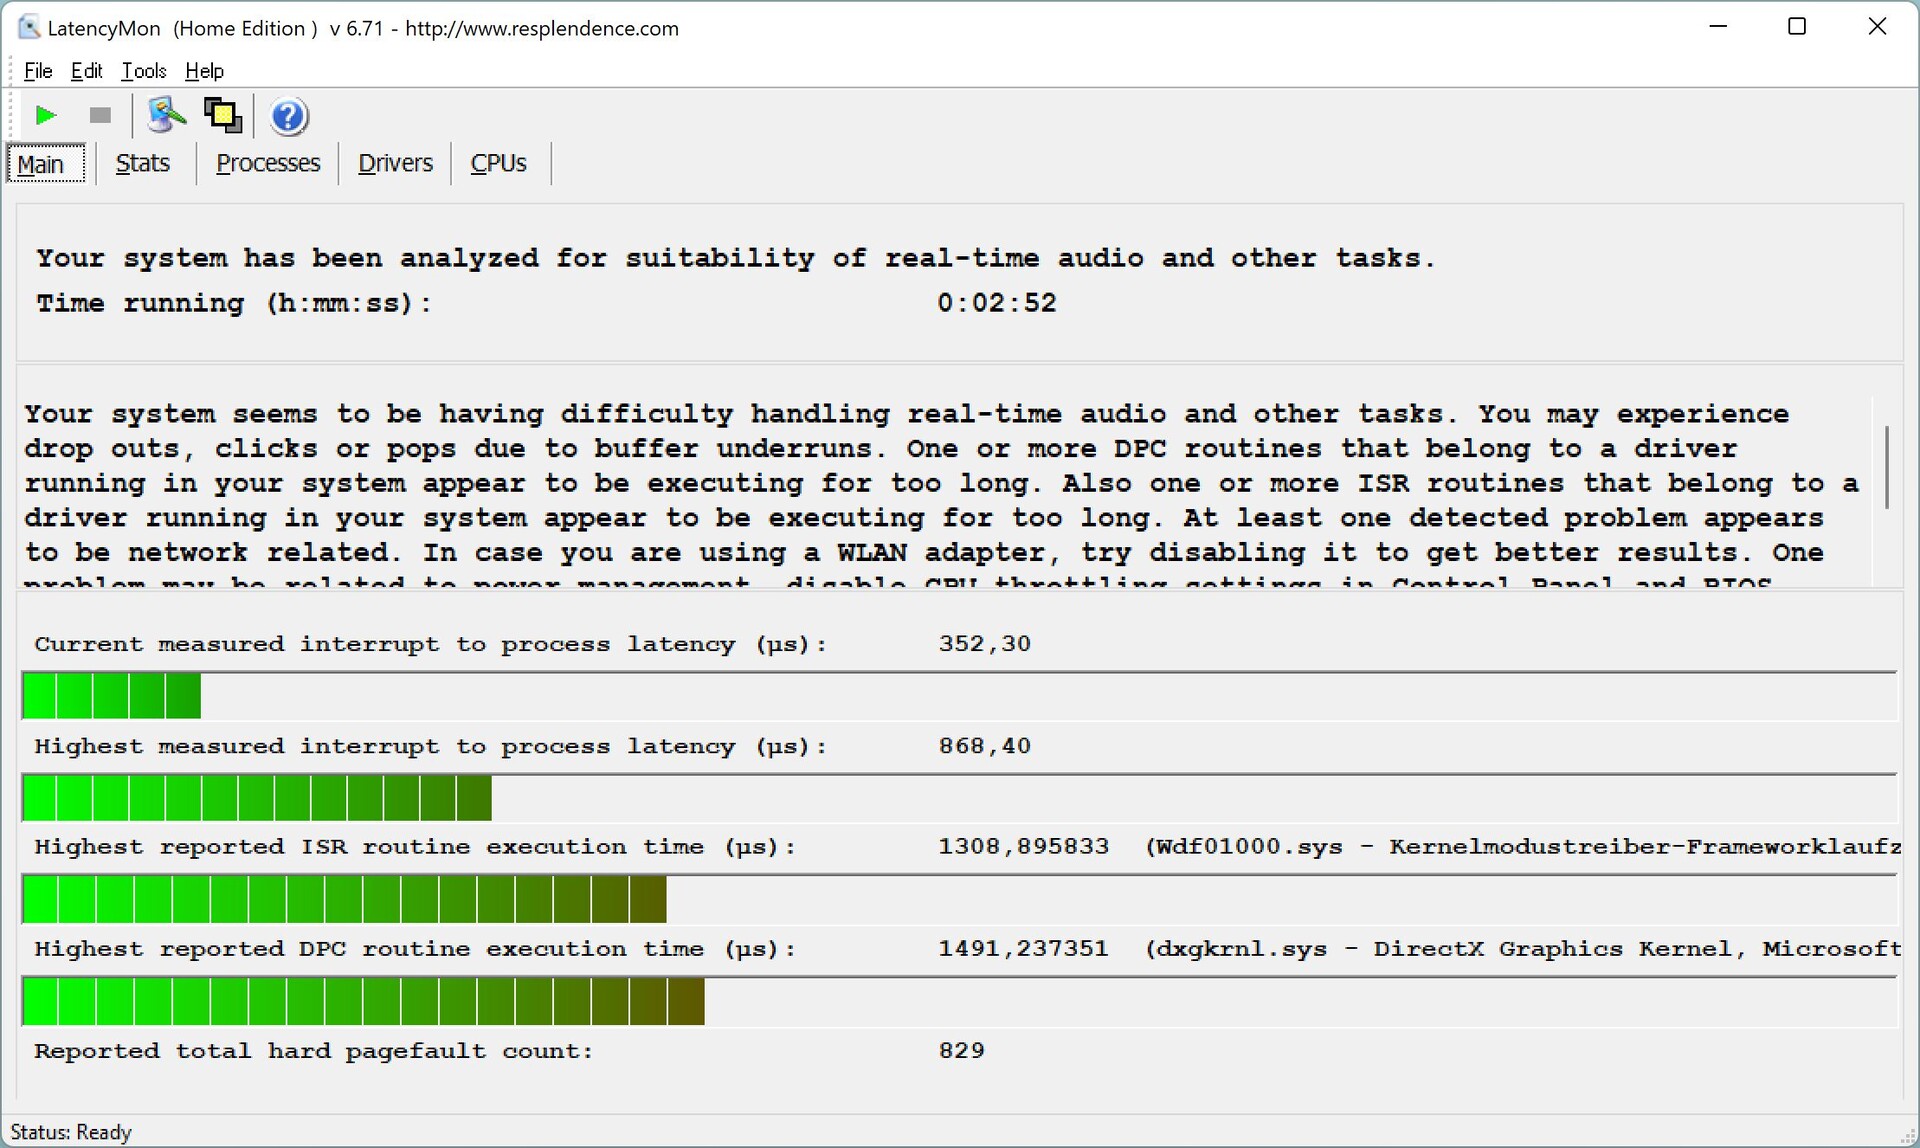
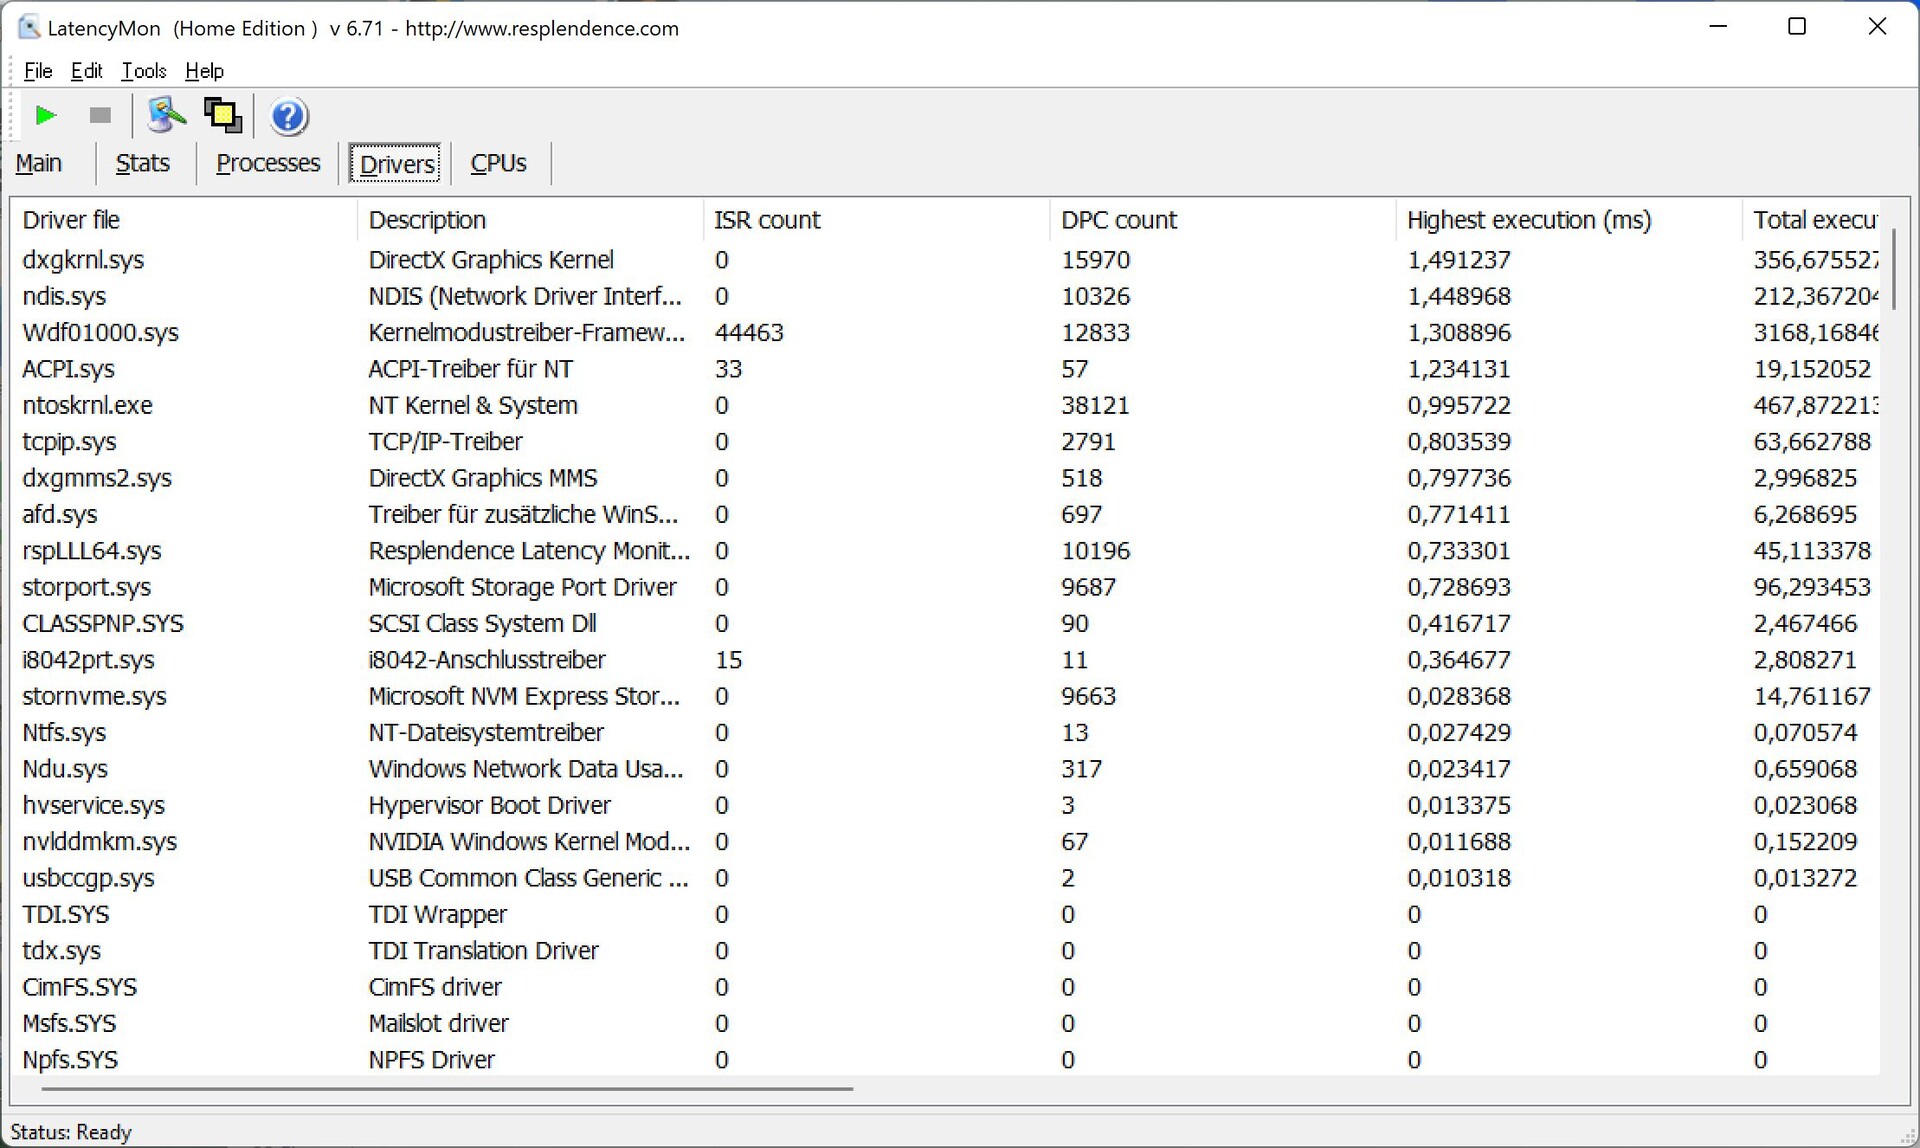
DPC Latency
The Vision 14 shows slightly increased latencies in our standardized latency test on the current BIOS version, making it a suboptimal choice for real-time applications. No frames were dropped during 4K video playback on YouTube.
| DPC Latencies / LatencyMon - interrupt to process latency (max), Web, Youtube, Prime95 | |
| Asus Vivobook Pro 14 M3401QC-KM007T | |
| Lenovo Yoga 9i 14 2022 i7-1260P | |
| Huawei MateBook X Pro 2022 | |
| SCHENKER Vision 14 2022 RTX 3050 Ti | |
| Dell Inspiron 14 Plus 7420 | |
* ... smaller is better
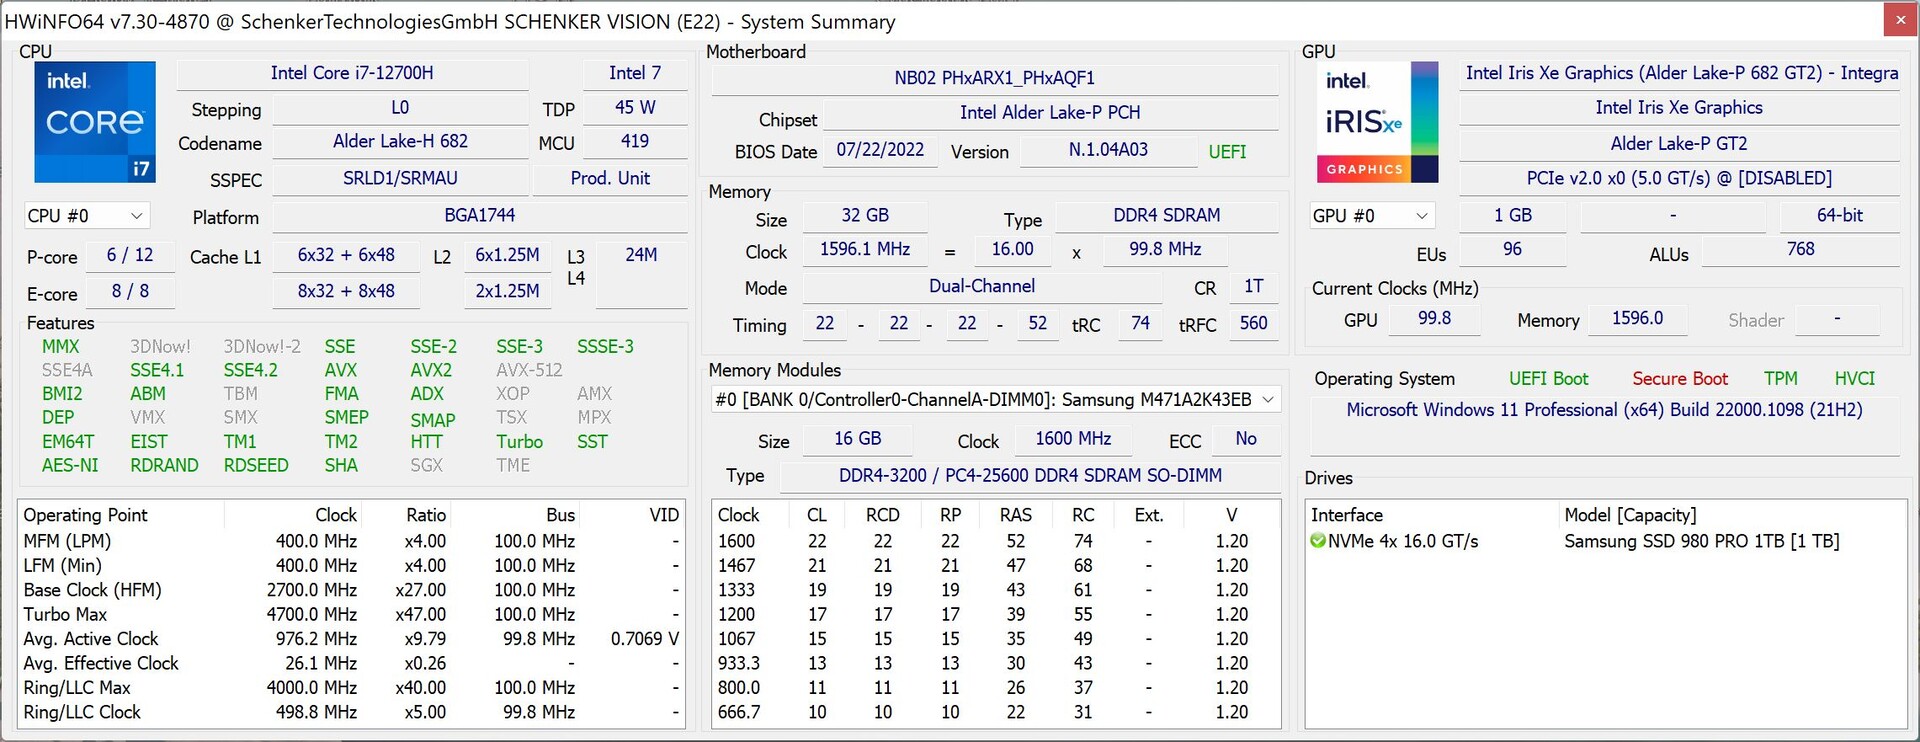
Storage Solution
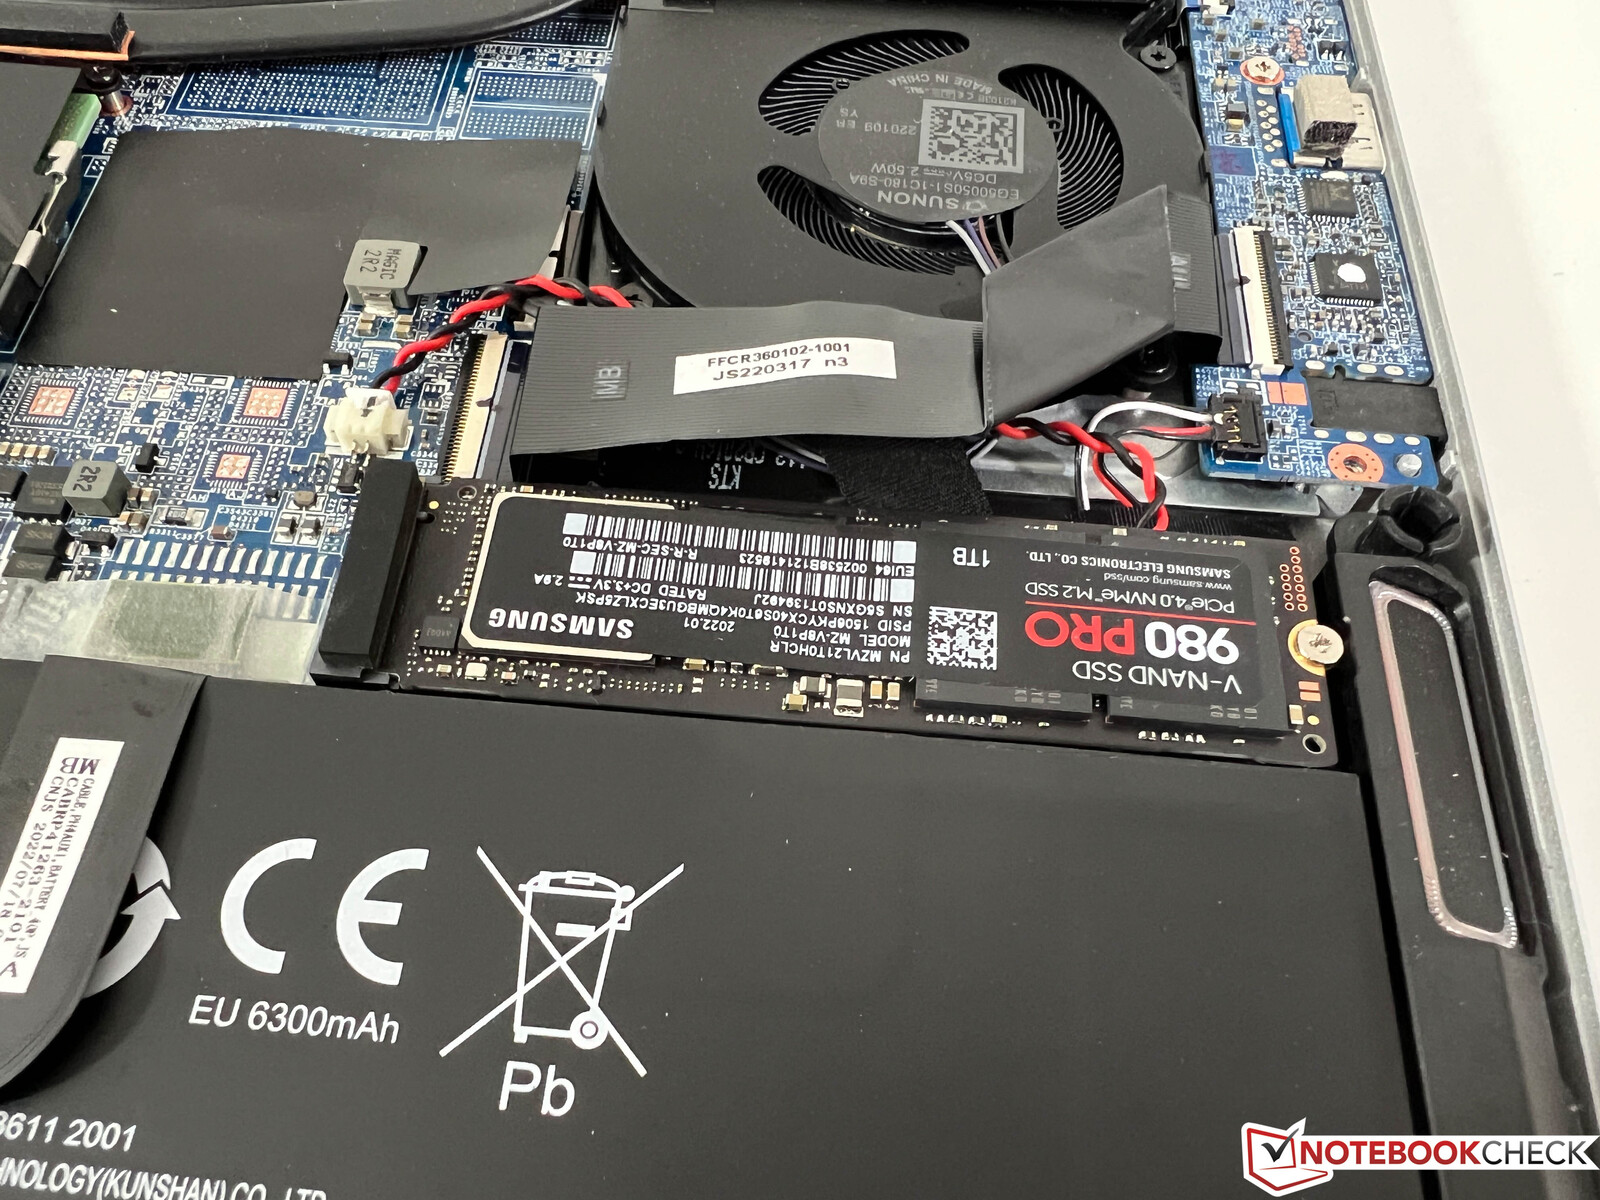
As previously mentioned, selecting the larger 99-Wh battery means there is no secondary M.2-2280 slot. Our test device is equipped with the Samsung Pro 1 TB, which reaches transfer speeds of up to 7 GB/s, making it one of the fastest drives available today. There are no thermal issues either and the performance remains entirely consistent even under continuous load. More SSD benchmarks can be found here.

* ... smaller is better
Disk Throttling: DiskSpd Read Loop, Queue Depth 8
GPU Performance
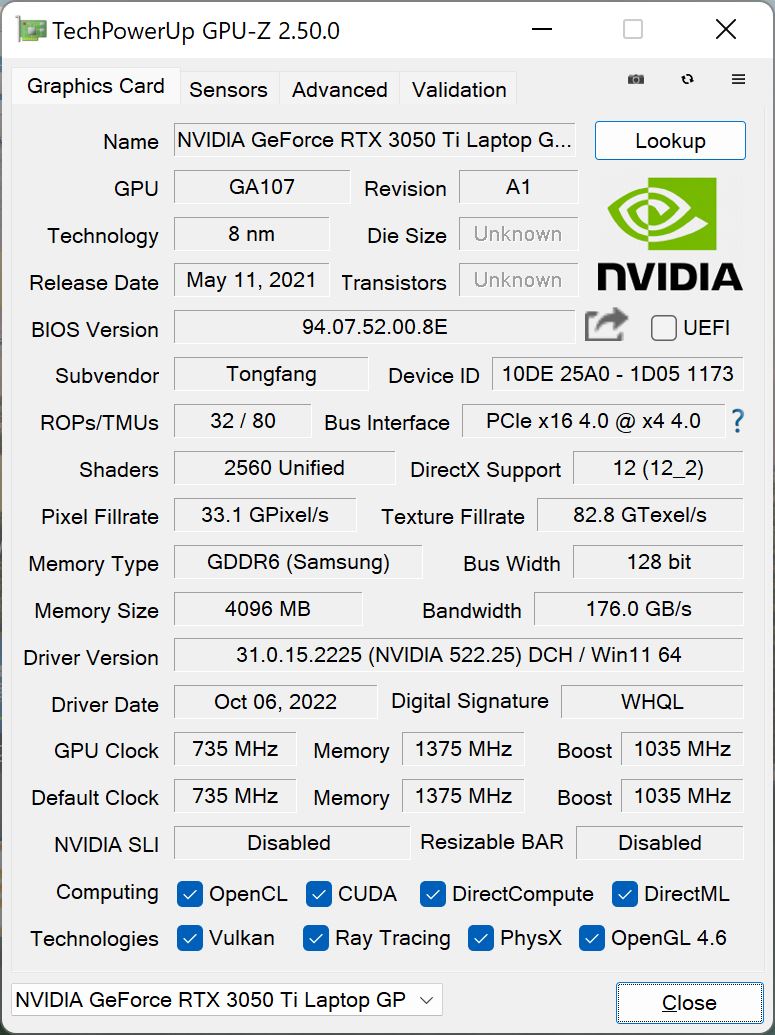
The Vision 14 still uses the popular Nvidia GeForce RTX 3050 Ti with a TGP of 35 watts (and an additional 10 watt Dynamic Boost from the CPU). The Nvidia RTX 3050 Ti is rated for a TGP of 35-80 watts, meaning our test model uses a weaker version of the chip. Benchmarking the Vision 14 reflects this with results that are slightly subpar for this GPU.
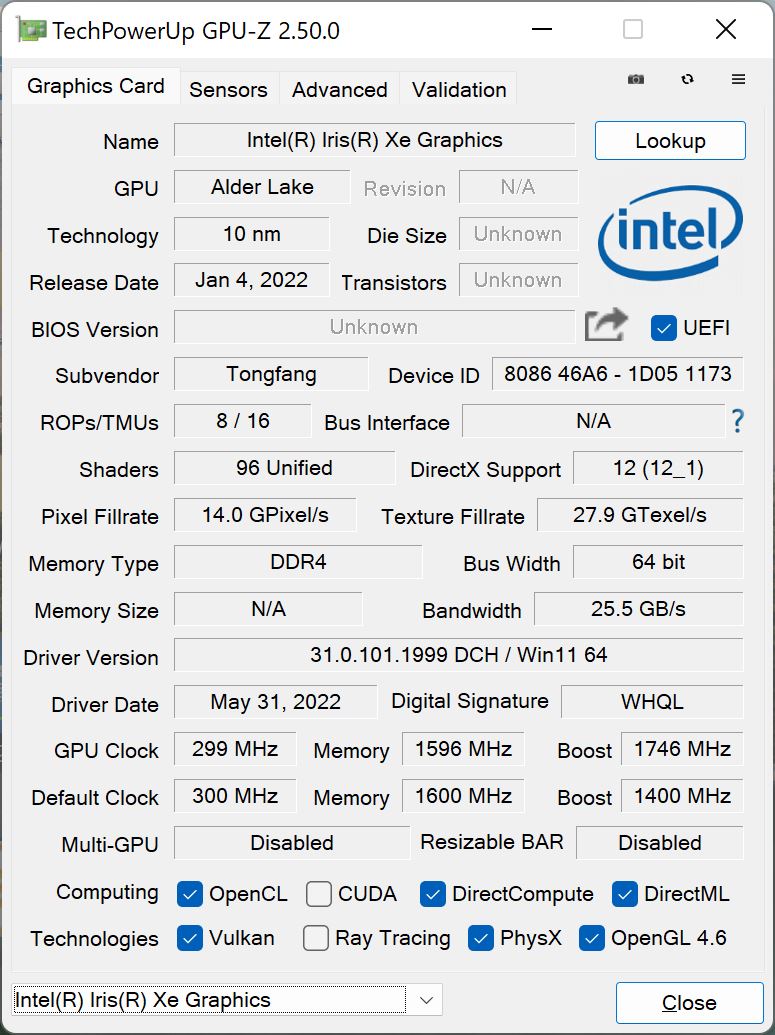
Compared to the predecessor with the RTX 3050 Ti, the latest Vision 14 is able to secure a small lead and lands on par with the M1 Pro GPU in the base-model Apple MacBook Pro 14. When choosing the iGPU version of the Vision 14, Intel's Iris Xe Graphics G7 with 96 EUs is used instead, resulting in a significantly slower GPU performance, as evidenced by the competitors Lenovo Yoga 9i 14 and Huawei MateBook X Pro.
The GPU performance remains consistent even under continuous load, although it does suffer quite a bit in battery mode (~ 75 %). More GPU benchmarks can be found here.
| 3DMark 11 Performance | 16439 points | |
| 3DMark Fire Strike Score | 11233 points | |
| 3DMark Time Spy Score | 5098 points | |
Help | ||
| Blender / v3.3 Classroom OPTIX/RTX | |
| Average of class Subnotebook (53 - 72, n=3, last 2 years) | |
| Dell Inspiron 14 Plus 7420 | |
| Asus VivoBook Pro 16X OLED N7600PC-L2026X | |
| SCHENKER Vision 14 2022 RTX 3050 Ti | |
| Average NVIDIA GeForce RTX 3050 Ti Laptop GPU (48 - 60, n=7) | |
| Dell Precision 7670 | |
| Lenovo ThinkBook 16p G3 ARH | |
| Blender / v3.3 Classroom CUDA | |
| Asus VivoBook Pro 16X OLED N7600PC-L2026X | |
| Dell Inspiron 14 Plus 7420 | |
| Average of class Subnotebook (91 - 115, n=3, last 2 years) | |
| SCHENKER Vision 14 2022 RTX 3050 Ti | |
| Average NVIDIA GeForce RTX 3050 Ti Laptop GPU (83 - 104, n=7) | |
| Dell Precision 7670 | |
| Lenovo ThinkBook 16p G3 ARH | |
| Blender / v3.3 Classroom CPU | |
| Asus VivoBook Pro 16X OLED N7600PC-L2026X | |
| Average of class Subnotebook (336 - 1548, n=54, last 2 years) | |
| Huawei MateBook X Pro 2022 | |
| Lenovo ThinkPad T14 G3-21CF004NGE | |
| Dell Inspiron 14 Plus 7420 | |
| SCHENKER Vision 14 2022 RTX 3050 Ti | |
| Average NVIDIA GeForce RTX 3050 Ti Laptop GPU (379 - 557, n=7) | |
| Lenovo ThinkBook 16p G3 ARH | |
| Dell Precision 7670 | |
* ... smaller is better
Gaming Performance
Since the gaming performance is still primarily defined by the GeForce RTX 3050 Ti, even though some benchmark results show the advantages of the faster processor, there are only minor differences between the new and the older Vision 14 particularly at very high quality settings. Many modern titles run smoothly even at high or maximum details, although the graphics settings will have to be reduced in very demanding titles such as Cyberpunk 2077 or F1 2022 in order to achieve smooth frame rates.
Witcher 3 FPS Graph
The gaming performance remains consistent under continuous stress, as our Witcher 3 loop shows. However, testing whether the quieter power profiles can provide enough gaming performance may be worthwhile depending on the game. In battery mode, the gaming performance is significantly reduced and the details have to be reduced drastically for games to remain playable.
| low | med. | high | ultra | QHD | |
| GTA V (2015) | 170.6 | 163.3 | 121 | 67.5 | 48.4 |
| The Witcher 3 (2015) | 249 | 264 | 92 | 44.2 | |
| Dota 2 Reborn (2015) | 148.1 | 121.9 | 114.4 | 109.1 | |
| Final Fantasy XV Benchmark (2018) | 130.6 | 71 | 50.1 | 36.2 | |
| X-Plane 11.11 (2018) | 112.4 | 99.6 | 82.3 | ||
| Far Cry 5 (2018) | 121 | 87 | 79 | 75 | 53 |
| Strange Brigade (2018) | 259 | 126.9 | 100.8 | 86 | 63 |
| F1 2021 (2021) | 223 | 148 | 120.8 | 59.2 | 41 |
| Cyberpunk 2077 1.6 (2022) | 56 | 49 | 40 | 31 | 20 |
| F1 22 (2022) | 136.1 | 124.8 | 93 | 28 | 16.1 |
Emissions - Vision 14 Gets Too Loud
System Noise
Compared to the previous model, nothing has changed in terms of the cooling solution. The Vision 14 still uses two fans and two heatpipes. Although some of the results have slightly shifted, they essentially match those of the older model. Our results from various scenarios are listed in the following table. We did not notice any electronic noise.
| Profile | Cinebench R23 Multi | Witcher 3 Ultra | Stress test |
|---|---|---|---|
| Quiet 20 dB | 26 dB(A) | 32.5 dB(A) | 32.5 dB(A) |
| Quiet 30 dB | 26 dB(A) | 40 dB(A) | 40 dB(A) |
| Quiet 40 dB | 27.8 dB(A) | 45.8 dB(A) | 45.8 dB(A) |
| Performance Balanced | 29.2 dB(A) | 45.8 dB(A) | 45.8 dB(A) |
| Performance Enthusiast | 46 dB(A) | 48.2dB(A) | 48.8 dB(A) |
| Performance Overboost | 48.2 dB(A) | 51.1 dB(A) | 51.1 dB(A) |
Noise Level
| Idle |
| 24.4 / 24.4 / 27.8 dB(A) |
| Load |
| 43.3 / 48.8 dB(A) |
 | ||
30 dB silent 40 dB(A) audible 50 dB(A) loud |
||
min: | ||
| SCHENKER Vision 14 2022 RTX 3050 Ti GeForce RTX 3050 Ti Laptop GPU, i7-12700H, Samsung SSD 980 Pro 1TB MZ-V8P1T0BW | Huawei MateBook X Pro 2022 Iris Xe G7 96EUs, i7-1260P, Silicon Motion PCIe-8 SSD 1TB | Lenovo Yoga 9i 14 2022 i7-1260P Iris Xe G7 96EUs, i7-1260P, Samsung PM9A1 MZVL21T0HCLR | Dell Inspiron 14 Plus 7420 GeForce RTX 3050 4GB Laptop GPU, i7-12700H, SK Hynix BC711 512GB HFM512GD3GX013N | Asus Vivobook Pro 14 M3401QC-KM007T GeForce RTX 3050 4GB Laptop GPU, R5 5600H, Intel SSD 670p SSDPEKNU512GZ | Apple MacBook Pro 14 2021 M1 Pro Entry M1 Pro 14-Core GPU, M1 Pro 8-Core, Apple SSD AP0512 | SCHENKER Vision 14 GeForce RTX 3050 Ti Laptop GPU, i7-11370H, Samsung SSD 980 Pro 1TB MZ-V8P1T0BW | |
|---|---|---|---|---|---|---|---|
| Noise | 12% | 6% | 1% | -11% | 12% | 2% | |
| off / environment * | 24.4 | 23.5 4% | 24.1 1% | 23.2 5% | 25.4 -4% | 24.8 -2% | 24.3 -0% |
| Idle Minimum * | 24.4 | 23.5 4% | 24.1 1% | 23.2 5% | 25.4 -4% | 24.8 -2% | 24.3 -0% |
| Idle Average * | 24.4 | 23.5 4% | 24.1 1% | 23.2 5% | 25.4 -4% | 24.8 -2% | 24.3 -0% |
| Idle Maximum * | 27.8 | 25.9 7% | 30 -8% | 23.2 17% | 30.9 -11% | 24.8 11% | 25.9 7% |
| Load Average * | 43.3 | 33.8 22% | 39.4 9% | 47.5 -10% | 56 -29% | 27.8 36% | 43.3 -0% |
| Witcher 3 ultra * | 48.2 | 35.4 27% | 39.4 18% | 51.7 -7% | 27.8 42% | 44.6 7% | |
| Load Maximum * | 48.8 | 40.6 17% | 39.4 19% | 51.7 -6% | 56 -15% | 49.5 -1% | 49.5 -1% |
* ... smaller is better
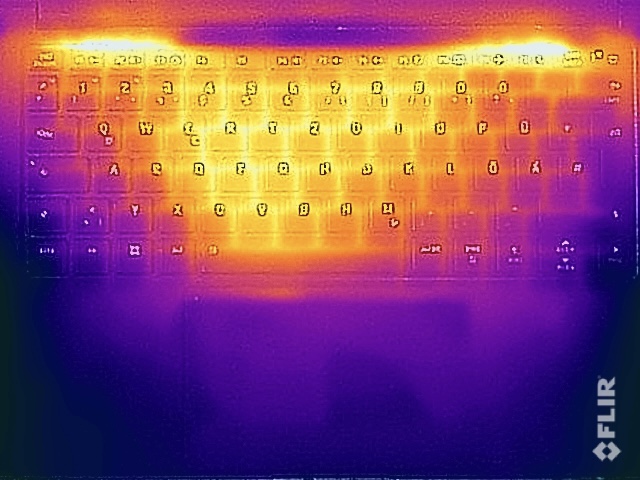
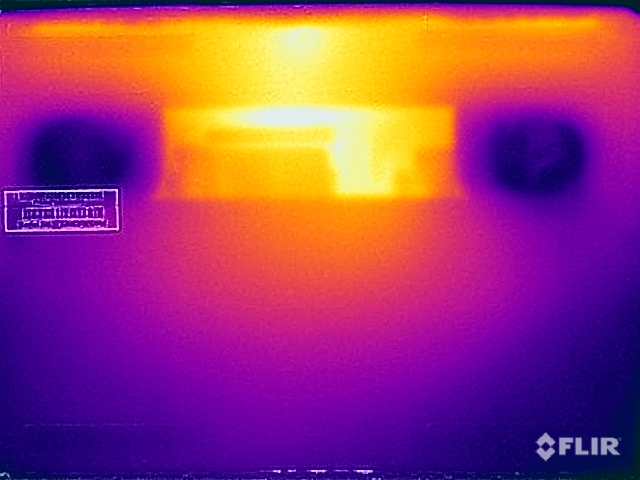
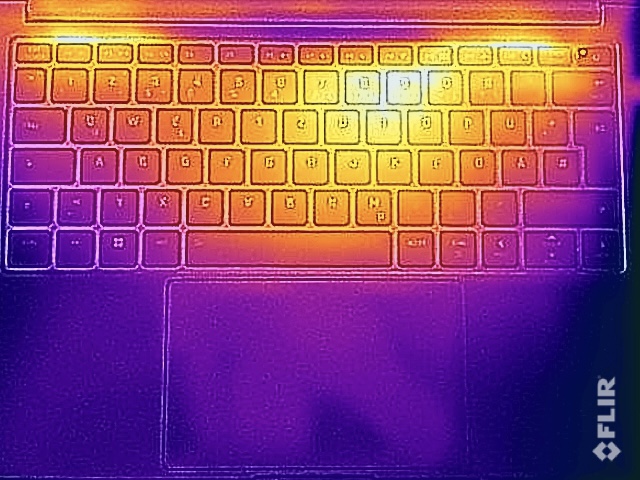
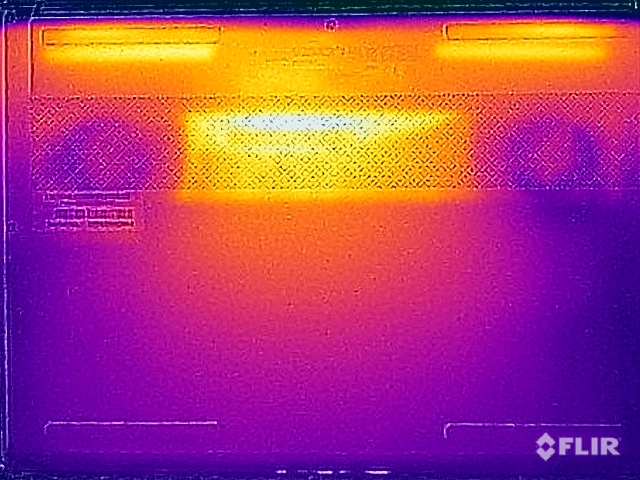
Temperature
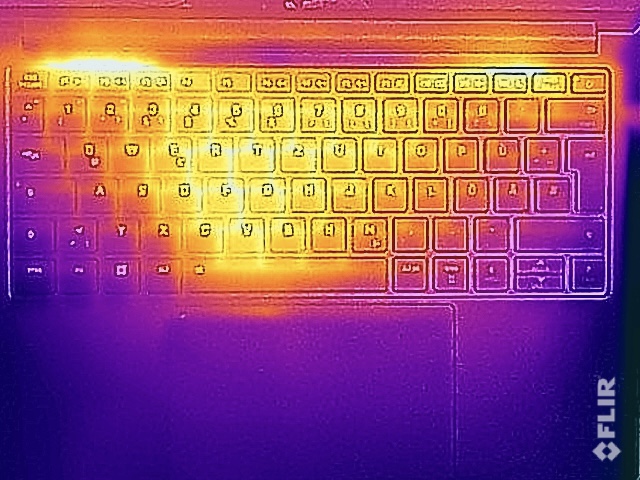
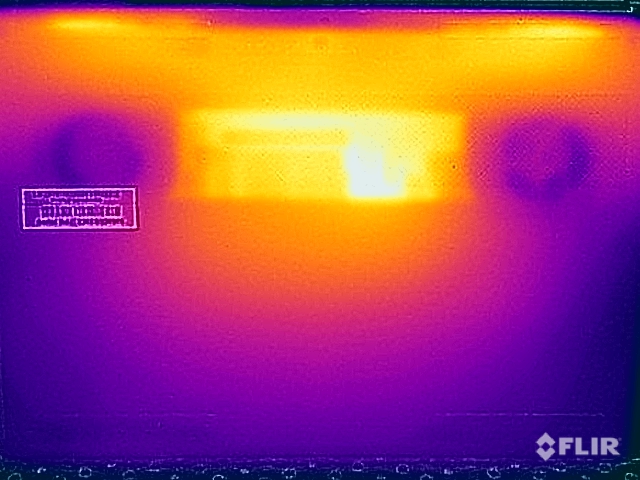
There are also striking similarities to the predecessor when it comes to the surface temperatures. During idle and when performing undemanding tasks, the temperatures remain low, whereas the center area above the keyboard and the bottom center area can reach close to a very hot 50 °C (122 °F) and above 50 °C, respectively. We advise against using the laptop on your lap in these scenarios. With only up to 45 °C (113 °F) under load, the iGPU version remains significantly cooler.
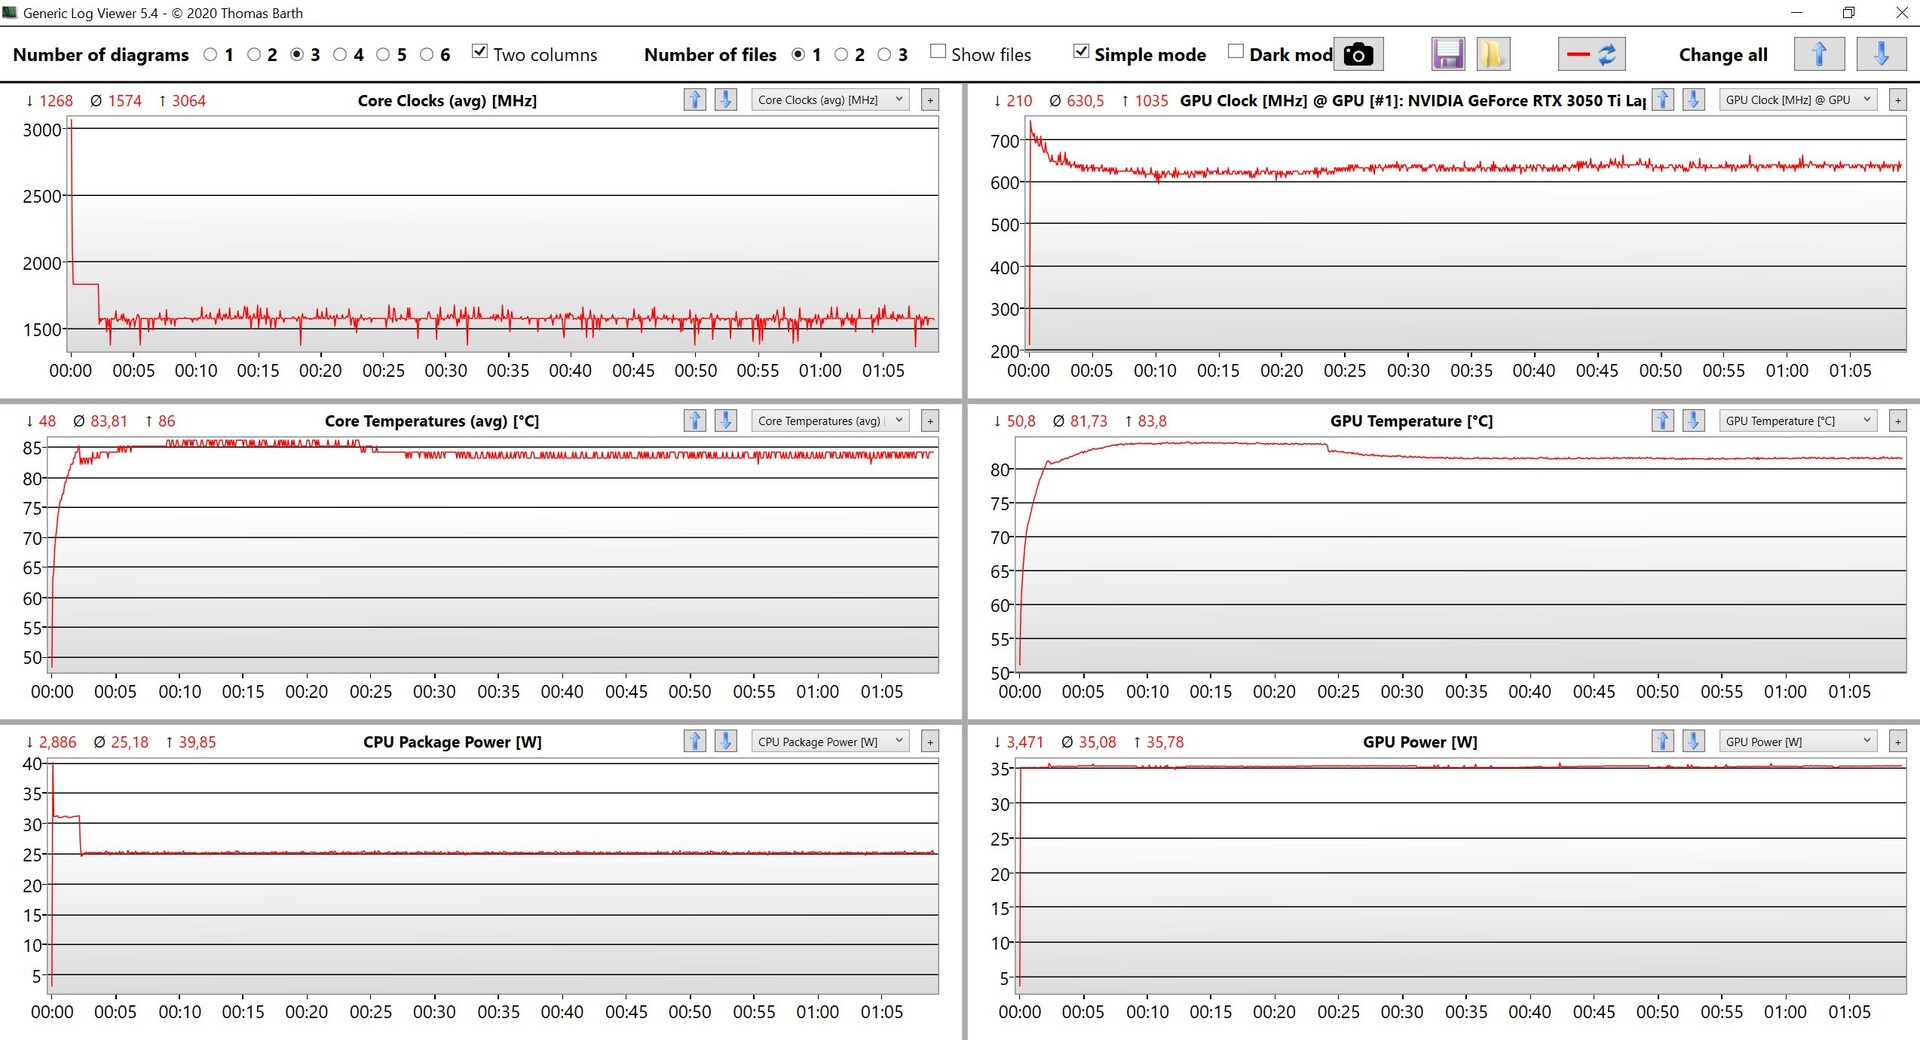
During our stress test, the graphics card stays at 35 watts consistently, while the processor initially consumes around 31 watts before stabilizing at 25 watts after a few minutes. The full performance is still available directly after the stress test.
(-) The maximum temperature on the upper side is 48.4 °C / 119 F, compared to the average of 35.9 °C / 97 F, ranging from 21.4 to 59 °C for the class Subnotebook.
(-) The bottom heats up to a maximum of 57.1 °C / 135 F, compared to the average of 39.4 °C / 103 F
(+) In idle usage, the average temperature for the upper side is 26.6 °C / 80 F, compared to the device average of 30.7 °C / 87 F.
(-) Playing The Witcher 3, the average temperature for the upper side is 40.8 °C / 105 F, compared to the device average of 30.7 °C / 87 F.
(+) The palmrests and touchpad are cooler than skin temperature with a maximum of 28.5 °C / 83.3 F and are therefore cool to the touch.
(±) The average temperature of the palmrest area of similar devices was 28.3 °C / 82.9 F (-0.2 °C / -0.4 F).
| SCHENKER Vision 14 2022 RTX 3050 Ti Intel Core i7-12700H, NVIDIA GeForce RTX 3050 Ti Laptop GPU | Huawei MateBook X Pro 2022 Intel Core i7-1260P, Intel Iris Xe Graphics G7 96EUs | Lenovo Yoga 9i 14 2022 i7-1260P Intel Core i7-1260P, Intel Iris Xe Graphics G7 96EUs | Dell Inspiron 14 Plus 7420 Intel Core i7-12700H, NVIDIA GeForce RTX 3050 4GB Laptop GPU | Asus Vivobook Pro 14 M3401QC-KM007T AMD Ryzen 5 5600H, NVIDIA GeForce RTX 3050 4GB Laptop GPU | Apple MacBook Pro 14 2021 M1 Pro Entry Apple M1 Pro 8-Core, Apple M1 Pro 14-Core GPU | SCHENKER Vision 14 Intel Core i7-11370H, NVIDIA GeForce RTX 3050 Ti Laptop GPU | |
|---|---|---|---|---|---|---|---|
| Heat | 8% | 4% | 14% | -7% | 16% | -2% | |
| Maximum Upper Side * | 48.4 | 43.1 11% | 47.5 2% | 40 17% | 42.3 13% | 46.8 3% | 49.7 -3% |
| Maximum Bottom * | 57.1 | 42 26% | 52.2 9% | 36.4 36% | 49.6 13% | 40.9 28% | 56 2% |
| Idle Upper Side * | 28.1 | 29.4 -5% | 27.1 4% | 27 4% | 34.2 -22% | 24.2 14% | 28.8 -2% |
| Idle Bottom * | 29 | 29.4 -1% | 28.5 2% | 29.2 -1% | 37.9 -31% | 24.2 17% | 30.6 -6% |
* ... smaller is better
Speakers
Due to the large battery, two new speaker modules had to be used. There is no perceivable difference, however, and the audio quality remains one of the weaknesses of the Vision 14. The speakers sound very thin and cannot compete with those of other multimedia laptops.
SCHENKER Vision 14 2022 RTX 3050 Ti audio analysis
(±) | speaker loudness is average but good (81.9 dB)
Bass 100 - 315 Hz
(-) | nearly no bass - on average 20.6% lower than median
(±) | linearity of bass is average (9% delta to prev. frequency)
Mids 400 - 2000 Hz
(±) | higher mids - on average 6.7% higher than median
(+) | mids are linear (5.8% delta to prev. frequency)
Highs 2 - 16 kHz
(+) | balanced highs - only 4.3% away from median
(+) | highs are linear (4.9% delta to prev. frequency)
Overall 100 - 16.000 Hz
(±) | linearity of overall sound is average (20.4% difference to median)
Compared to same class
» 60% of all tested devices in this class were better, 8% similar, 31% worse
» The best had a delta of 5%, average was 19%, worst was 53%
Compared to all devices tested
» 48% of all tested devices were better, 8% similar, 44% worse
» The best had a delta of 4%, average was 25%, worst was 134%
Apple MacBook Pro 14 2021 M1 Pro Entry audio analysis
(+) | speakers can play relatively loud (84.9 dB)
Bass 100 - 315 Hz
(+) | good bass - only 4.3% away from median
(+) | bass is linear (5.9% delta to prev. frequency)
Mids 400 - 2000 Hz
(+) | balanced mids - only 1.1% away from median
(+) | mids are linear (1.9% delta to prev. frequency)
Highs 2 - 16 kHz
(+) | balanced highs - only 2.9% away from median
(+) | highs are linear (3% delta to prev. frequency)
Overall 100 - 16.000 Hz
(+) | overall sound is linear (5.6% difference to median)
Compared to same class
» 1% of all tested devices in this class were better, 1% similar, 98% worse
» The best had a delta of 5%, average was 18%, worst was 45%
Compared to all devices tested
» 0% of all tested devices were better, 0% similar, 100% worse
» The best had a delta of 4%, average was 25%, worst was 134%
Energy Management - Higher Runtimes Thanks to 99-Wh Battery
Energy Consumption
Although the energy consumption has been improved slightly compared to the older model, the Vision 14's consumption of more than 11 watts still does not make it a very efficient device, which is a consequence of the 3K panel. We measured a maximum consumption of 110 watts (which drops and stabilizes at ~93 watts after a few minutes). Since the battery capacity did not change during the test, the included 90-watt AC adapter appears to come with some hidden reserves. Charging and powering the device with a USB-C charger (minimum 65-watt) is generally possible, 90-watt models will then likely be unable to reach the full performance potential of the Vision 14 or be forced to resort to accessing the battery under full load.
| Off / Standby | |
| Idle | |
| Load |
|
| SCHENKER Vision 14 2022 RTX 3050 Ti i7-12700H, GeForce RTX 3050 Ti Laptop GPU, Samsung SSD 980 Pro 1TB MZ-V8P1T0BW, IPS, 2880x1800, 14.00 | Huawei MateBook X Pro 2022 i7-1260P, Iris Xe G7 96EUs, Silicon Motion PCIe-8 SSD 1TB, IPS, 3120x2080, 14.20 | Lenovo Yoga 9i 14 2022 i7-1260P i7-1260P, Iris Xe G7 96EUs, Samsung PM9A1 MZVL21T0HCLR, OLED, 3840x2400, 14.00 | Dell Inspiron 14 Plus 7420 i7-12700H, GeForce RTX 3050 4GB Laptop GPU, SK Hynix BC711 512GB HFM512GD3GX013N, IPS, 2240x1400, 14.00 | Asus Vivobook Pro 14 M3401QC-KM007T R5 5600H, GeForce RTX 3050 4GB Laptop GPU, Intel SSD 670p SSDPEKNU512GZ, OLED, 2880x1800, 14.00 | Apple MacBook Pro 14 2021 M1 Pro Entry M1 Pro 8-Core, M1 Pro 14-Core GPU, Apple SSD AP0512, Mini-LED, 3024x1964, 14.20 | SCHENKER Vision 14 i7-11370H, GeForce RTX 3050 Ti Laptop GPU, Samsung SSD 980 Pro 1TB MZ-V8P1T0BW, IPS, 2880x1800, 14.00 | Average NVIDIA GeForce RTX 3050 Ti Laptop GPU | Average of class Subnotebook | |
|---|---|---|---|---|---|---|---|---|---|
| Power Consumption | 6% | 16% | -19% | 13% | 27% | -7% | -23% | 30% | |
| Idle Minimum * | 7.5 | 6.5 13% | 7.1 5% | 6.3 16% | 6.6 12% | 2.9 61% | 6.7 11% | 8.2 ? -9% | 4.9 ? 35% |
| Idle Average * | 10.4 | 13.7 -32% | 10 4% | 10.3 1% | 9.6 8% | 11.6 -12% | 12.6 -21% | 12.6 ? -21% | 8.36 ? 20% |
| Idle Maximum * | 11.4 | 14.4 -26% | 10.8 5% | 20 -75% | 7.3 36% | 11.9 -4% | 15.4 -35% | 17.2 ? -51% | 10.4 ? 9% |
| Load Average * | 83.3 | 64.6 22% | 64 23% | 106.2 -27% | 73 12% | 49.5 41% | 85.7 -3% | 92 ? -10% | 45.9 ? 45% |
| Witcher 3 ultra * | 92.7 | 57.2 38% | 47.7 49% | 96.1 -4% | 74.4 20% | 58.2 37% | 83 10% | ||
| Load Maximum * | 110.3 | 90.9 18% | 97 12% | 136.5 -24% | 119 -8% | 68.5 38% | 110.9 -1% | 139.1 ? -26% | 66 ? 40% |
* ... smaller is better
Power Consumption Witcher 3 / Stress Test
Power Consumption external Monitor
Battery Life
With 99 Wh, the new battery offers almost twice the capacity, unsurprisingly resulting in a significantly improved battery life. While the predecessor was only able to last between 4.5-5.5 hours in our Wi-Fi test depending on the brightness setting, the new model reaches 8-10 hours and 11 hours of video playback at a brightness of 150 nits (about 36 % maximum brightness in the case of our test device). While these results are good, they also show that the 3K panel simply is not very efficient. A device with this much battery capacity could have otherwise reached even better runtimes.
When the device is switched on, the charging process takes 105 minutes; 50 % battery is already available after 36 minutes. The iGPU model of the Vision 14 reaches essentially the same results with a deviation of within a few minutes.
| SCHENKER Vision 14 2022 RTX 3050 Ti i7-12700H, GeForce RTX 3050 Ti Laptop GPU, 99.8 Wh | Huawei MateBook X Pro 2022 i7-1260P, Iris Xe G7 96EUs, 60 Wh | Lenovo Yoga 9i 14 2022 i7-1260P i7-1260P, Iris Xe G7 96EUs, 75 Wh | Dell Inspiron 14 Plus 7420 i7-12700H, GeForce RTX 3050 4GB Laptop GPU, 64 Wh | Asus Vivobook Pro 14 M3401QC-KM007T R5 5600H, GeForce RTX 3050 4GB Laptop GPU, 63 Wh | Apple MacBook Pro 14 2021 M1 Pro Entry M1 Pro 8-Core, M1 Pro 14-Core GPU, 69.9 Wh | SCHENKER Vision 14 i7-11370H, GeForce RTX 3050 Ti Laptop GPU, 53 Wh | Average of class Subnotebook | |
|---|---|---|---|---|---|---|---|---|
| Battery Runtime | -26% | -7% | -43% | -8% | 8% | -39% | 5% | |
| H.264 | 666 | 455 -32% | 758 14% | 900 35% | 405 -39% | 794 ? 19% | ||
| WiFi v1.3 | 607 | 451 -26% | 517 -15% | 432 -29% | 569 -6% | 816 34% | 327 -46% | 629 ? 4% |
| Load | 124 | 100 -19% | 98 -21% | 54 -56% | 112 -10% | 69 -44% | 86 -31% | 115.4 ? -7% |
| Reader / Idle | 712 | 687 | 1252 ? |
Pros
Cons
Verdict - Vision 14 with Significant Improvements
With the latest version of the Vision 14, Schenker addresses both of our main criticisms of the predecessor. The new Alder Lake-H45 processor offers a lot more performance than the older Tiger Lake chip, making the Vision 14 one of the fastest models in its device class. Similarly, the RTX 3050 Ti performs decently well, although the developments in this area have been few and far between for a while, which makes us even more excited for the upcoming RTX 4000 GPUs.
Thanks to the new 99-Wh battery, the battery runtimes increase dramatically as well, although this comes at the cost of an around 0.44 lbs greater weight, a thickness increased by 1 mm (~0.04 in), and the secondary M.2-2280 SSD slot. While the lighter version with the smaller 53-Wh battery is still available, it must be configured with the dedicated GeForce GPU. For users with no need for long runtimes, the more lightweight model is still an easy recommendation.
Thanks to the Core i7-12700H and the 99-Wh battery, the new Vision 14 ist no longer as limited in terms of the CPU performance or battery life. While the 14-inch chassis is slightly heavier and marginally thicker, the combination of good performance, a wide variety of ports, good maintenance options, and a beautiful 3K display with 90 Hz make the Vision 14 an extremely exciting and excellent 14-inch laptop.
The Vision 14 retains its very small footprint, sufficient port options, RAM slots, and removable Wi-Fi module despite its slightly thicker and heavier chassis. Although the incompatibility with modern 6-GHz networks (Wi-Fi 6E) is a drawback, users likely will not be limited by this for a while. Furthermore, the lid hinges are not as tight compared to competitors, resulting in fairly significant teetering. Although the 90-watt AC adapter is too weak nominally, it appears to be sufficient for the 110-W peak consumption. Moreover, users will still have to contend with high surface temperatures and loud fans under high loads or while gaming. This is simply a result of very high-performance components in a compact chassis.
Competitors with similar performance characteristics and dedicated GPUs are significantly heavier than the Vision 14 and this is essentially the maximum performance currently available in this small of a form factor. However, the Vision 14 with the RTX 3050 Ti is not exactly a bargain, being priced similarly as the current MacBook Pro 14 (albeit with less RAM and storage). The latter is likely a better choice for users who are not reliant on Windows due to the mini LED panel, the efficient M1 Pro chip, and the excellent speaker setup. Meanwhile, the Dell Inspiron 14 Plus 7420 - while being noticeably heavier and thicker - is a much cheaper alternative.
Price and Availability
The Schenker Vision 14 can be configured on Bestware.com starting from 1659 Euros (~1659 USD).https://bestware.com/de/schenker-vision-14-e22.html
SCHENKER Vision 14 2022 RTX 3050 Ti
-
10/25/2022 v7
Andreas Osthoff
More articles related to this device
SCHENKER Vision 14 2022 RTX 3050 Ti (Vision 14 Series)Related Articles


Pricecompare

