 Deutsch
 English
 Español
 Français
 Italiano
 Nederlands
 Polski
 Português
 Русский
 Türkçe
 Svenska
 Chinese
 Magyar
Alienware m16 R1 review: QHD gaming machine with RTX 4060 and Thunderbolt 4
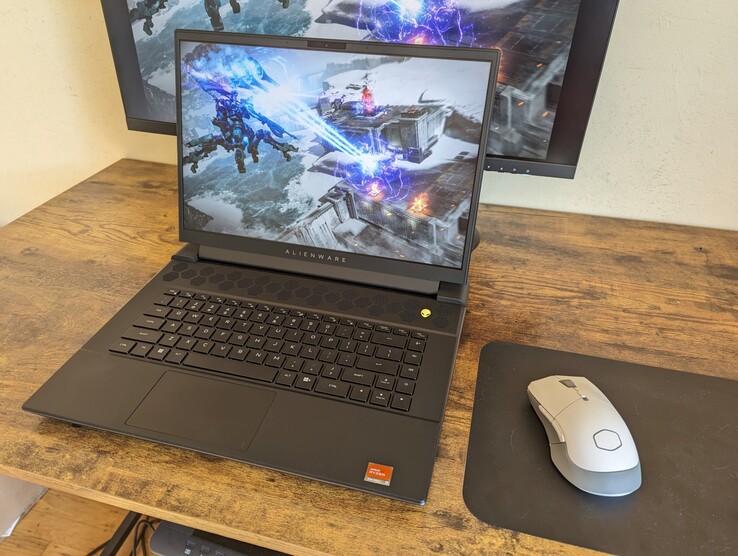
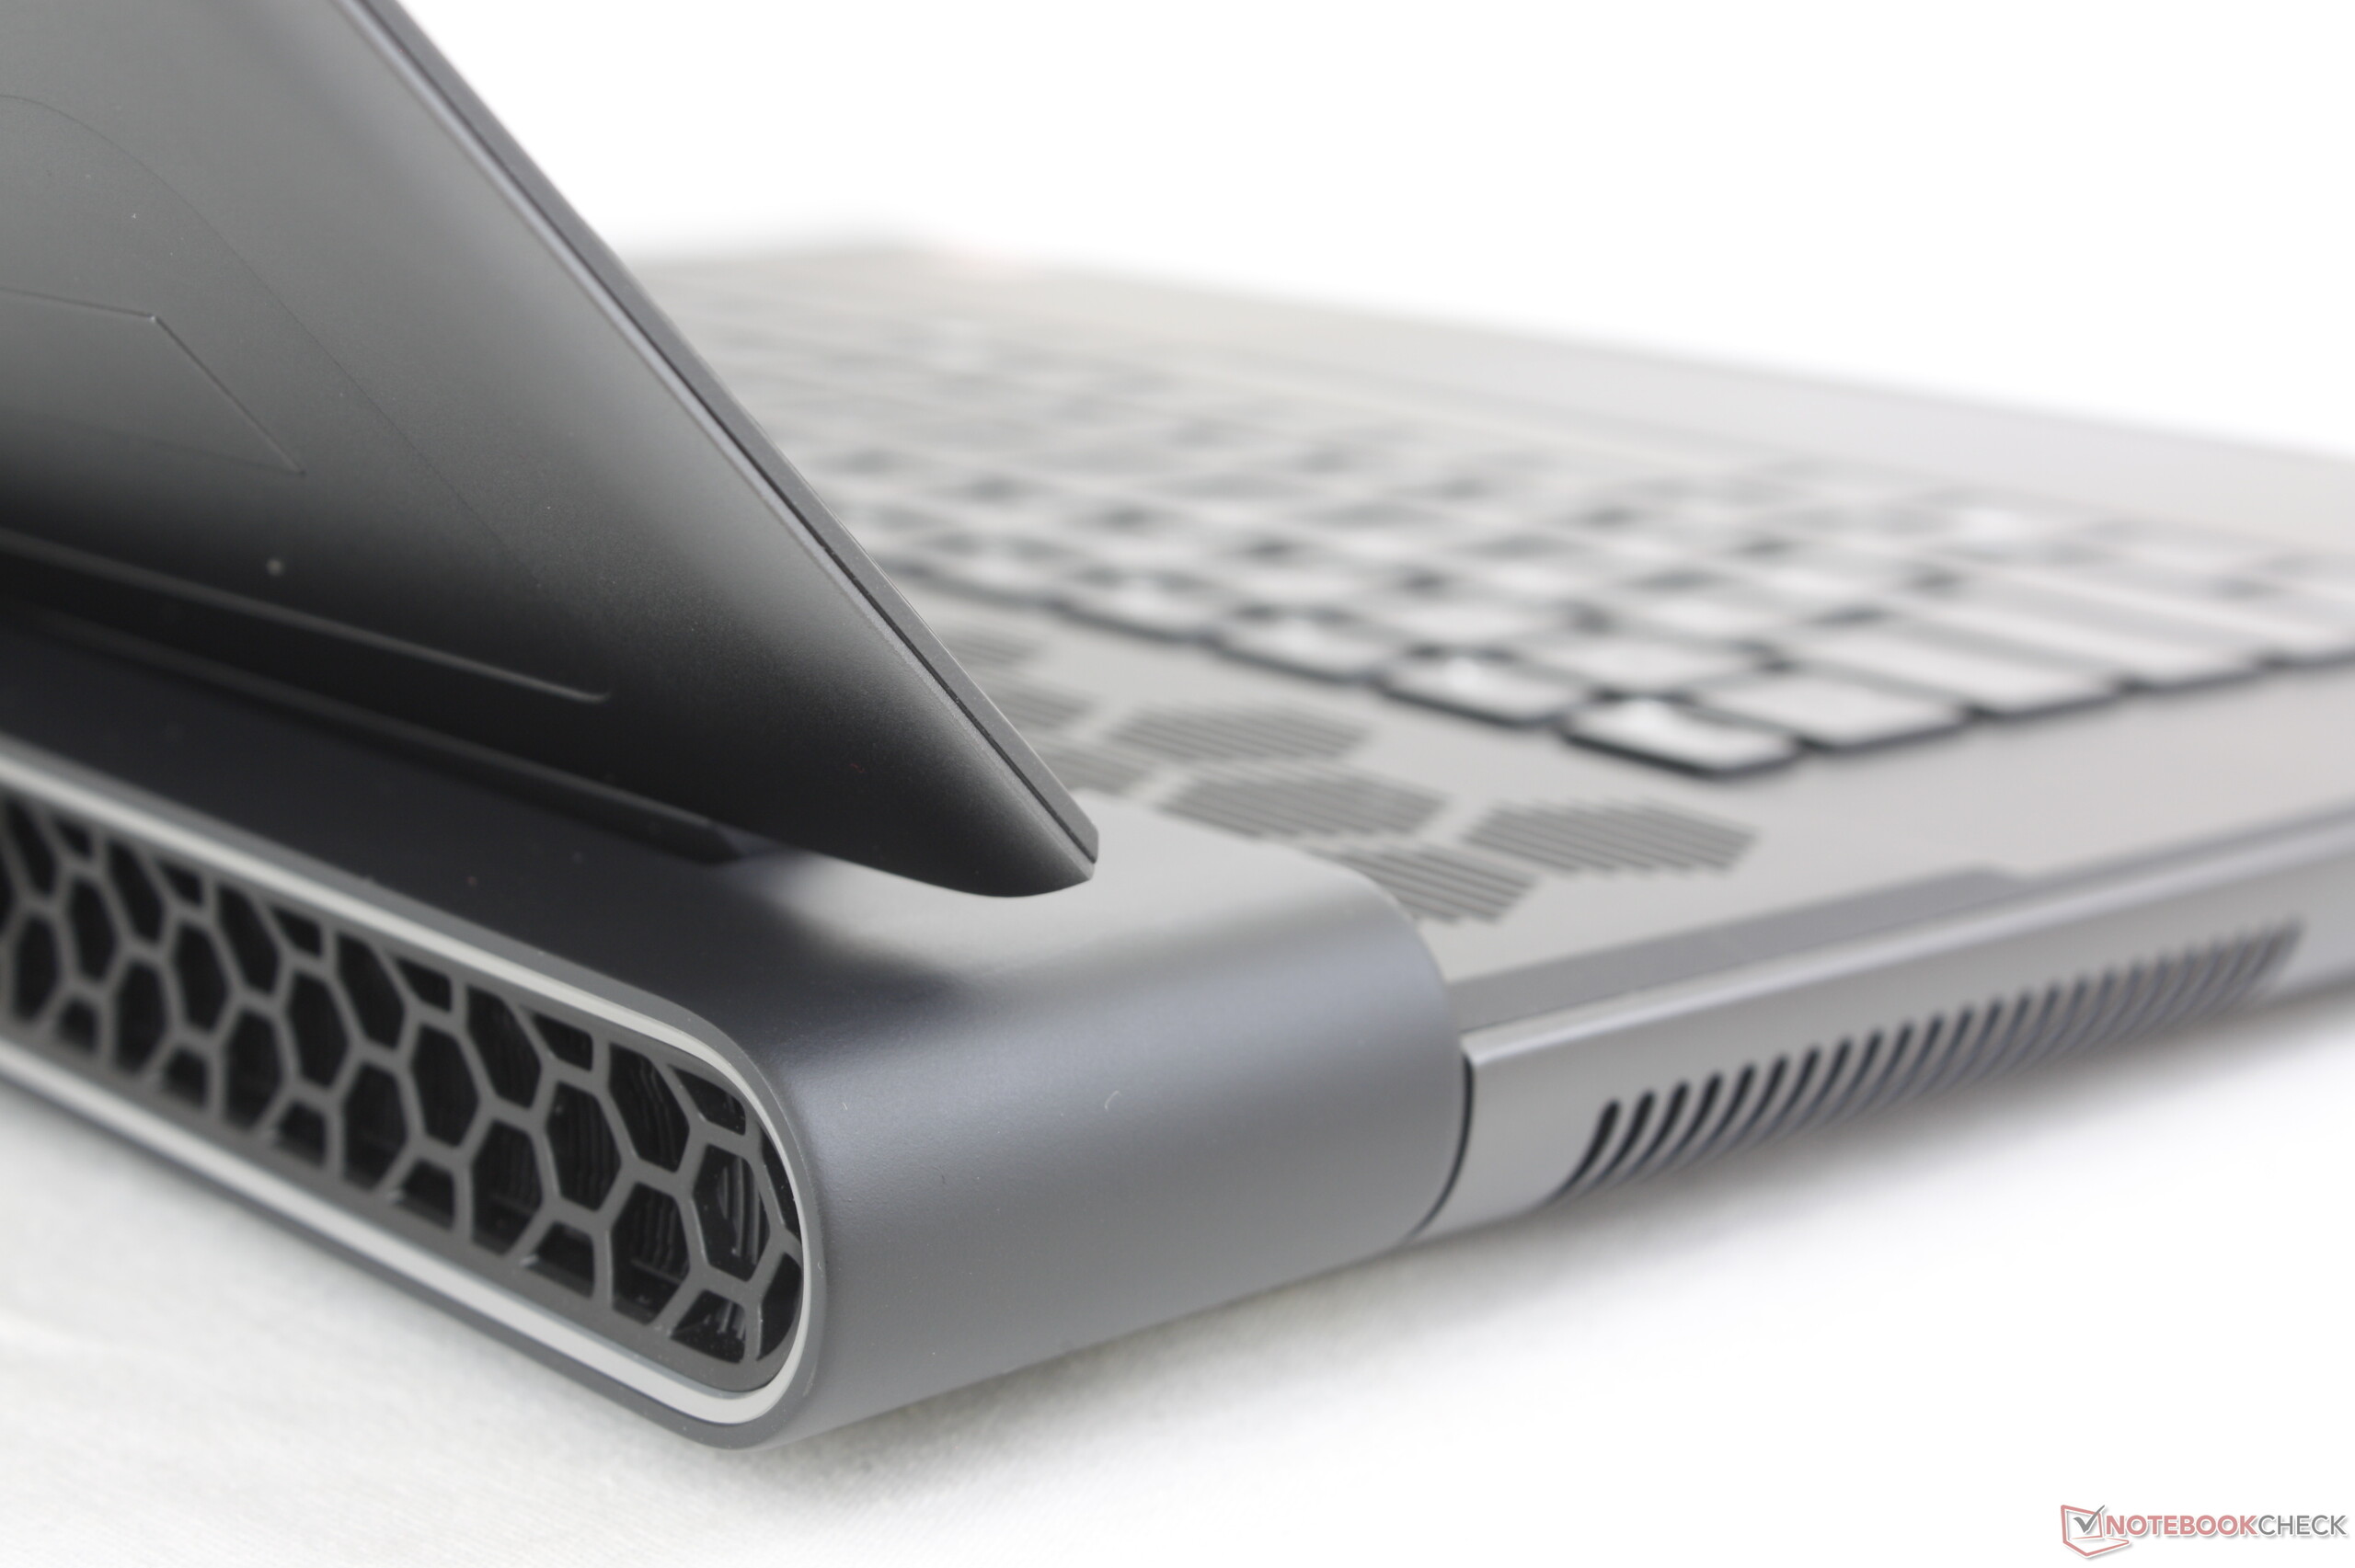
Gaming, rendering, and content creation are likely to be the main areas of application for the Alienware m16 R1. Raptor Lake and Ada Lovelace provide the necessary computing power. Our variant is an entry-level model from the m16-R1 series; we recently had a sister model from the upper end of the performance scale. Competing devices include the Acer Predator Helios 16 PH16-71, the Medion Erazer Defender P40, the Lenovo Legion Pro 5 16IRX8, the XMG Pro 15 (E23) and the Aorus 15 BSF.
Information about the case, equipment and input devices can be found in our review of the near-identical sister model.
Possible competitors in comparison
Rating | Date | Model | Weight | Height | Size | Resolution | Best Price |
|---|---|---|---|---|---|---|---|
| 88.3 % | 09/2023 | Alienware m16 R1 Intel i7-13700HX, NVIDIA GeForce RTX 4060 Laptop GPU | 3 kg | 25.4 mm | 16.00" | 2560x1600 | |
| 89.5 % | 07/2023 | Acer Predator Helios 16 PH16-71-731Q i7-13700HX, NVIDIA GeForce RTX 4060 Laptop GPU | 2.6 kg | 26.9 mm | 16.00" | 2560x1600 | |
| 84.6 % | 05/2023 | Medion Erazer Defender P40 i7-13700HX, NVIDIA GeForce RTX 4060 Laptop GPU | 2.9 kg | 33 mm | 17.30" | 2560x1440 | |
| 87.9 % | 05/2023 | Lenovo Legion Pro 5 16IRX8 i7-13700HX, NVIDIA GeForce RTX 4060 Laptop GPU | 2.5 kg | 26.8 mm | 16.00" | 2560x1600 | |
| 86.2 % | 07/2023 | SCHENKER XMG Pro 15 (E23) i9-13900HX, NVIDIA GeForce RTX 4060 Laptop GPU | 2.4 kg | 24.9 mm | 15.60" | 2560x1440 | |
| 85.7 % | 08/2023 | Aorus 15 BSF i7-13700H, NVIDIA GeForce RTX 4070 Laptop GPU | 2.4 kg | 20.9 mm | 15.60" | 2560x1440 |
Equipment and Input Devices - Differences to the AMD model
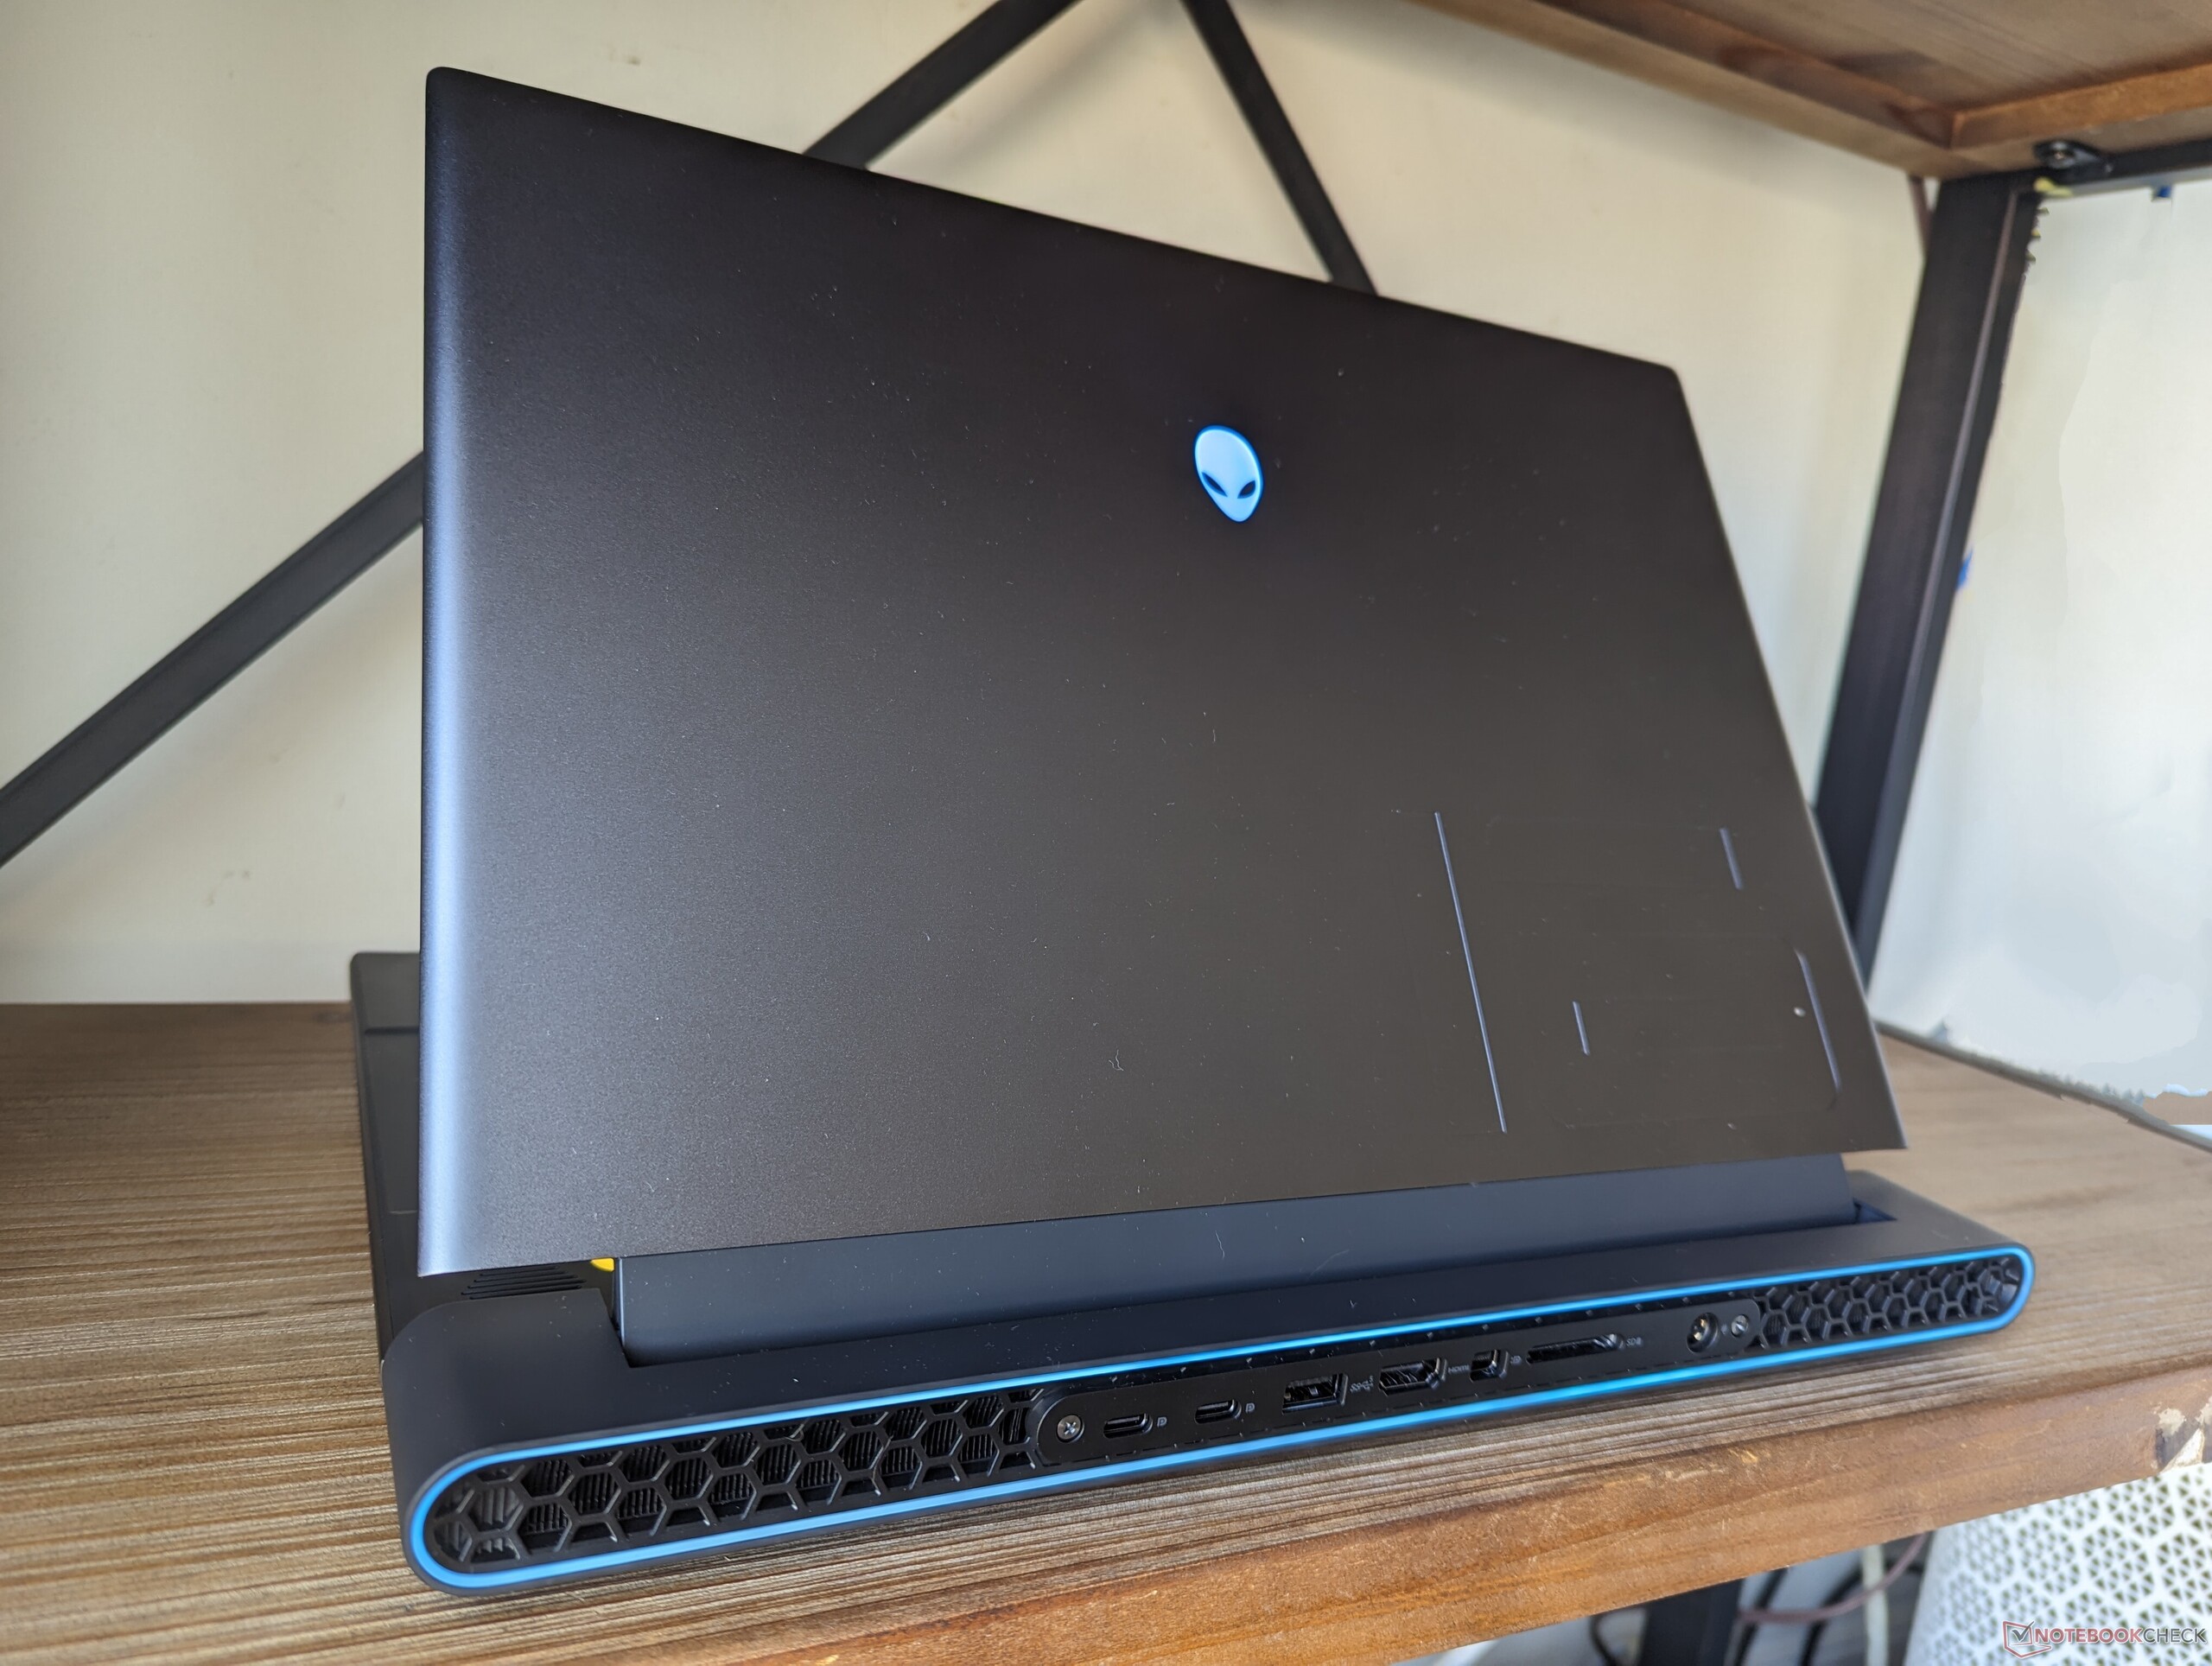
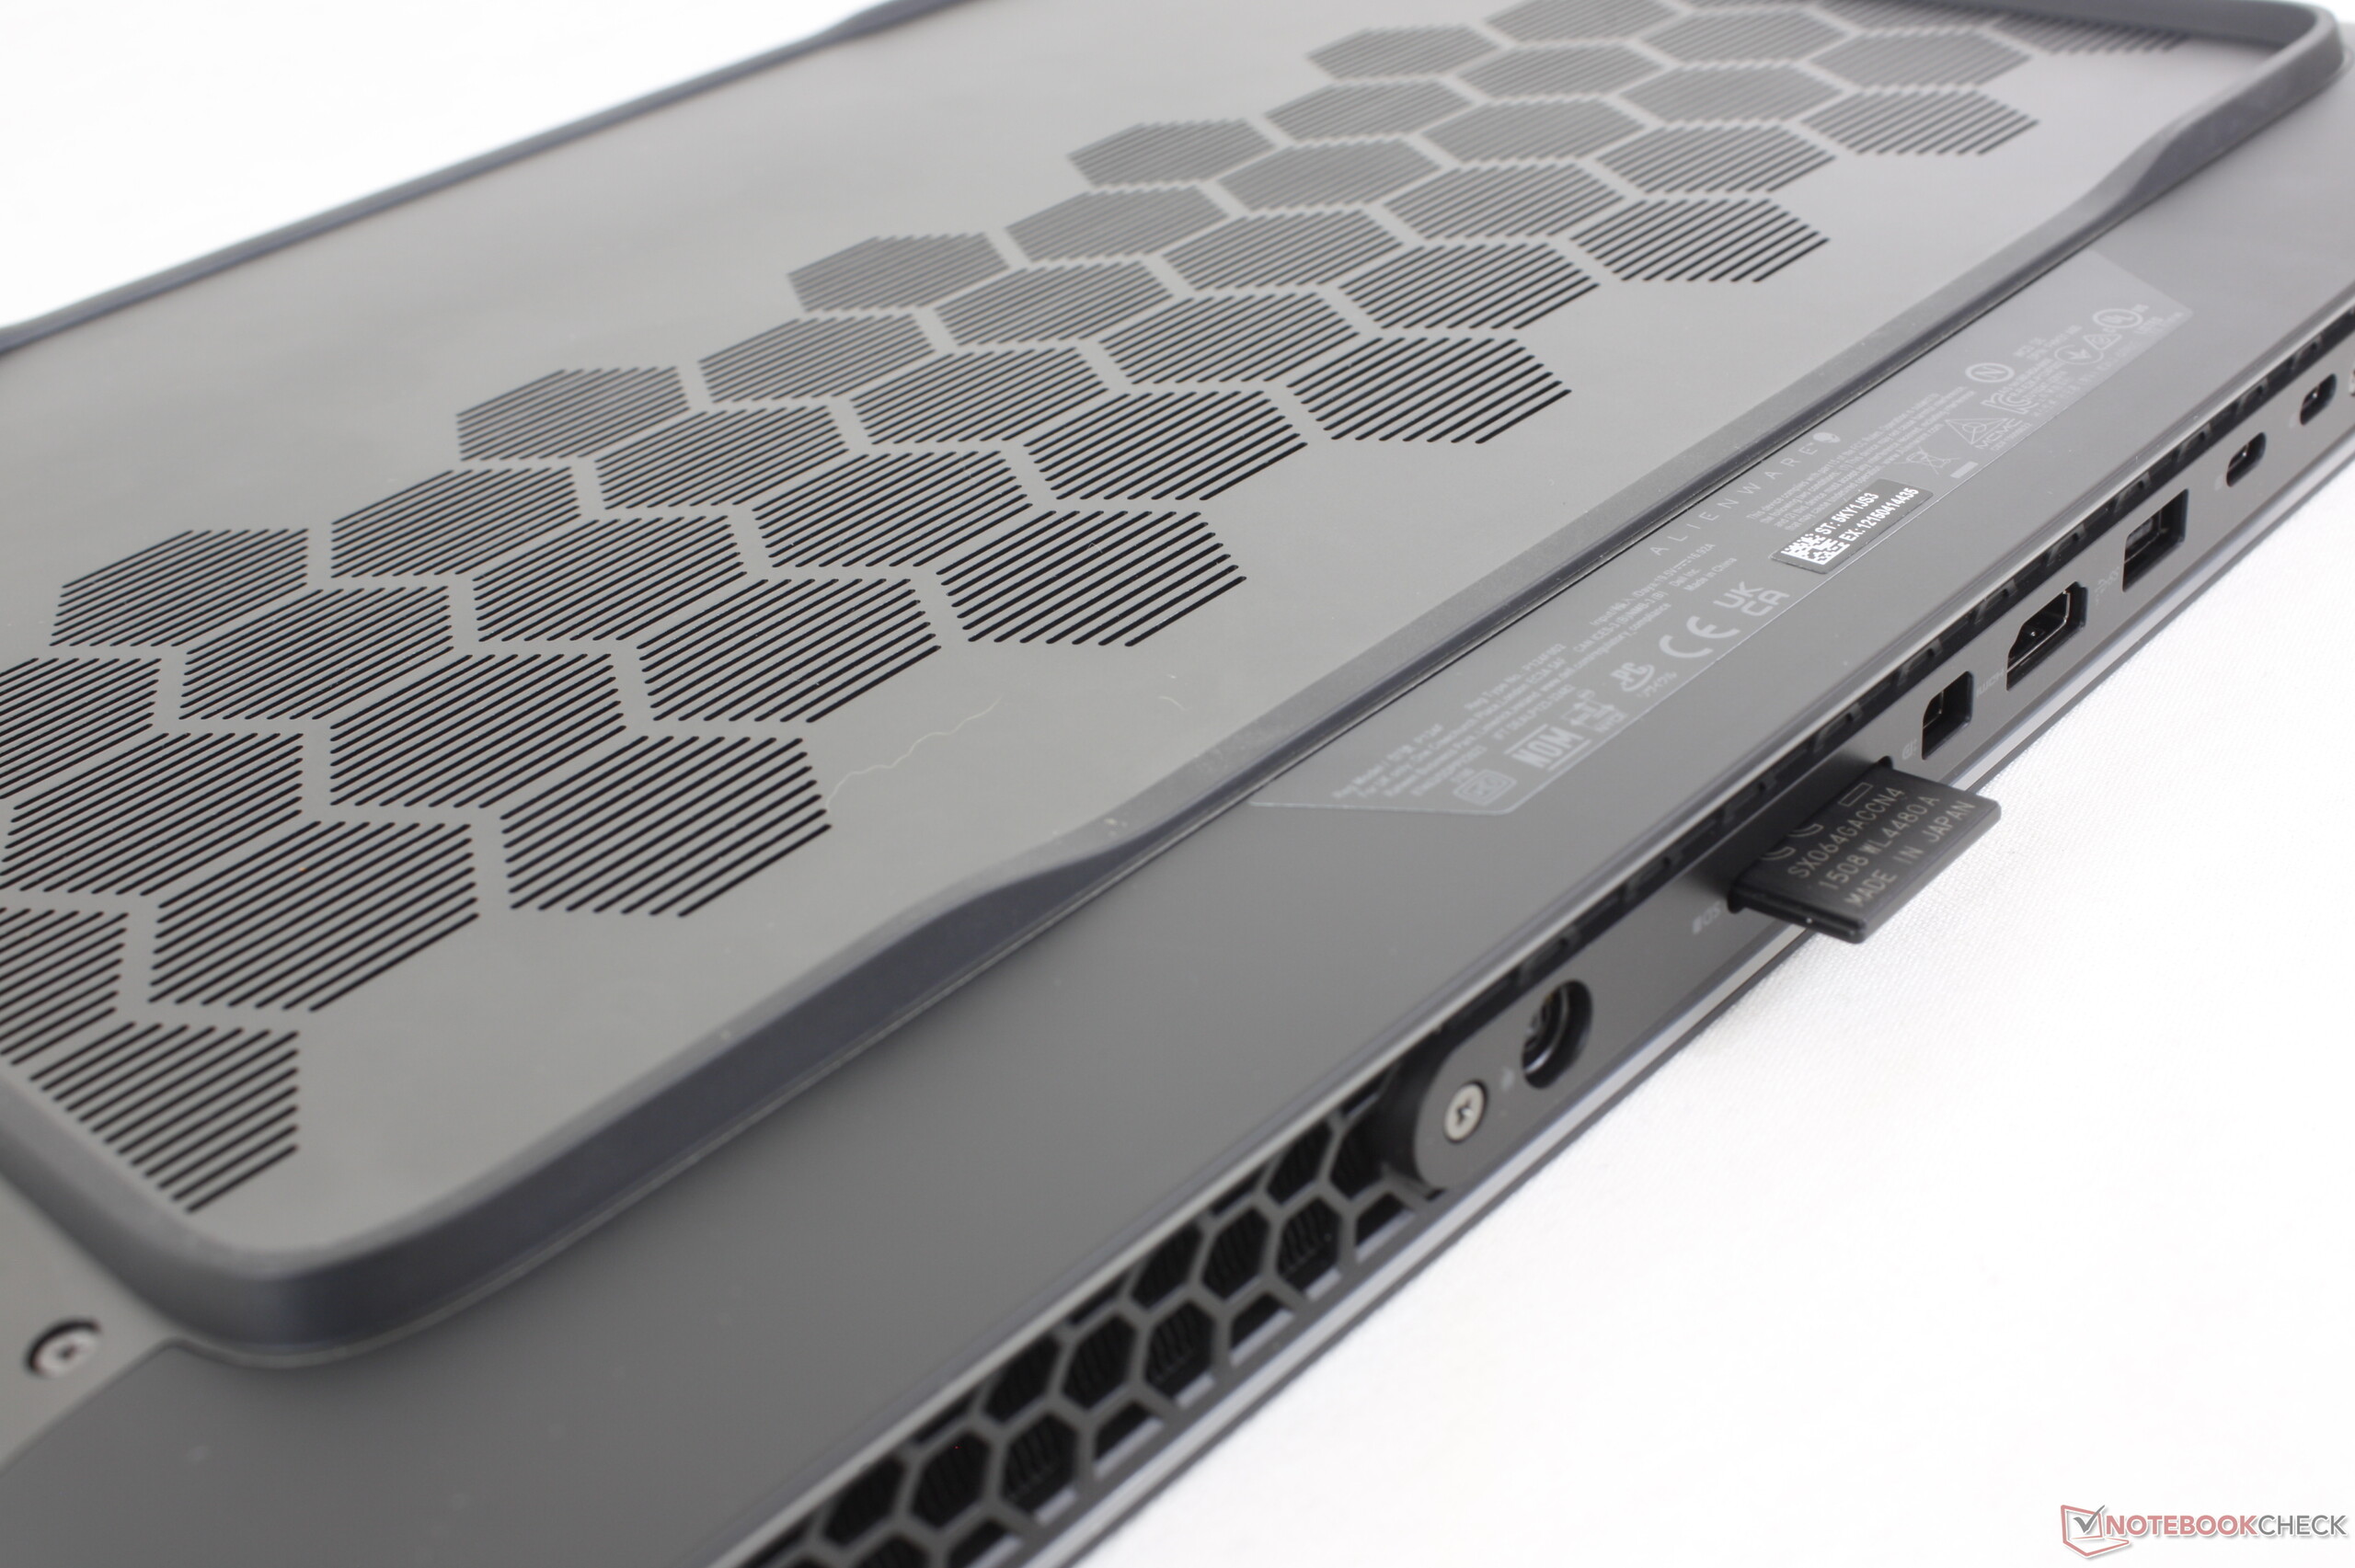
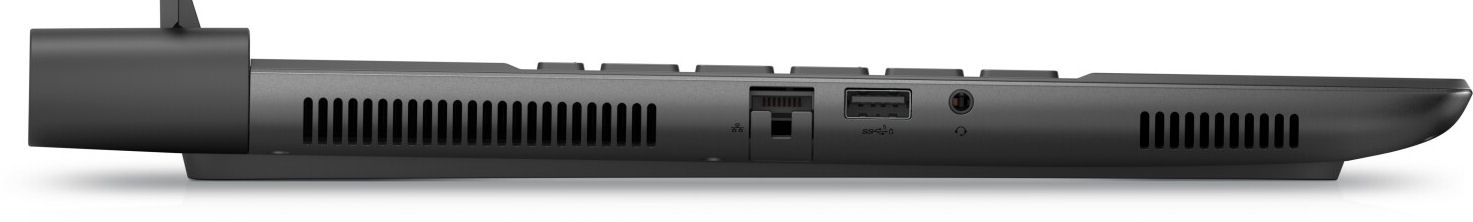
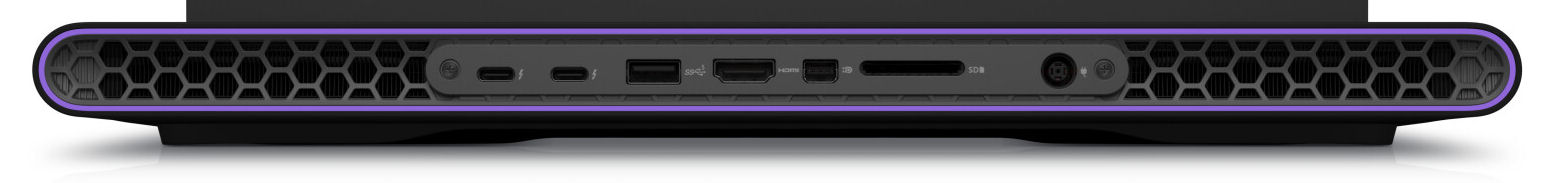
- The two USB-C ports of the Intel-based m16 models support Thunderbolt 4 (AMD: only USB 3.2 Gen 2), including DisplayPort and Power Delivery. But be careful: powering the notebook or charging the battery via USB-C is not possible. The USB-C ports can only supply energy.
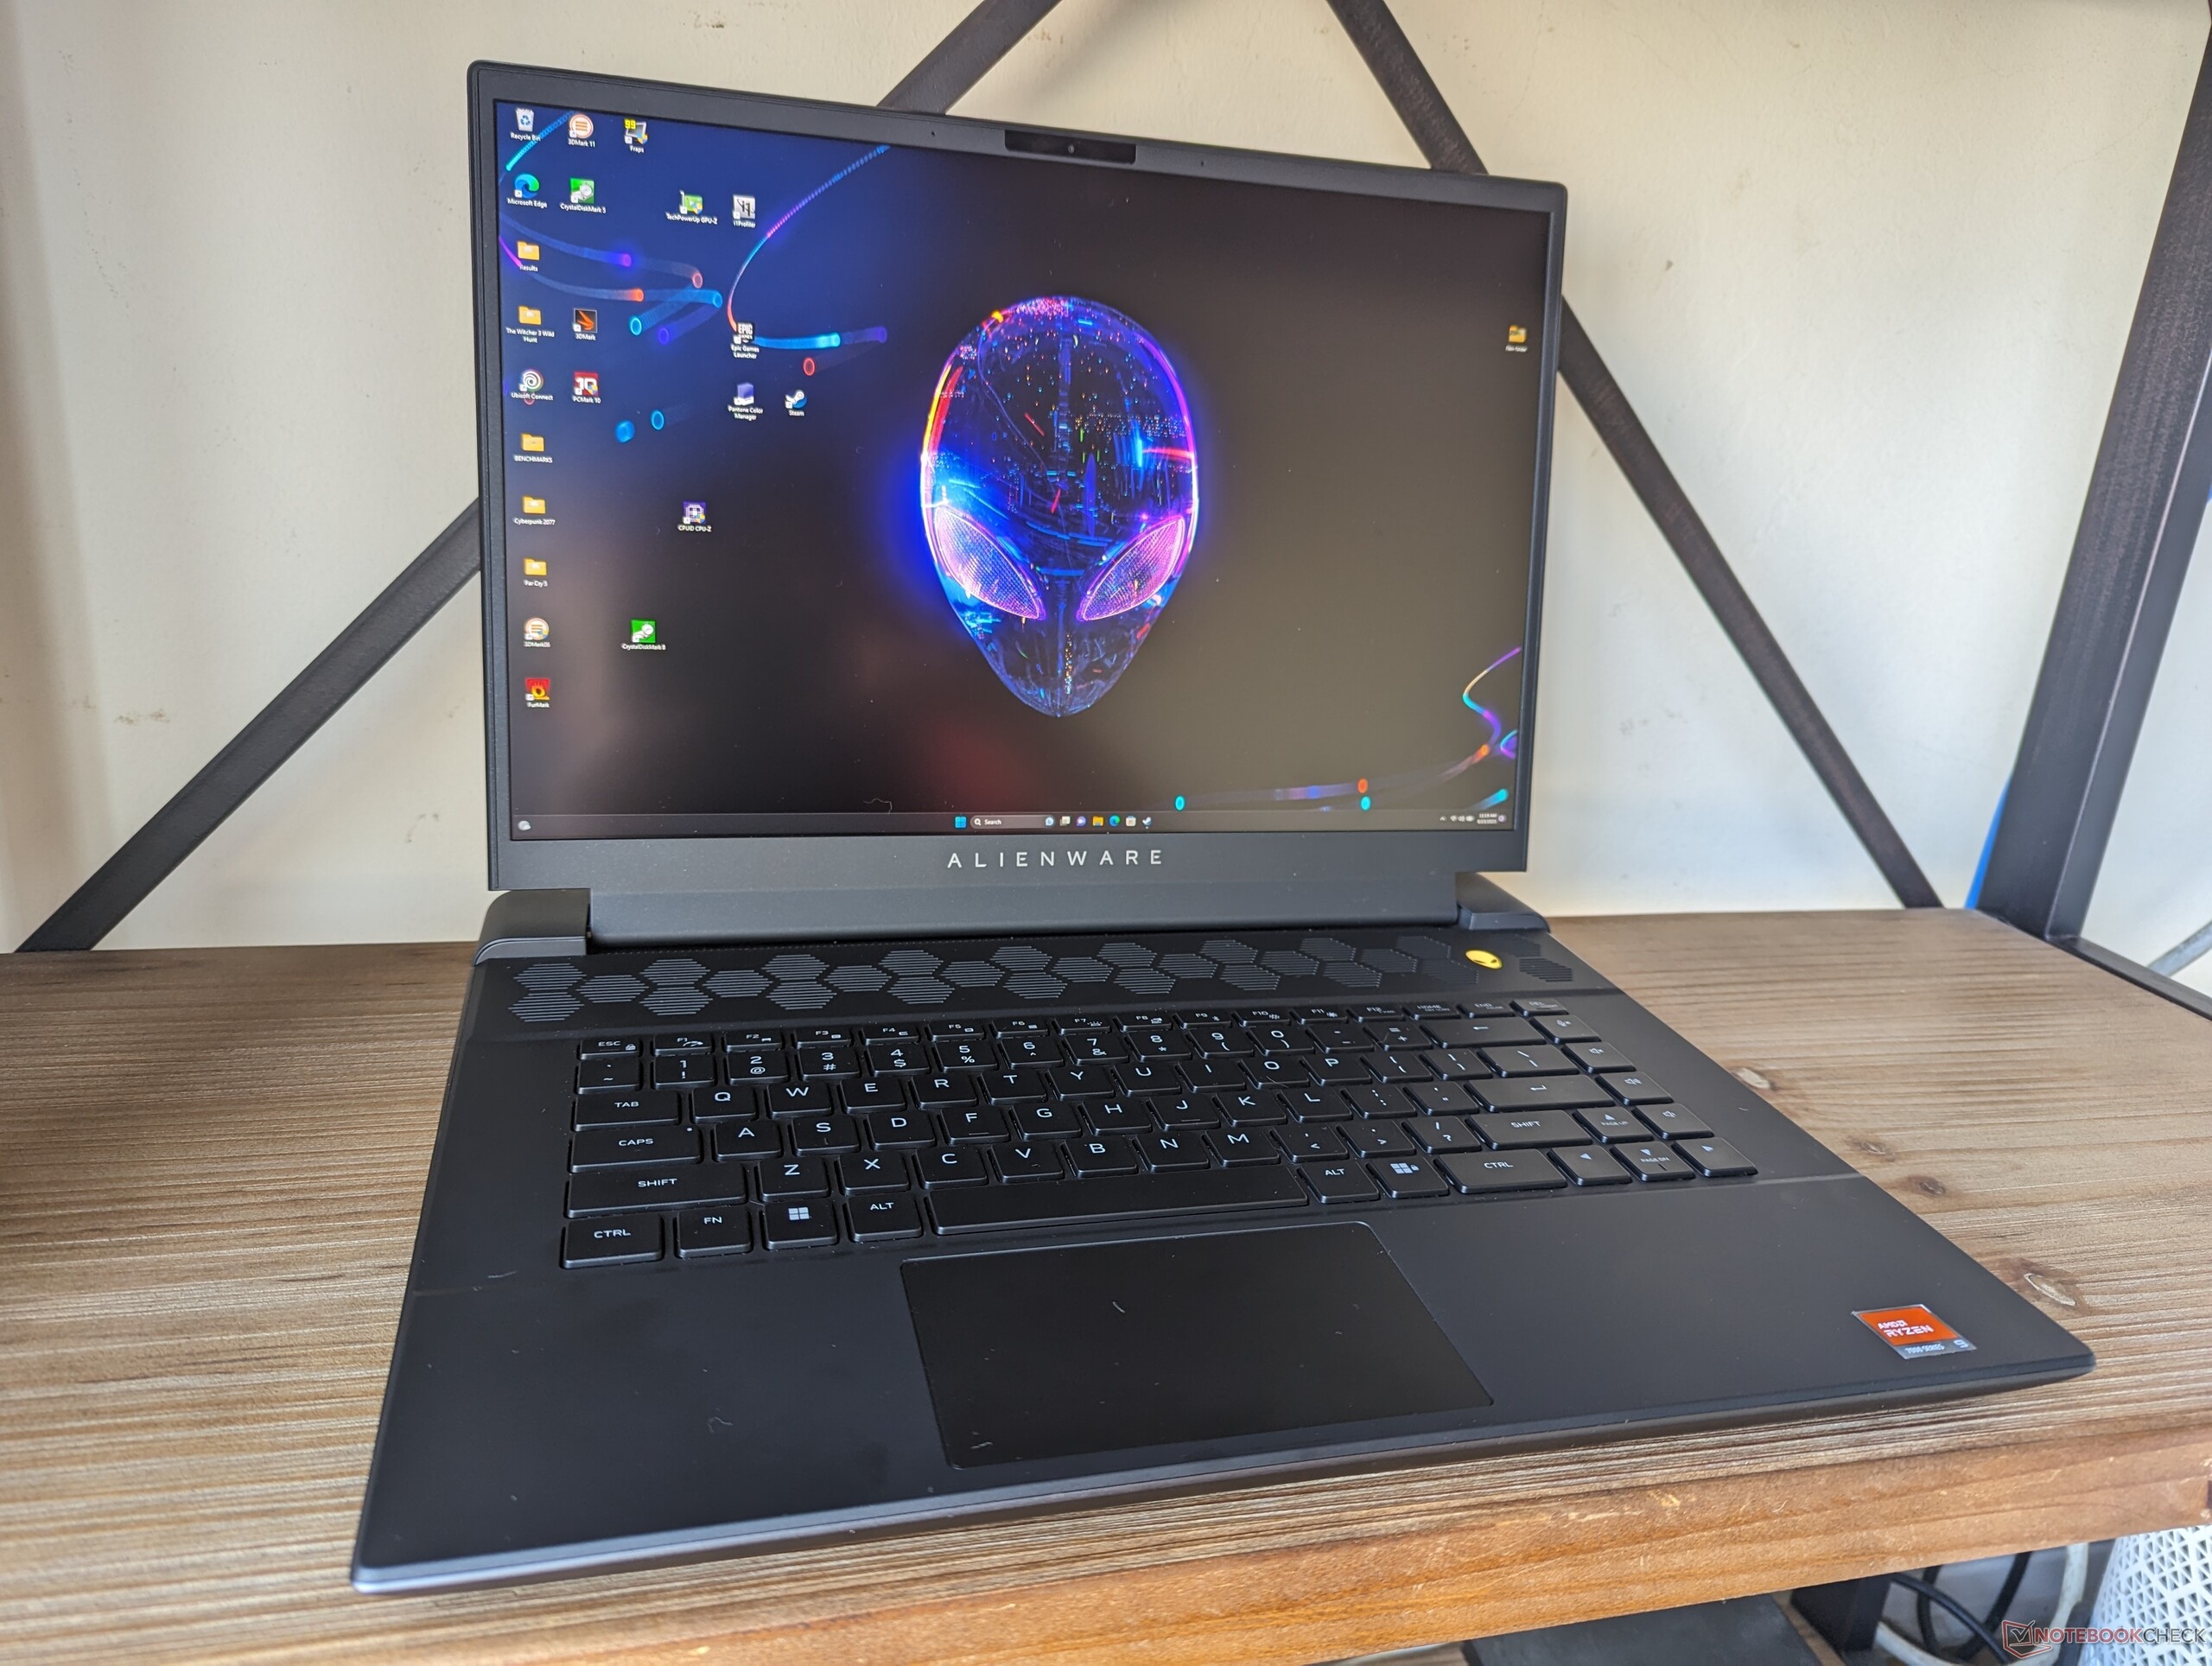
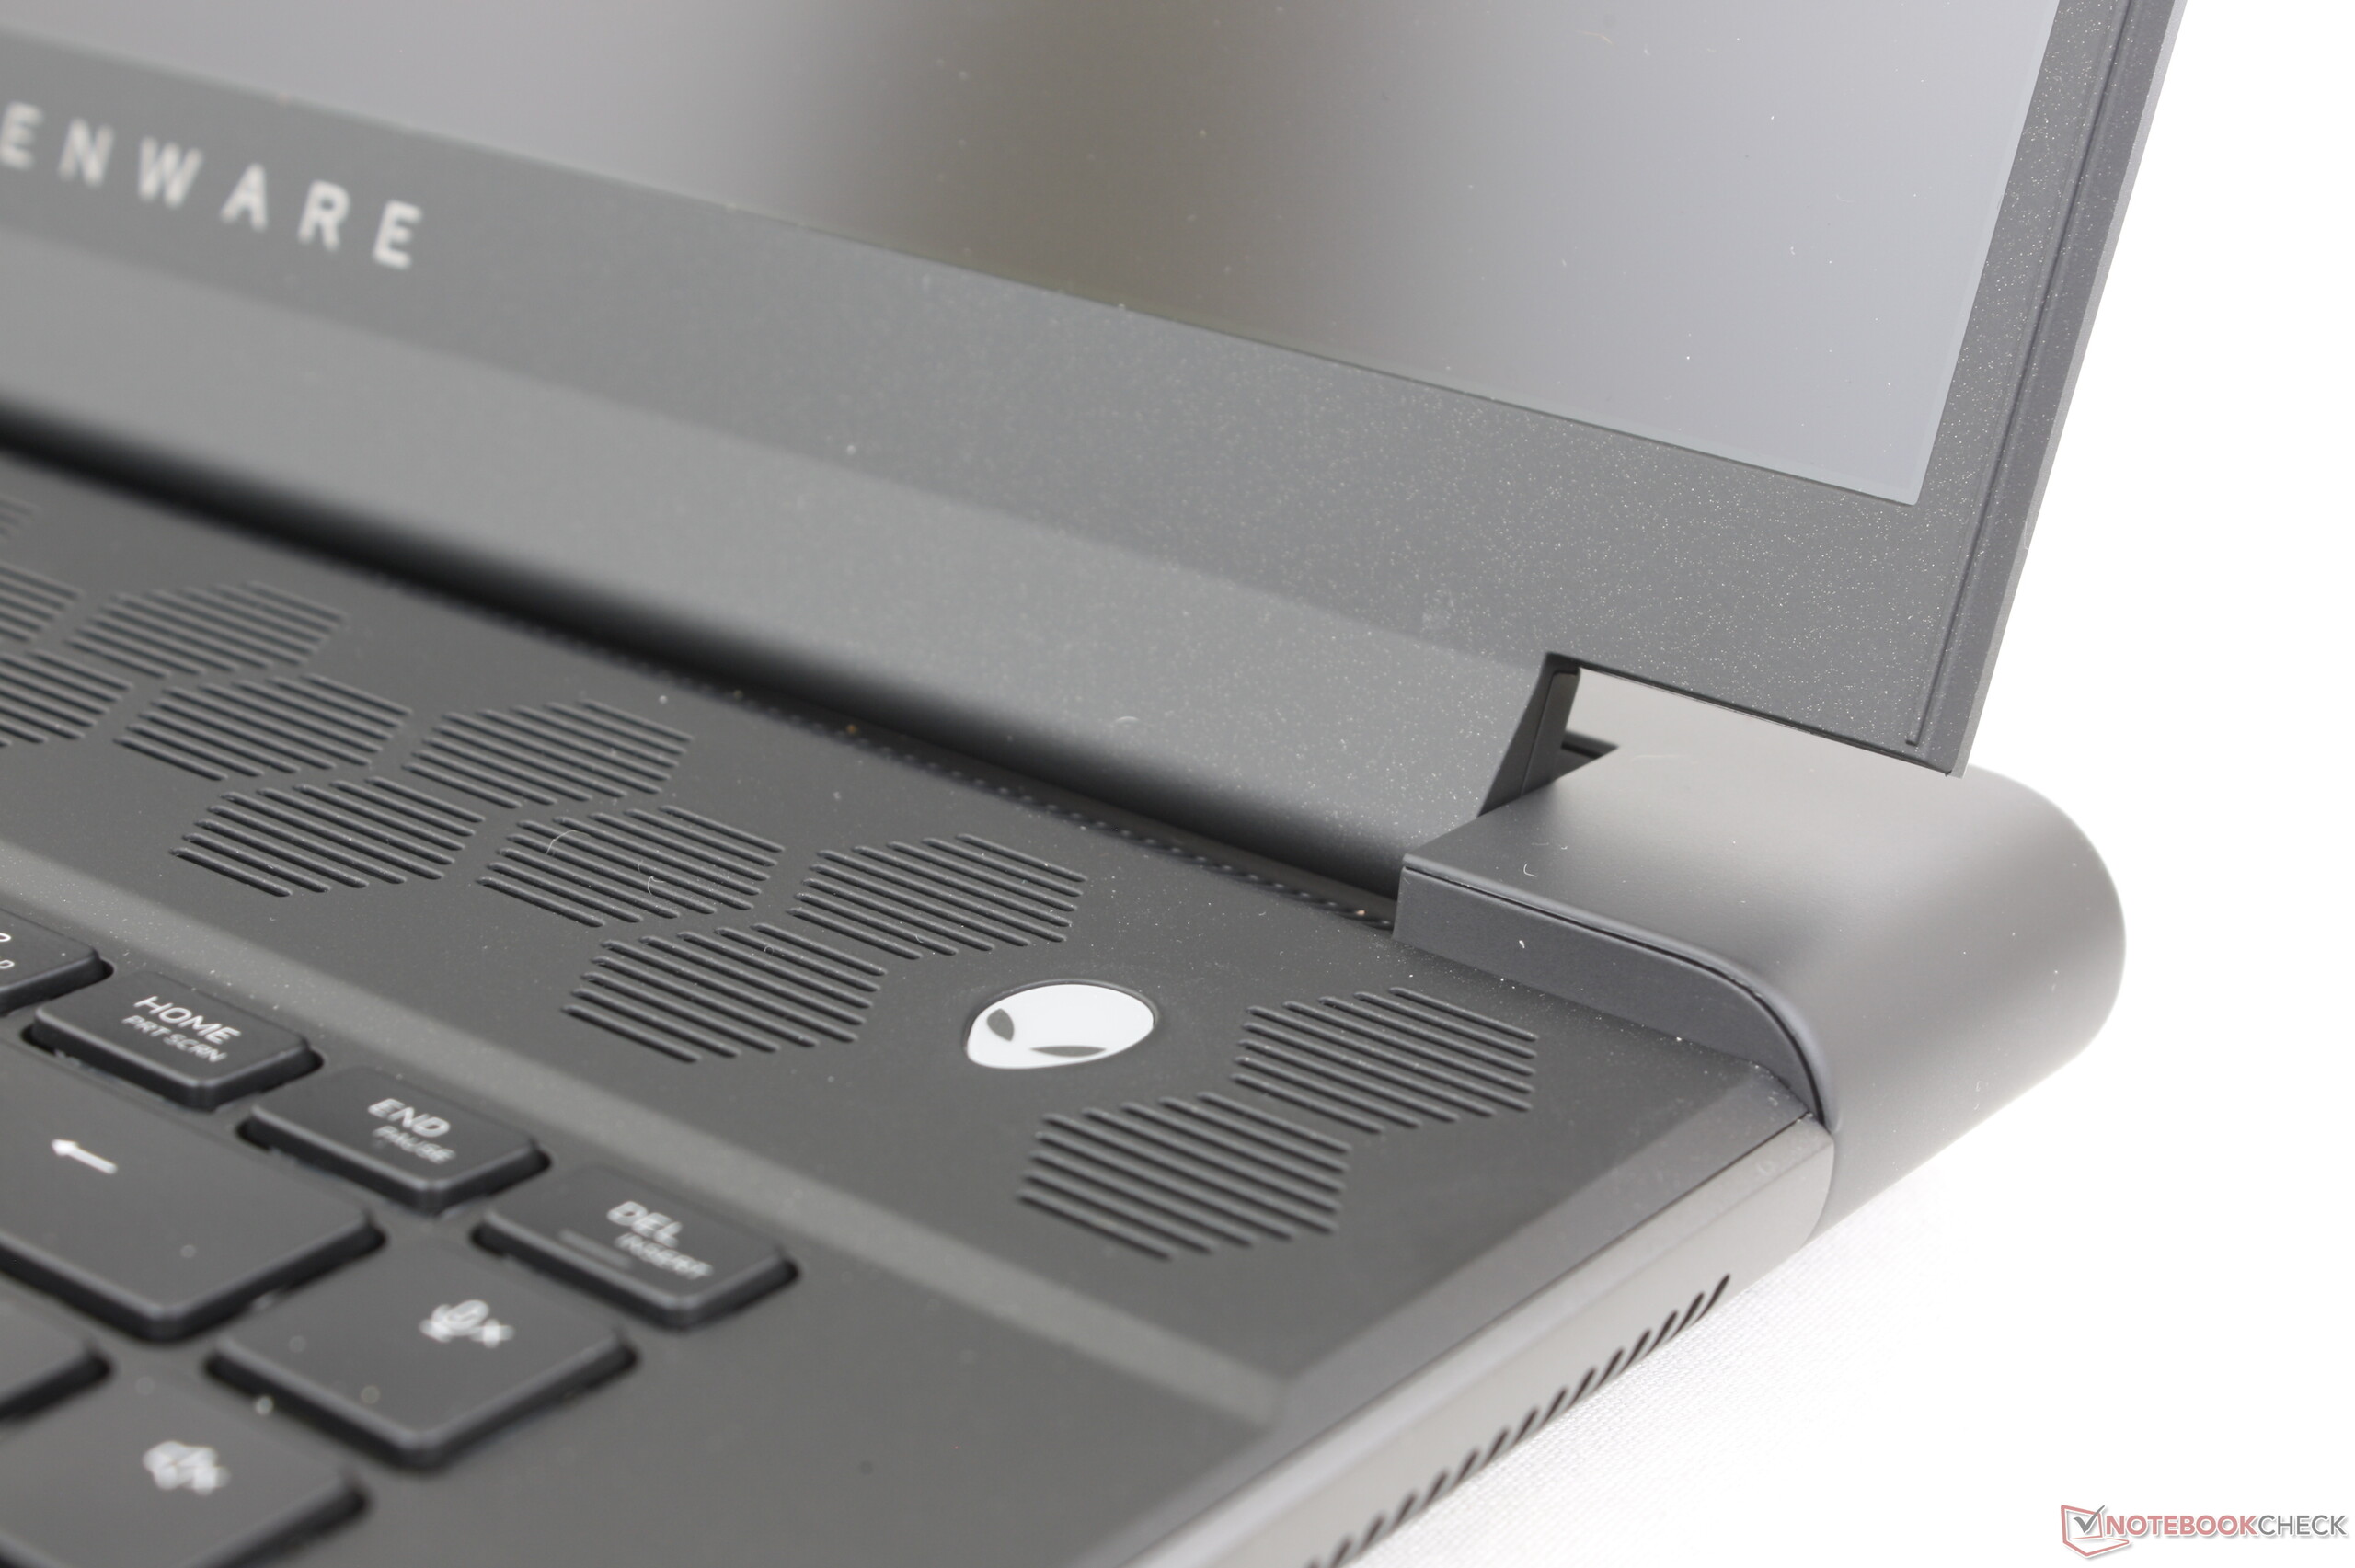
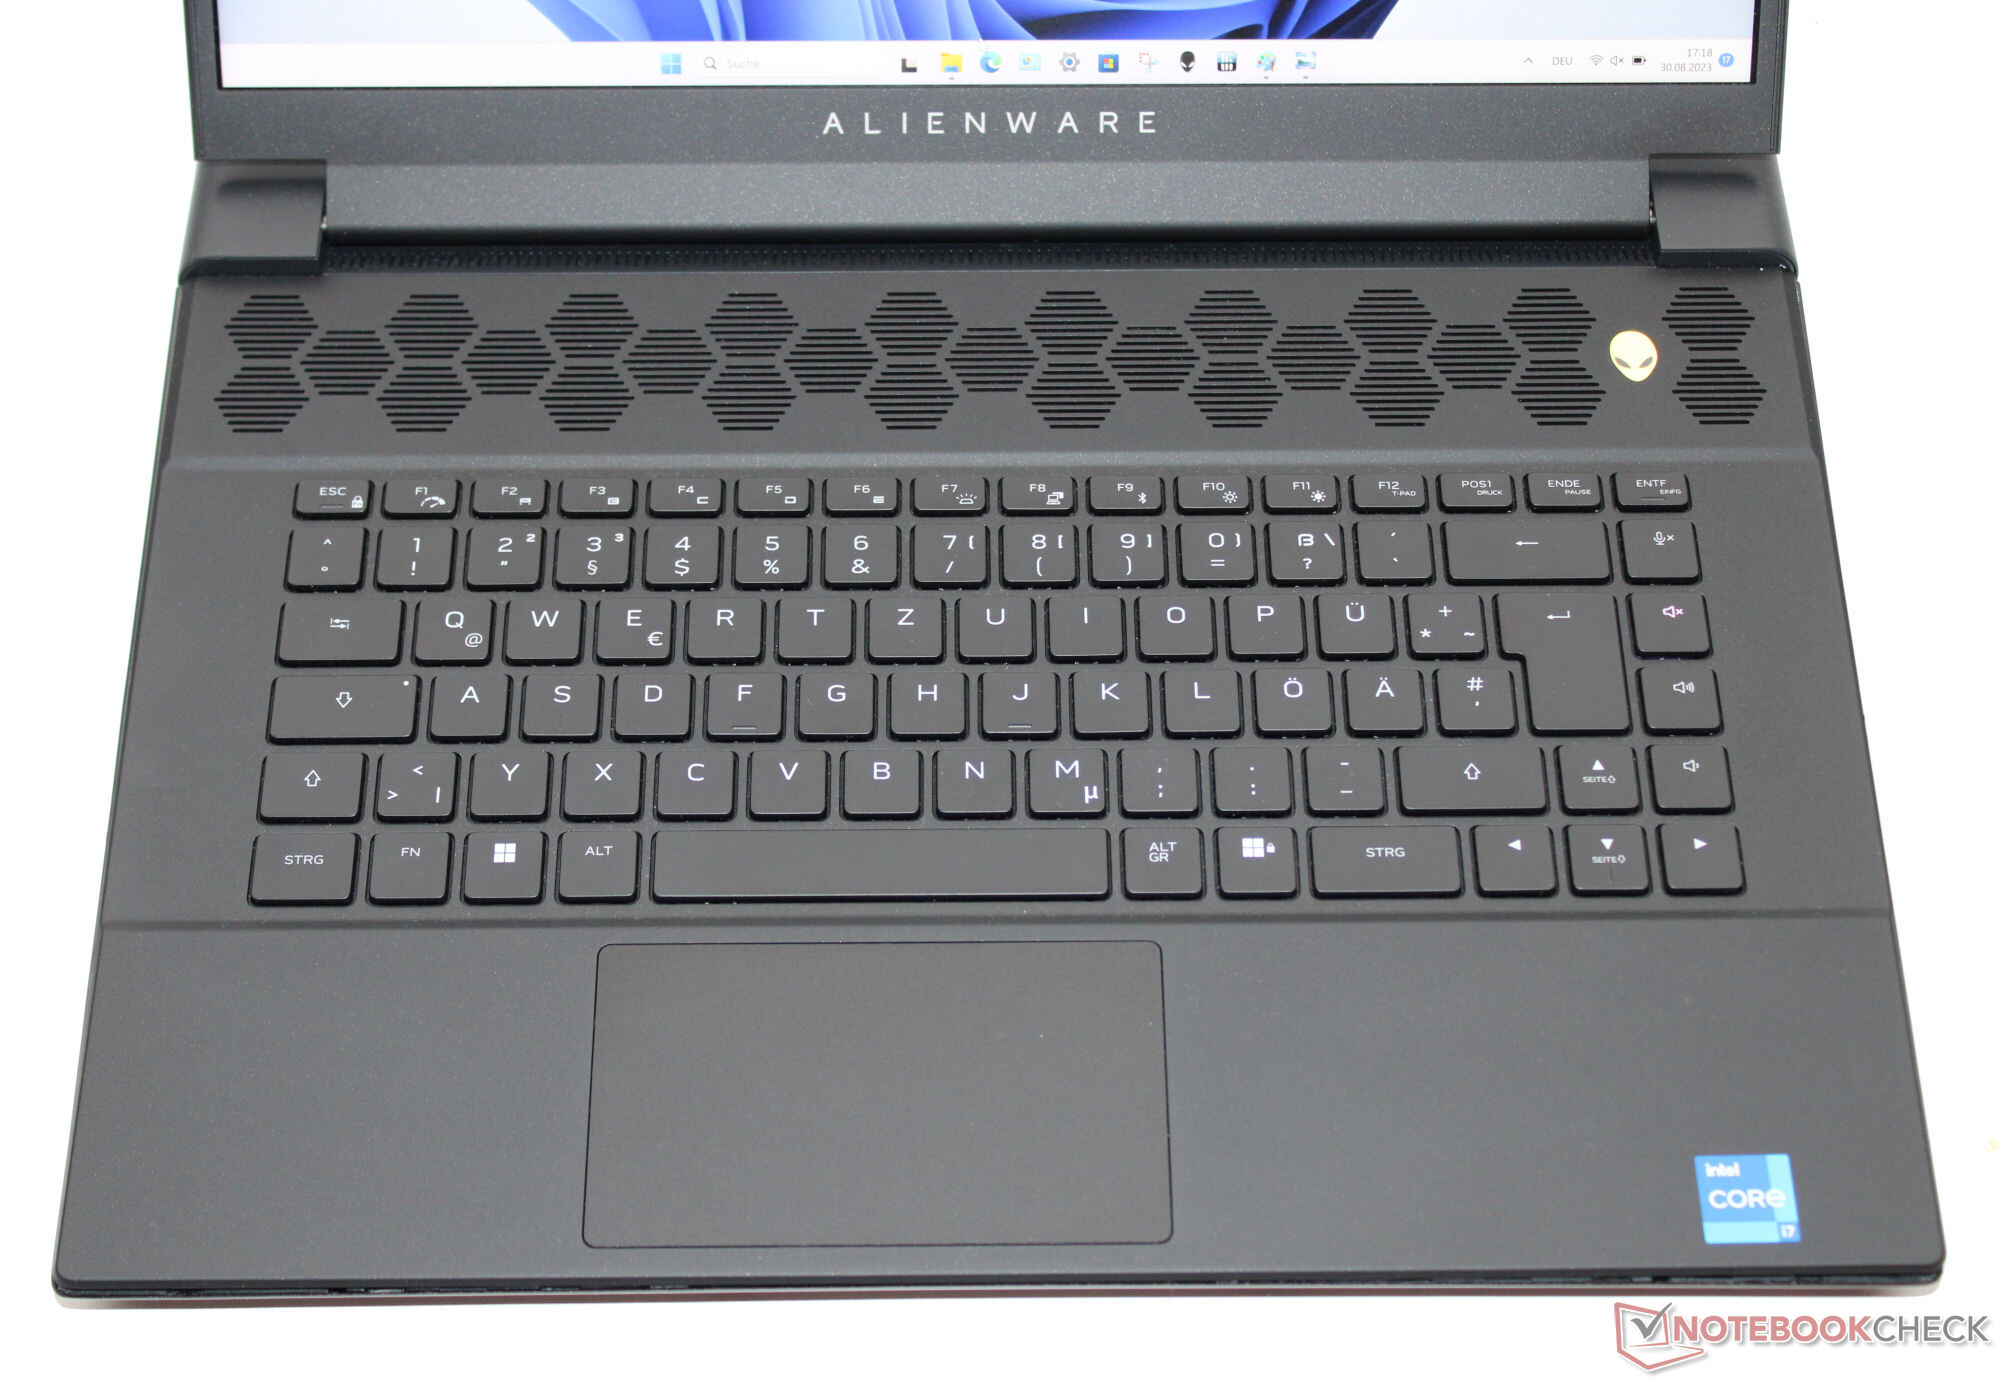
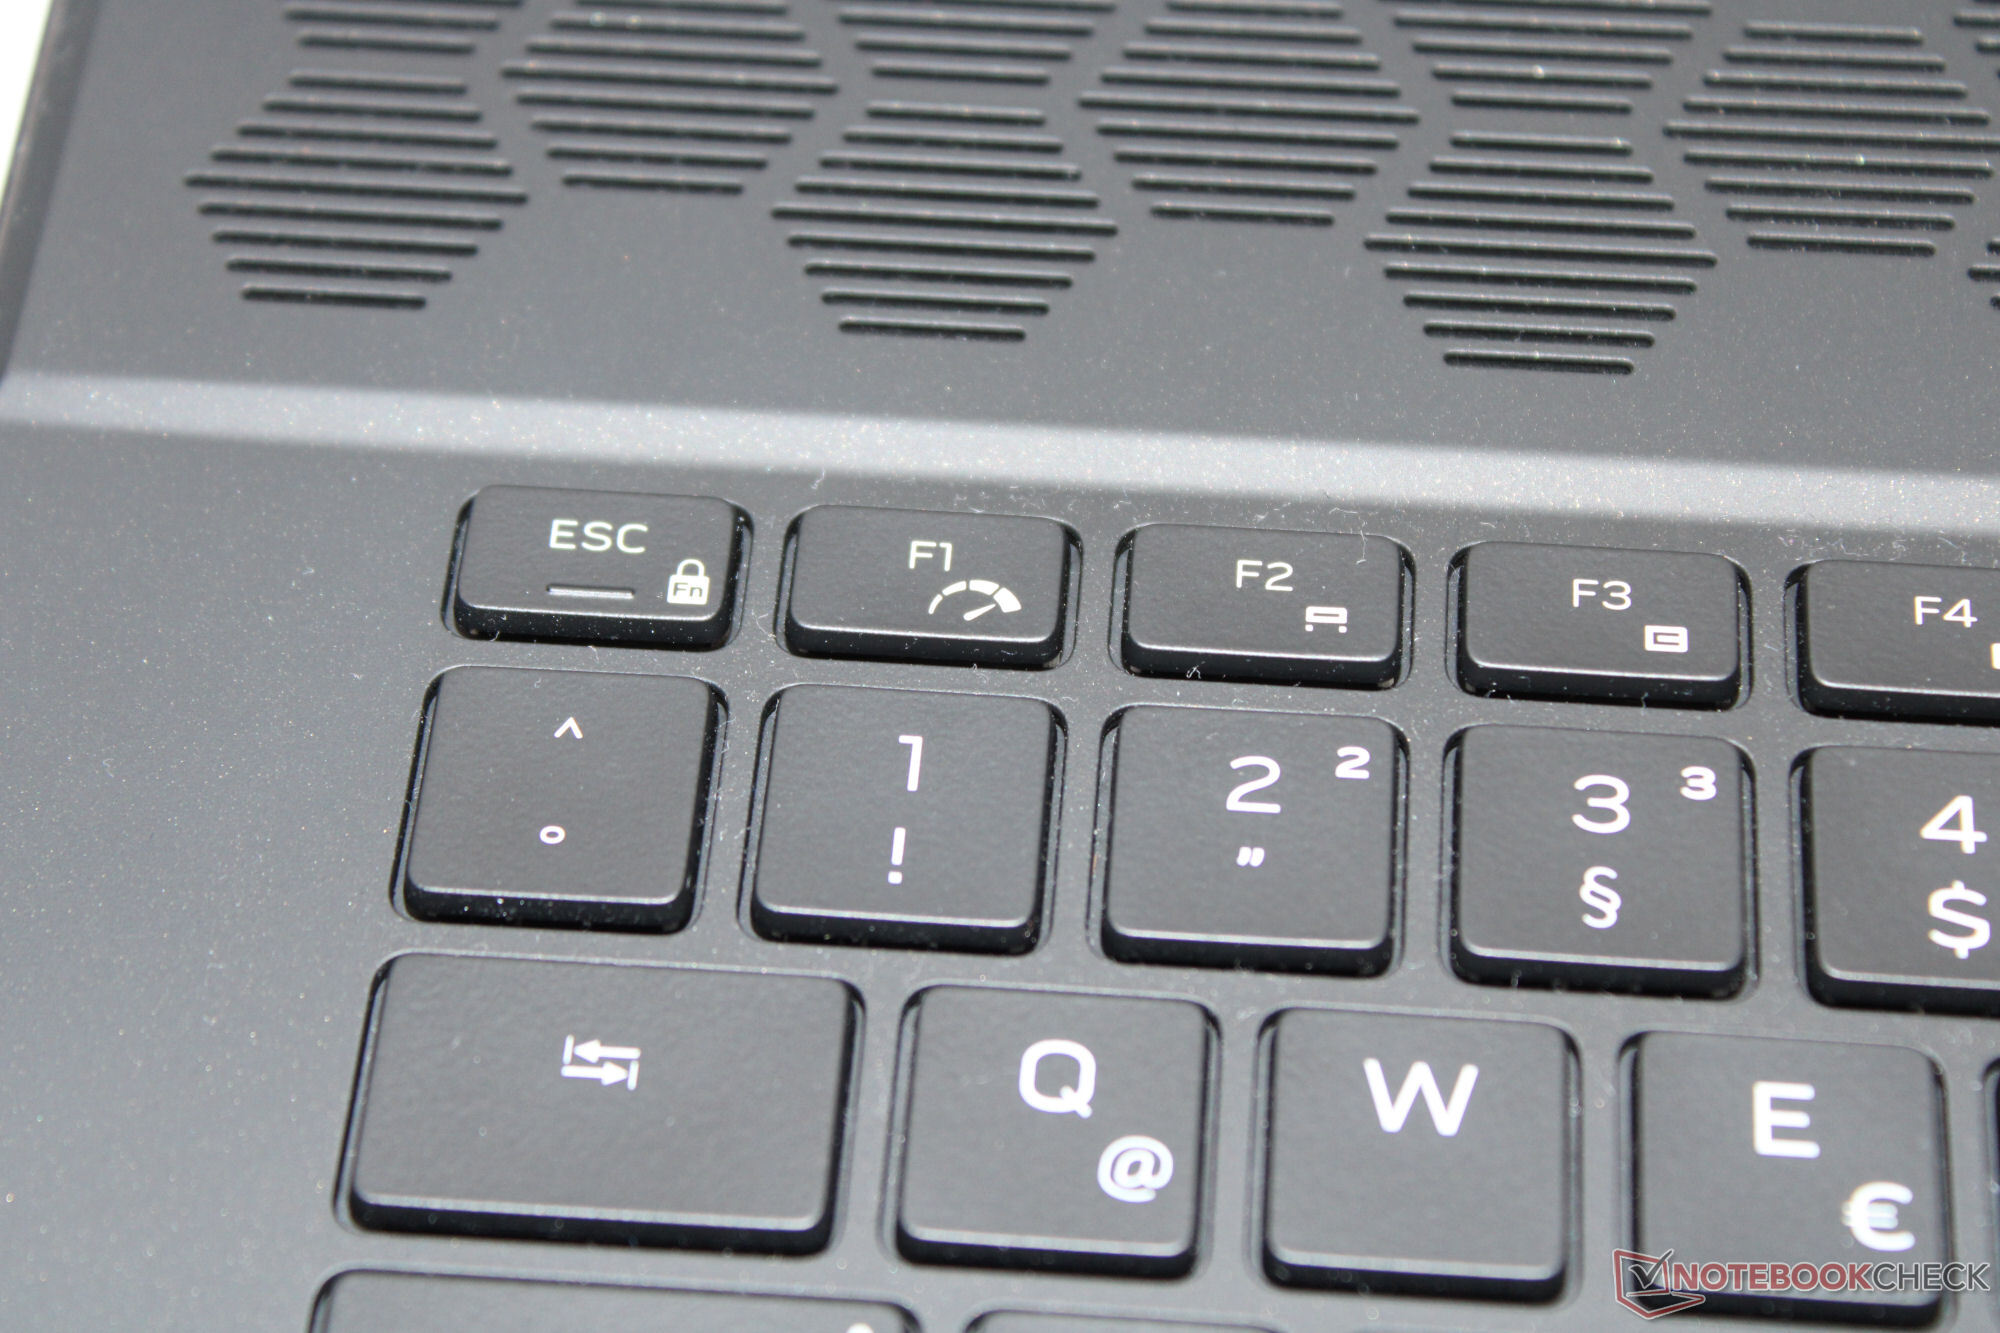
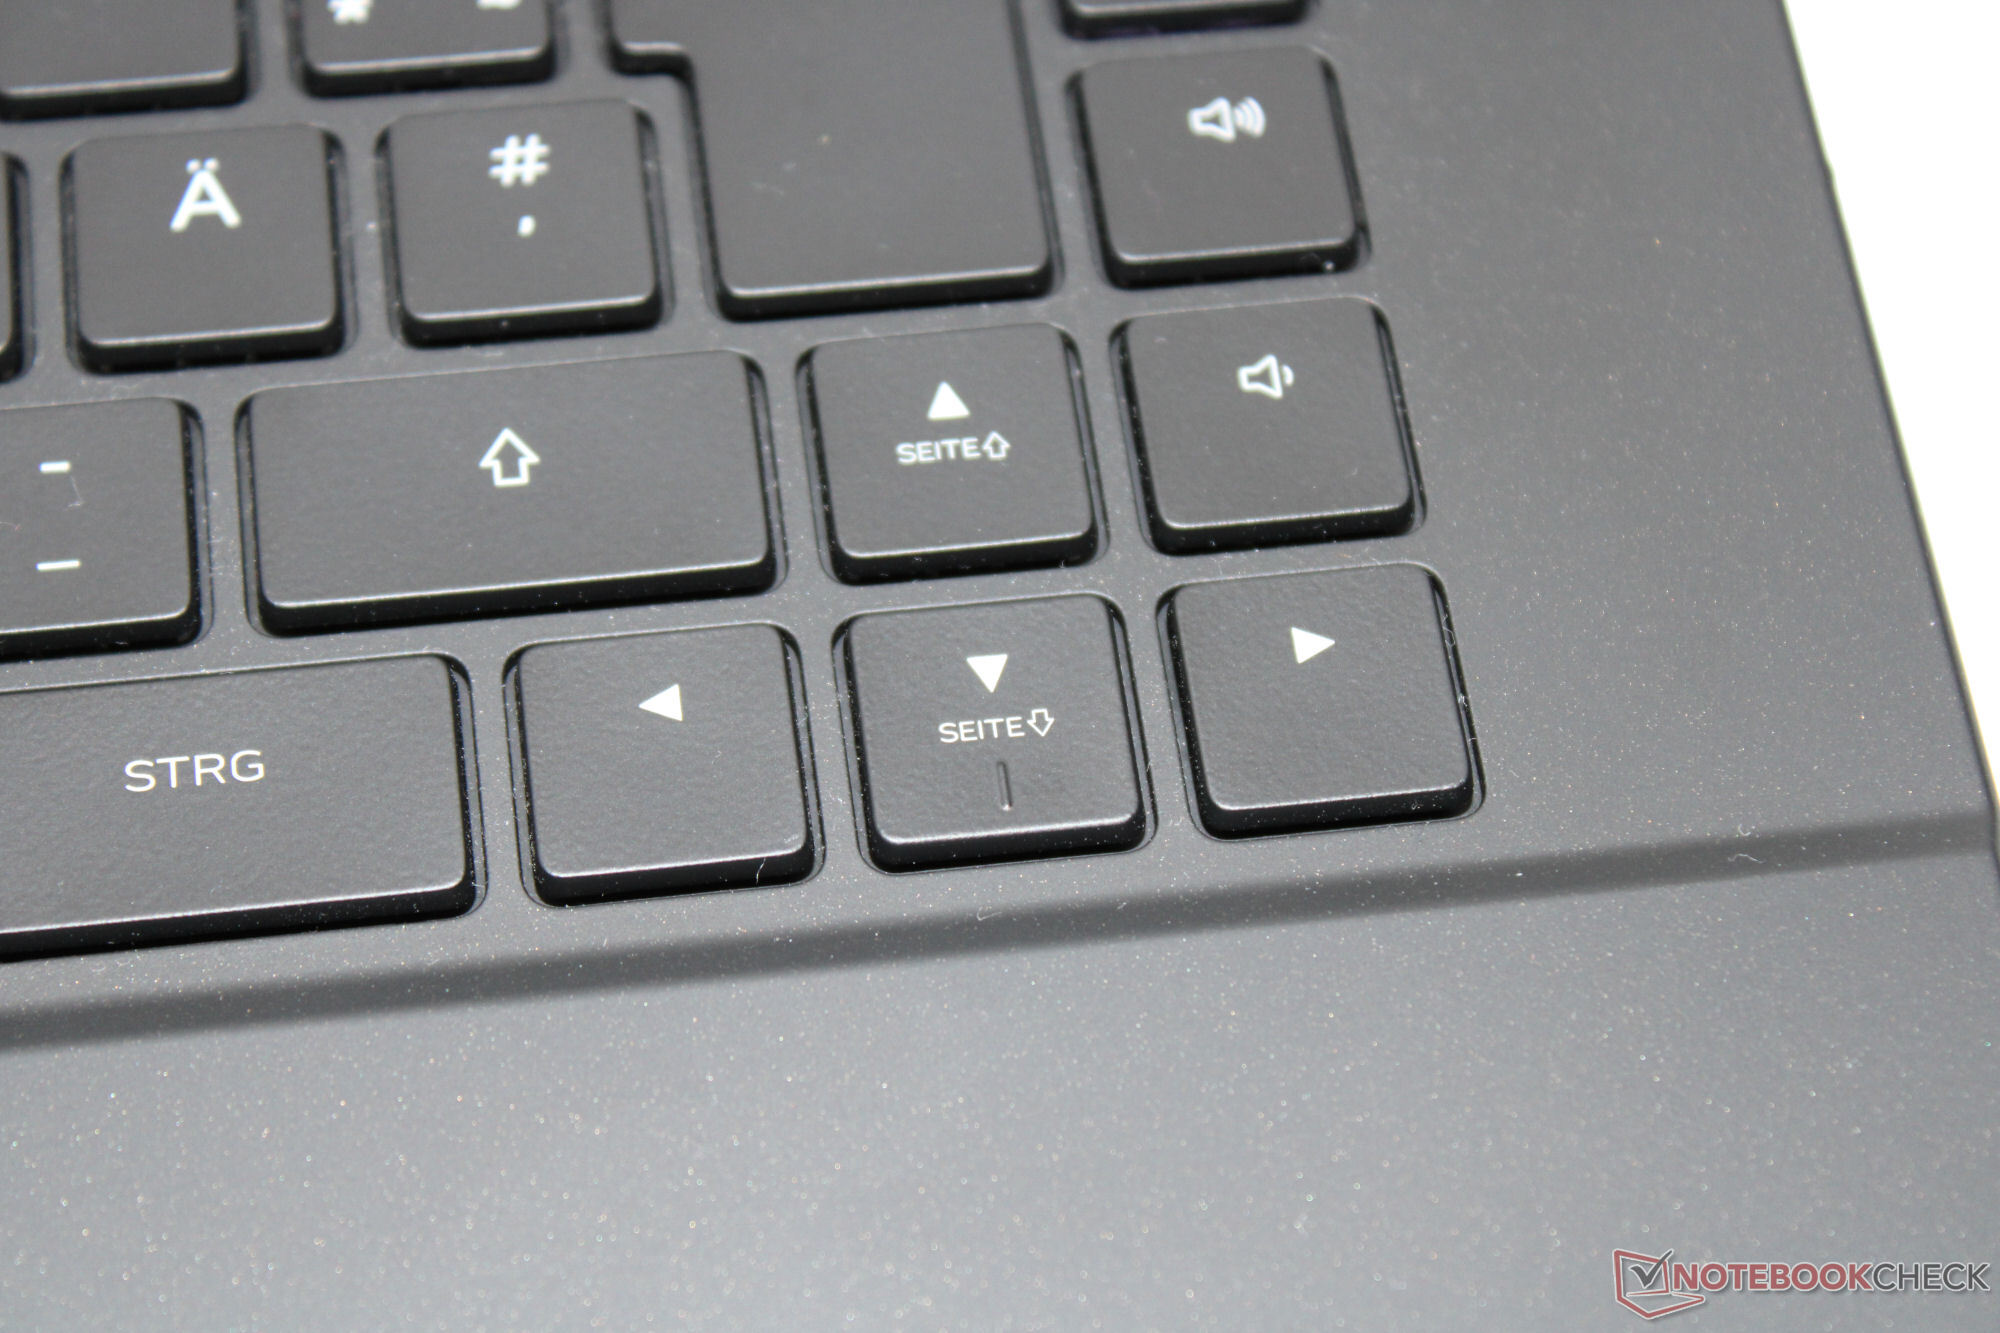
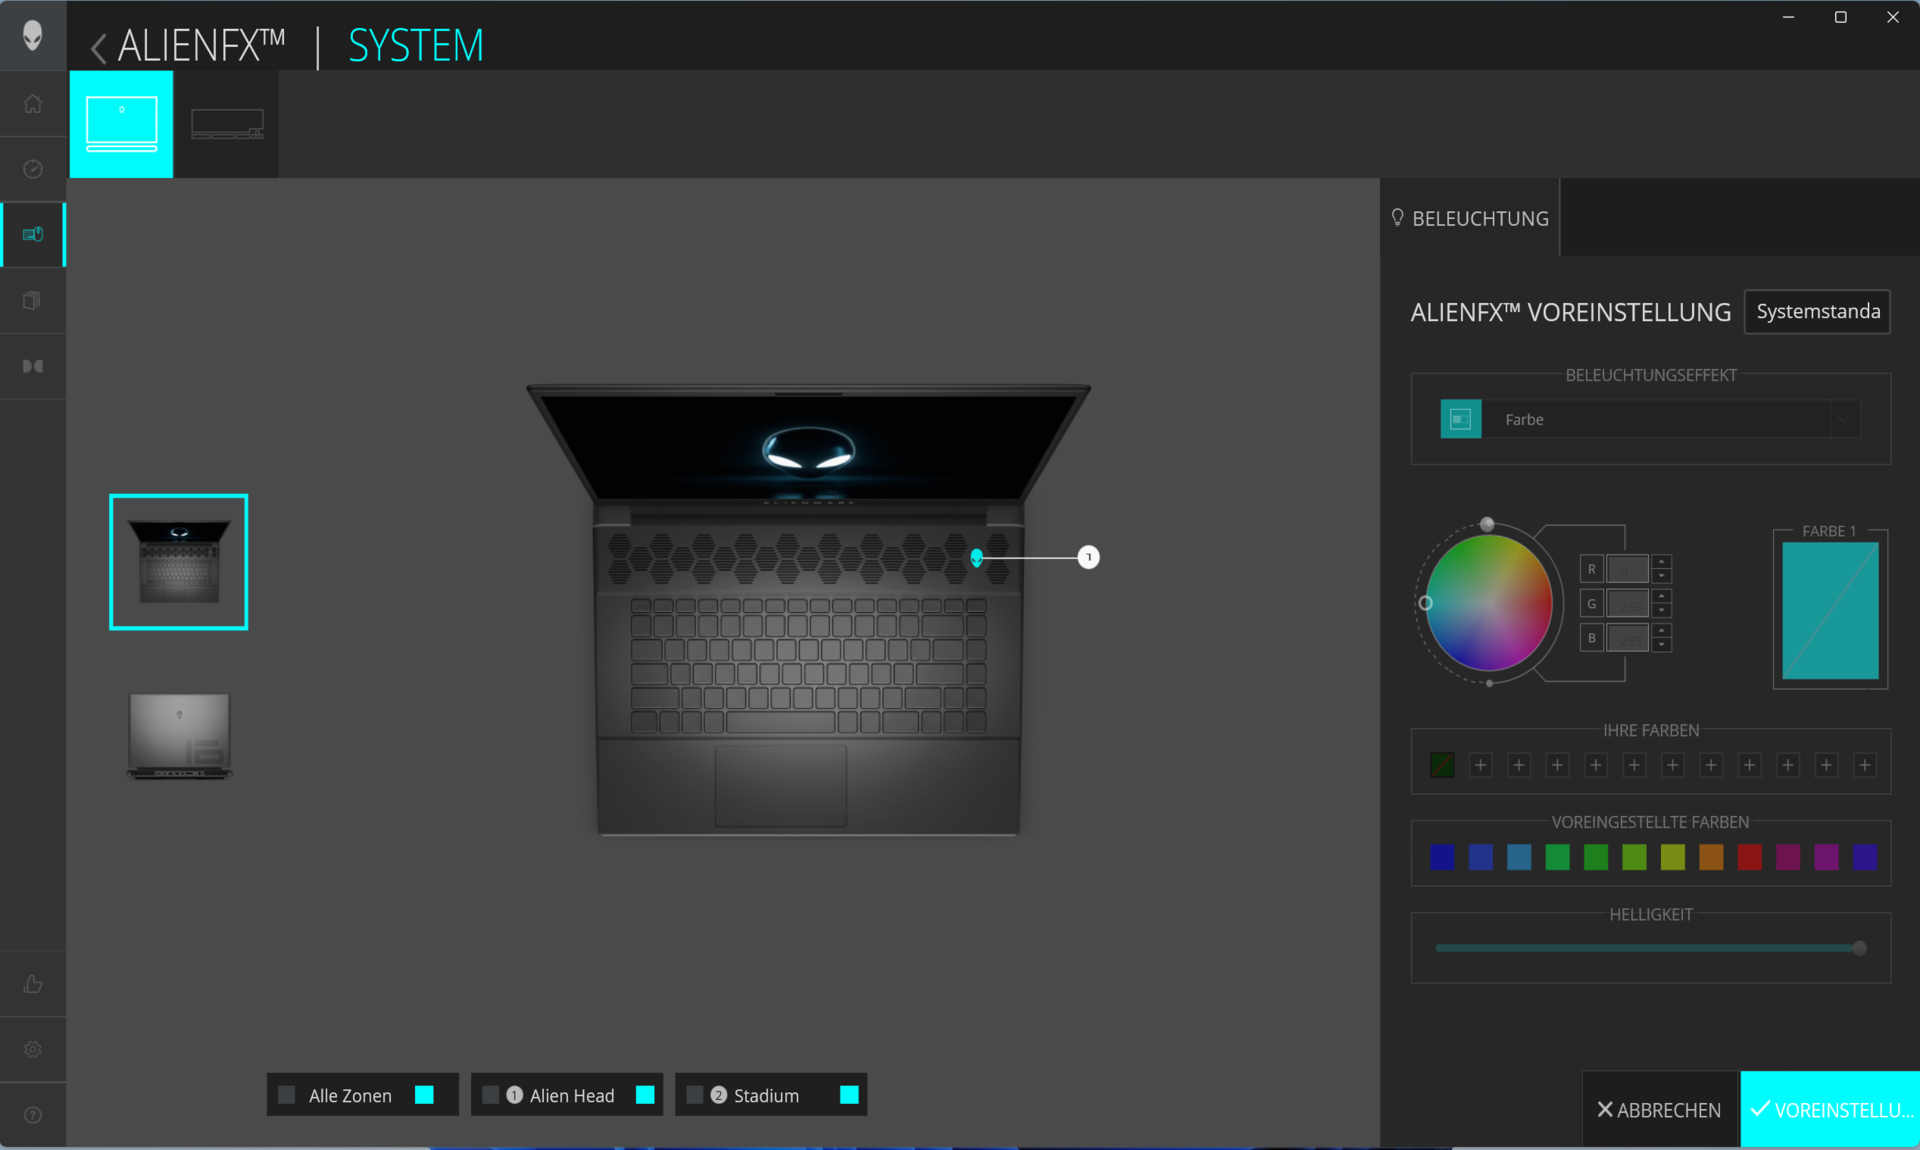
- Instead of the mechanical keyboard (CherryMX) of the sister model, our test device has a membrane keyboard. Its keys offer medium travel, a very clear pressure point and very firm resistance. Individual key lighting (RGB) is also possible.
| SD Card Reader | |
| average JPG Copy Test (av. of 3 runs) | |
| Alienware m16 R1 AMD (Toshiba Exceria Pro SDXC 64 GB UHS-II) | |
| Alienware m16 R1 Intel (AV PRO microSD 128 GB V60) | |
| Average of class Gaming (19 - 202, n=98, last 2 years) | |
| Medion Erazer Defender P40 (AV PRO microSD 128 GB V60) | |
| SCHENKER XMG Pro 15 (E23) | |
| Acer Predator Helios 16 PH16-71-731Q | |
| maximum AS SSD Seq Read Test (1GB) | |
| Alienware m16 R1 AMD (Toshiba Exceria Pro SDXC 64 GB UHS-II) | |
| Alienware m16 R1 Intel (AV PRO microSD 128 GB V60) | |
| Average of class Gaming (25.8 - 269, n=92, last 2 years) | |
| Medion Erazer Defender P40 (AV PRO microSD 128 GB V60) | |
| SCHENKER XMG Pro 15 (E23) | |
| Acer Predator Helios 16 PH16-71-731Q | |


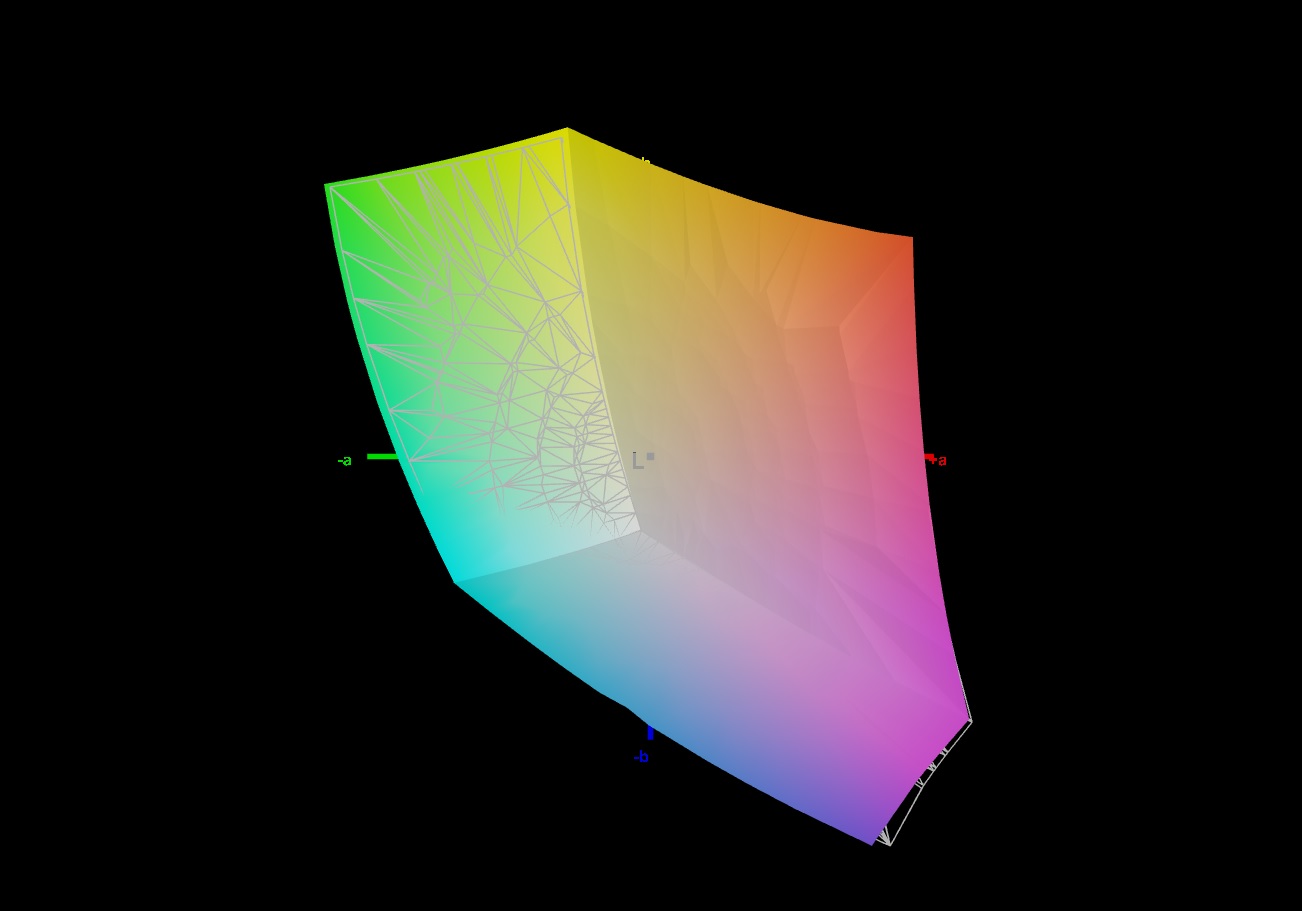
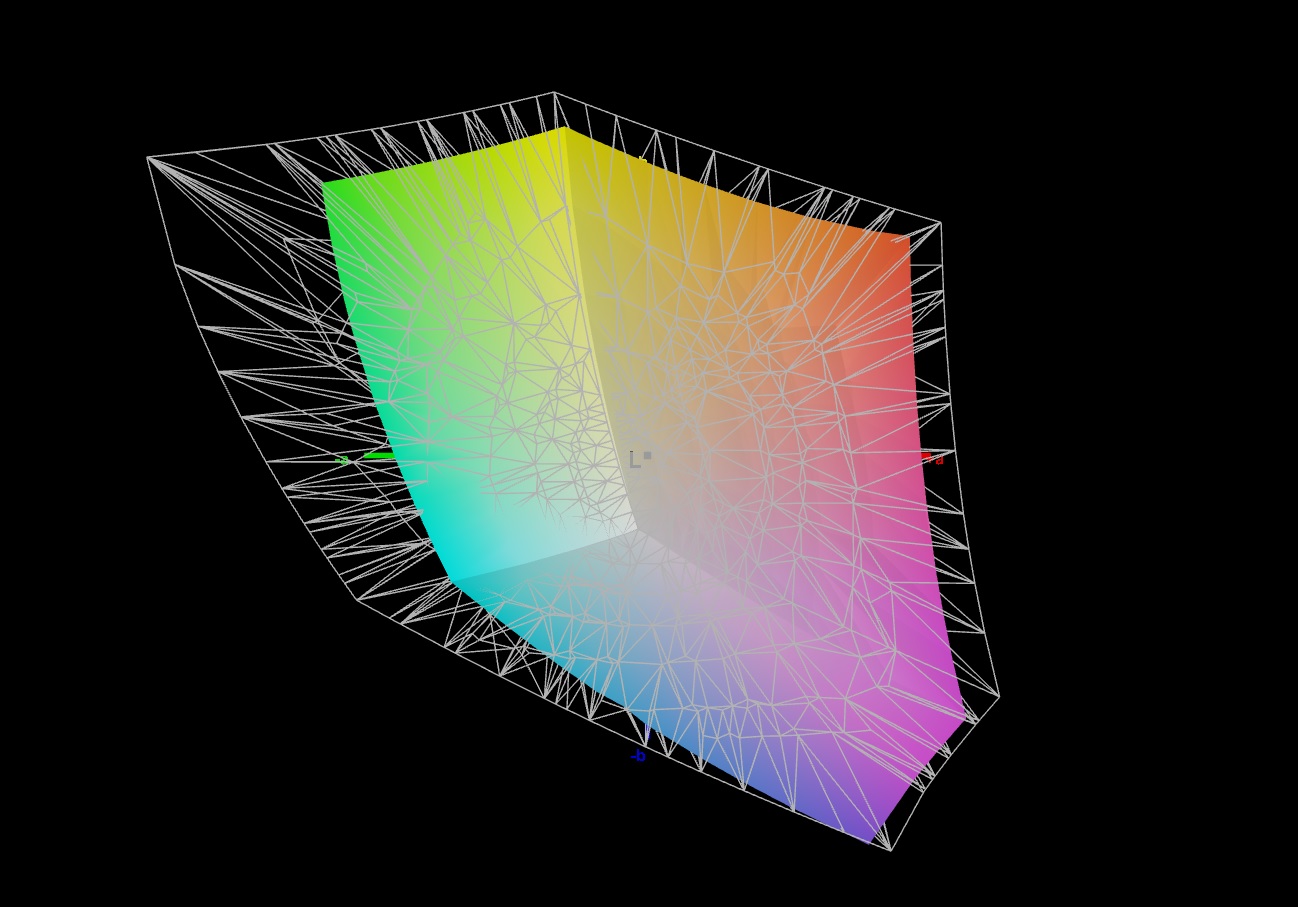
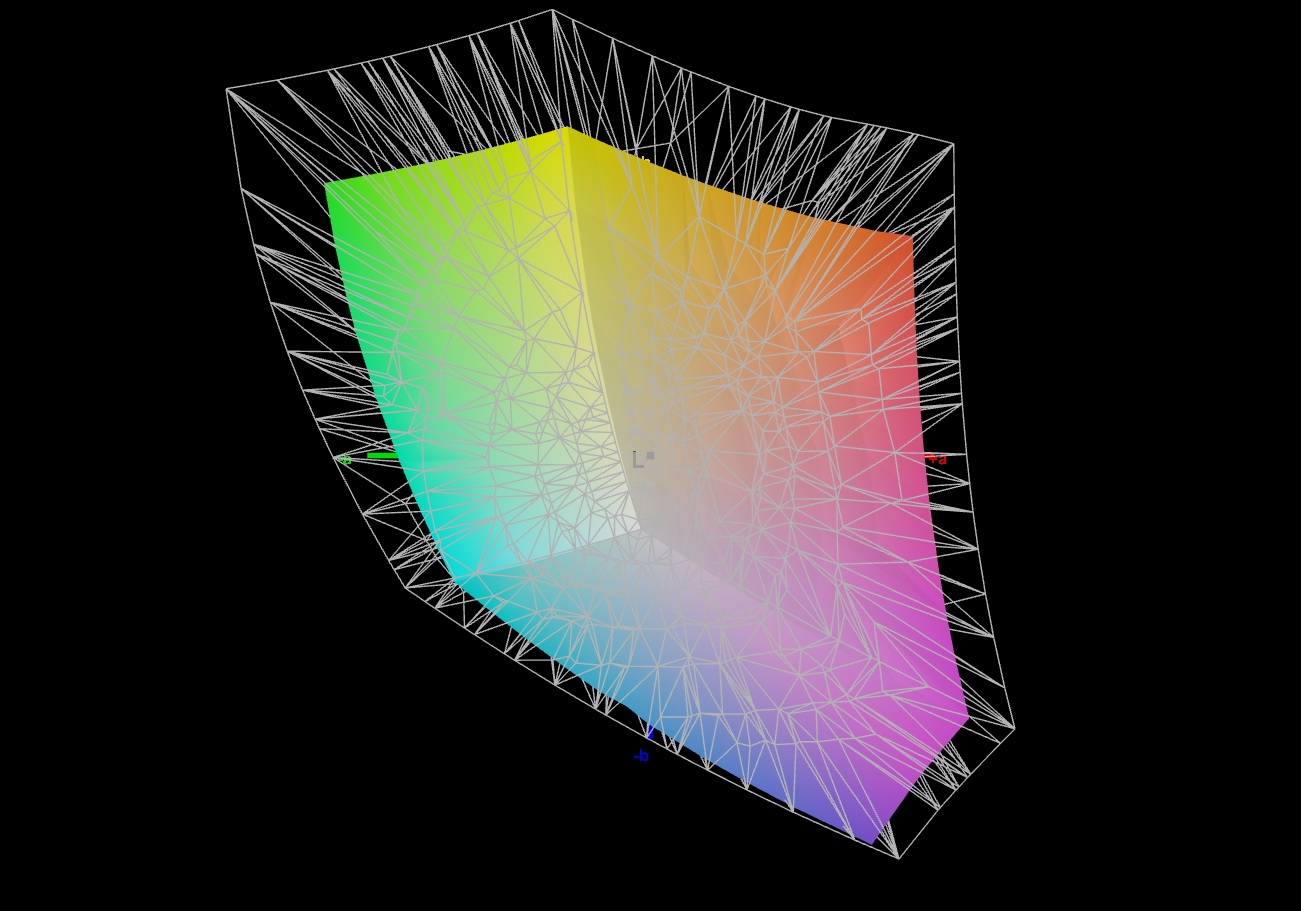
Display - QHD+ with sRGB coverage
On the plus side of the matte 16-inch screen (2560x1600, IPS) in 16:10 format is the absence of PWM flickering, G-Sync support (only for Intel m16 models) and short response times. The brightness and contrast of the 165 Hz panel reach the respective target (> 300 cd/m² or 1000:1).
Alternatively, there are two other displays (1x QHD+, 1x FHD+) that offer higher refresh rates and greater color space coverage. 4k, OLED, or mini-LED options are not available.
| |||||||||||||||||||||||||
Brightness Distribution: 89 %
Center on Battery: 306 cd/m²
Contrast: 1020:1 (Black: 0.3 cd/m²)
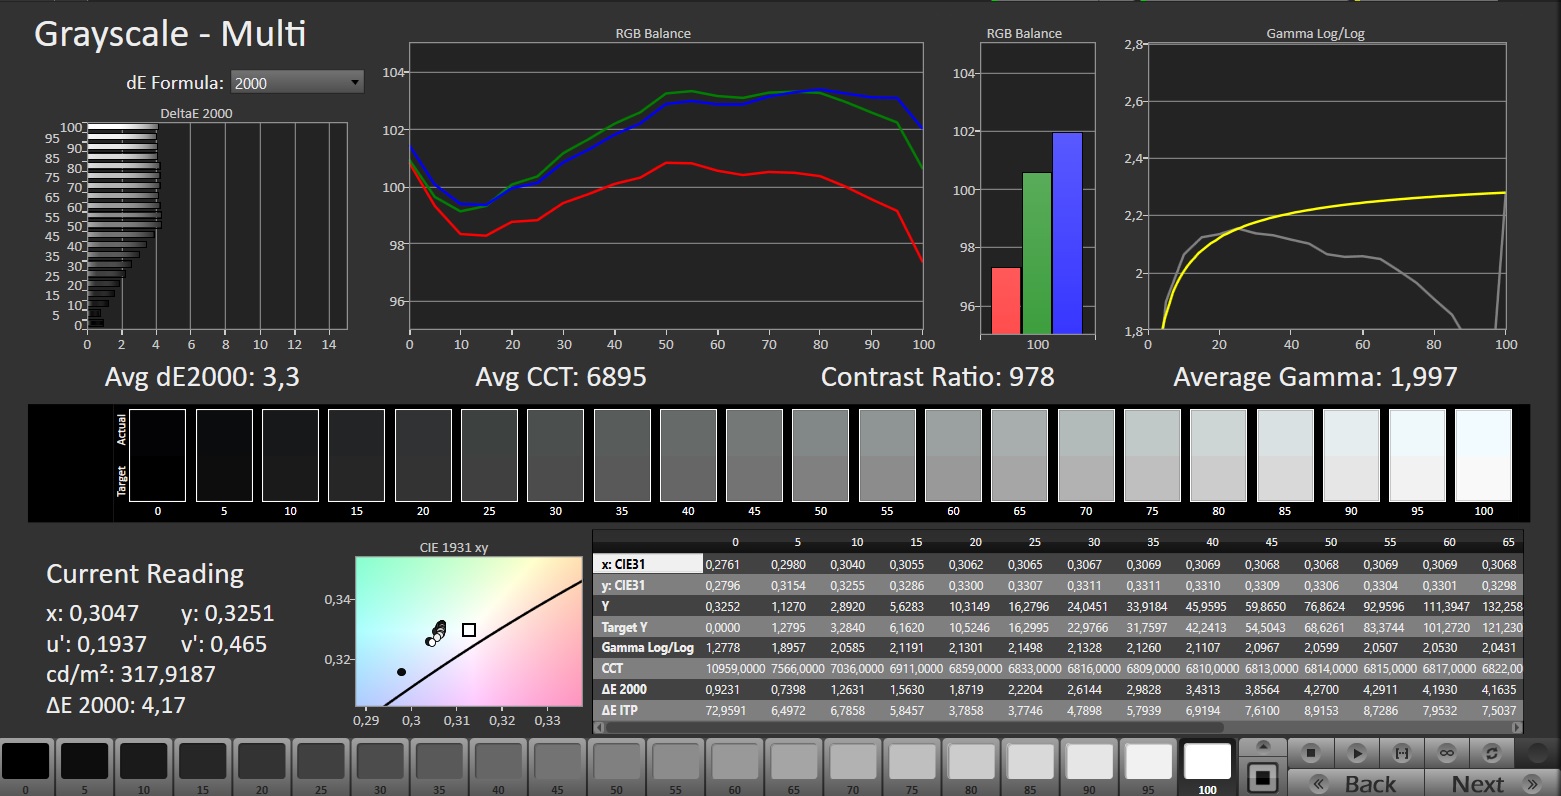
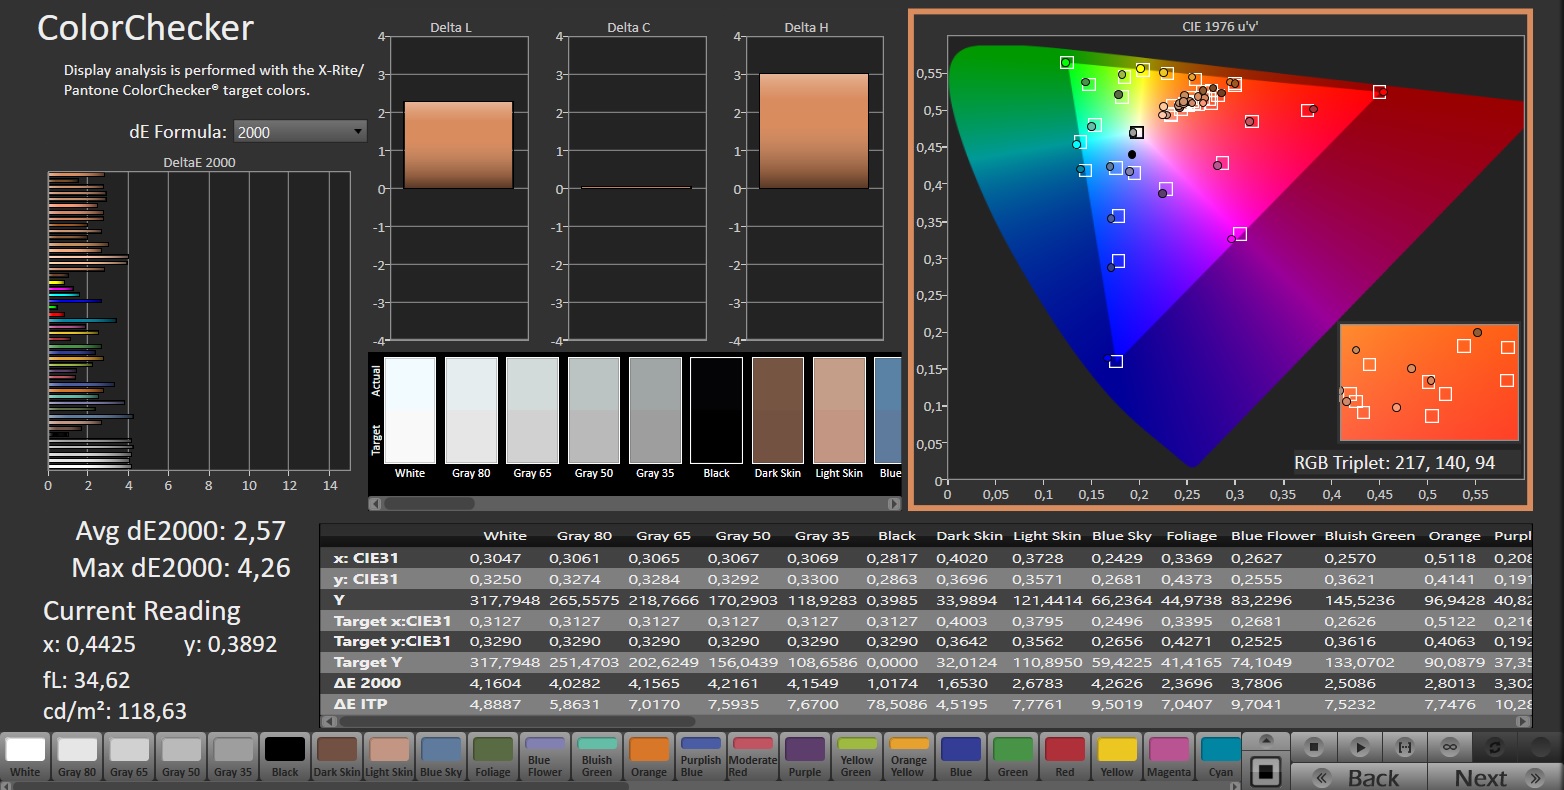
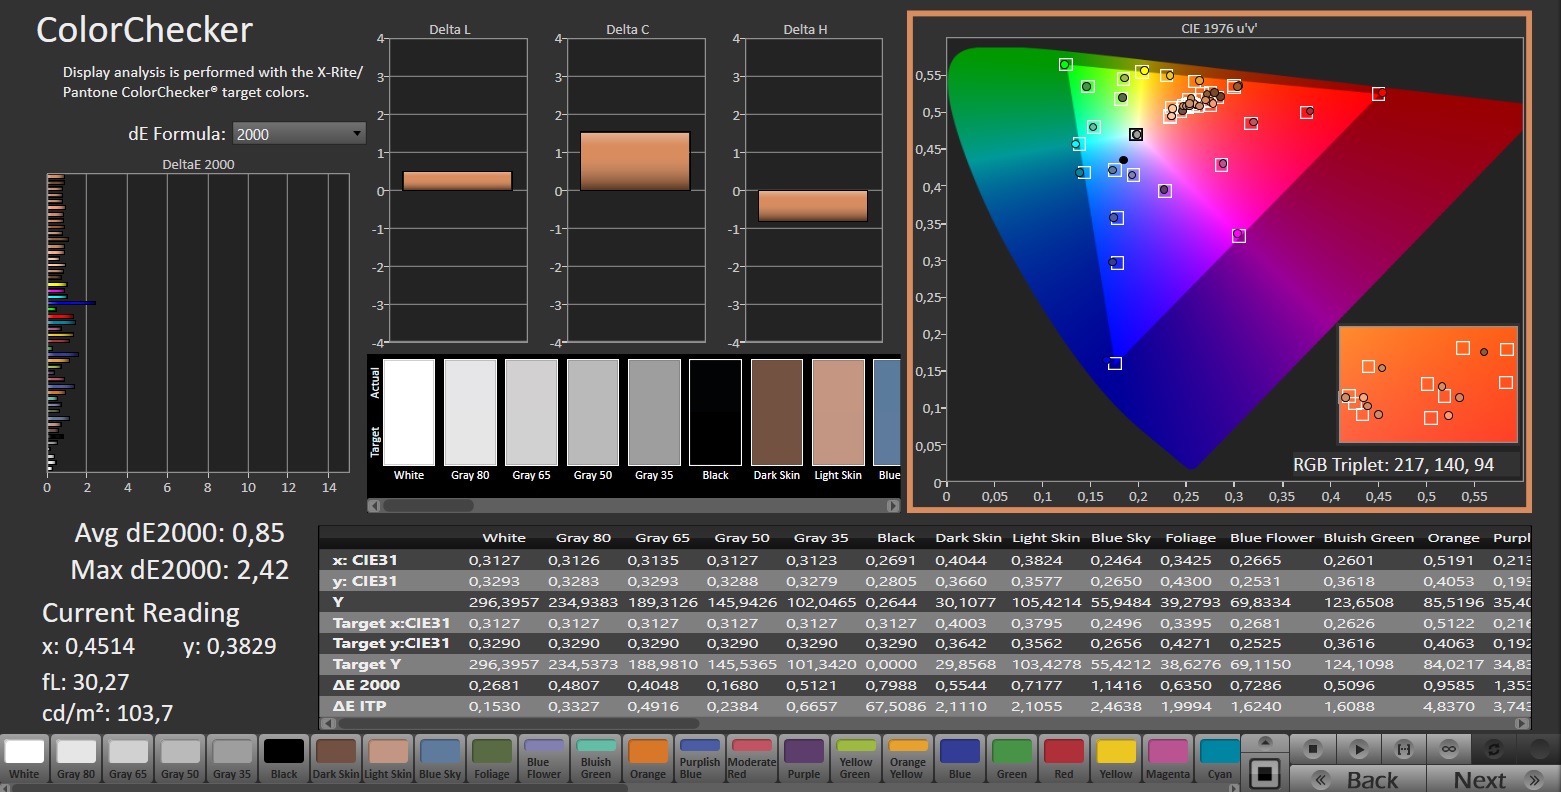
ΔE Color 2.57 | 0.5-29.43 Ø5, calibrated: 0.85
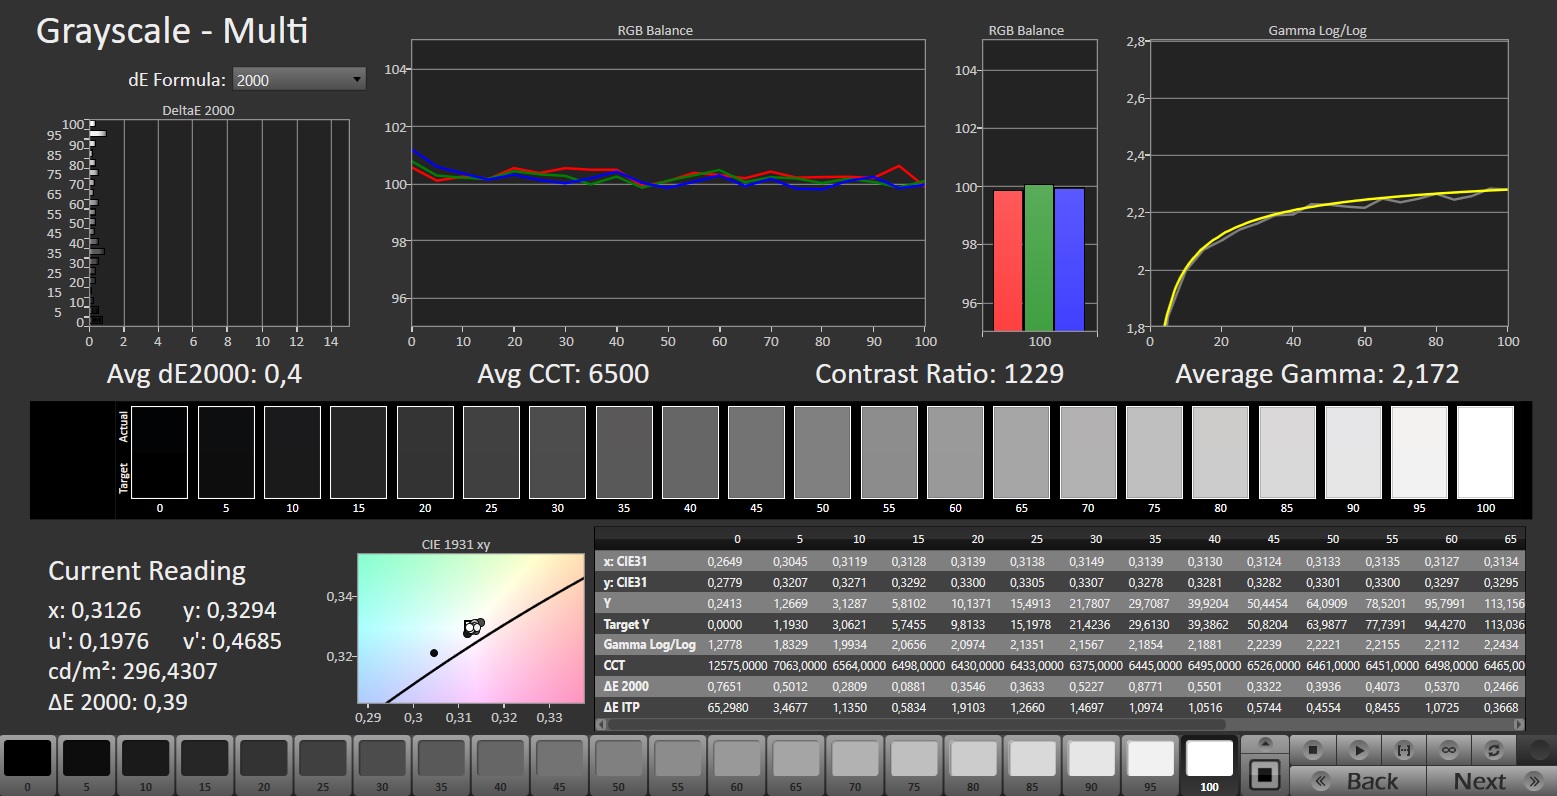
ΔE Greyscale 3.3 | 0.57-98 Ø5.3
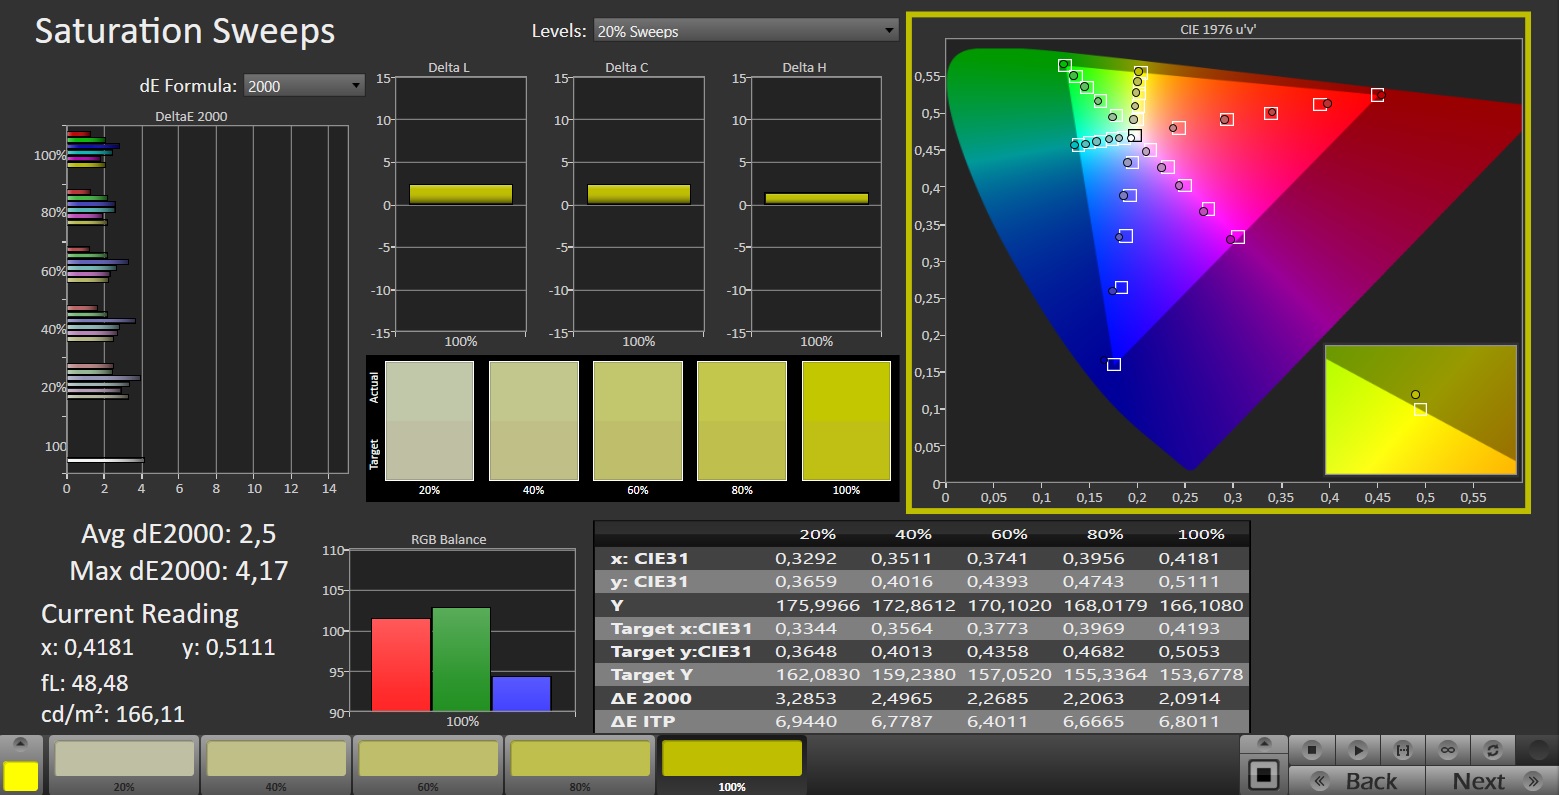
70% AdobeRGB 1998 (Argyll 2.2.0 3D)
97.2% sRGB (Argyll 2.2.0 3D)
67.7% Display P3 (Argyll 2.2.0 3D)
Gamma: 1.997
| Alienware m16 R1 Intel BOE NE16NYB, IPS, 2560x1600, 16.00 | Acer Predator Helios 16 PH16-71-731Q BOE NE160QDM-NZ2, IPS-LED, 2560x1600, 16.00 | Medion Erazer Defender P40 BOE CQ NE173QHM-NZ3, IPS, 2560x1440, 17.30 | Lenovo Legion Pro 5 16IRX8 AU Optronics B160QAN03.1, IPS, 2560x1600, 16.00 | SCHENKER XMG Pro 15 (E23) BOE0AD1, IPS, 2560x1440, 15.60 | Aorus 15 BSF Sharp LQ156T1JW05, IPS, 2560x1440, 15.60 | Alienware m16 R1 AMD BOE NE16NZ4, IPS, 2560x1600, 16.00 | |
|---|---|---|---|---|---|---|---|
| Display | 22% | 1% | 4% | 23% | 23% | 25% | |
| Display P3 Coverage | 67.7 | 97.1 43% | 68.3 1% | 71.2 5% | 97.8 44% | 98.2 45% | 98.6 46% |
| sRGB Coverage | 97.2 | 100 3% | 98.1 1% | 98.8 2% | 99.9 3% | 99.9 3% | 99.9 3% |
| AdobeRGB 1998 Coverage | 70 | 84.7 21% | 69.8 0% | 73.3 5% | 85.4 22% | 85.7 22% | 88.9 27% |
| Response Times | -114% | -142% | -153% | -141% | -90% | -26% | |
| Response Time Grey 50% / Grey 80% * | 4 ? | 13.6 ? -240% | 14.6 ? -265% | 14.5 ? -263% | 14 ? -250% | 11.3 ? -183% | 5.1 ? -28% |
| Response Time Black / White * | 7.3 ? | 6.4 ? 12% | 8.7 ? -19% | 10.4 ? -42% | 9.6 ? -32% | 7 ? 4% | 9 ? -23% |
| PWM Frequency | |||||||
| Screen | 14% | 18% | 19% | -15% | -24% | -34% | |
| Brightness middle | 306 | 511 67% | 364 19% | 405.7 33% | 322 5% | 299 -2% | 329 8% |
| Brightness | 302 | 498 65% | 343 14% | 368 22% | 301 0% | 282 -7% | 317 5% |
| Brightness Distribution | 89 | 94 6% | 86 -3% | 87 -2% | 85 -4% | 82 -8% | 89 0% |
| Black Level * | 0.3 | 0.36 -20% | 0.28 7% | 0.38 -27% | 0.36 -20% | 0.31 -3% | 0.32 -7% |
| Contrast | 1020 | 1419 39% | 1300 27% | 1068 5% | 894 -12% | 965 -5% | 1028 1% |
| Colorchecker dE 2000 * | 2.57 | 1.76 32% | 1.67 35% | 1.65 36% | 1.98 23% | 2.24 13% | 3.71 -44% |
| Colorchecker dE 2000 max. * | 4.26 | 3.7 13% | 2.78 35% | 4.2 1% | 5.24 -23% | 4.29 -1% | 7.23 -70% |
| Colorchecker dE 2000 calibrated * | 0.85 | 1.56 -84% | 1.14 -34% | 0.53 38% | 1.98 -133% | 2.62 -208% | 2.82 -232% |
| Greyscale dE 2000 * | 3.3 | 3 9% | 1.4 58% | 1.2 64% | 2.44 26% | 3 9% | 2.2 33% |
| Gamma | 1.997 110% | 2.33 94% | 2.091 105% | 2.3 96% | 2.42 91% | 2.086 105% | 2.3 96% |
| CCT | 6895 94% | 6341 103% | 6568 99% | 6453 101% | 6984 93% | 6289 103% | 6270 104% |
| Total Average (Program / Settings) | -26% /
-2% | -41% /
-9% | -43% /
-9% | -44% /
-25% | -30% /
-23% | -12% /
-20% |
* ... smaller is better
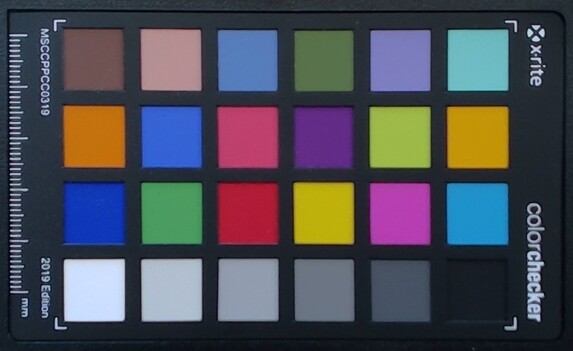
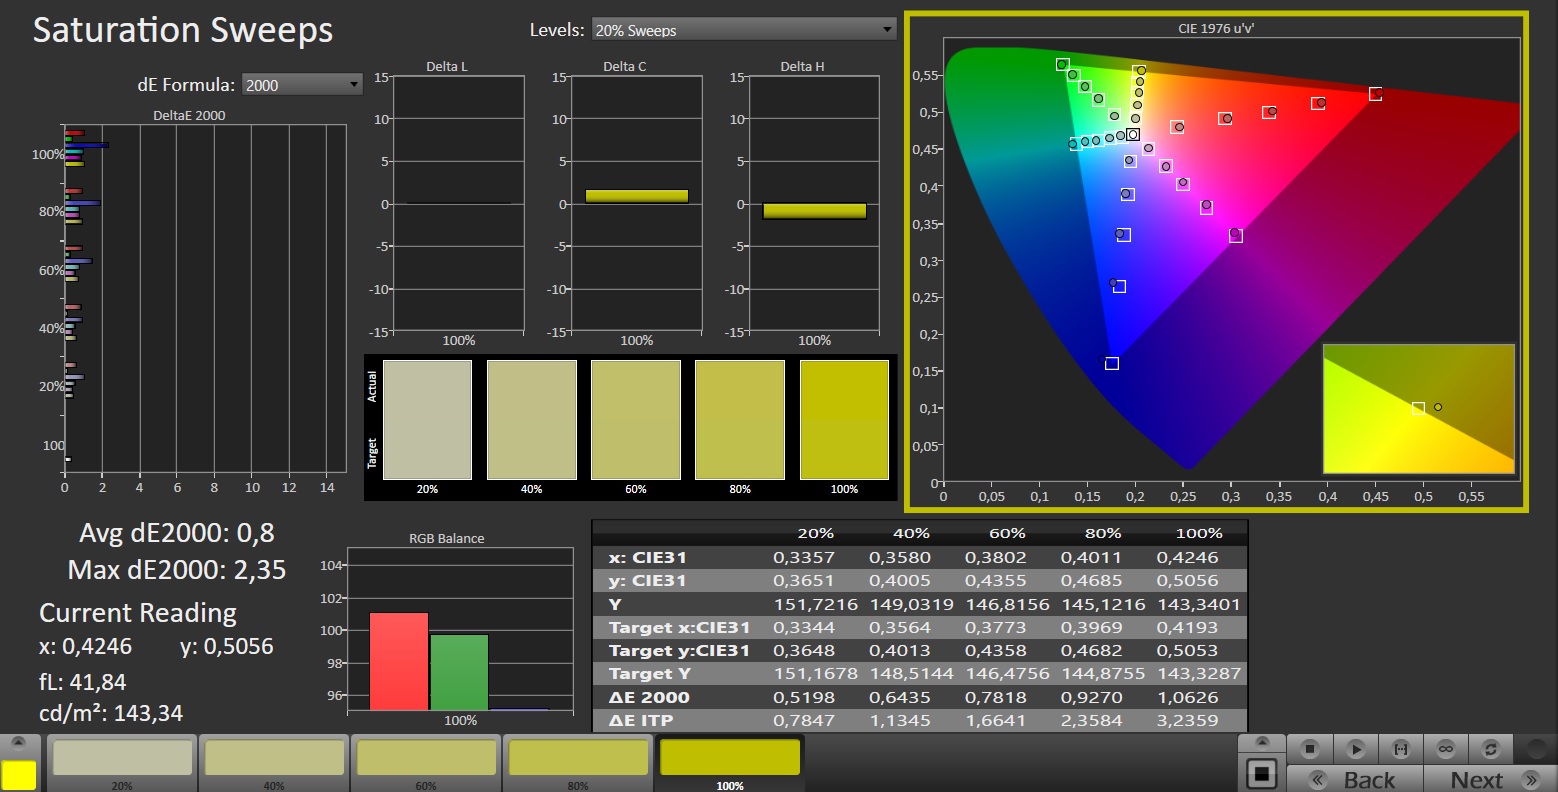
The screen shows good color representation ex works: the target (DeltaE < 3) is reached with a deviation of around 2.6. Calibration further reduces this deviation to 0.85 and ensures more balanced gray levels. The panel is able to fully reproduce the sRGB color space, but not the AdobeRGB and DCI P3 color spaces. On the other hand, the P3 space can be reproduced on the alternative screens.
Display Response Times
| ↔ Response Time Black to White | ||
|---|---|---|
| 7.3 ms ... rise ↗ and fall ↘ combined | ↗ 3.6 ms rise | 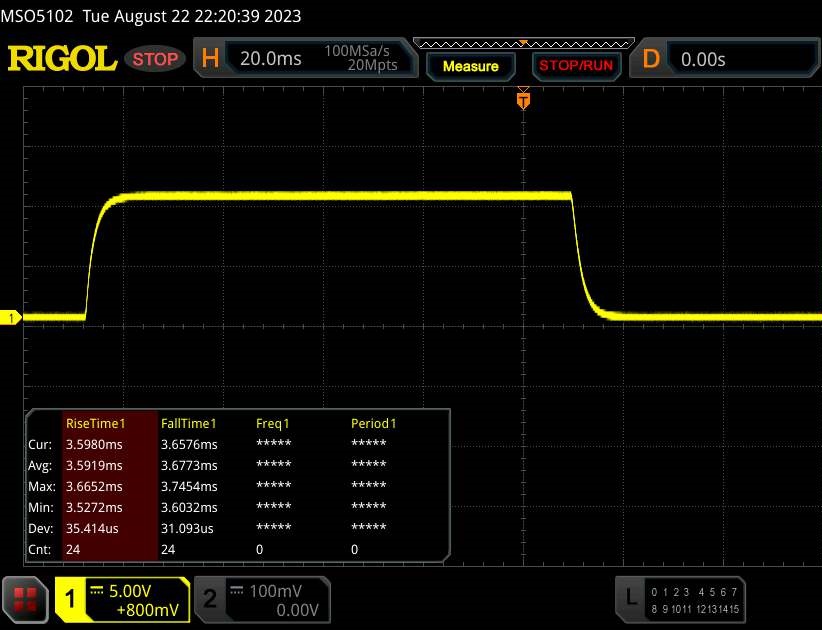 |
| ↘ 3.7 ms fall | ||
| The screen shows very fast response rates in our tests and should be very well suited for fast-paced gaming. In comparison, all tested devices range from 0.1 (minimum) to 240 (maximum) ms. » 16 % of all devices are better. This means that the measured response time is better than the average of all tested devices (21.4 ms). | ||
| ↔ Response Time 50% Grey to 80% Grey | ||
| 4 ms ... rise ↗ and fall ↘ combined | ↗ 1.7 ms rise | 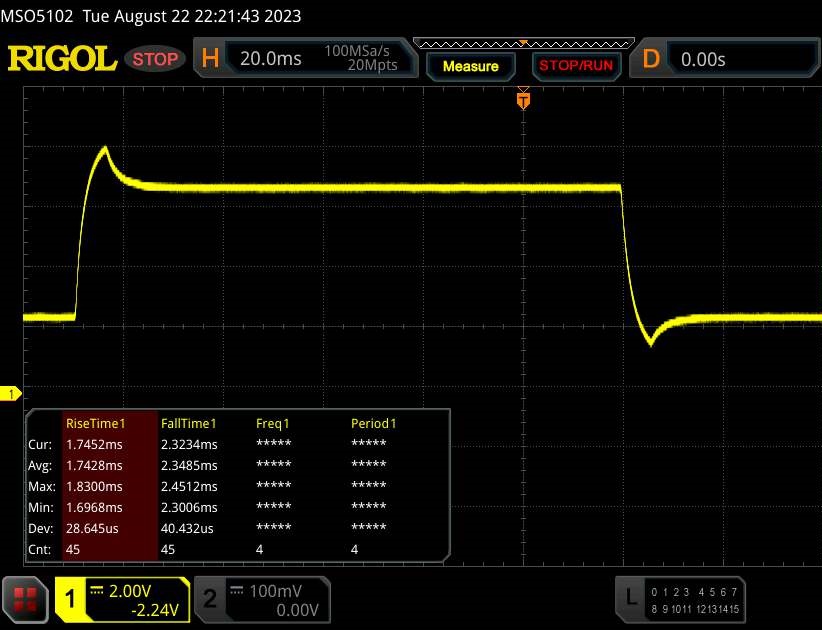 |
| ↘ 2.3 ms fall | ||
| The screen shows very fast response rates in our tests and should be very well suited for fast-paced gaming. In comparison, all tested devices range from 0.2 (minimum) to 636 (maximum) ms. » 10 % of all devices are better. This means that the measured response time is better than the average of all tested devices (33.7 ms). | ||
Screen Flickering / PWM (Pulse-Width Modulation)
| Screen flickering / PWM not detected | 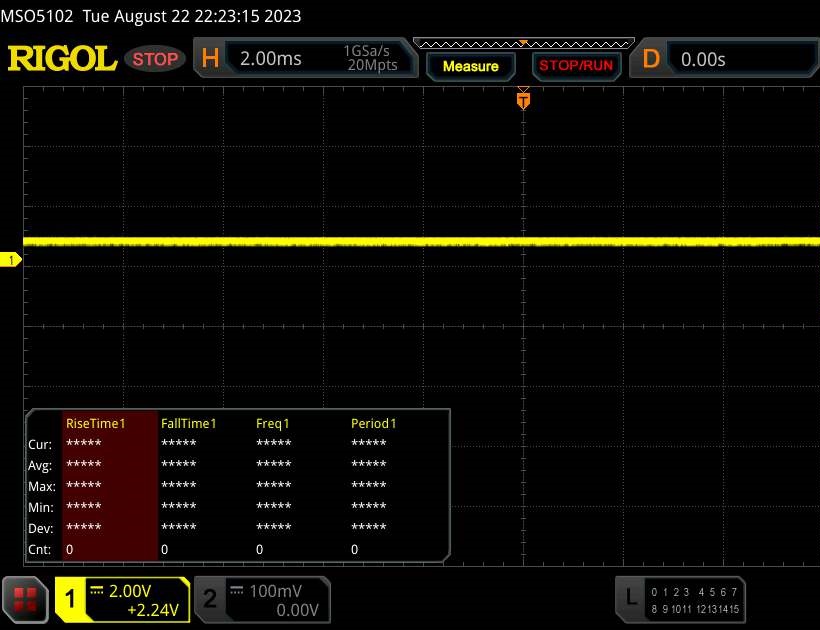 | ||
In comparison: 53 % of all tested devices do not use PWM to dim the display. If PWM was detected, an average of 17844 (minimum: 5 - maximum: 3846000) Hz was measured. | |||
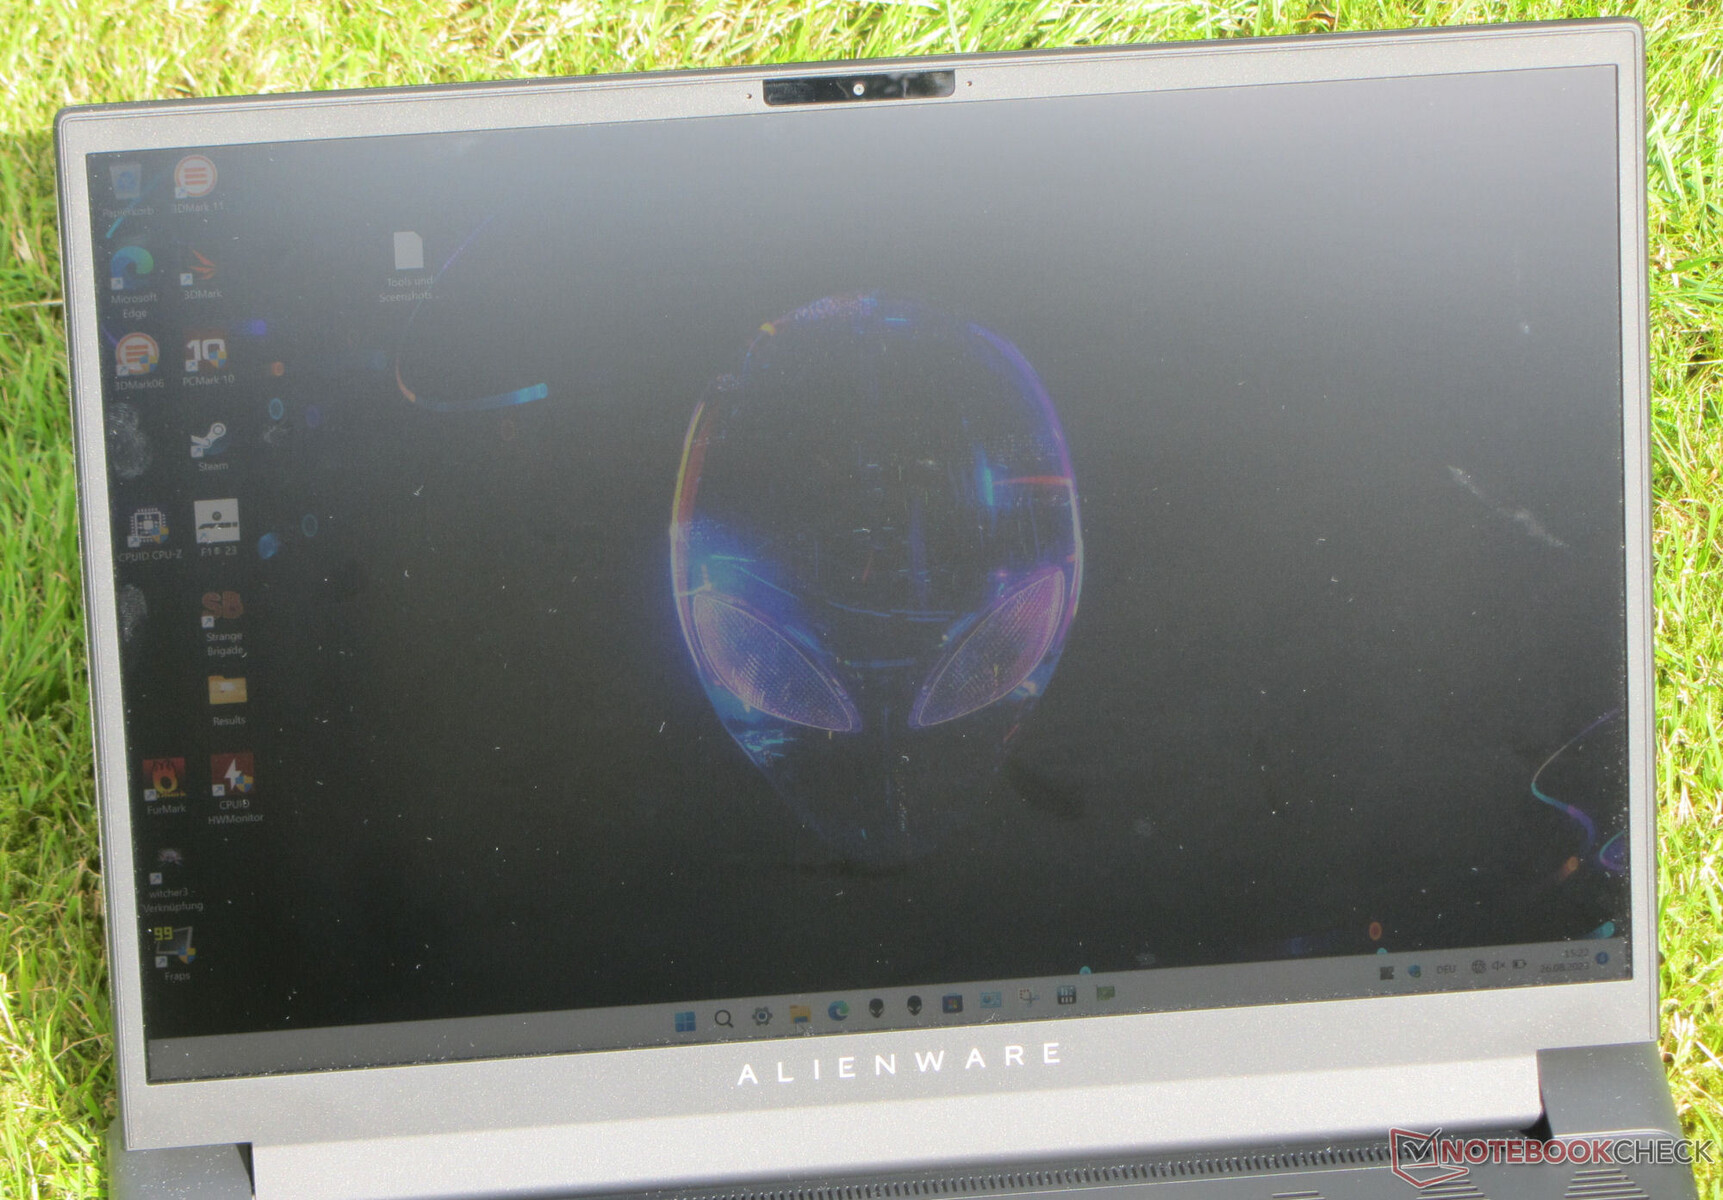
The viewing-angle stable IPS panel can be read from any position. Outdoors, reading the screen is quite possible as long as the sun is not shining too brightly.

Performance - The Alienware notebook offers high system performance
Within the Alienware m16 R1 lineup, Ada Lovelace GPUs (RTX 4060, 4070, 4080) are combined with CPUs from Intel or AMD. There are two exceptions: certain AMD models can only be ordered with a Radeon RX 7600M XT and certain Intel models with a GeForce RTX 4090. Our Intel-based m16 device is available for around EUR 1,900, currently making it one of the cheapest representatives of the series.
Testing Conditions
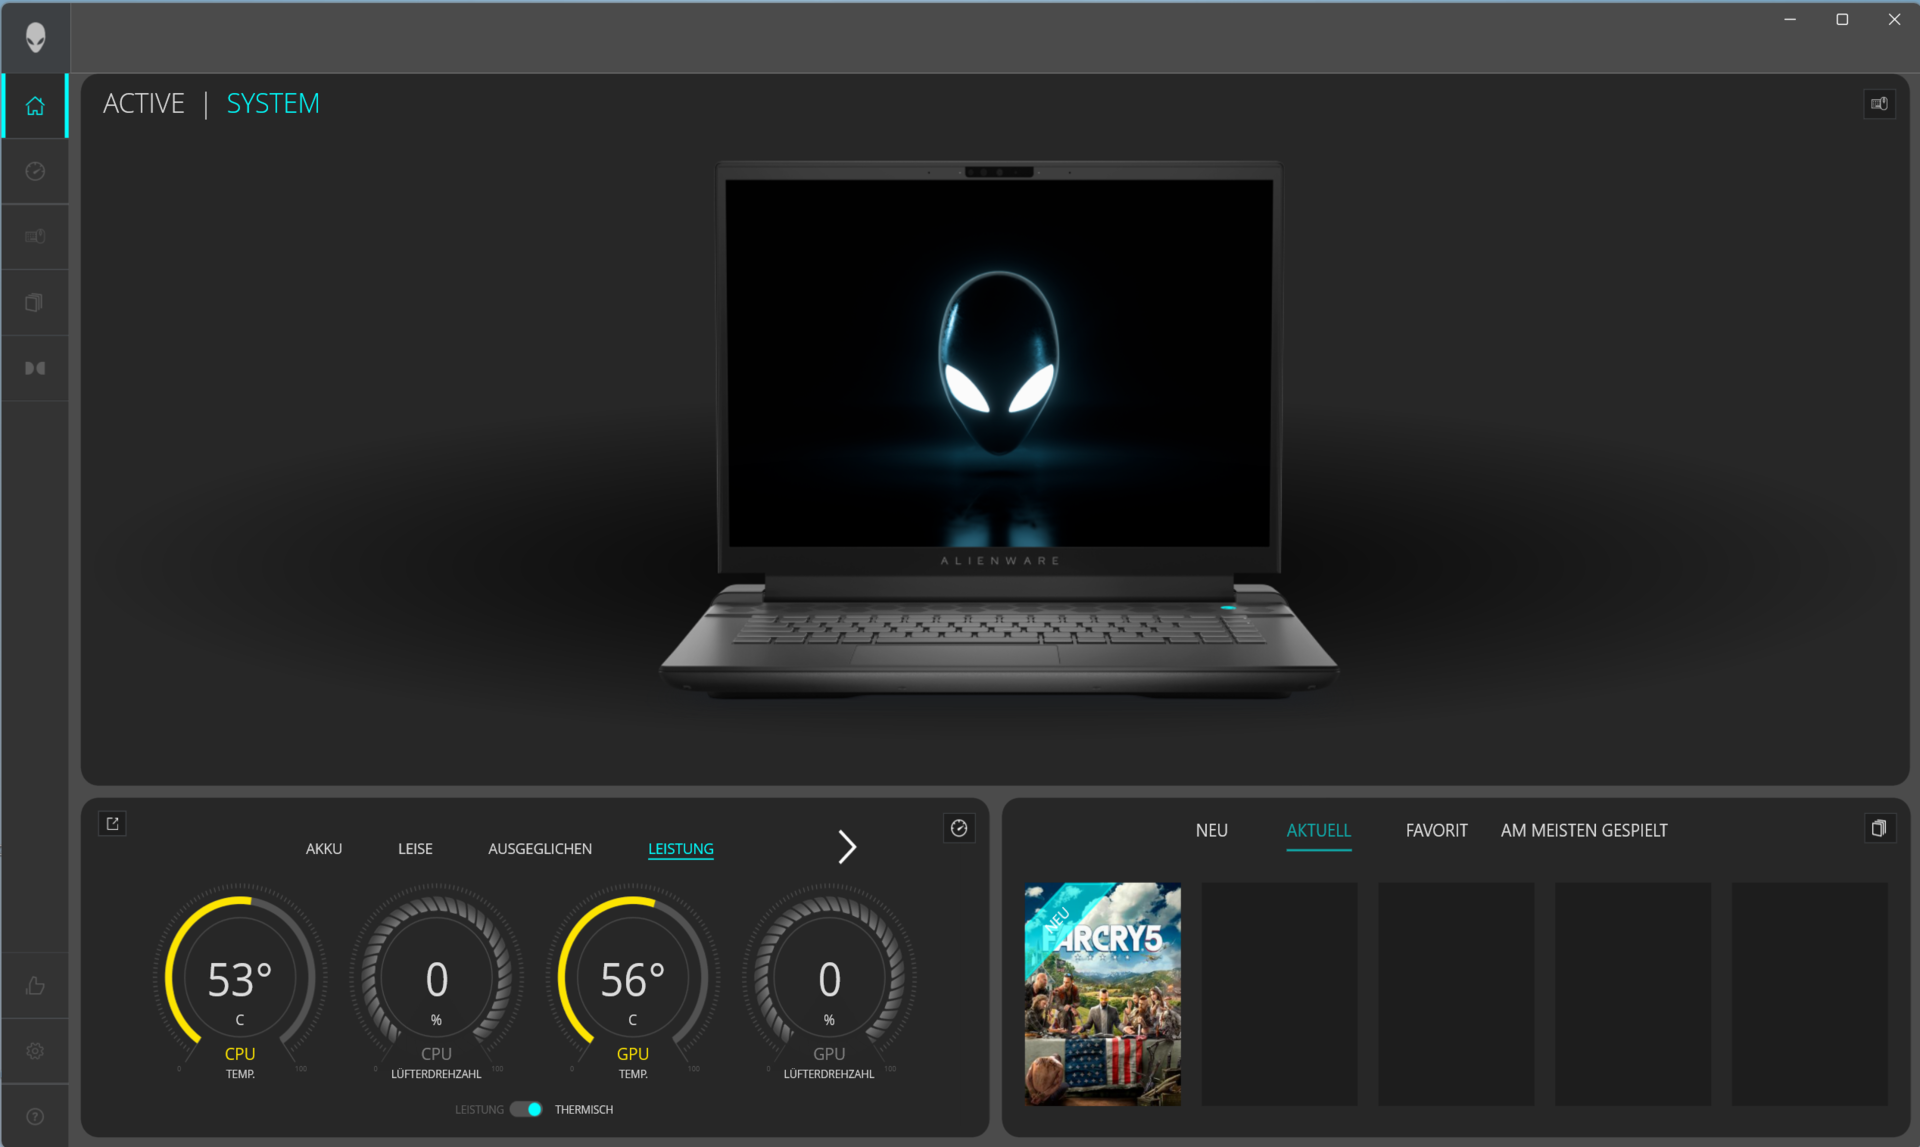
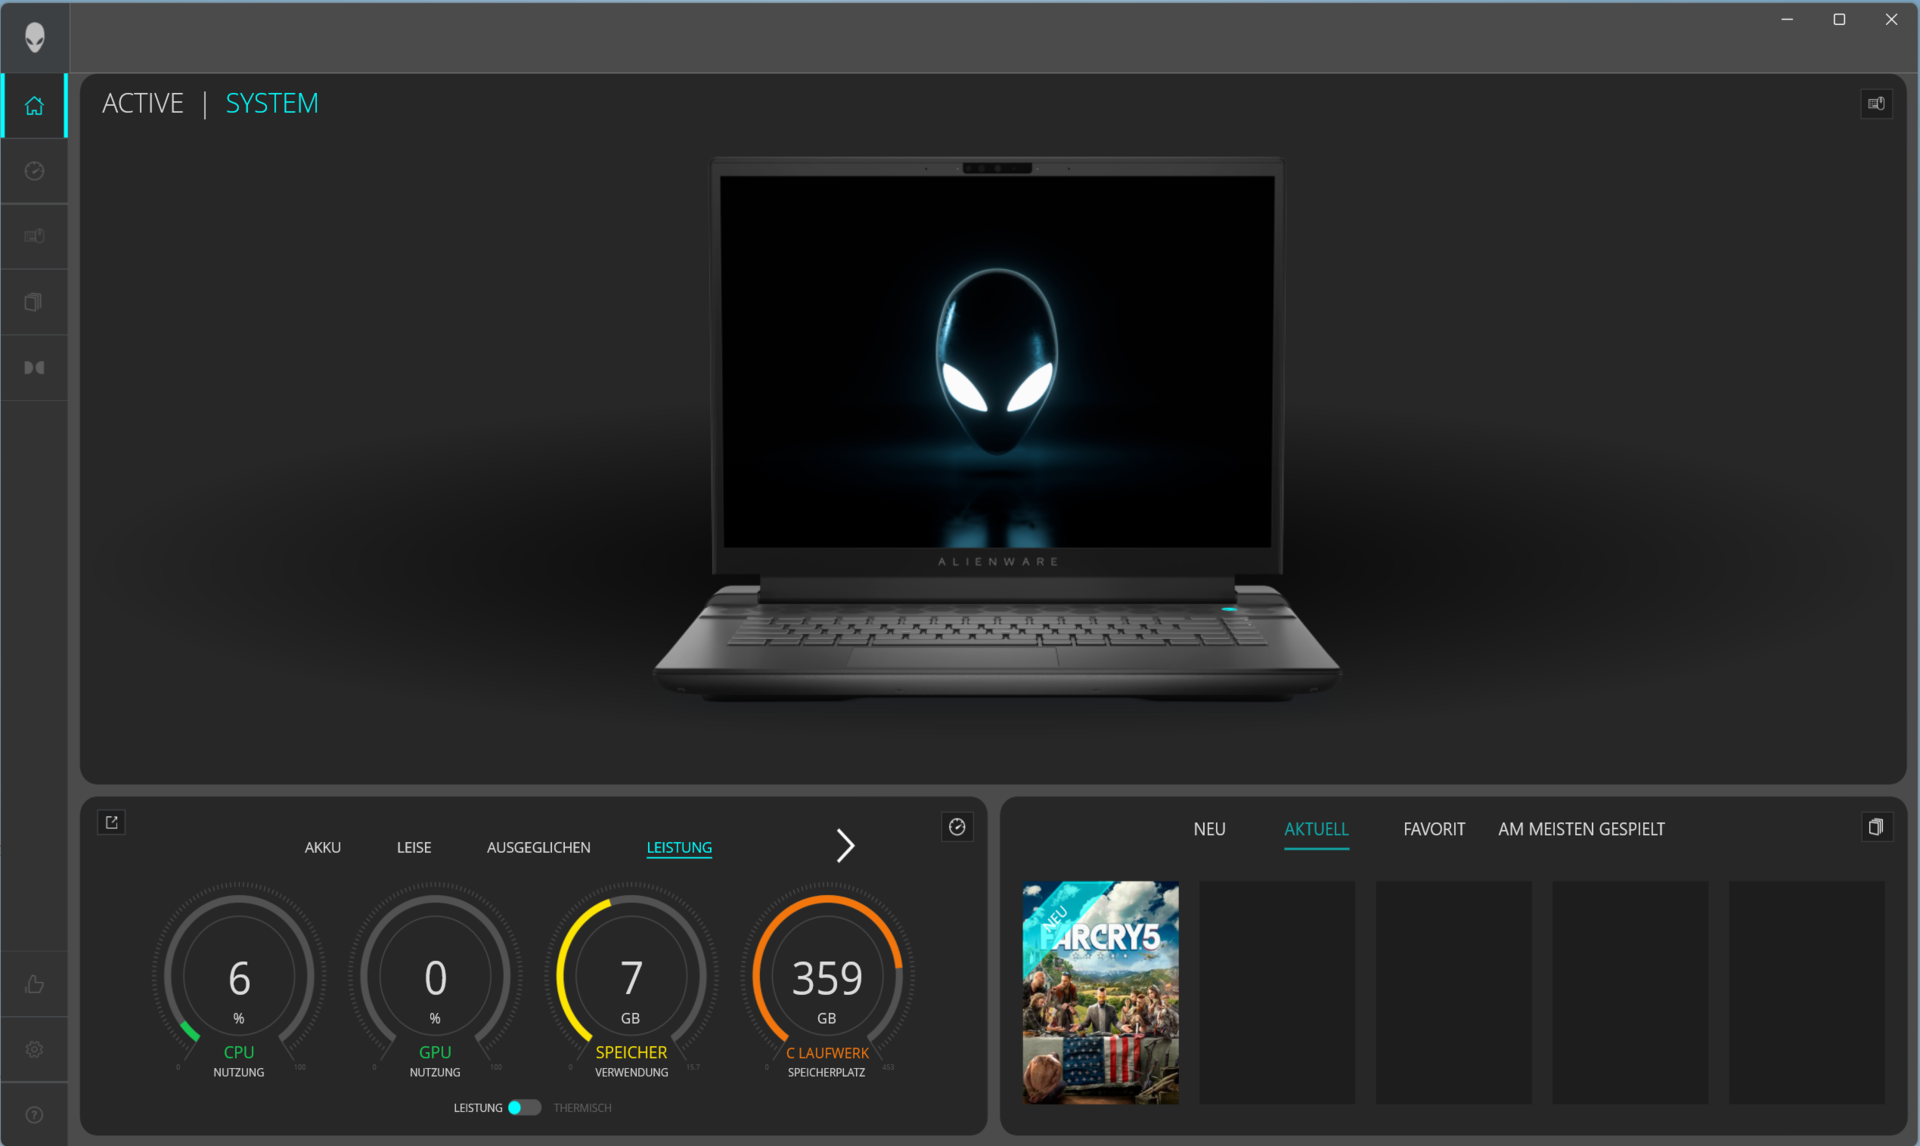
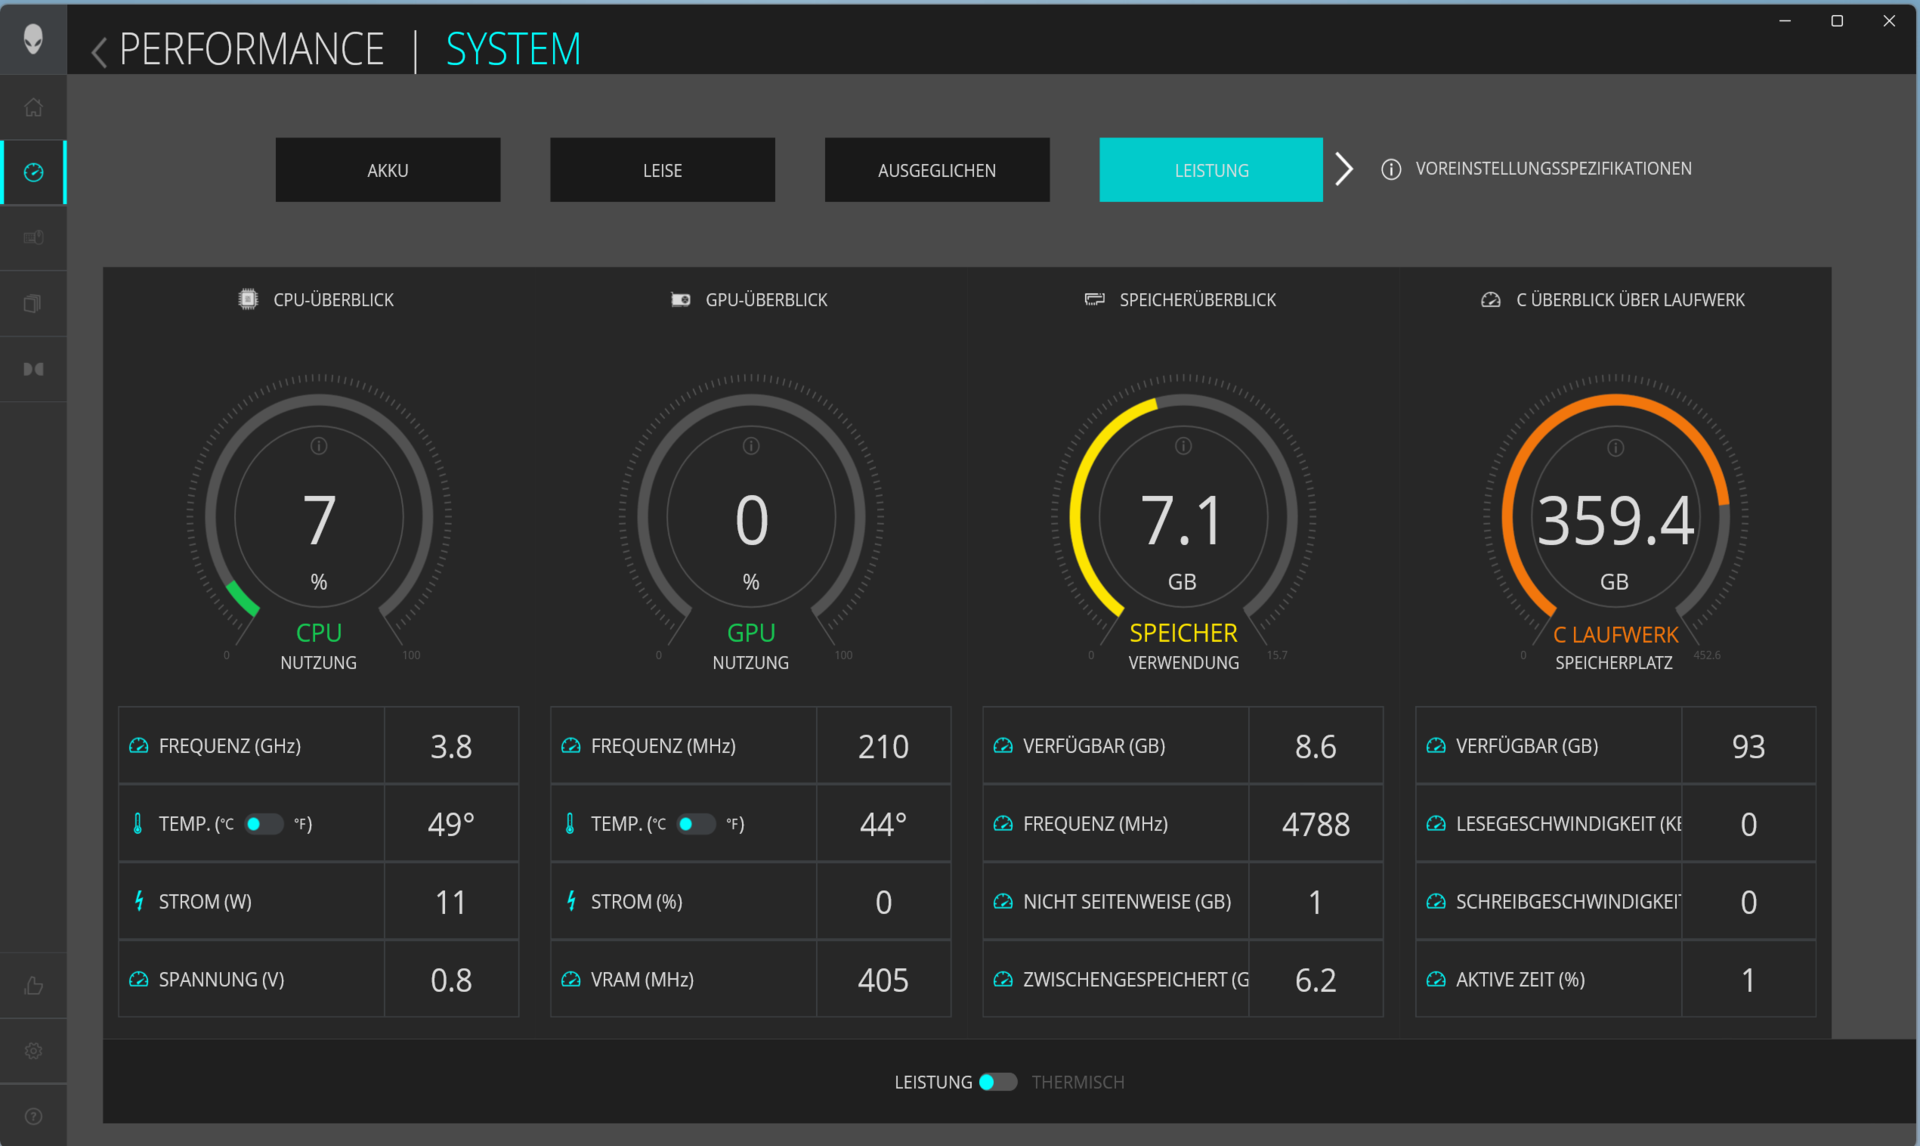
Users can switch between five manufacturer-specific performance modes via the Alienware Command Center (laptop control center). A high-performance mode (maximum performance, fully firing fans) can be activated via the "F1" key. In our tests, the modes "Performance" (benchmarks) and "Balanced" (battery tests) were used.
Note: The sister model was tested with the "Overdrive" profile and the dGPU mode active. Thus, the benchmark results are not always directly comparable.
| Performance | Overdrive | Balanced | Silent | Battery | |
|---|---|---|---|---|---|
| Power Limit 1 (HWInfo) | 157 watts | 165 watts | 157 watts | 50 watts | 55 watts |
| Power Limit 2 (HWInfo) | 157 watts | 165 watts | 157 watts | 157 watts | 157 watts |
| Performance (Witcher 3) | 104fps | 104fps | 103fps | 102fps | 103fps |
| Noise (Witcher 3) | 51dB(A) | 58dB(A) | 49dB(A) | 43dB(A) | 47dB(A) |

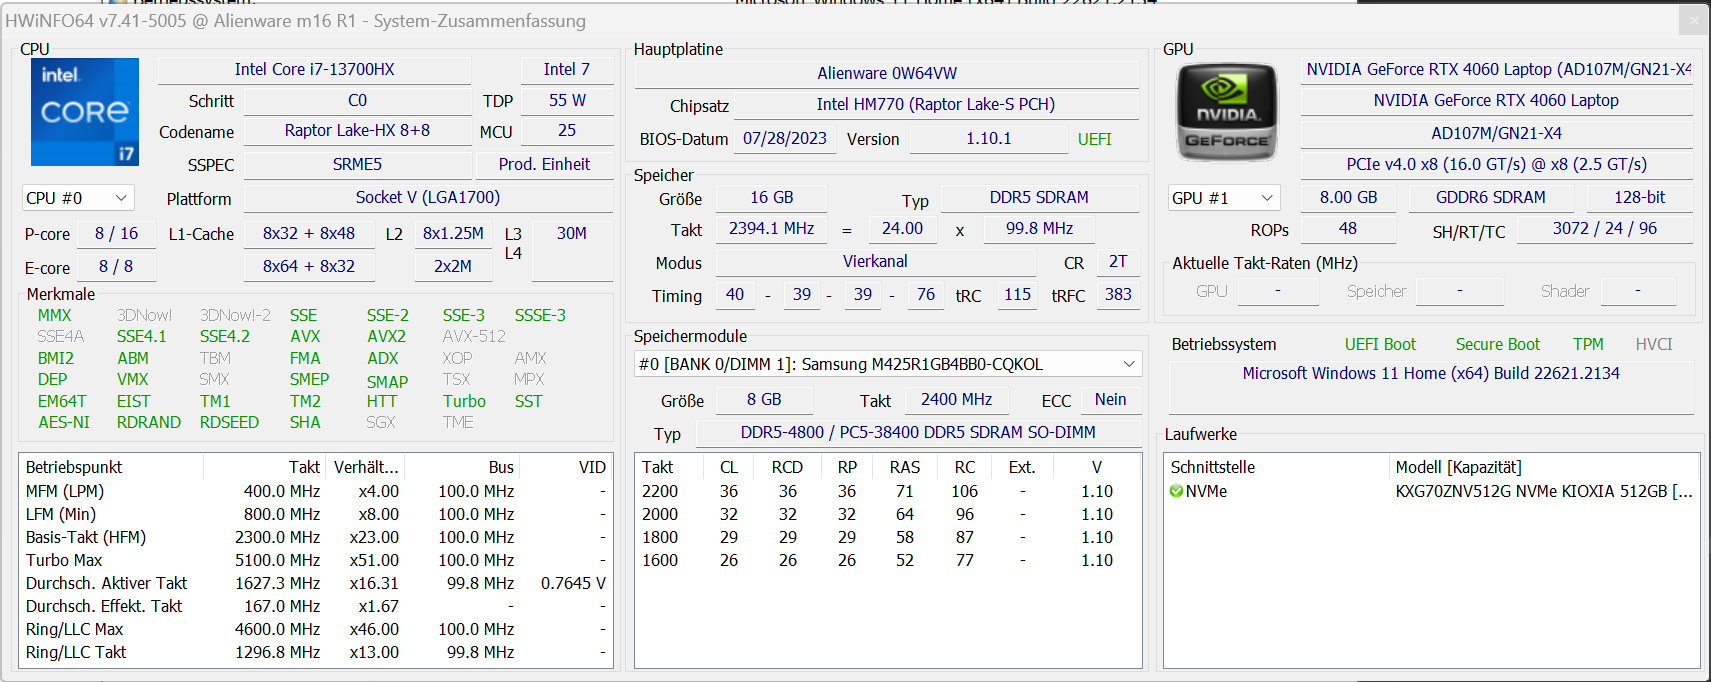
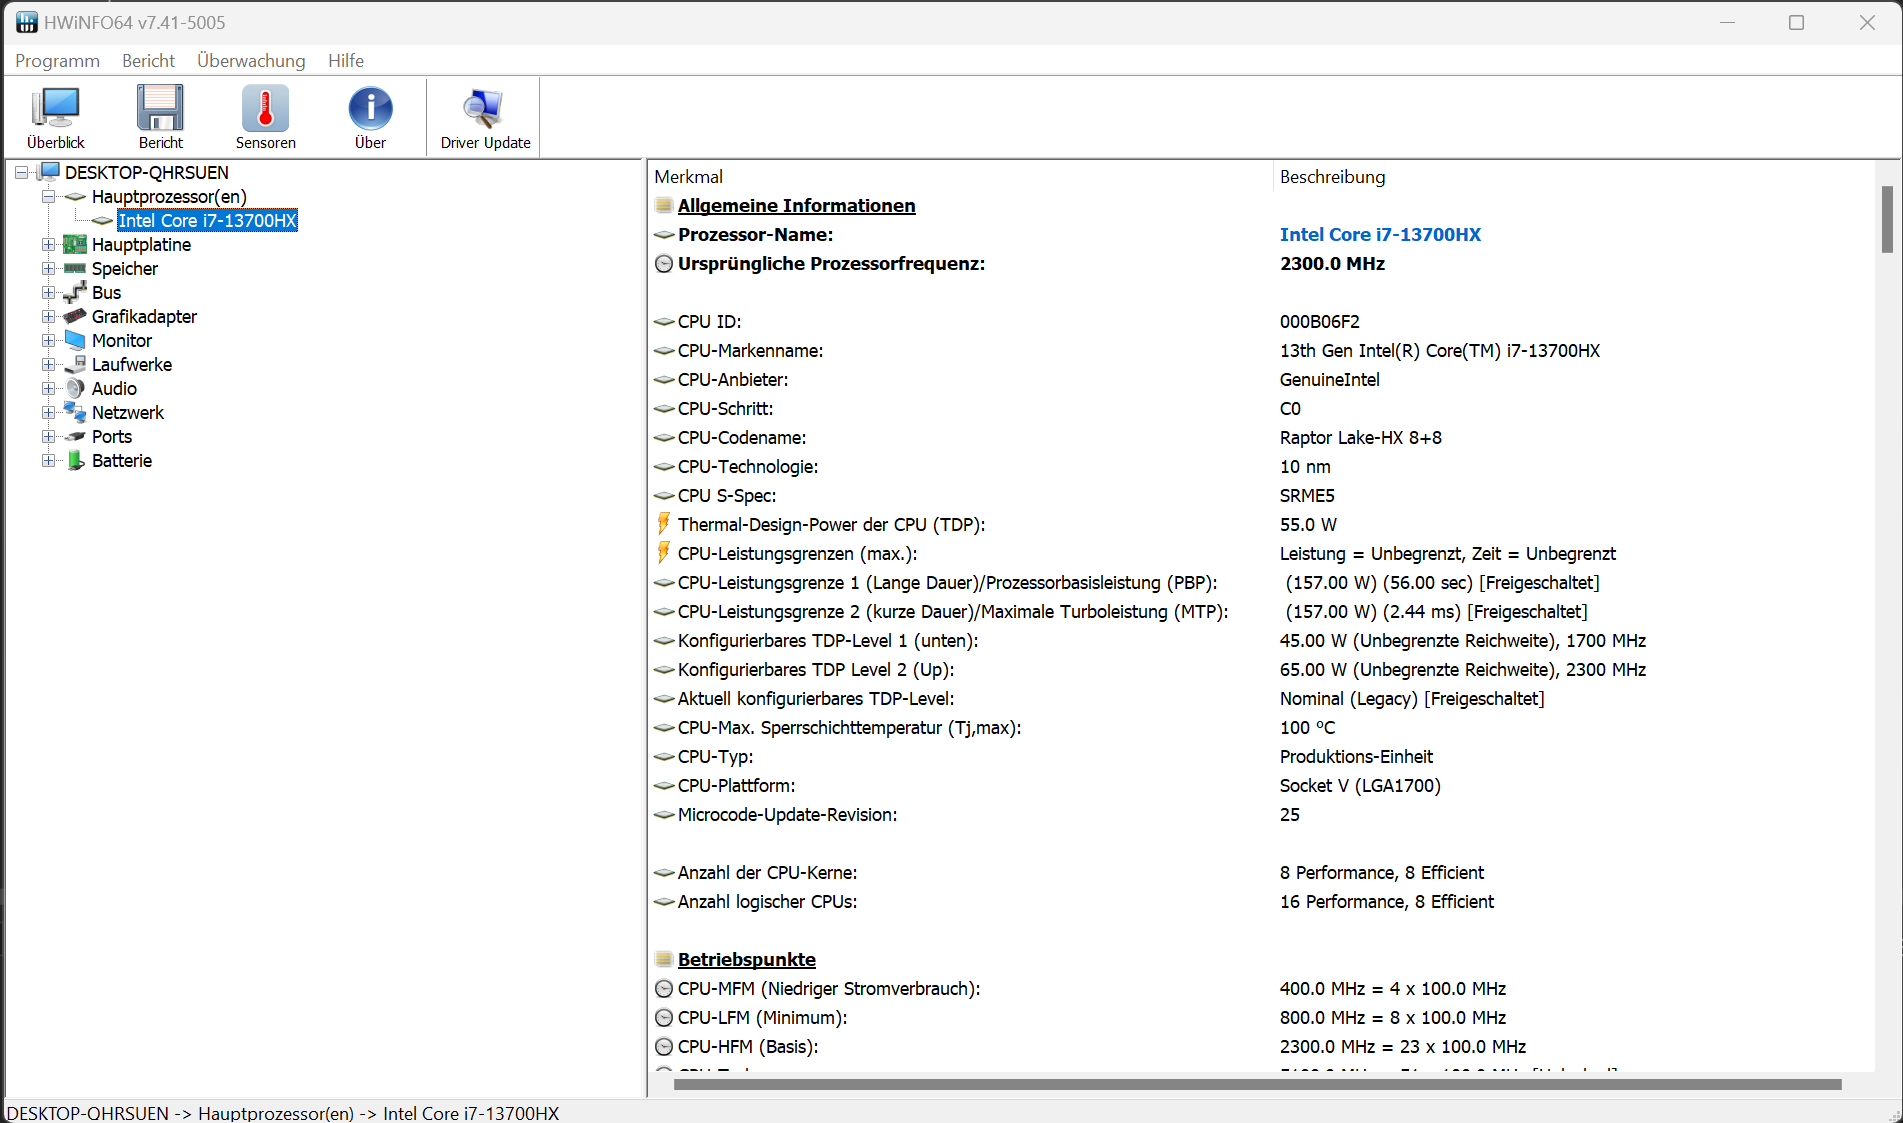
Processor
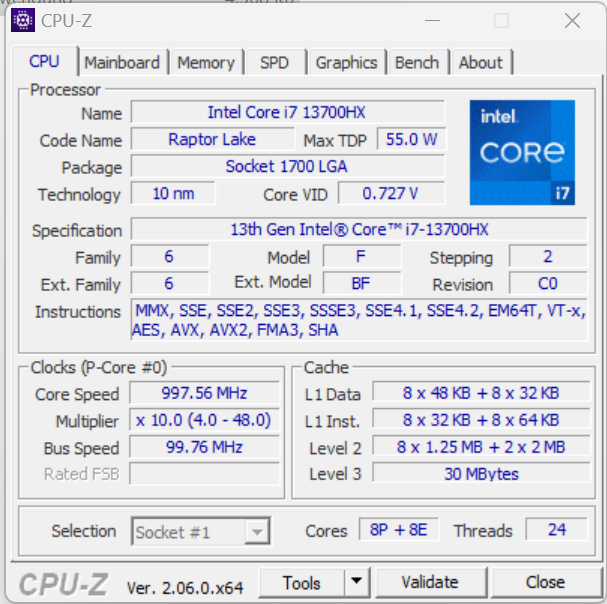
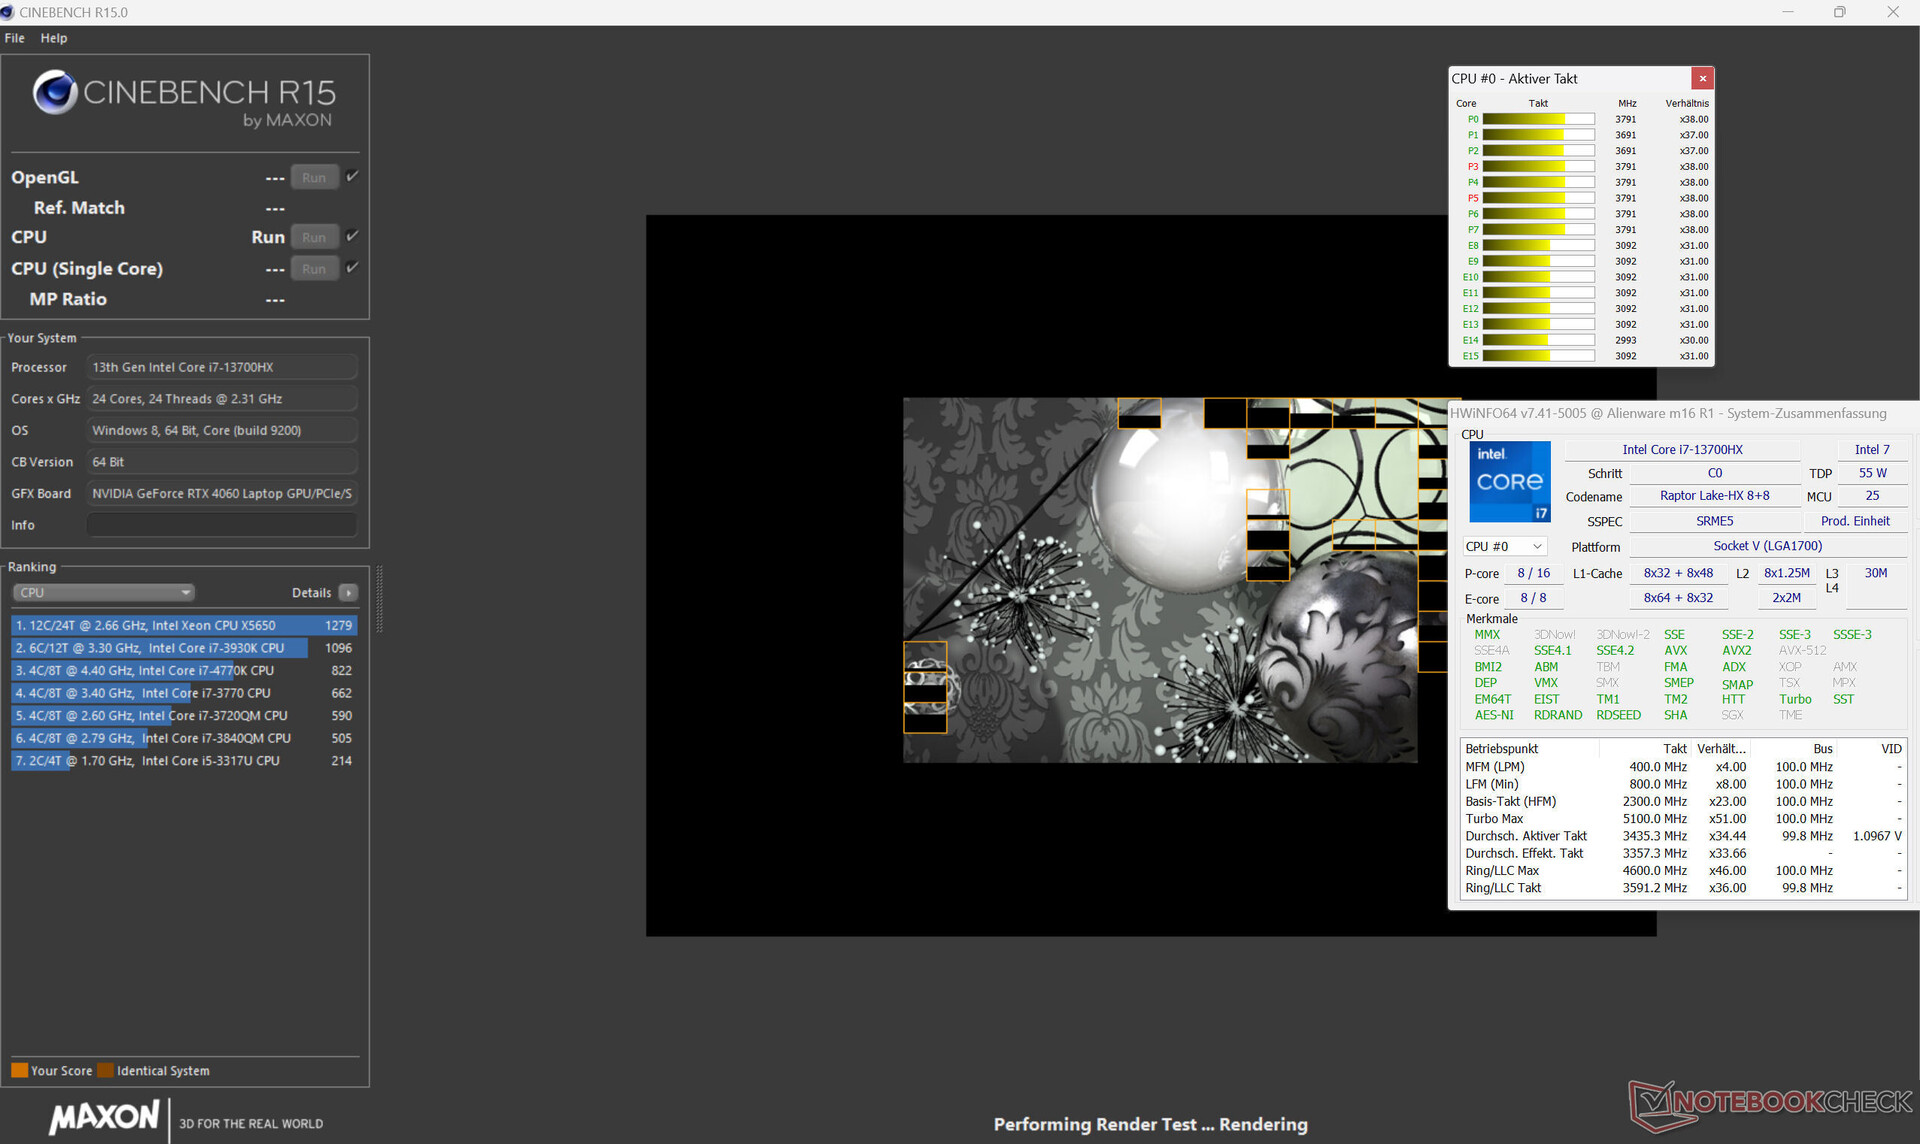
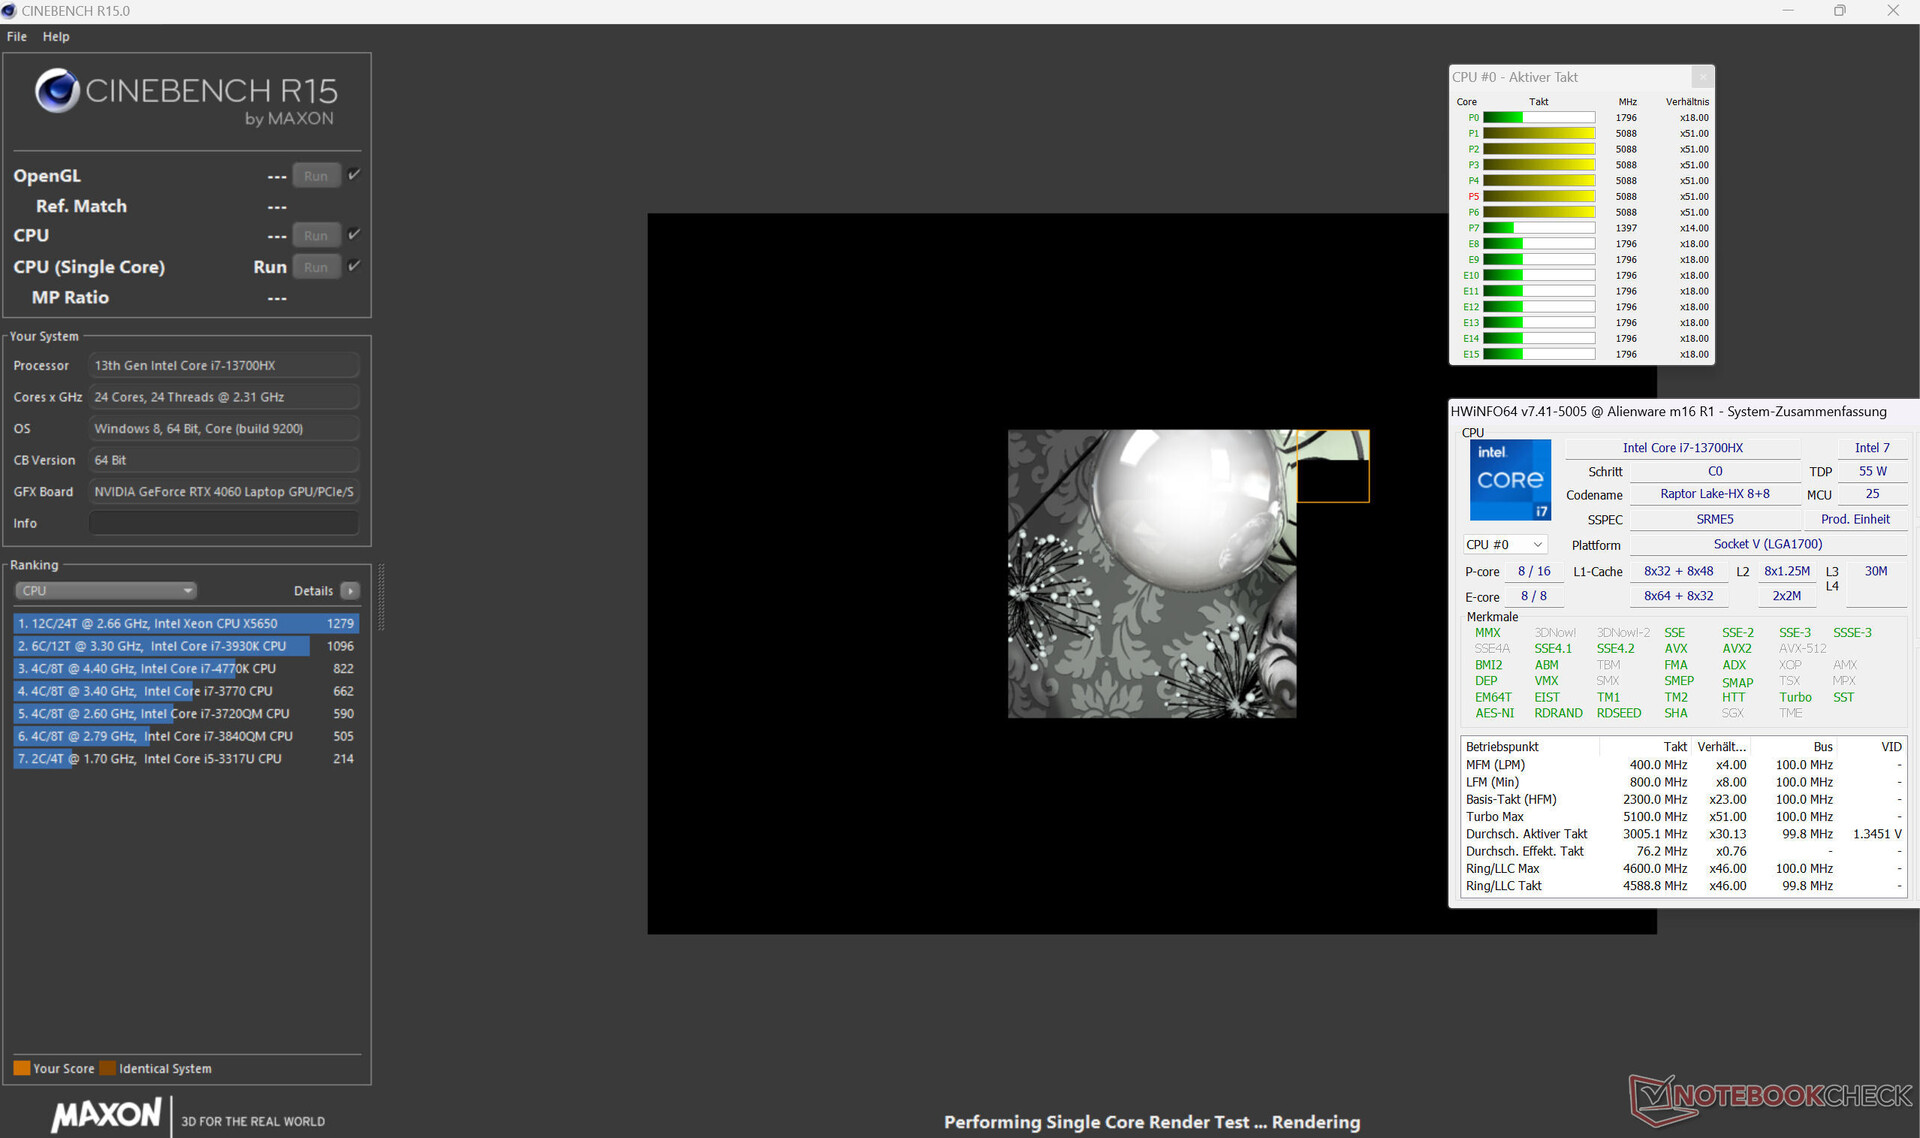
The Core-i7-13700HX processor (Raptor Lake) consists of eight efficiency cores (no hyperthreading, 1.5 to 3.7 GHz) and eight performance cores (hyperthreading, 2.1 to 5 GHz). In total there are 24 logical CPU cores.
The benchmark results are above the CPU average in mains operation. In battery mode, the more relevant single-thread performance (160 points) drops in a similar fashion to multi-thread performance (2,134 points).
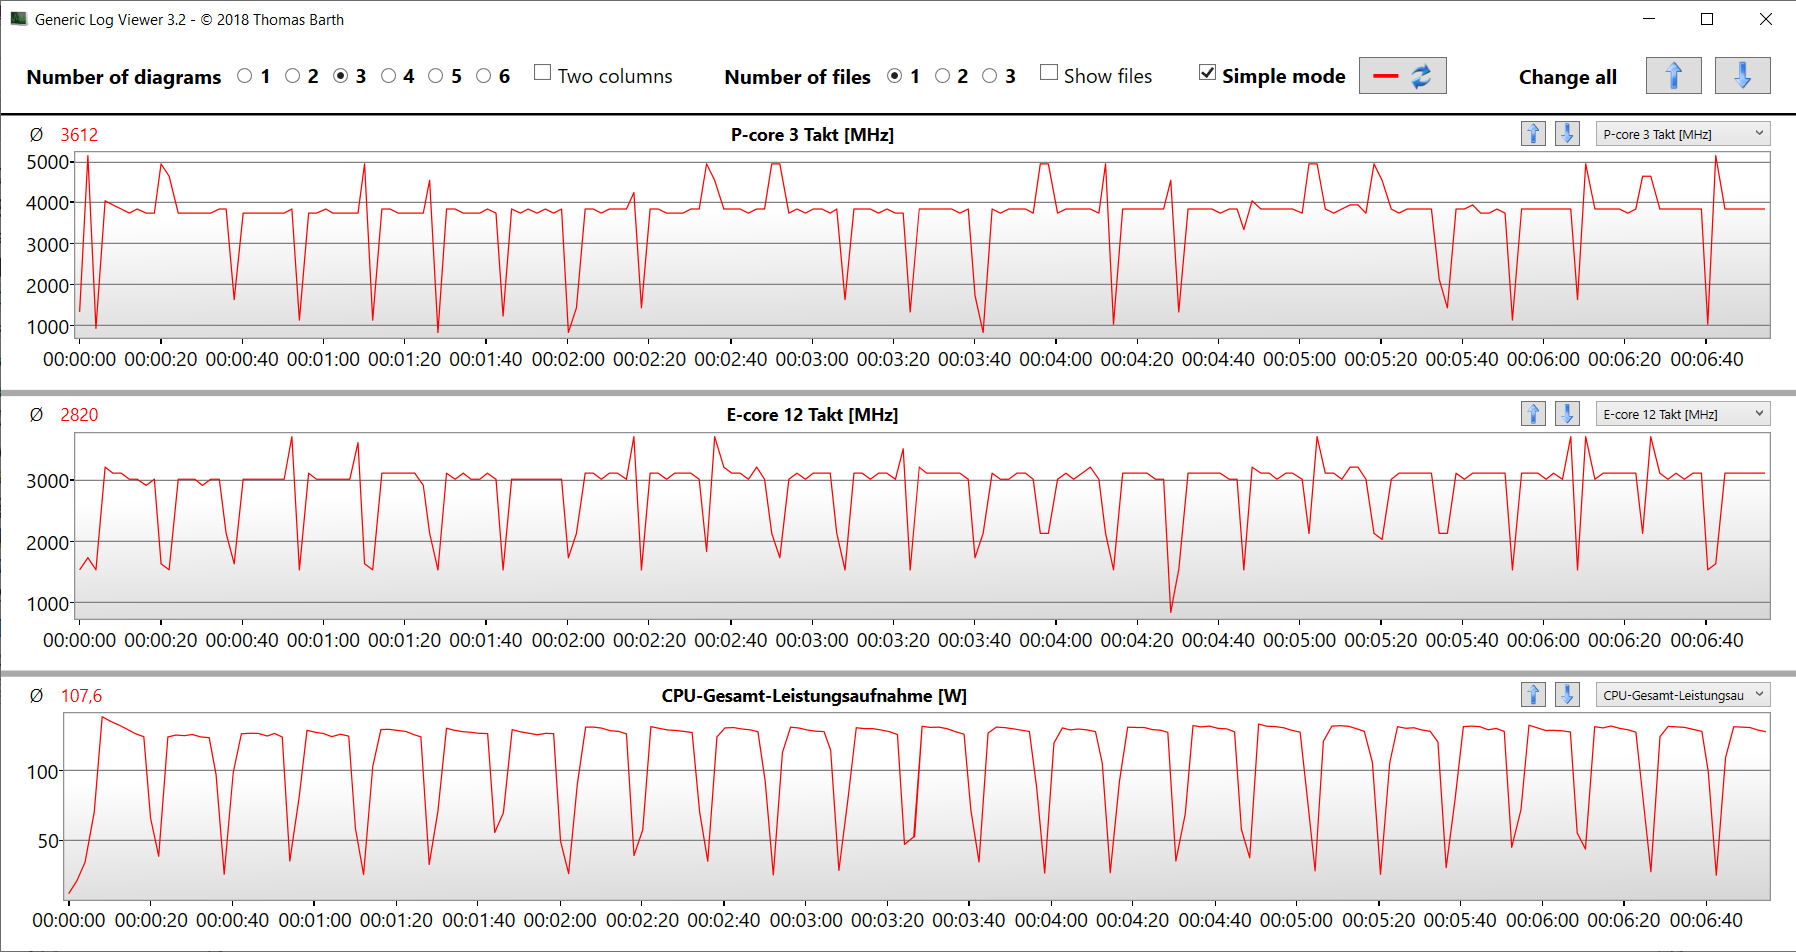
The CB15 loop test confirms that CPU turbo can be permanently sustained. However, the clock rate drops slightly after the first run, regardless of the profile used. "Overdrive" ensures the highest overall level of performance.
Cinebench R15 Multi Sustained Load
* ... smaller is better
AIDA64: FP32 Ray-Trace | FPU Julia | CPU SHA3 | CPU Queen | FPU SinJulia | FPU Mandel | CPU AES | CPU ZLib | FP64 Ray-Trace | CPU PhotoWorxx
| Performance Rating | |
| Alienware m16 R1 AMD | |
| Alienware m16 R1 Intel | |
| Acer Predator Helios 16 PH16-71-731Q | |
| SCHENKER XMG Pro 15 (E23) | |
| Lenovo Legion Pro 5 16IRX8 | |
| Average Intel Core i7-13700HX | |
| Average of class Gaming | |
| Medion Erazer Defender P40 | |
| Aorus 15 BSF | |
| AIDA64 / FP32 Ray-Trace | |
| Alienware m16 R1 AMD | |
| Lenovo Legion Pro 5 16IRX8 | |
| Alienware m16 R1 Intel | |
| Acer Predator Helios 16 PH16-71-731Q | |
| Average Intel Core i7-13700HX (15397 - 21999, n=10) | |
| Average of class Gaming (3069 - 60169, n=220, last 2 years) | |
| SCHENKER XMG Pro 15 (E23) | |
| Medion Erazer Defender P40 | |
| Aorus 15 BSF | |
| AIDA64 / FPU Julia | |
| Alienware m16 R1 AMD | |
| Lenovo Legion Pro 5 16IRX8 | |
| Alienware m16 R1 Intel | |
| Acer Predator Helios 16 PH16-71-731Q | |
| Average Intel Core i7-13700HX (77807 - 109364, n=10) | |
| SCHENKER XMG Pro 15 (E23) | |
| Average of class Gaming (18567 - 252486, n=220, last 2 years) | |
| Medion Erazer Defender P40 | |
| Aorus 15 BSF | |
| AIDA64 / CPU SHA3 | |
| Alienware m16 R1 AMD | |
| Alienware m16 R1 Intel | |
| SCHENKER XMG Pro 15 (E23) | |
| Lenovo Legion Pro 5 16IRX8 | |
| Average Intel Core i7-13700HX (3412 - 5053, n=10) | |
| Acer Predator Helios 16 PH16-71-731Q | |
| Average of class Gaming (629 - 10389, n=220, last 2 years) | |
| Medion Erazer Defender P40 | |
| Aorus 15 BSF | |
| AIDA64 / CPU Queen | |
| Alienware m16 R1 AMD | |
| SCHENKER XMG Pro 15 (E23) | |
| Alienware m16 R1 Intel | |
| Acer Predator Helios 16 PH16-71-731Q | |
| Lenovo Legion Pro 5 16IRX8 | |
| Medion Erazer Defender P40 | |
| Average Intel Core i7-13700HX (105112 - 114717, n=10) | |
| Average of class Gaming (15371 - 200651, n=220, last 2 years) | |
| Aorus 15 BSF | |
| AIDA64 / FPU SinJulia | |
| Alienware m16 R1 AMD | |
| Alienware m16 R1 Intel | |
| Lenovo Legion Pro 5 16IRX8 | |
| Acer Predator Helios 16 PH16-71-731Q | |
| SCHENKER XMG Pro 15 (E23) | |
| Average Intel Core i7-13700HX (10407 - 13519, n=10) | |
| Average of class Gaming (2137 - 32988, n=220, last 2 years) | |
| Medion Erazer Defender P40 | |
| Aorus 15 BSF | |
| AIDA64 / FPU Mandel | |
| Alienware m16 R1 AMD | |
| Lenovo Legion Pro 5 16IRX8 | |
| Alienware m16 R1 Intel | |
| Acer Predator Helios 16 PH16-71-731Q | |
| Average of class Gaming (10291 - 134044, n=220, last 2 years) | |
| Average Intel Core i7-13700HX (38311 - 53484, n=10) | |
| SCHENKER XMG Pro 15 (E23) | |
| Medion Erazer Defender P40 | |
| Aorus 15 BSF | |
| AIDA64 / CPU AES | |
| Alienware m16 R1 Intel | |
| Acer Predator Helios 16 PH16-71-731Q | |
| Average Intel Core i7-13700HX (72510 - 182575, n=10) | |
| Aorus 15 BSF | |
| Alienware m16 R1 AMD | |
| Average of class Gaming (19065 - 328679, n=220, last 2 years) | |
| Lenovo Legion Pro 5 16IRX8 | |
| SCHENKER XMG Pro 15 (E23) | |
| Medion Erazer Defender P40 | |
| AIDA64 / CPU ZLib | |
| Alienware m16 R1 AMD | |
| Acer Predator Helios 16 PH16-71-731Q | |
| SCHENKER XMG Pro 15 (E23) | |
| Alienware m16 R1 Intel | |
| Lenovo Legion Pro 5 16IRX8 | |
| Average Intel Core i7-13700HX (981 - 1451, n=10) | |
| Average of class Gaming (150.9 - 2409, n=220, last 2 years) | |
| Medion Erazer Defender P40 | |
| Aorus 15 BSF | |
| AIDA64 / FP64 Ray-Trace | |
| Alienware m16 R1 AMD | |
| Lenovo Legion Pro 5 16IRX8 | |
| Alienware m16 R1 Intel | |
| Acer Predator Helios 16 PH16-71-731Q | |
| Average Intel Core i7-13700HX (8145 - 11837, n=10) | |
| Average of class Gaming (1518 - 31796, n=220, last 2 years) | |
| SCHENKER XMG Pro 15 (E23) | |
| Medion Erazer Defender P40 | |
| Aorus 15 BSF | |
| AIDA64 / CPU PhotoWorxx | |
| SCHENKER XMG Pro 15 (E23) | |
| Aorus 15 BSF | |
| Average of class Gaming (10805 - 60161, n=221, last 2 years) | |
| Lenovo Legion Pro 5 16IRX8 | |
| Medion Erazer Defender P40 | |
| Average Intel Core i7-13700HX (20471 - 42415, n=10) | |
| Alienware m16 R1 Intel | |
| Acer Predator Helios 16 PH16-71-731Q | |
| Alienware m16 R1 AMD | |
System Performance
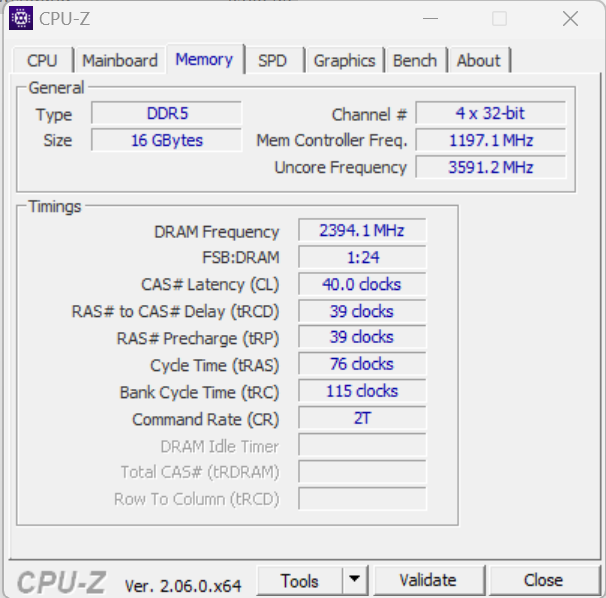
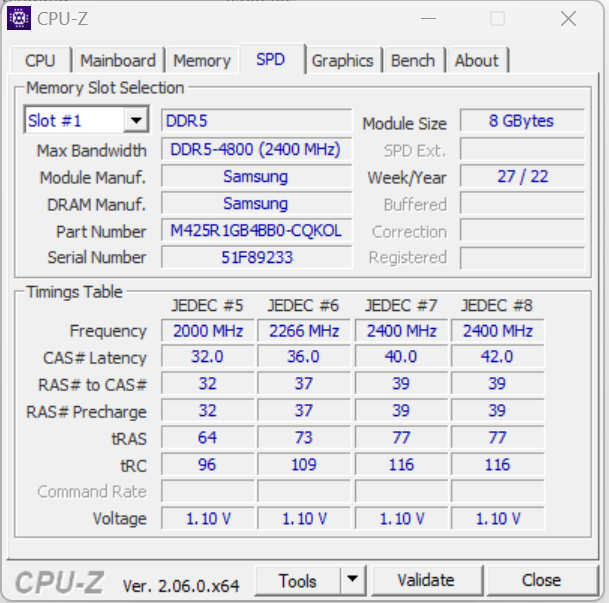
The smoothly running system shows no lack of computing power. The laptop handles rendering, video editing and gaming without issue. The RAM's transfer rates are on a normal level for DDR5-4800 memory.
CrossMark: Overall | Productivity | Creativity | Responsiveness
| PCMark 10 / Score | |
| Alienware m16 R1 AMD | |
| Acer Predator Helios 16 PH16-71-731Q | |
| Lenovo Legion Pro 5 16IRX8 | |
| Average of class Gaming (5235 - 9852, n=195, last 2 years) | |
| SCHENKER XMG Pro 15 (E23) | |
| Average Intel Core i7-13700HX, NVIDIA GeForce RTX 4060 Laptop GPU (6909 - 7743, n=5) | |
| Aorus 15 BSF | |
| Alienware m16 R1 Intel | |
| Medion Erazer Defender P40 | |
| PCMark 10 / Essentials | |
| Alienware m16 R1 AMD | |
| SCHENKER XMG Pro 15 (E23) | |
| Acer Predator Helios 16 PH16-71-731Q | |
| Lenovo Legion Pro 5 16IRX8 | |
| Aorus 15 BSF | |
| Alienware m16 R1 Intel | |
| Average of class Gaming (8300 - 12334, n=194, last 2 years) | |
| Average Intel Core i7-13700HX, NVIDIA GeForce RTX 4060 Laptop GPU (9760 - 11313, n=5) | |
| Medion Erazer Defender P40 | |
| PCMark 10 / Productivity | |
| Acer Predator Helios 16 PH16-71-731Q | |
| SCHENKER XMG Pro 15 (E23) | |
| Alienware m16 R1 AMD | |
| Medion Erazer Defender P40 | |
| Average Intel Core i7-13700HX, NVIDIA GeForce RTX 4060 Laptop GPU (9131 - 11018, n=5) | |
| Average of class Gaming (6662 - 11833, n=194, last 2 years) | |
| Alienware m16 R1 Intel | |
| Lenovo Legion Pro 5 16IRX8 | |
| Aorus 15 BSF | |
| PCMark 10 / Digital Content Creation | |
| Alienware m16 R1 AMD | |
| Lenovo Legion Pro 5 16IRX8 | |
| Average of class Gaming (6462 - 18475, n=194, last 2 years) | |
| Average Intel Core i7-13700HX, NVIDIA GeForce RTX 4060 Laptop GPU (9393 - 12434, n=5) | |
| Aorus 15 BSF | |
| Acer Predator Helios 16 PH16-71-731Q | |
| Alienware m16 R1 Intel | |
| SCHENKER XMG Pro 15 (E23) | |
| Medion Erazer Defender P40 | |
| CrossMark / Overall | |
| Acer Predator Helios 16 PH16-71-731Q | |
| Aorus 15 BSF | |
| Alienware m16 R1 Intel | |
| Alienware m16 R1 AMD | |
| SCHENKER XMG Pro 15 (E23) | |
| Average of class Gaming (1247 - 2334, n=167, last 2 years) | |
| Average Intel Core i7-13700HX, NVIDIA GeForce RTX 4060 Laptop GPU (1663 - 2105, n=5) | |
| Medion Erazer Defender P40 | |
| Lenovo Legion Pro 5 16IRX8 | |
| CrossMark / Productivity | |
| Aorus 15 BSF | |
| Acer Predator Helios 16 PH16-71-731Q | |
| Alienware m16 R1 Intel | |
| Alienware m16 R1 AMD | |
| SCHENKER XMG Pro 15 (E23) | |
| Average of class Gaming (1299 - 2204, n=167, last 2 years) | |
| Average Intel Core i7-13700HX, NVIDIA GeForce RTX 4060 Laptop GPU (1618 - 1989, n=5) | |
| Medion Erazer Defender P40 | |
| Lenovo Legion Pro 5 16IRX8 | |
| CrossMark / Creativity | |
| Acer Predator Helios 16 PH16-71-731Q | |
| Alienware m16 R1 Intel | |
| SCHENKER XMG Pro 15 (E23) | |
| Alienware m16 R1 AMD | |
| Aorus 15 BSF | |
| Average of class Gaming (1275 - 2514, n=167, last 2 years) | |
| Average Intel Core i7-13700HX, NVIDIA GeForce RTX 4060 Laptop GPU (1710 - 2274, n=5) | |
| Medion Erazer Defender P40 | |
| Lenovo Legion Pro 5 16IRX8 | |
| CrossMark / Responsiveness | |
| Aorus 15 BSF | |
| Acer Predator Helios 16 PH16-71-731Q | |
| Alienware m16 R1 Intel | |
| SCHENKER XMG Pro 15 (E23) | |
| Alienware m16 R1 AMD | |
| Average of class Gaming (1030 - 2330, n=167, last 2 years) | |
| Average Intel Core i7-13700HX, NVIDIA GeForce RTX 4060 Laptop GPU (1269 - 1983, n=5) | |
| Lenovo Legion Pro 5 16IRX8 | |
| Medion Erazer Defender P40 | |
| PCMark 10 Score | 7224 points | |
Help | ||
| AIDA64 / Memory Copy | |
| SCHENKER XMG Pro 15 (E23) | |
| Aorus 15 BSF | |
| Average of class Gaming (21842 - 92565, n=220, last 2 years) | |
| Lenovo Legion Pro 5 16IRX8 | |
| Medion Erazer Defender P40 | |
| Alienware m16 R1 Intel | |
| Average Intel Core i7-13700HX (36504 - 63990, n=10) | |
| Acer Predator Helios 16 PH16-71-731Q | |
| Alienware m16 R1 AMD | |
| AIDA64 / Memory Read | |
| SCHENKER XMG Pro 15 (E23) | |
| Aorus 15 BSF | |
| Lenovo Legion Pro 5 16IRX8 | |
| Medion Erazer Defender P40 | |
| Alienware m16 R1 Intel | |
| Acer Predator Helios 16 PH16-71-731Q | |
| Average of class Gaming (24879 - 90647, n=220, last 2 years) | |
| Average Intel Core i7-13700HX (36510 - 69729, n=10) | |
| Alienware m16 R1 AMD | |
| AIDA64 / Memory Write | |
| Aorus 15 BSF | |
| Acer Predator Helios 16 PH16-71-731Q | |
| SCHENKER XMG Pro 15 (E23) | |
| Lenovo Legion Pro 5 16IRX8 | |
| Average of class Gaming (21619 - 103259, n=220, last 2 years) | |
| Average Intel Core i7-13700HX (33598 - 85675, n=10) | |
| Alienware m16 R1 Intel | |
| Medion Erazer Defender P40 | |
| Alienware m16 R1 AMD | |
| AIDA64 / Memory Latency | |
| Medion Erazer Defender P40 | |
| Aorus 15 BSF | |
| Alienware m16 R1 AMD | |
| Alienware m16 R1 Intel | |
| Average Intel Core i7-13700HX (81.9 - 97.9, n=10) | |
| Average of class Gaming (59.5 - 152.5, n=217, last 2 years) | |
| Acer Predator Helios 16 PH16-71-731Q | |
| SCHENKER XMG Pro 15 (E23) | |
| Lenovo Legion Pro 5 16IRX8 | |
* ... smaller is better
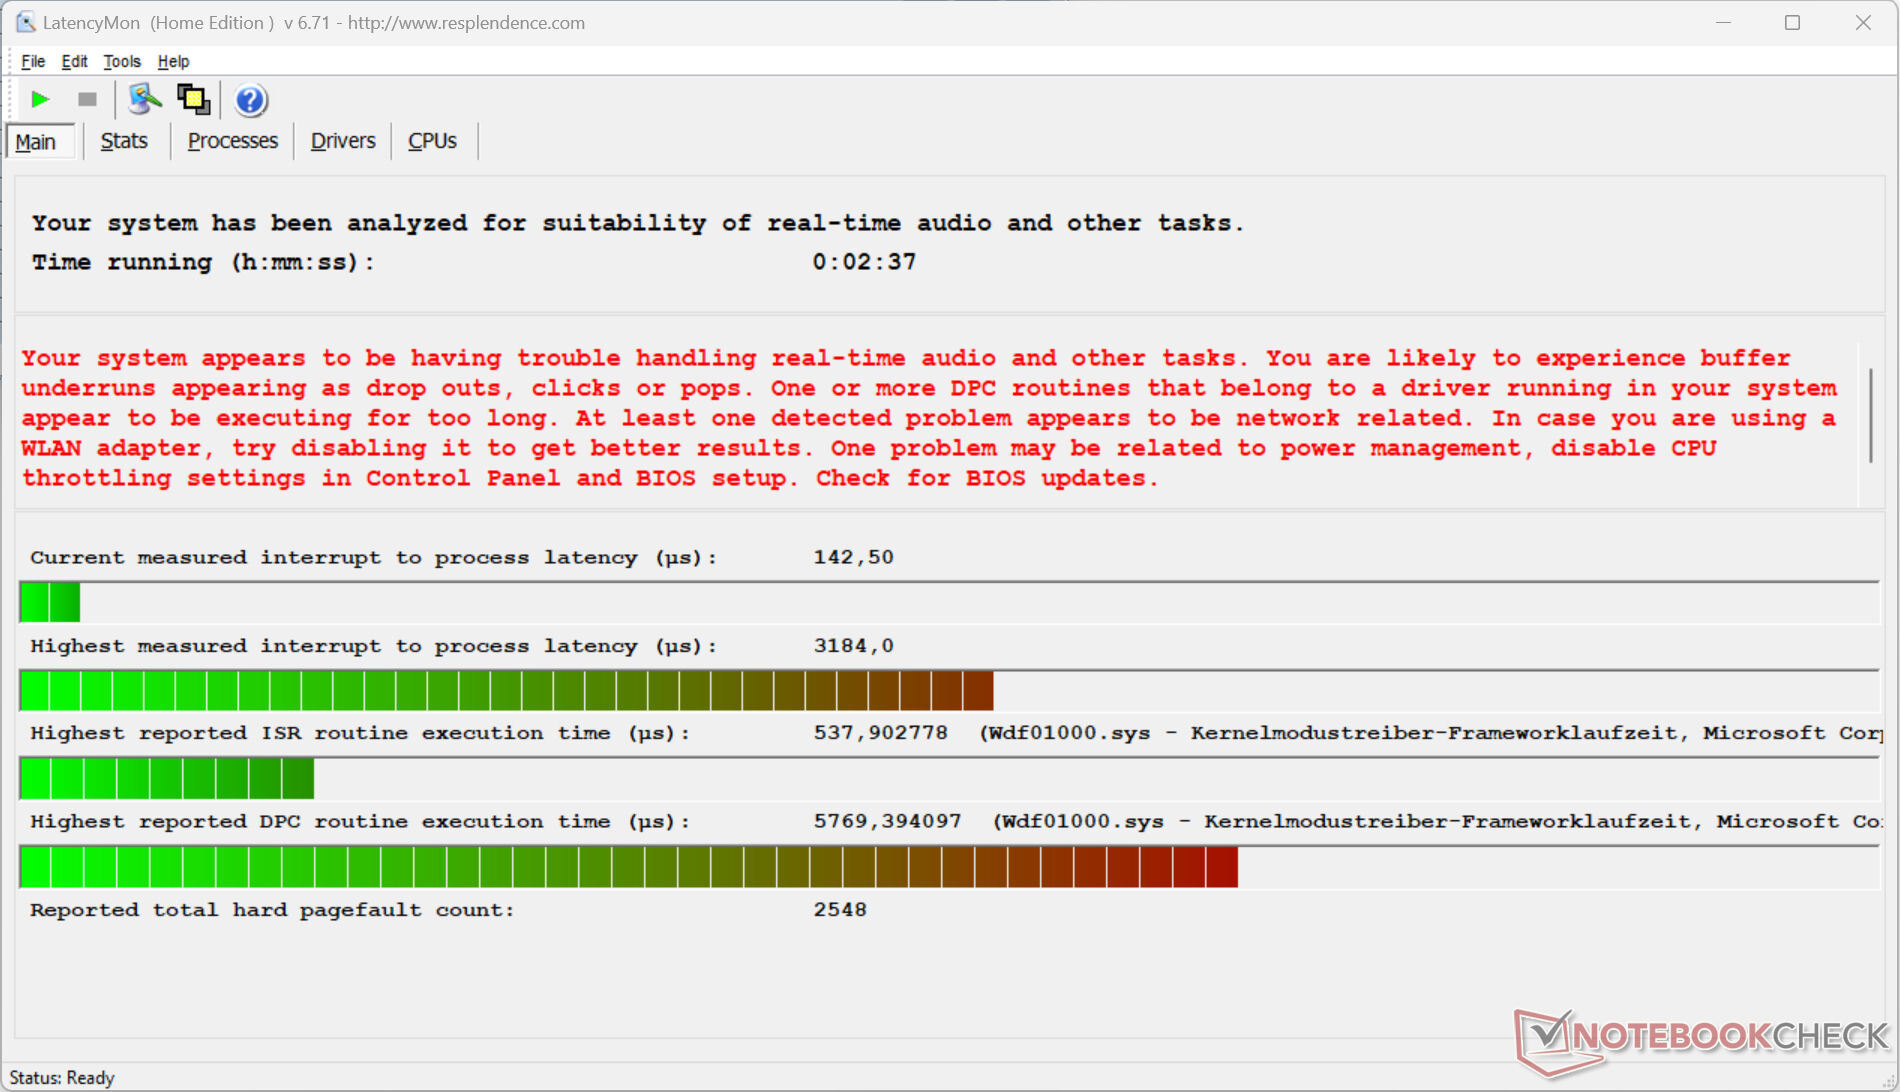
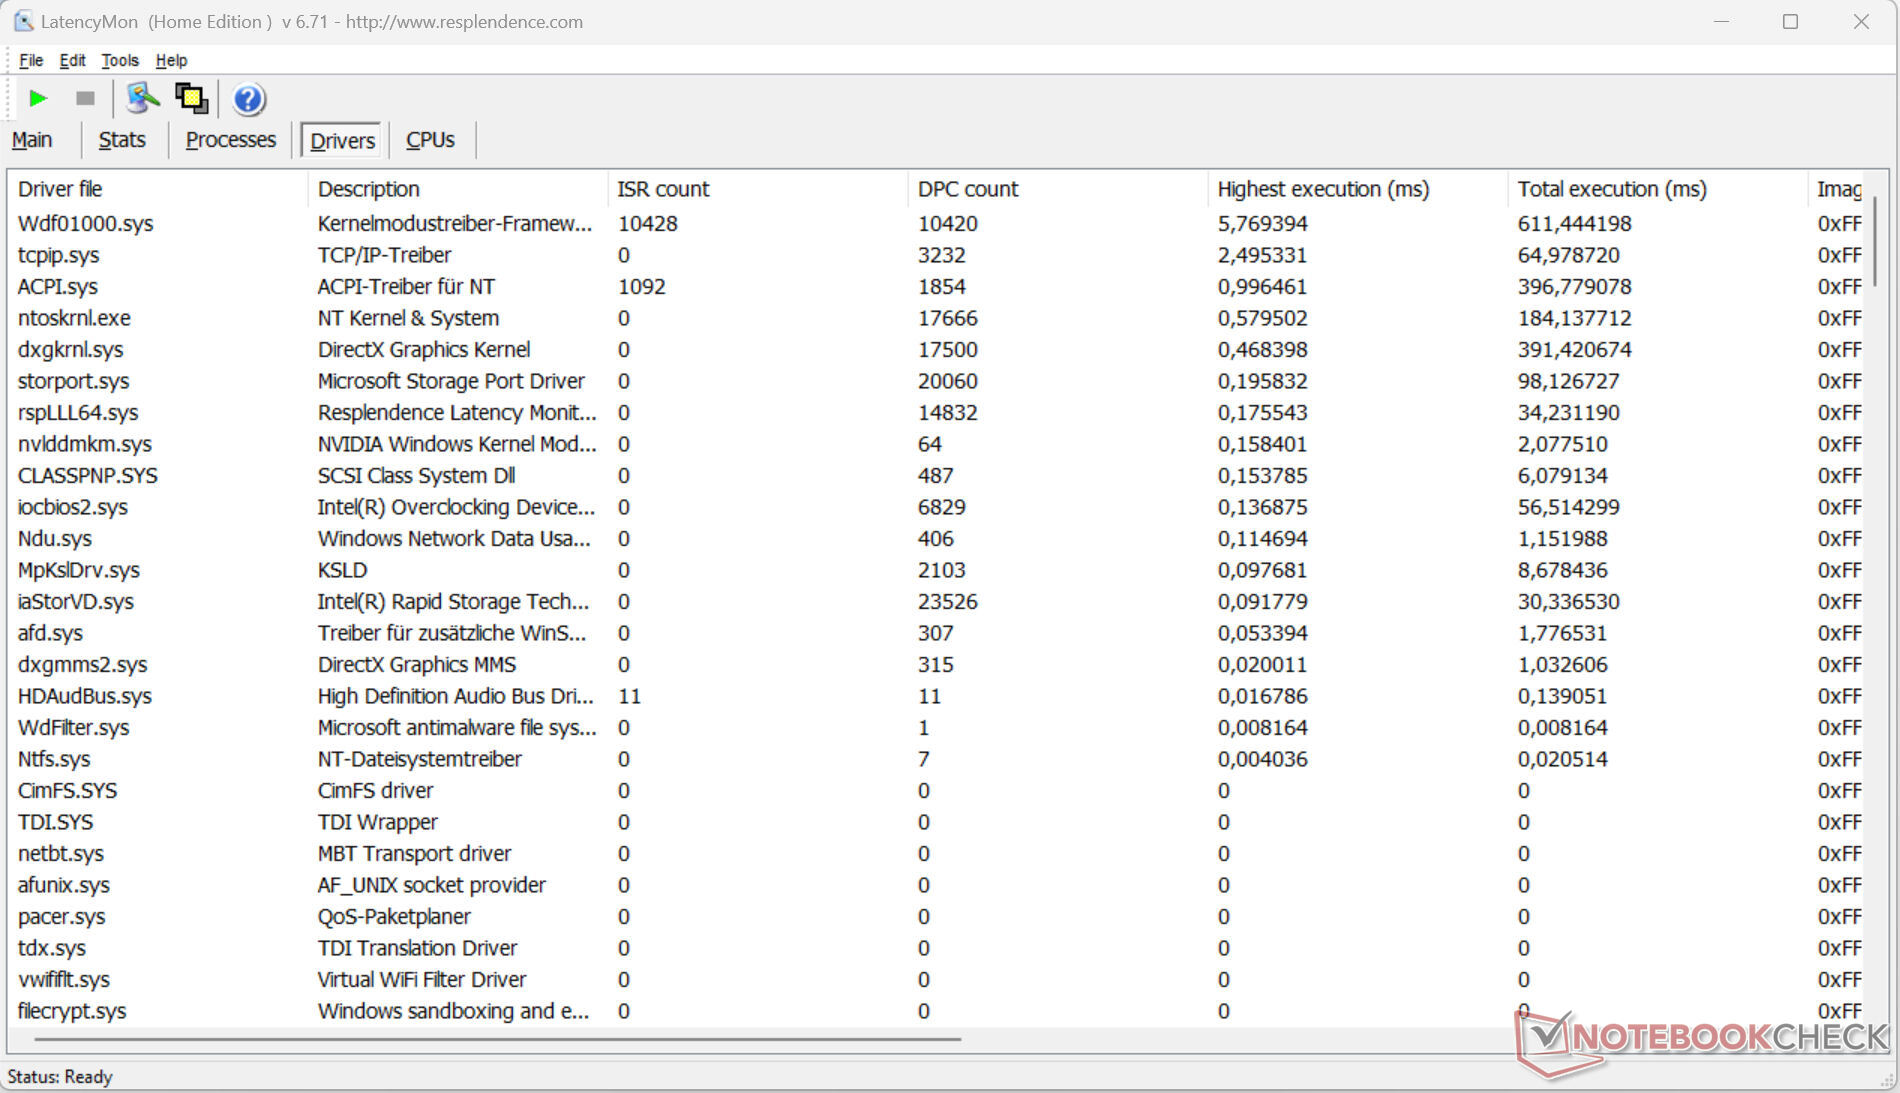
DPC Latency
The standardized latency monitor test (web surfing, 4k video playback, Prime95 high load) revealed anomalies. The system does not appear suitable for real-time video and audio editing. Future software updates may result in improvement or further degradation.
| DPC Latencies / LatencyMon - interrupt to process latency (max), Web, Youtube, Prime95 | |
| Medion Erazer Defender P40 | |
| Alienware m16 R1 Intel | |
| Alienware m16 R1 AMD | |
| Aorus 15 BSF | |
| Acer Predator Helios 16 PH16-71-731Q | |
| SCHENKER XMG Pro 15 (E23) | |
| Lenovo Legion Pro 5 16IRX8 | |
* ... smaller is better
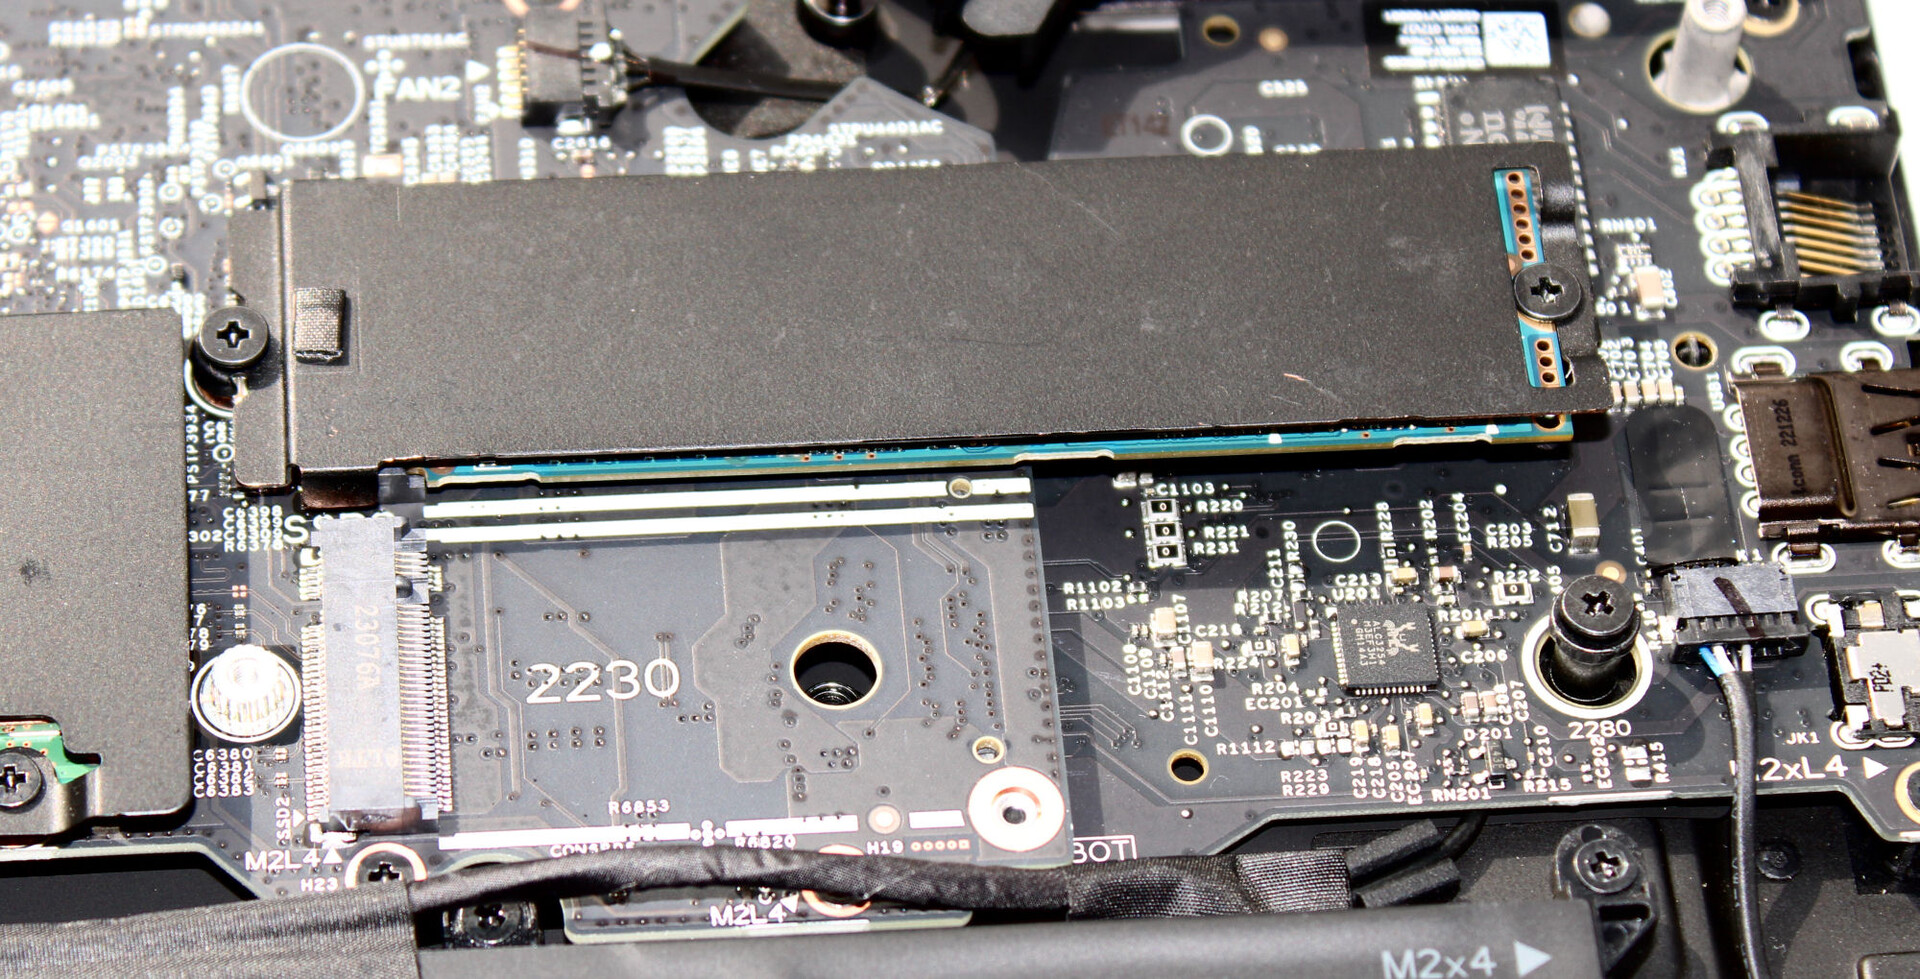
Storage Devices
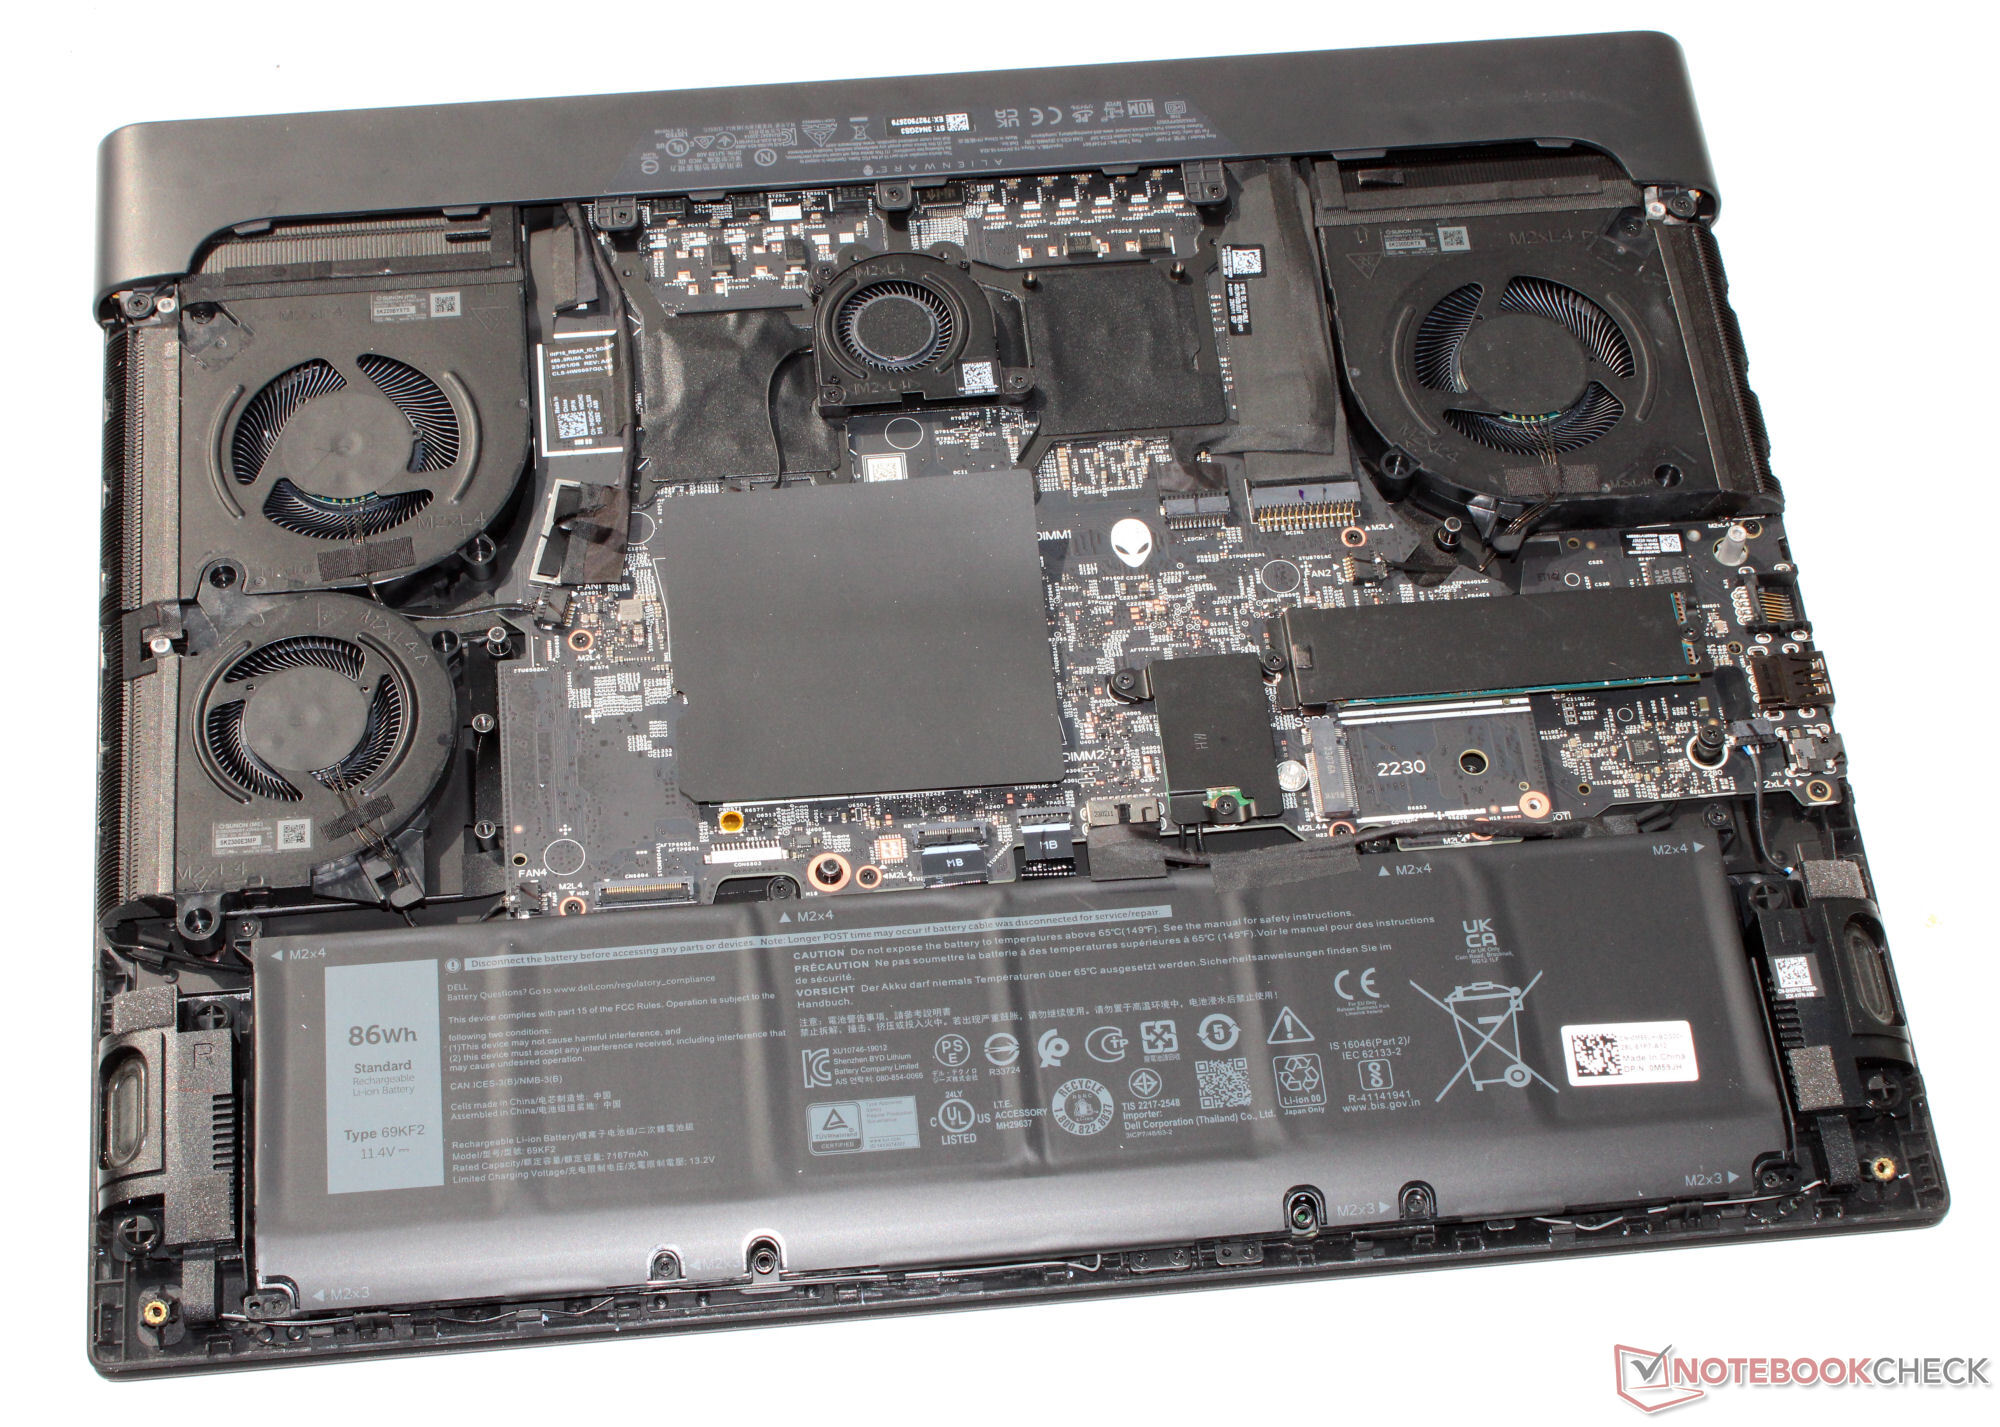
A 512 GB SSD (PCIe 4, M.2 2280) from Kioxia serves as the system drive. It delivers good data rates, but is not one of the top SSD models. Thermally induced throttlig did not occur. The notebook has room for another PCIe-4-SSD (M.2 2230 or M.2 2280). Other configurations of the m16 can even accommodate up to four SSDs.

* ... smaller is better
Sustained Read Performance: DiskSpd Read Loop, Queue Depth 8
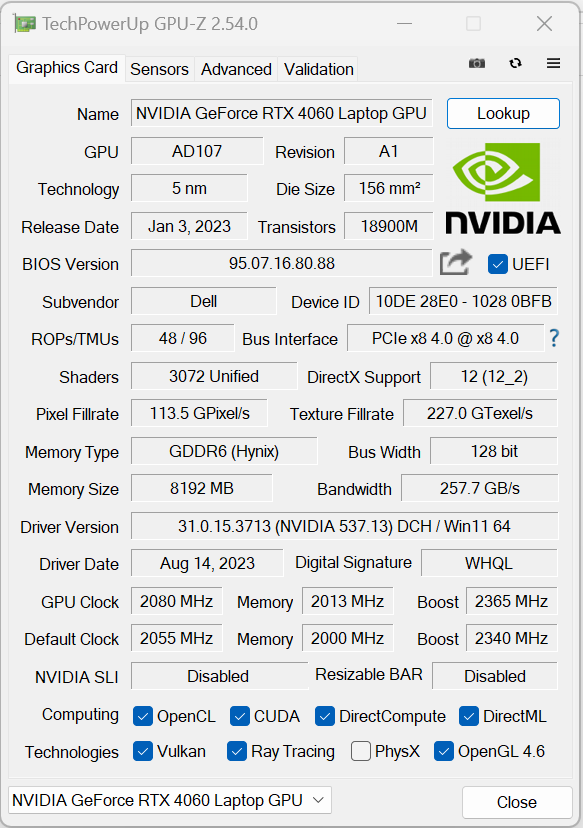
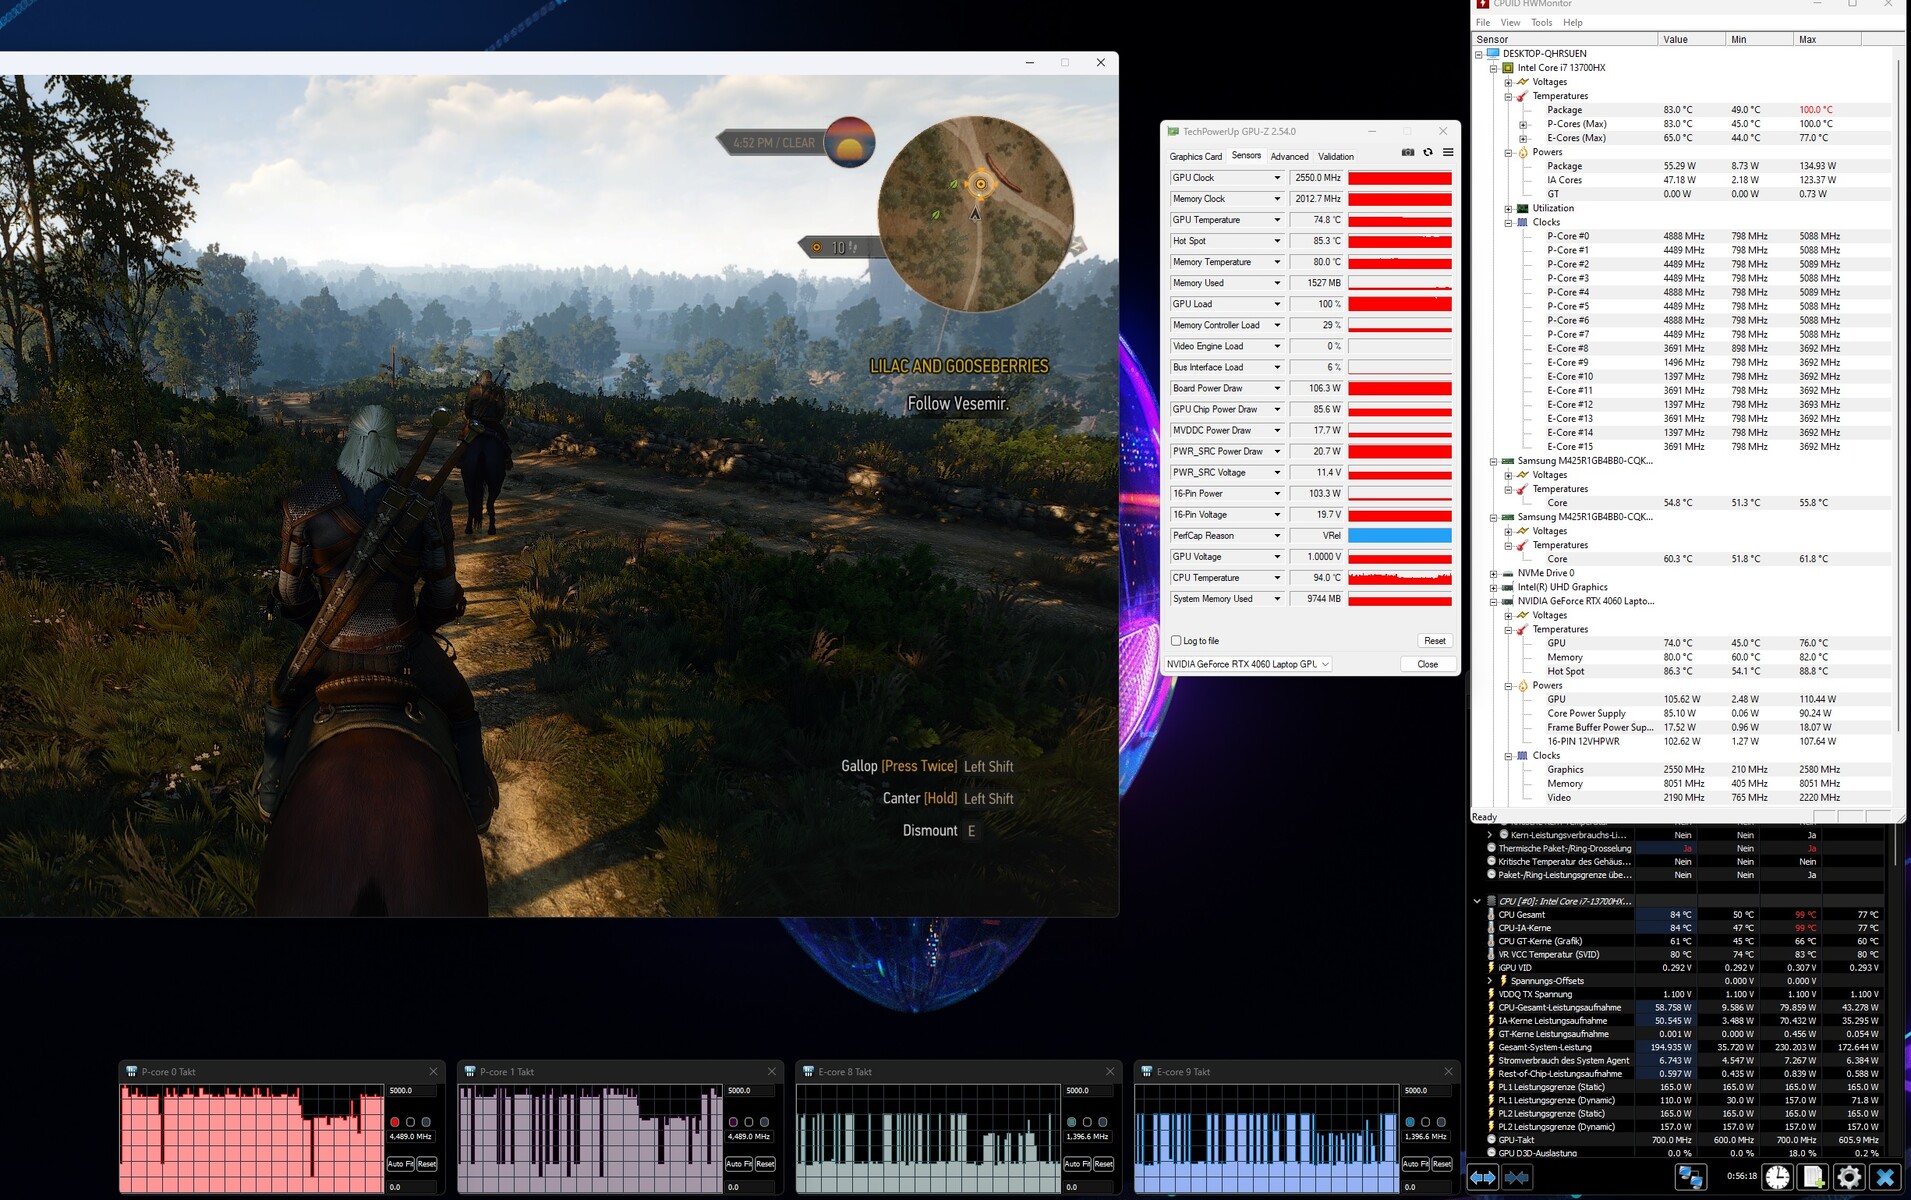
Graphics Card
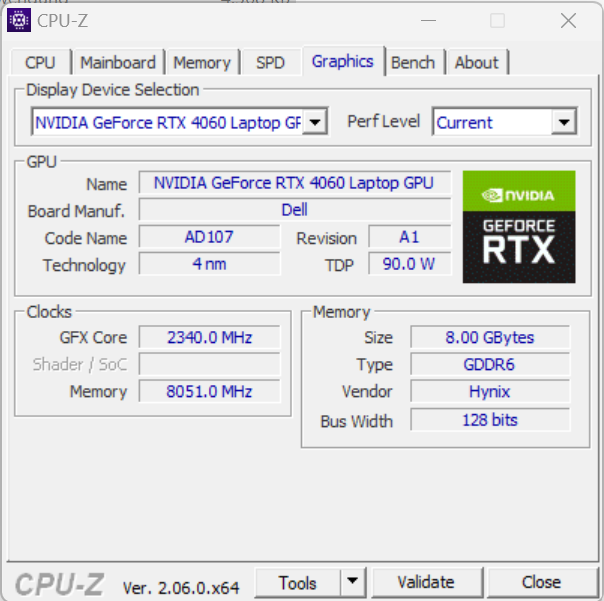
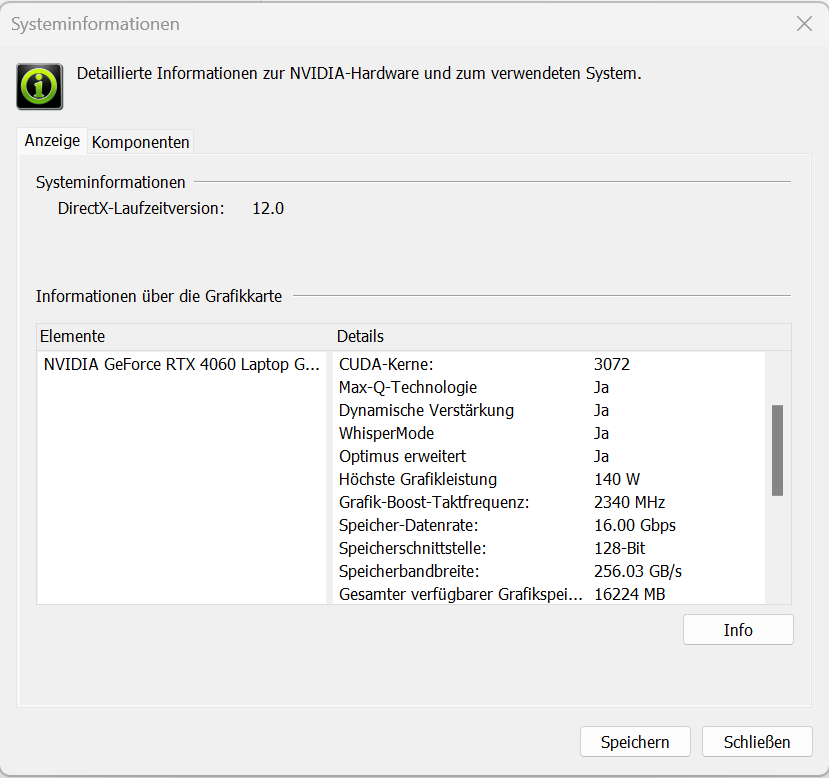
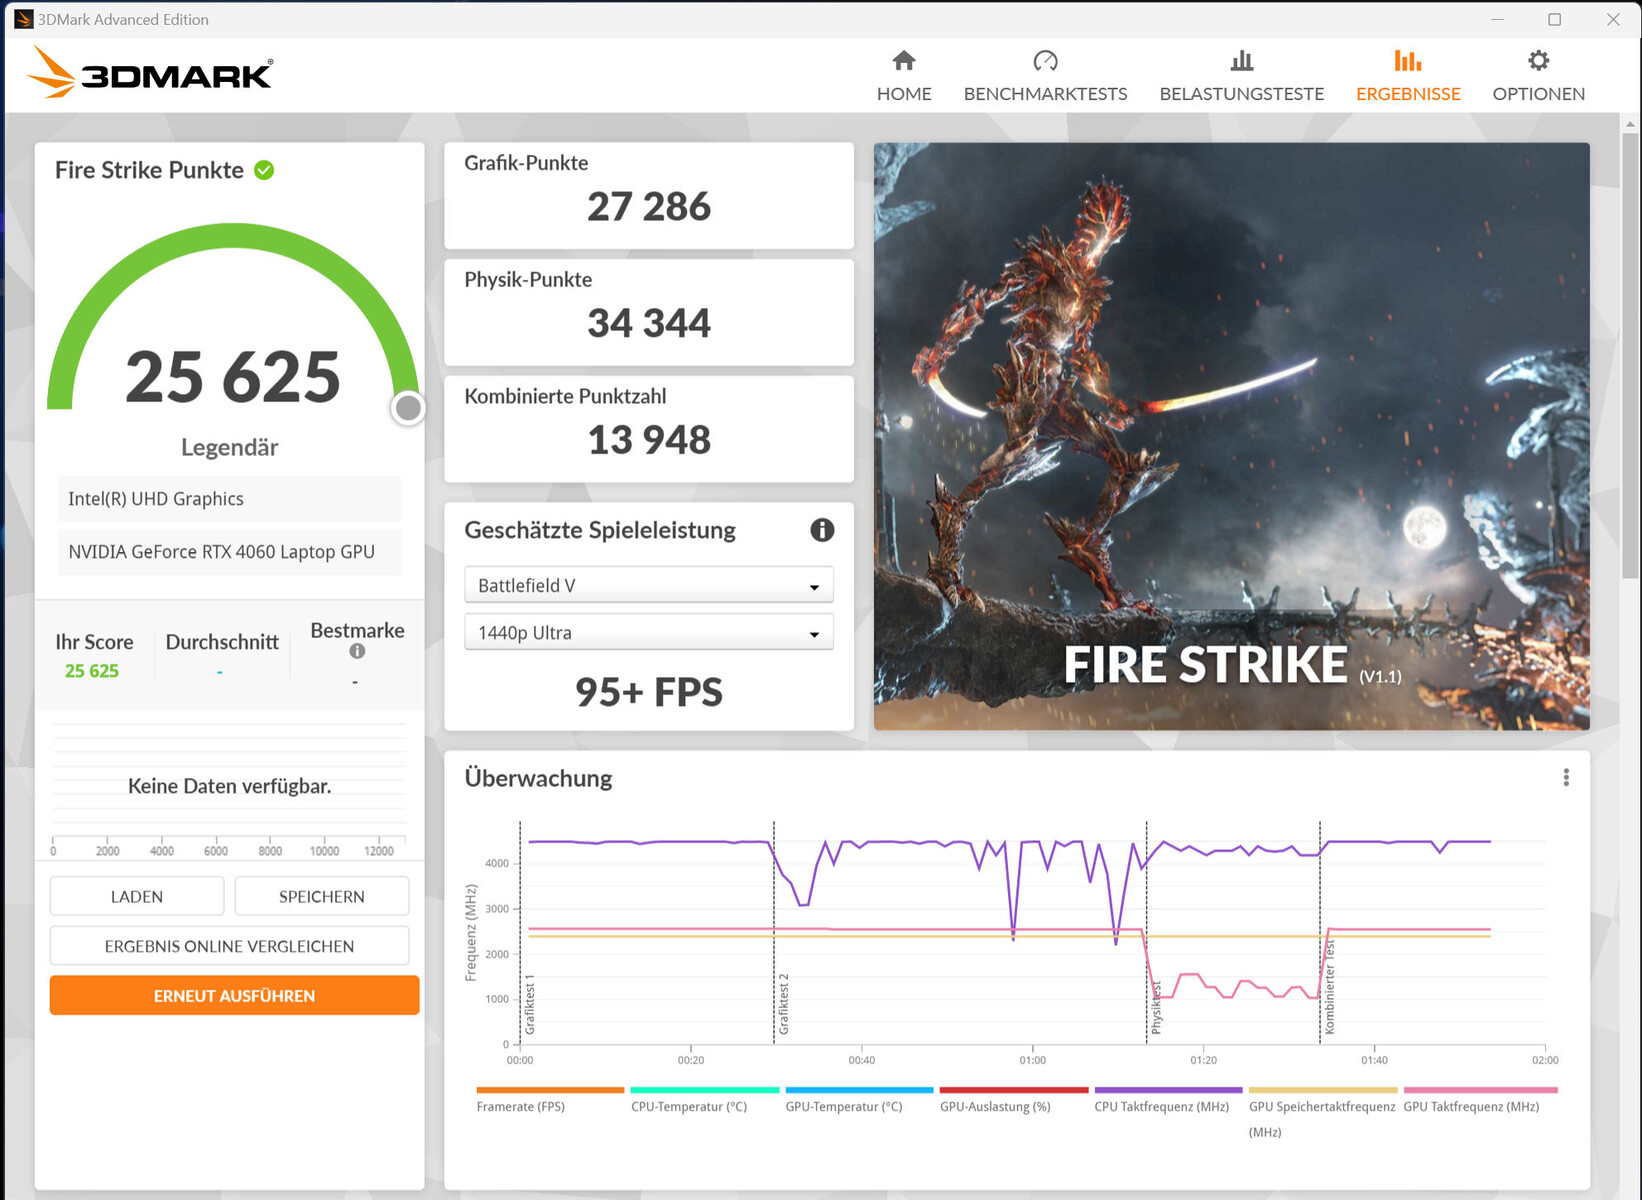
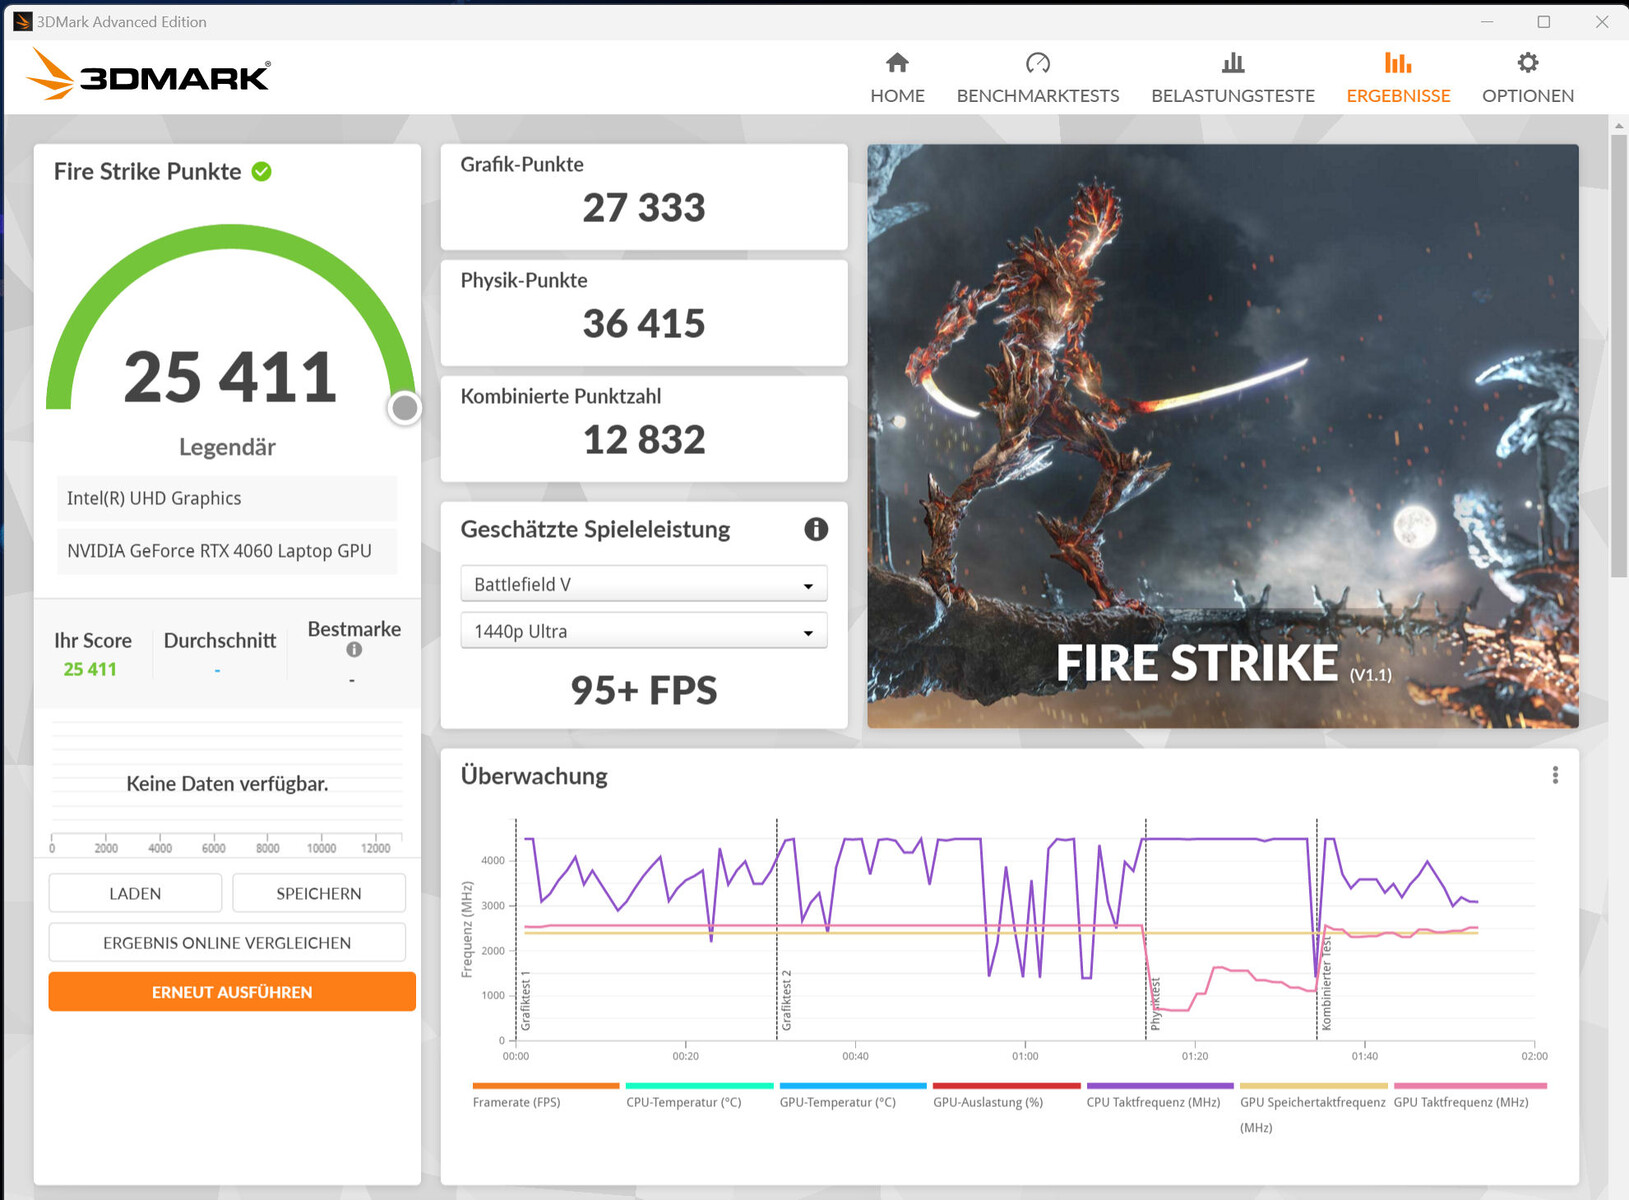
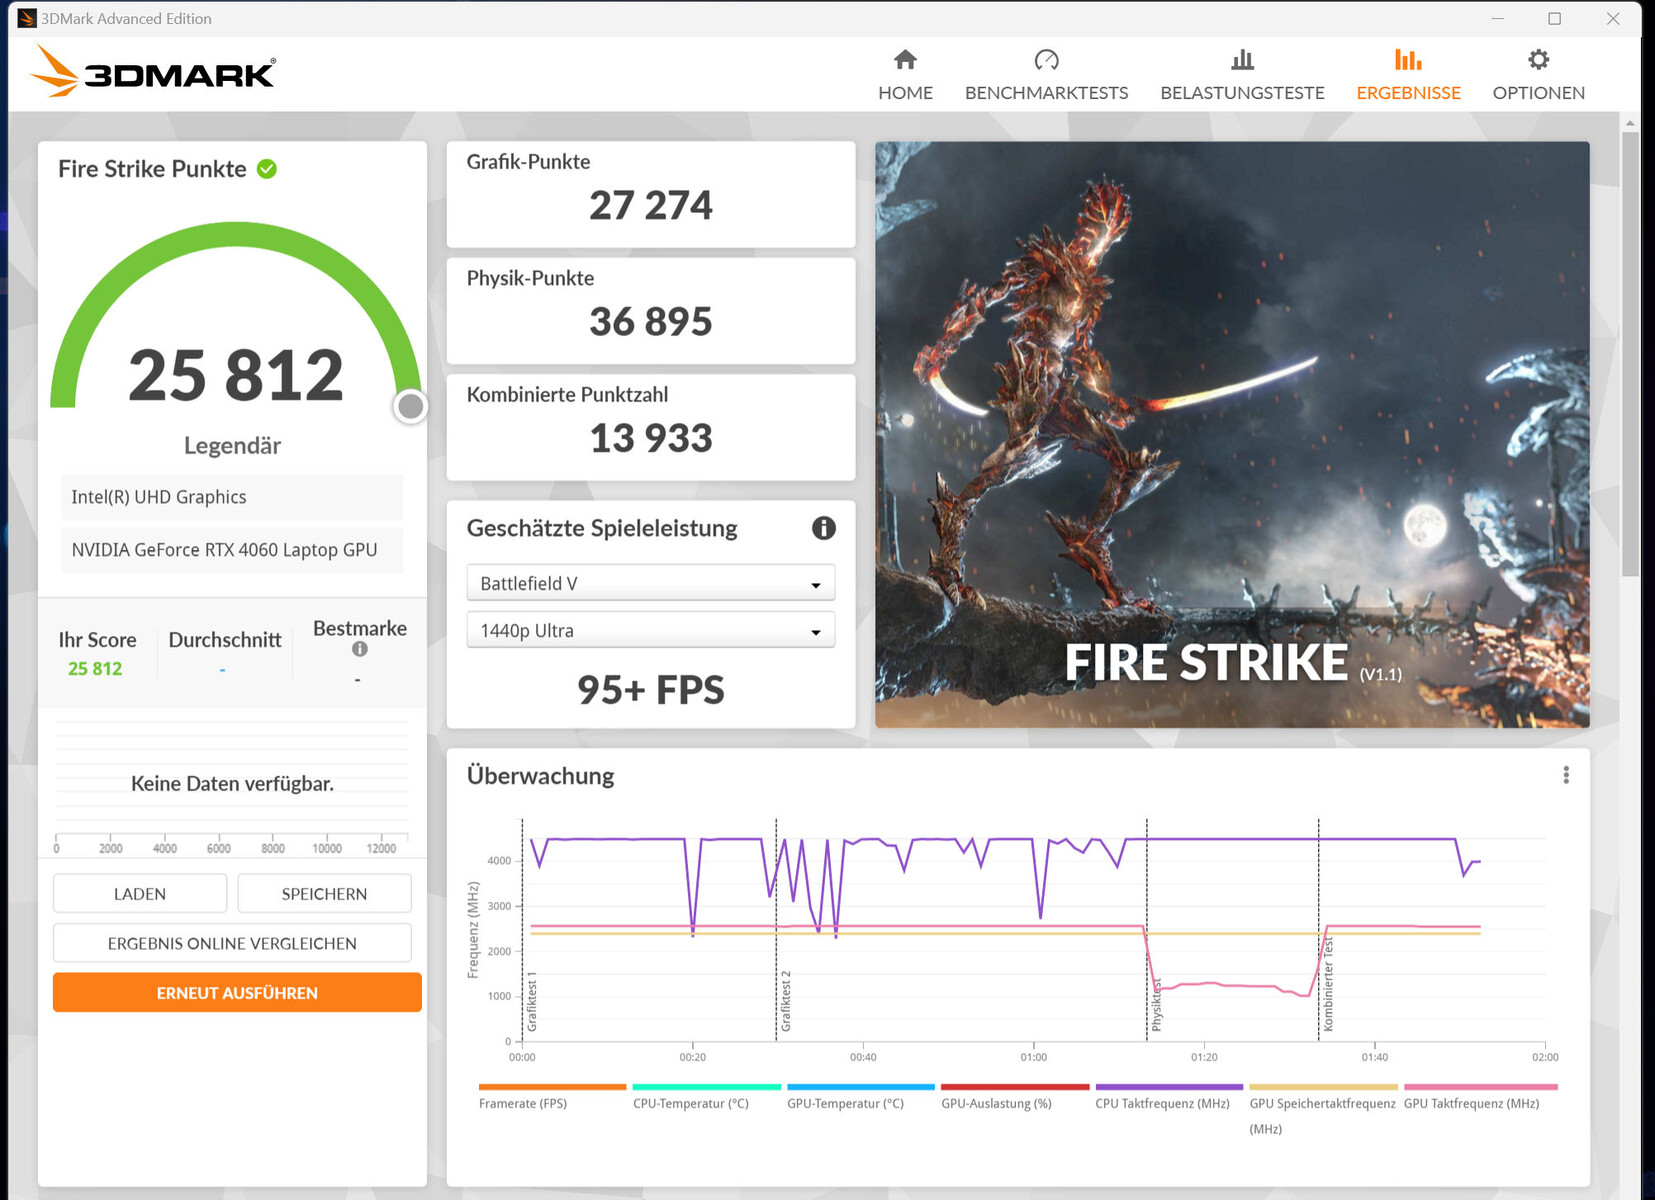
The GeForce RTX 4060 offers 3072 shaders, a 128 bit wide bus and fast GDDR6 memory (8,192 MB). Dell allows a maximum TGP of 140 watts (115 watts + 25 watts Dynamic Boost) - more is not possible. According to the Witcher 3 test, the TGP is not fully utilized. The benchmark results are above the previous RTX 4060 average and are among the best values recorded with this GPU so far. Switching between dGPU and Optimus does not require a reboot - Advanced Optimus is supported.


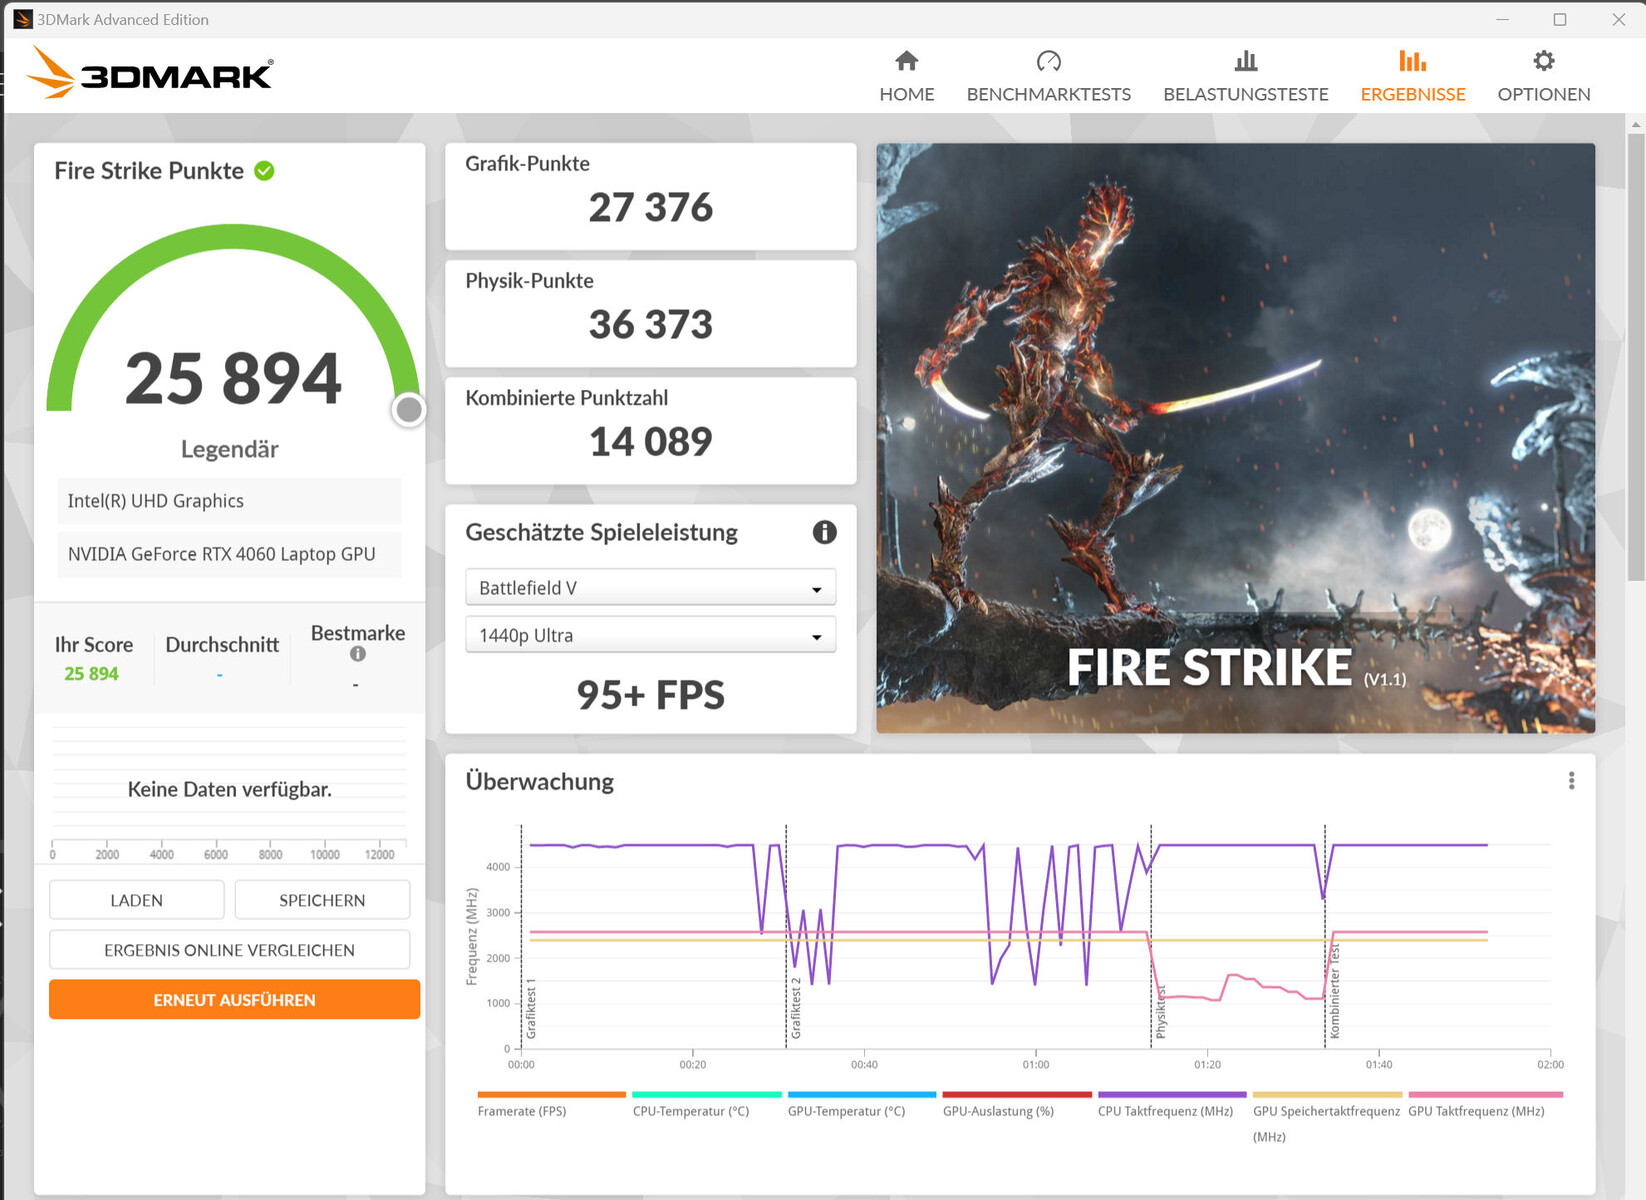
| 3DMark 06 Standard Score | 55811 points | |
| 3DMark 11 Performance | 33427 points | |
| 3DMark Cloud Gate Standard Score | 67224 points | |
| 3DMark Fire Strike Score | 25869 points | |
| 3DMark Time Spy Score | 11090 points | |
Help | ||
* ... smaller is better
Gaming Performance
The m16 is designed for QHD+ gaming at high to maximum settings. Higher resolutions are possible if a corresponding screen is connected - at partially reduced settings. Frame rates above the RTX 4060 average are achieved.
| The Witcher 3 - 1920x1080 Ultra Graphics & Postprocessing (HBAO+) | |
| Alienware m16 R1 AMD | |
| SCHENKER XMG Pro 15 (E23) | |
| Average of class Gaming (8.61 - 216, n=222, last 2 years) | |
| Aorus 15 BSF | |
| Lenovo Legion Pro 5 16IRX8 | |
| Alienware m16 R1 Intel | |
| Medion Erazer Defender P40 | |
| Acer Predator Helios 16 PH16-71-731Q | |
| Average NVIDIA GeForce RTX 4060 Laptop GPU (77 - 159.7, n=36) | |
| Atlas Fallen - 1920x1080 Very High Preset | |
| Alienware m16 R1 Intel | |
| Average NVIDIA GeForce RTX 4060 Laptop GPU (88.2 - 114.4, n=3) | |
| Average of class Gaming (9.8 - 161, n=13, last 2 years) | |
| Ratchet & Clank Rift Apart | |
| 1920x1080 Very High Preset AA:T | |
| Aorus 15 BSF | |
| Alienware m16 R1 Intel | |
| Average NVIDIA GeForce RTX 4060 Laptop GPU (51.6 - 54.8, n=4) | |
| Average of class Gaming (28.5 - 111.1, n=13, last 2 years) | |
| 1920x1080 Very High Preset + Very High Raytracing AA:T | |
| Aorus 15 BSF | |
| Alienware m16 R1 Intel | |
| Average NVIDIA GeForce RTX 4060 Laptop GPU (39.1 - 44.5, n=3) | |
| Average of class Gaming (24.1 - 58.5, n=6, last 2 years) | |
| Immortals of Aveum - 1920x1080 Ultra AF:16x | |
| Alienware m16 R1 Intel | |
| Average of class Gaming (14.9 - 106.3, n=10, last 2 years) | |
| Average NVIDIA GeForce RTX 4060 Laptop GPU (33 - 48.9, n=4) | |
| The Callisto Protocol | |
| 1920x1080 Ultra Preset (without FSR Upscaling) | |
| Average of class Gaming (10.3 - 150.7, n=21, last 2 years) | |
| Aorus 15 BSF | |
| Alienware m16 R1 Intel | |
| Average NVIDIA GeForce RTX 4060 Laptop GPU (54.4 - 81.1, n=3) | |
| 1920x1080 Ultra Preset (without FSR Upscaling) + Full Ray-Tracing | |
| Aorus 15 BSF | |
| Alienware m16 R1 Intel | |
| Average of class Gaming (32 - 79.6, n=15, last 2 years) | |
| Average NVIDIA GeForce RTX 4060 Laptop GPU (38.6 - 69.8, n=2) | |
| Star Wars Jedi Survivor | |
| 1920x1080 Epic Preset | |
| Alienware m16 R1 Intel | |
| Average of class Gaming (27.2 - 117.4, n=22, last 2 years) | |
| Medion Erazer Defender P40 | |
| Average NVIDIA GeForce RTX 4060 Laptop GPU (45.5 - 66.7, n=10) | |
| 1920x1080 Epic Preset + Ray Tracing | |
| Alienware m16 R1 Intel | |
| Average of class Gaming (38.6 - 85.3, n=7, last 2 years) | |
| Average NVIDIA GeForce RTX 4060 Laptop GPU (47 - 52.8, n=4) | |
| Medion Erazer Defender P40 | |
To check whether the frame rate remains largely constant over long periods of time, "The Witcher 3" is run for around 60 minutes in Full HD resolution and at maximum quality settings. The game character is not moved. A drop in frame rates was not observed.
Witcher 3 FPS-Diagramm
| low | med. | high | ultra | QHD | |
| The Witcher 3 (2015) | 497 | 340.9 | 206.2 | 106.5 | 78.8 |
| Dota 2 Reborn (2015) | 189.5 | 169.6 | 165.8 | 153.2 | |
| Final Fantasy XV Benchmark (2018) | 232 | 150.8 | 104.7 | 77.1 | |
| X-Plane 11.11 (2018) | 170.4 | 156.7 | 120.4 | ||
| Far Cry 5 (2018) | 199 | 163 | 155 | 146 | 107 |
| Strange Brigade (2018) | 580 | 283 | 223 | 190.3 | 128.5 |
| Cyberpunk 2077 1.6 (2022) | 134.6 | 104.5 | 89.3 | 82.1 | 49.9 |
| The Callisto Protocol (2022) | 165.4 | 135.4 | 128 | 81.1 | 62.8 |
| Star Wars Jedi Survivor (2023) | 86 | 75.8 | 70.9 | 66.7 | 41.7 |
| F1 23 (2023) | 291 | 272 | 187.6 | 119.9 | 38.9 |
| Ratchet & Clank Rift Apart (2023) | 86 | 74.7 | 60.6 | 54.8 | 46.6 |
| Atlas Fallen (2023) | 145.9 | 137.5 | 132.1 | 114.4 | 79.2 |
| Immortals of Aveum (2023) | 61.6 | 54.6 | 48.9 | 32.8 |
Emissions - The Dell laptop can produce a lot of noise
Noise
The sound pressure level can rise up to 58 dB(A) ("Overdrive") in gaming mode. "Performance" mode performs better at 51 dB(A). The favorite among the modes is the "Silent" profile: a level of 43 dB(A) comes at the cost of slightly reduced gaming performance.
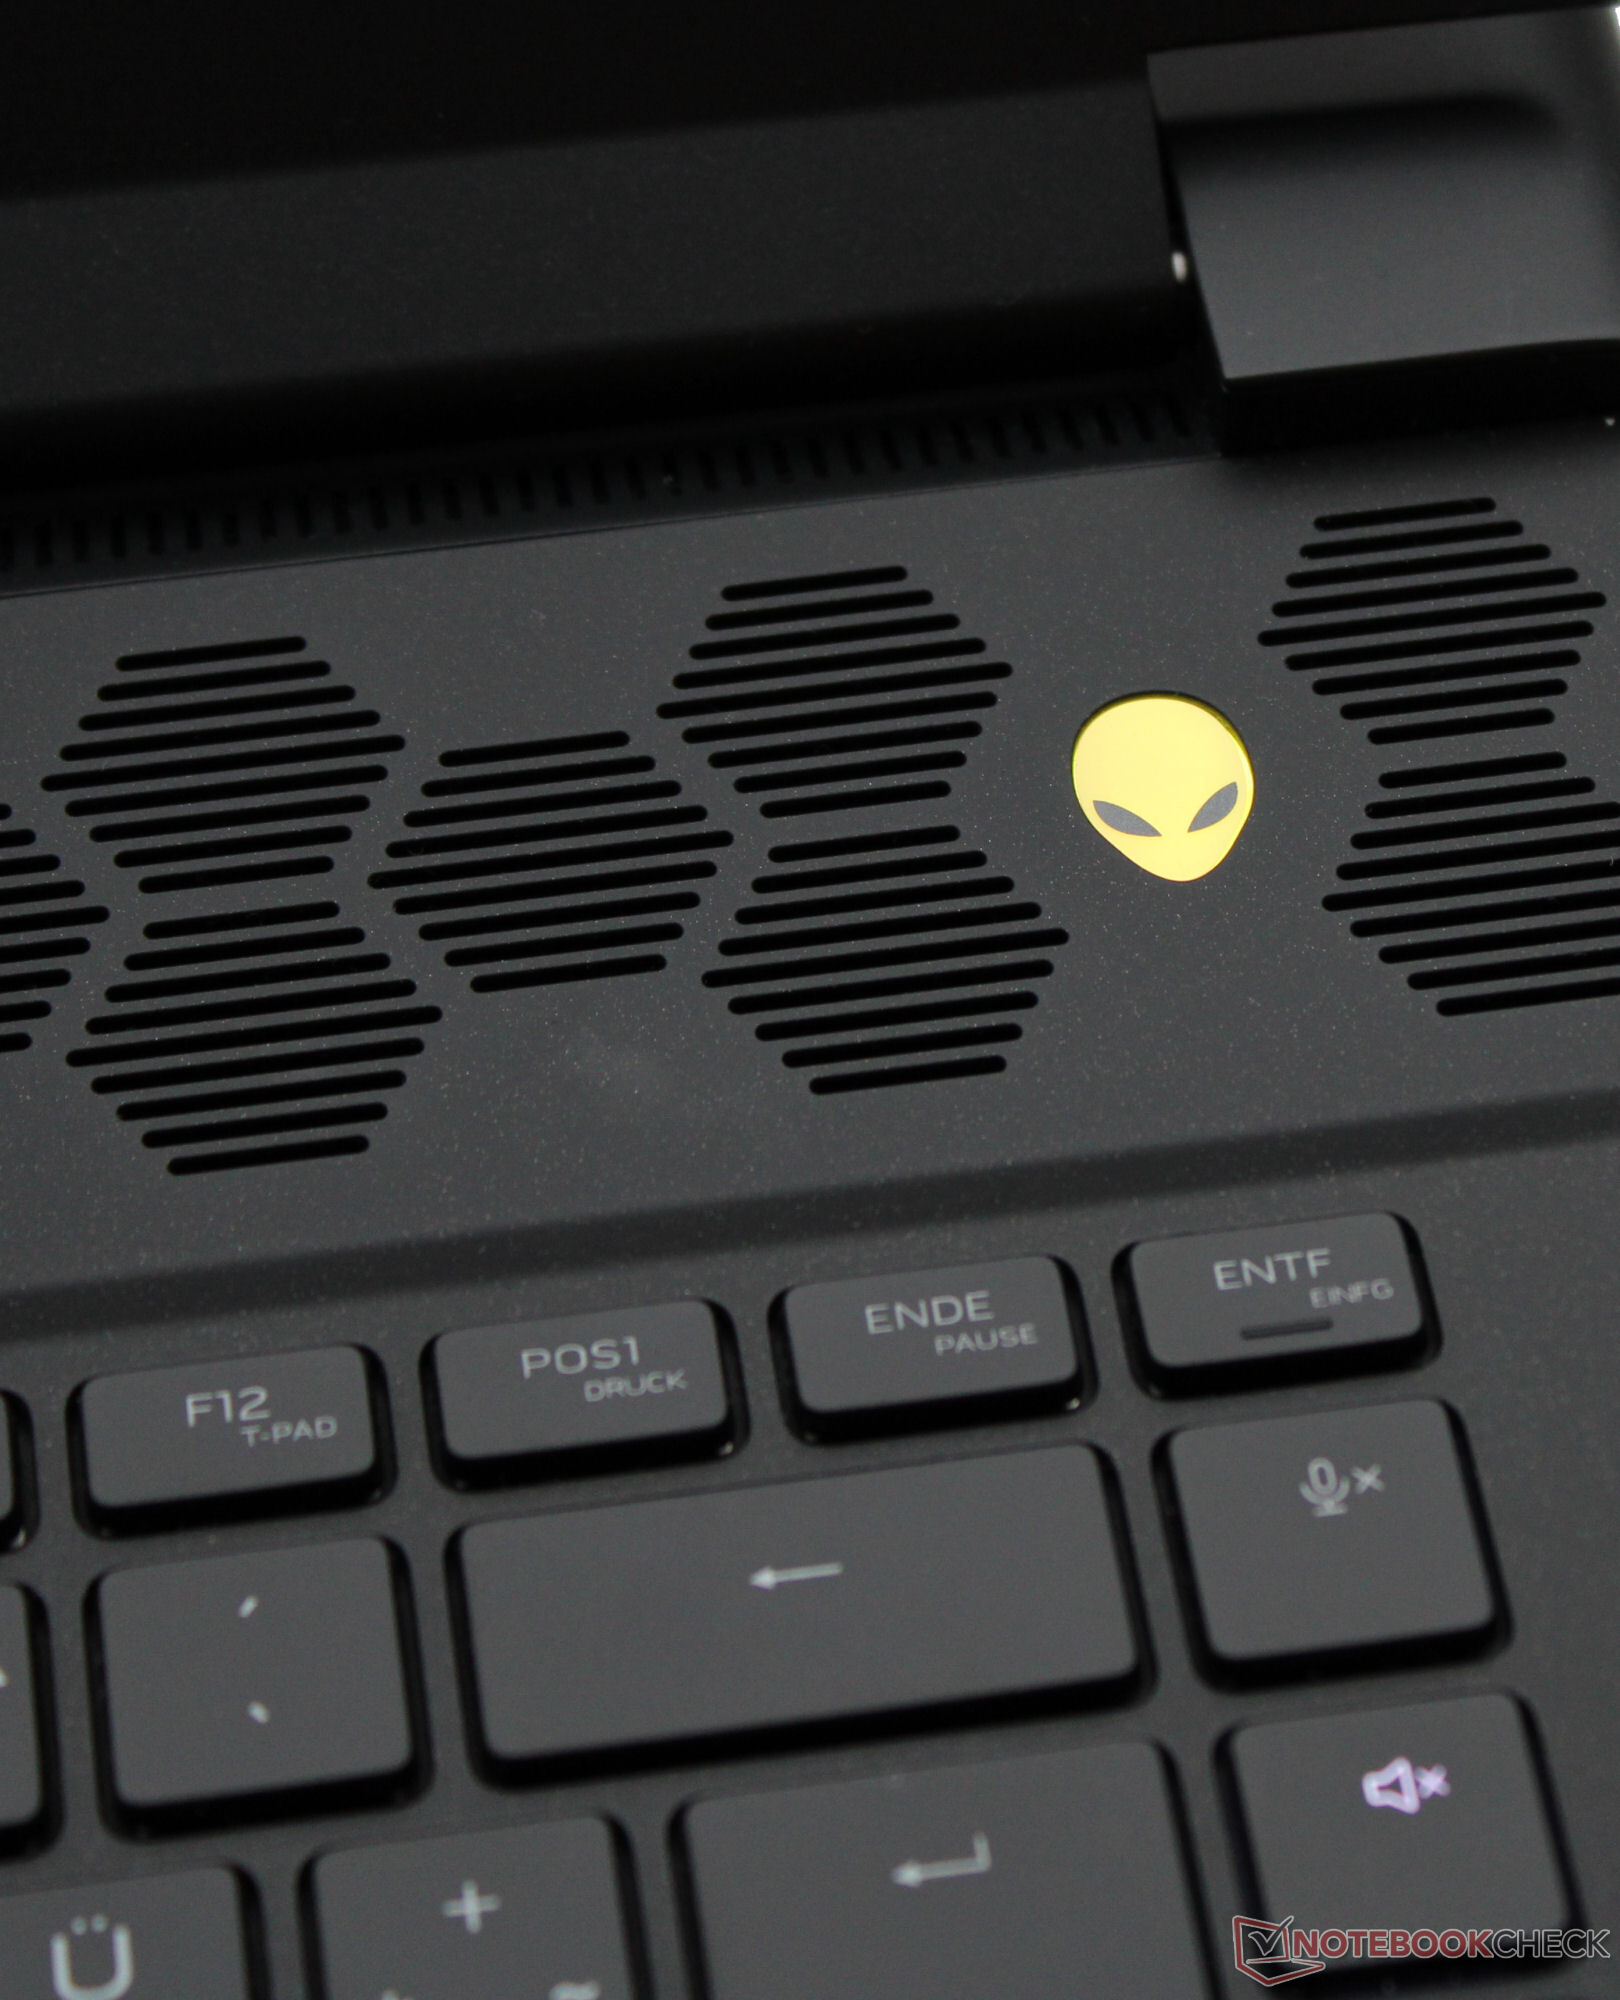
When idle and in everyday use (office, internet), the four fans often stand still and silence reigns.
Noise Level
| Idle |
| 25 / 26 / 27 dB(A) |
| Load |
| 52 / 53 dB(A) |
 | ||
30 dB silent 40 dB(A) audible 50 dB(A) loud |
||
min: | ||
| Alienware m16 R1 Intel NVIDIA GeForce RTX 4060 Laptop GPU, i7-13700HX, Kioxia KXG70ZNV512G | Acer Predator Helios 16 PH16-71-731Q NVIDIA GeForce RTX 4060 Laptop GPU, i7-13700HX, Micron 3400 1TB MTFDKBA1T0TFH | Medion Erazer Defender P40 NVIDIA GeForce RTX 4060 Laptop GPU, i7-13700HX, Phison PS5021-E21 1TB | Lenovo Legion Pro 5 16IRX8 NVIDIA GeForce RTX 4060 Laptop GPU, i7-13700HX, SK hynix PC801 HFS512GEJ9X115N | SCHENKER XMG Pro 15 (E23) NVIDIA GeForce RTX 4060 Laptop GPU, i9-13900HX, Crucial P5 Plus 1TB CT1000P5PSSD8 | Aorus 15 BSF NVIDIA GeForce RTX 4070 Laptop GPU, i7-13700H, Gigabyte AG470S1TB-SI B10 | Alienware m16 R1 AMD NVIDIA GeForce RTX 4080 Laptop GPU, R9 7845HX, Kioxia XG8 KXG80ZNV1T02 | |
|---|---|---|---|---|---|---|---|
| Noise | 5% | -9% | 9% | 3% | -10% | 4% | |
| off / environment * | 25 | 24 4% | 25 -0% | 23 8% | 24 4% | 24 4% | 22.9 8% |
| Idle Minimum * | 25 | 24 4% | 26 -4% | 23.1 8% | 24 4% | 25 -0% | 22.9 8% |
| Idle Average * | 26 | 24 8% | 27 -4% | 23.1 11% | 24 8% | 31 -19% | 29.7 -14% |
| Idle Maximum * | 27 | 32.32 -20% | 32 -19% | 26.6 1% | 24 11% | 37 -37% | 29.7 -10% |
| Load Average * | 52 | 36.66 29% | 53 -2% | 34.7 33% | 53.65 -3% | 51 2% | 29.8 43% |
| Witcher 3 ultra * | 51 | 49.06 4% | 56 -10% | 47.6 7% | 53.53 -5% | 54.7 -7% | |
| Load Maximum * | 53 | 49.49 7% | 64 -21% | 54.8 -3% | 53.65 -1% | 57 -8% | 54.7 -3% |
* ... smaller is better
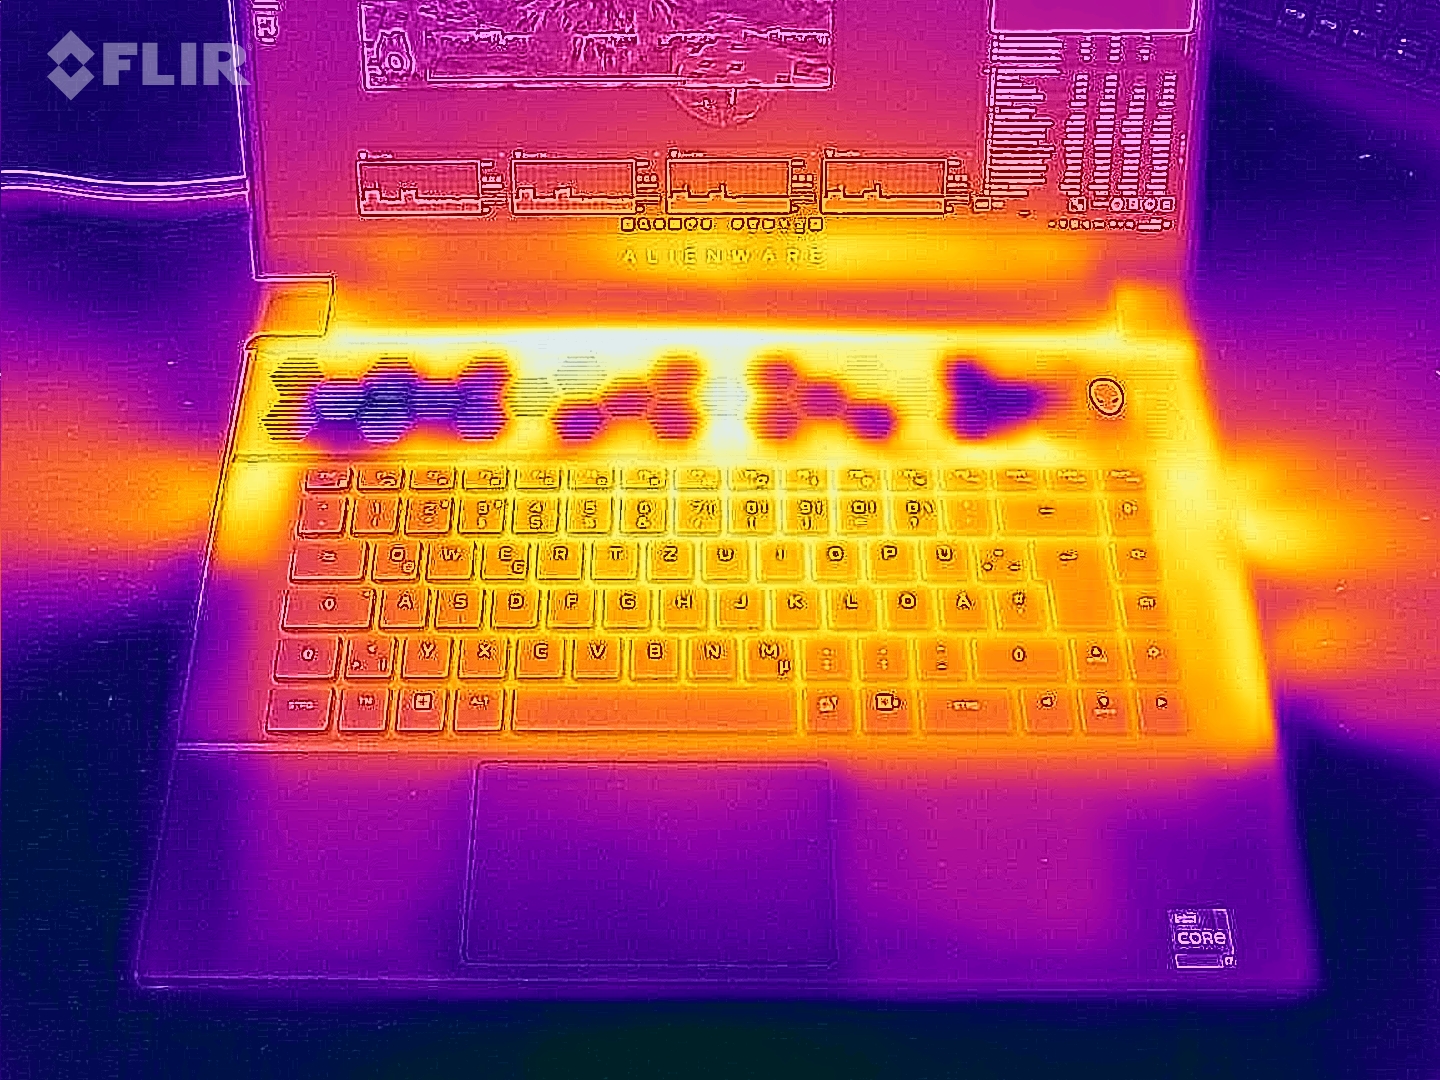
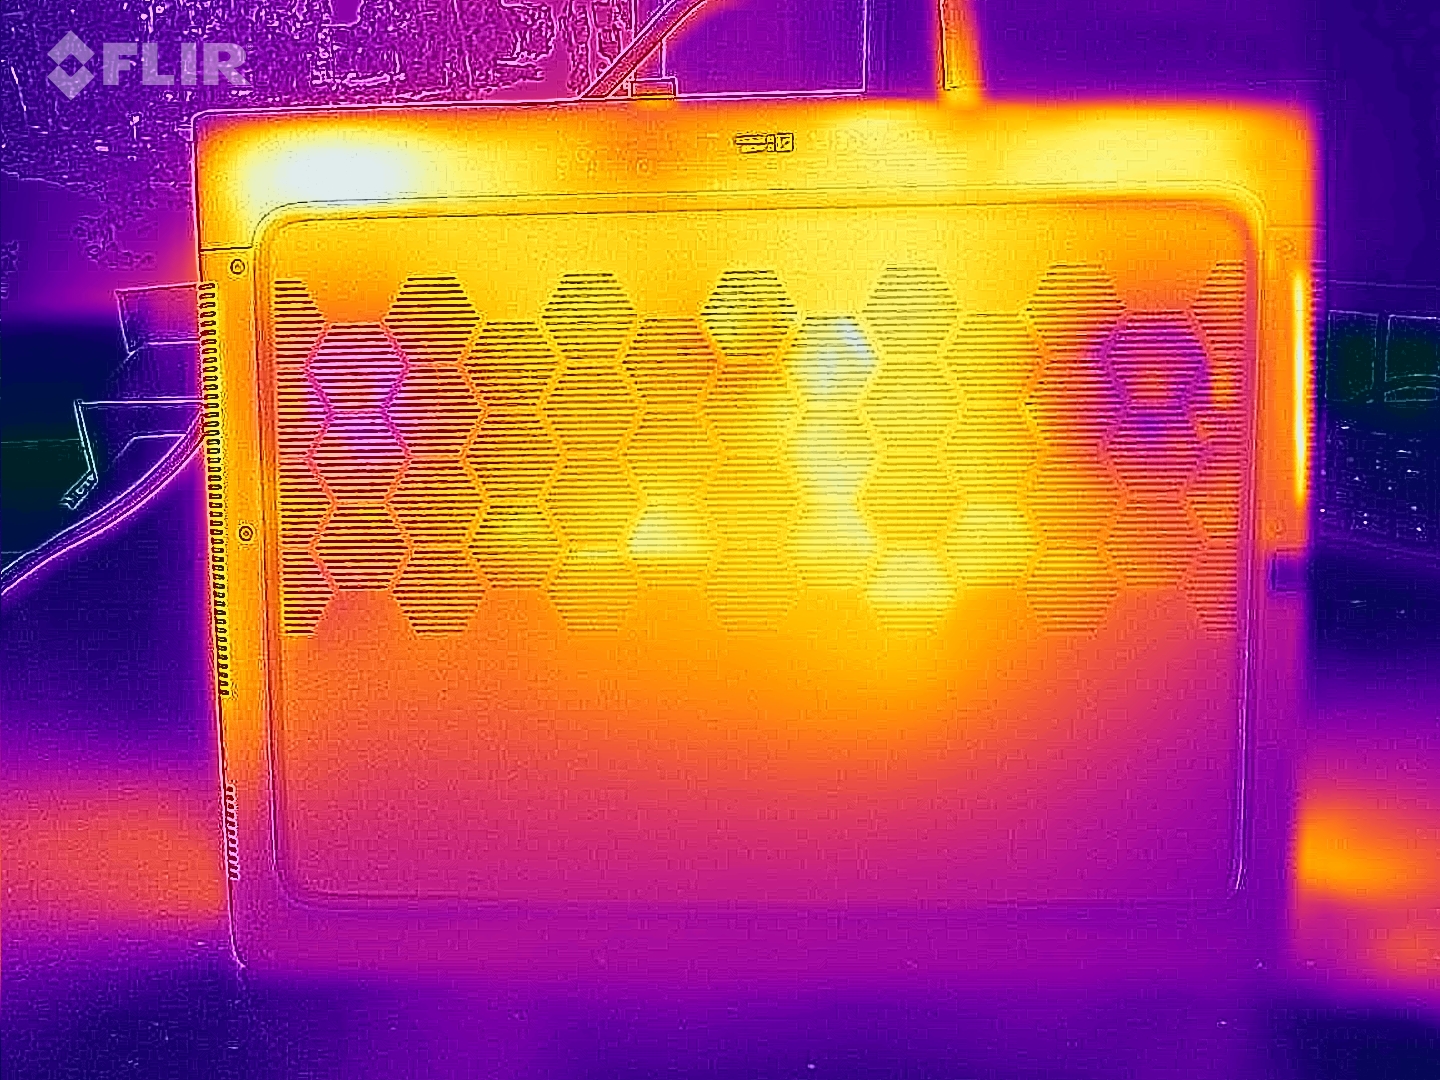
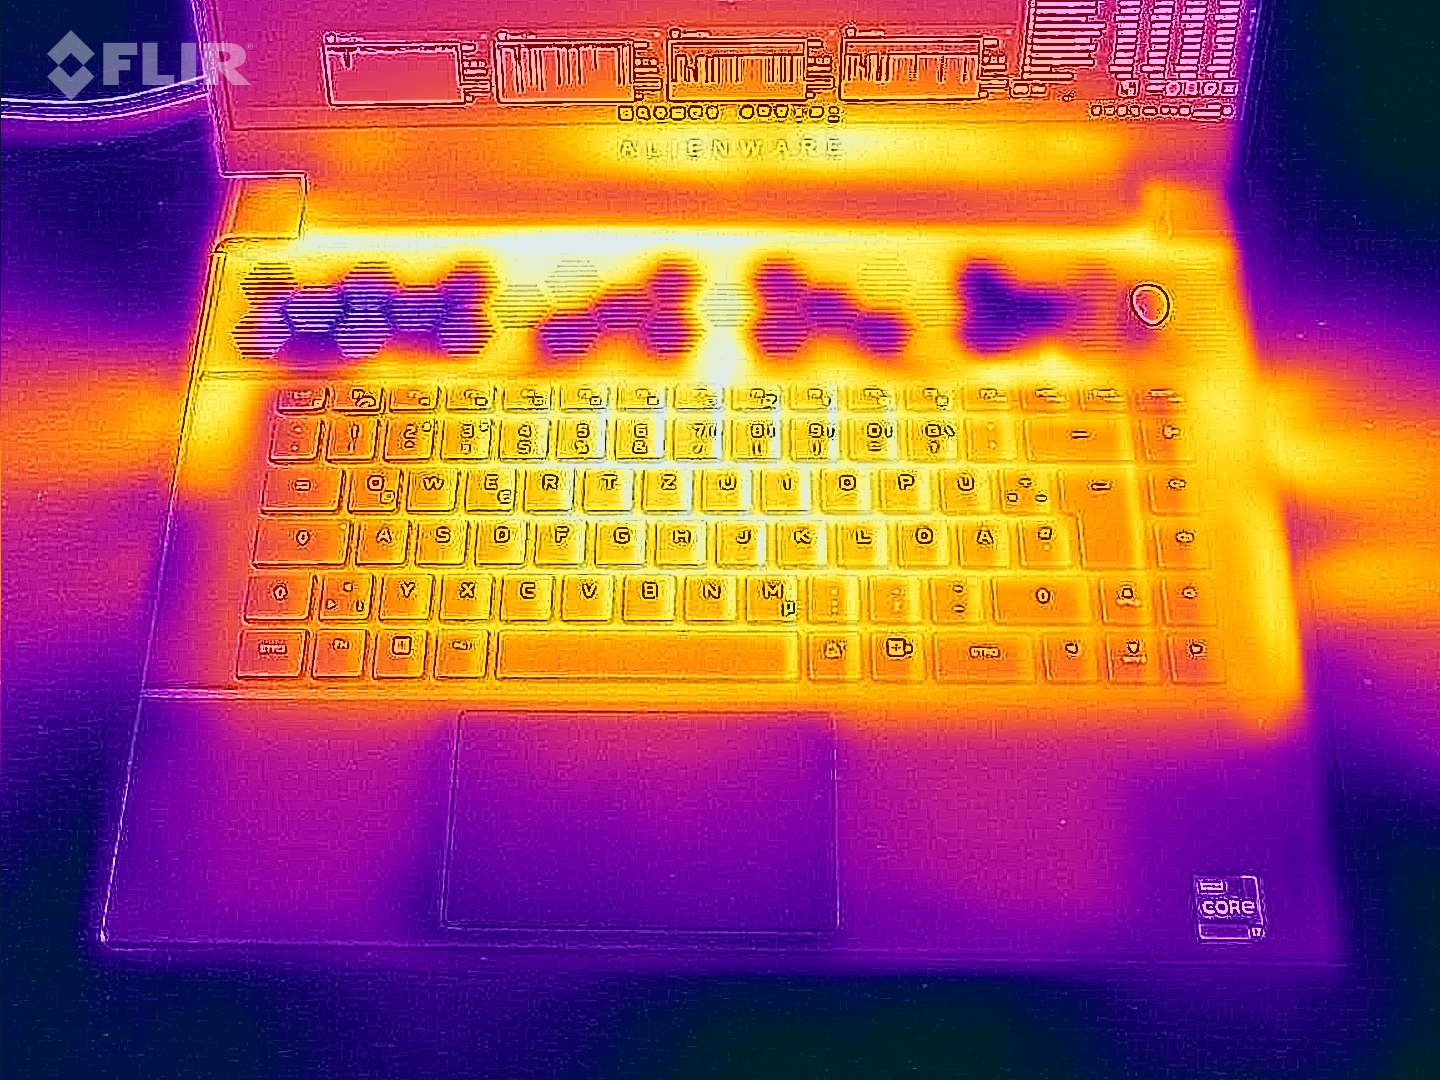
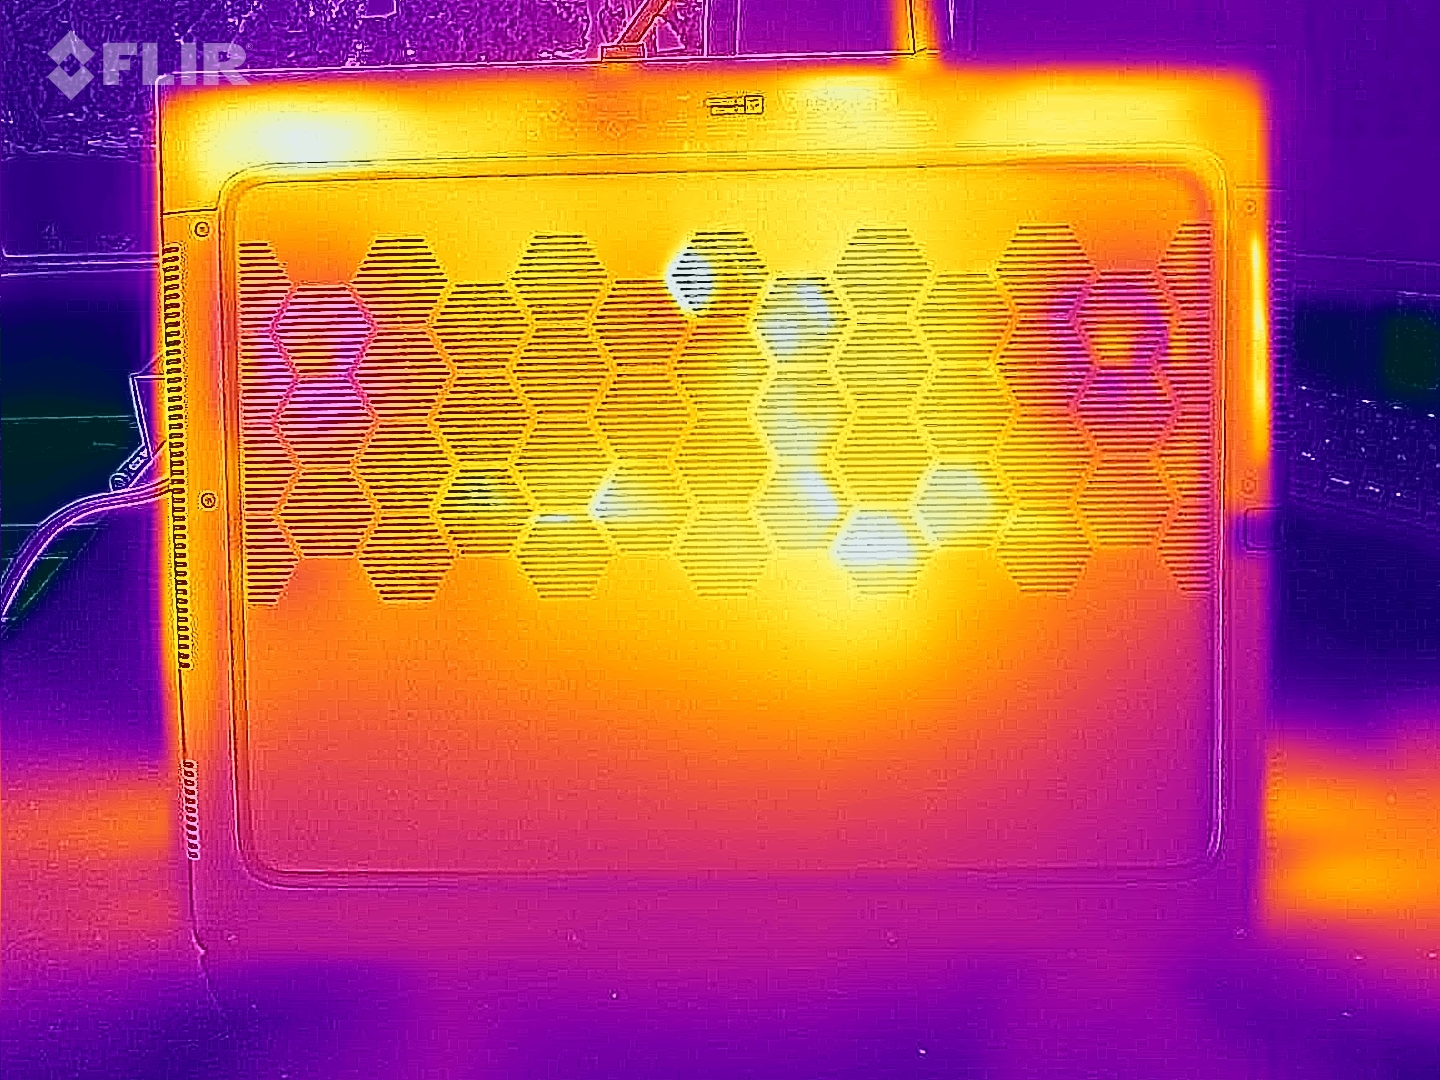
Temperature
Stress testing and Witcher 3 cause noticeable warming of the notebook, but everything remains within acceptable limits. In everyday use (office, internet), case temperatures basically remain in the green zone, but are on too high a level compared to comparable laptops.
The laptop heats up more under load than its AMD counterpart equipped with more powerful hardware. The latter benefits from the more frugal APU.
(-) The maximum temperature on the upper side is 49 °C / 120 F, compared to the average of 40.4 °C / 105 F, ranging from 21.2 to 68.8 °C for the class Gaming.
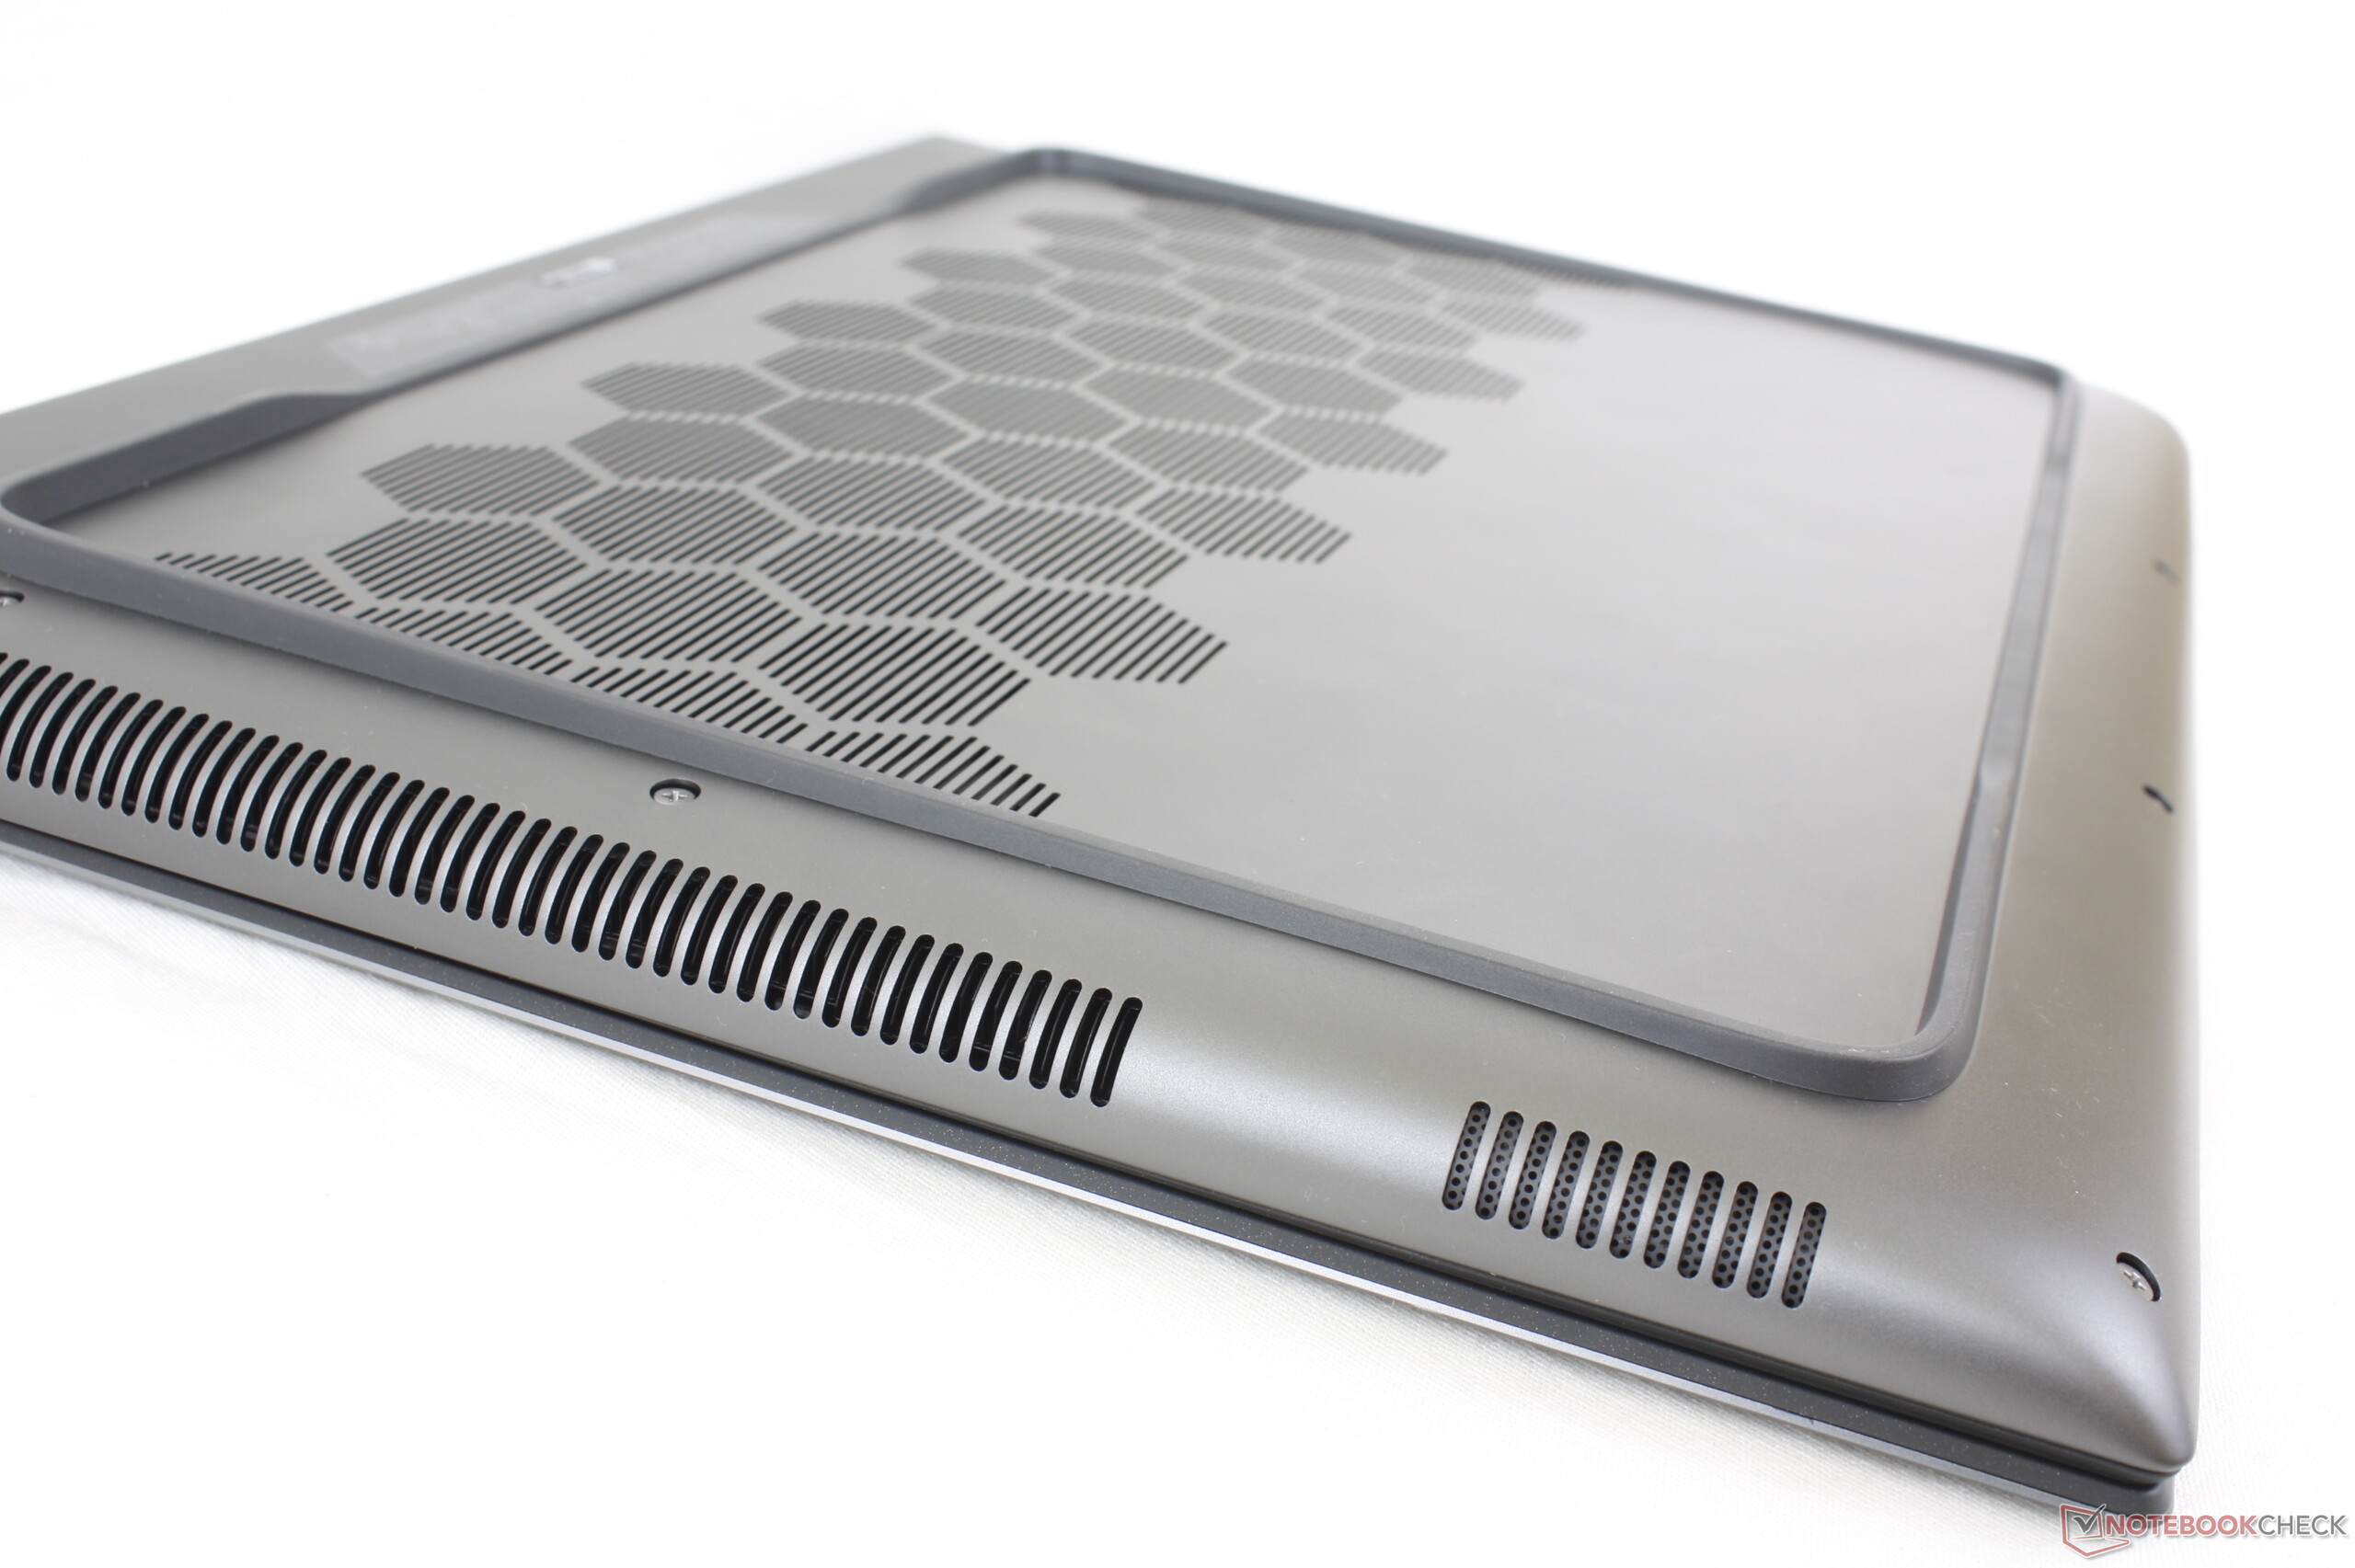
(-) The bottom heats up to a maximum of 48 °C / 118 F, compared to the average of 43.2 °C / 110 F
(±) In idle usage, the average temperature for the upper side is 37 °C / 99 F, compared to the device average of 33.8 °C / 93 F.
(-) Playing The Witcher 3, the average temperature for the upper side is 46 °C / 115 F, compared to the device average of 33.8 °C / 93 F.
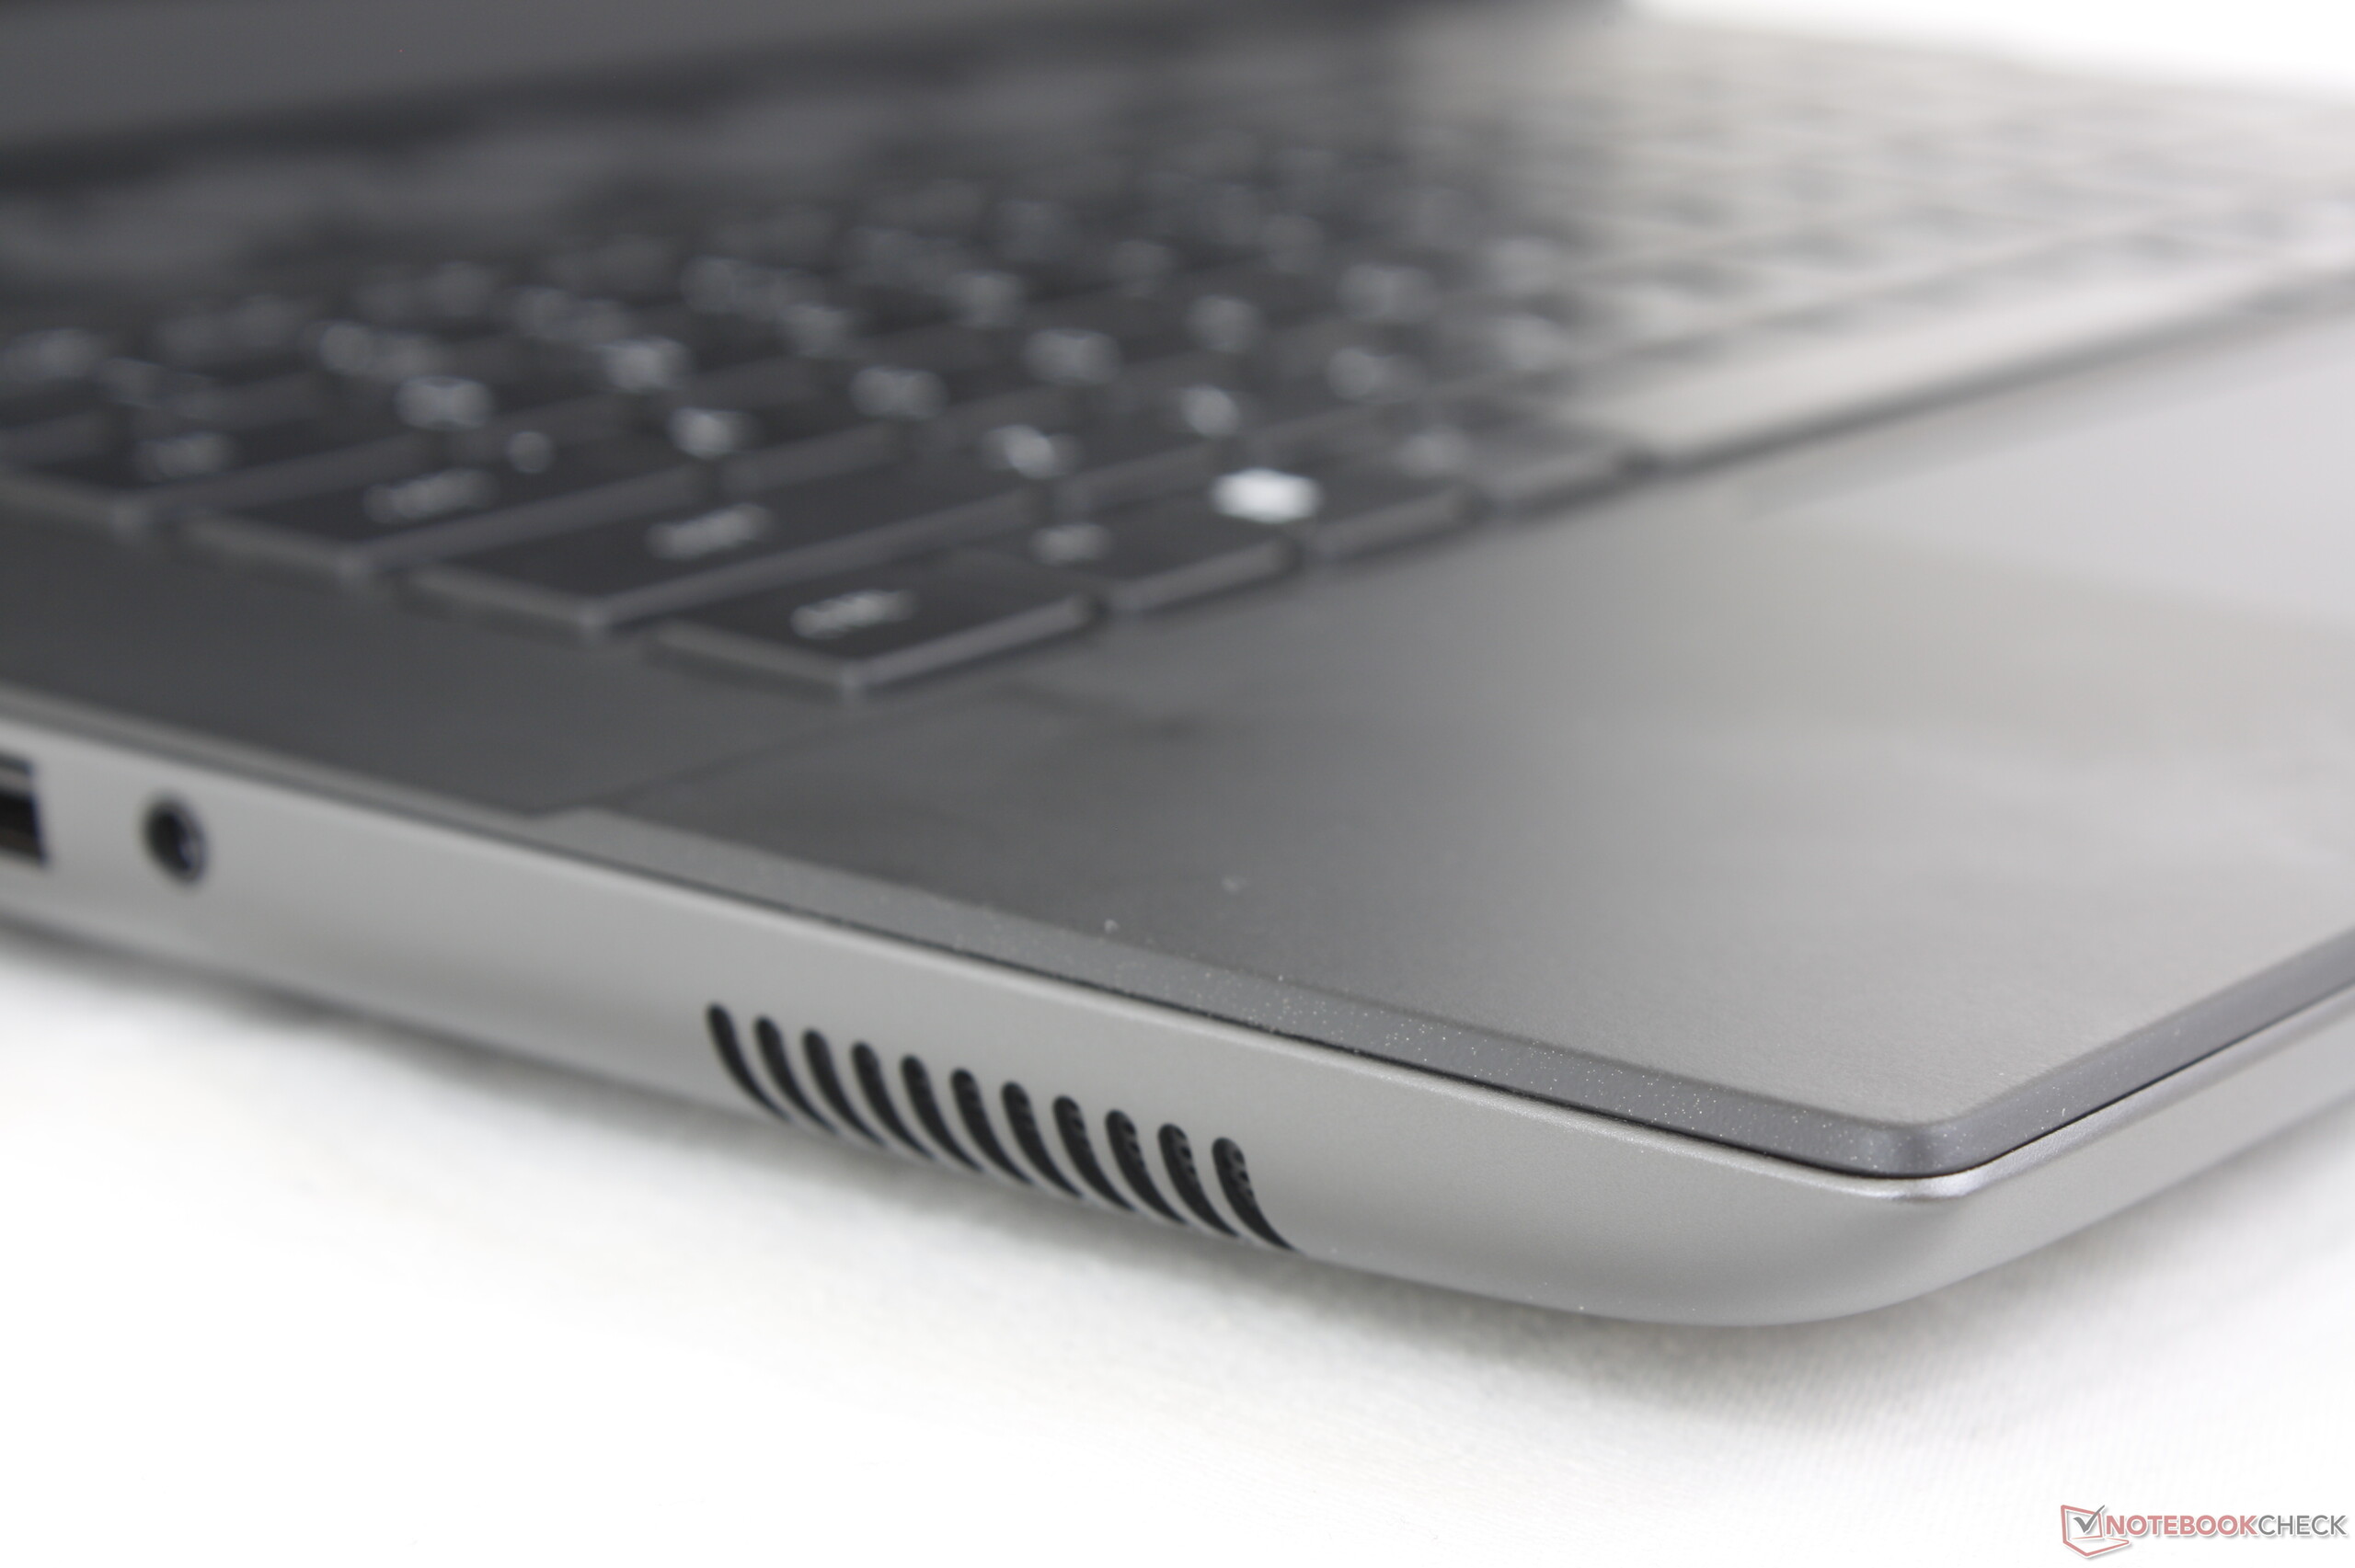
(-) The palmrests and touchpad can get very hot to the touch with a maximum of 44 °C / 111.2 F.
(-) The average temperature of the palmrest area of similar devices was 28.9 °C / 84 F (-15.1 °C / -27.2 F).
| Alienware m16 R1 Intel Intel Core i7-13700HX, NVIDIA GeForce RTX 4060 Laptop GPU | Acer Predator Helios 16 PH16-71-731Q Intel Core i7-13700HX, NVIDIA GeForce RTX 4060 Laptop GPU | Medion Erazer Defender P40 Intel Core i7-13700HX, NVIDIA GeForce RTX 4060 Laptop GPU | Lenovo Legion Pro 5 16IRX8 Intel Core i7-13700HX, NVIDIA GeForce RTX 4060 Laptop GPU | SCHENKER XMG Pro 15 (E23) Intel Core i9-13900HX, NVIDIA GeForce RTX 4060 Laptop GPU | Aorus 15 BSF Intel Core i7-13700H, NVIDIA GeForce RTX 4070 Laptop GPU | Alienware m16 R1 AMD AMD Ryzen 9 7845HX, NVIDIA GeForce RTX 4080 Laptop GPU | |
|---|---|---|---|---|---|---|---|
| Heat | -2% | 18% | 12% | 7% | 4% | 9% | |
| Maximum Upper Side * | 49 | 41 16% | 42 14% | 42.8 13% | 50 -2% | 48 2% | 48 2% |
| Maximum Bottom * | 48 | 66 -38% | 45 6% | 50 -4% | 50 -4% | 47 2% | 39 19% |
| Idle Upper Side * | 40 | 36 10% | 28 30% | 29.6 26% | 33 17% | 39 2% | 37 7% |
| Idle Bottom * | 39 | 37 5% | 30 23% | 34 13% | 32 18% | 35 10% | 36.2 7% |
* ... smaller is better
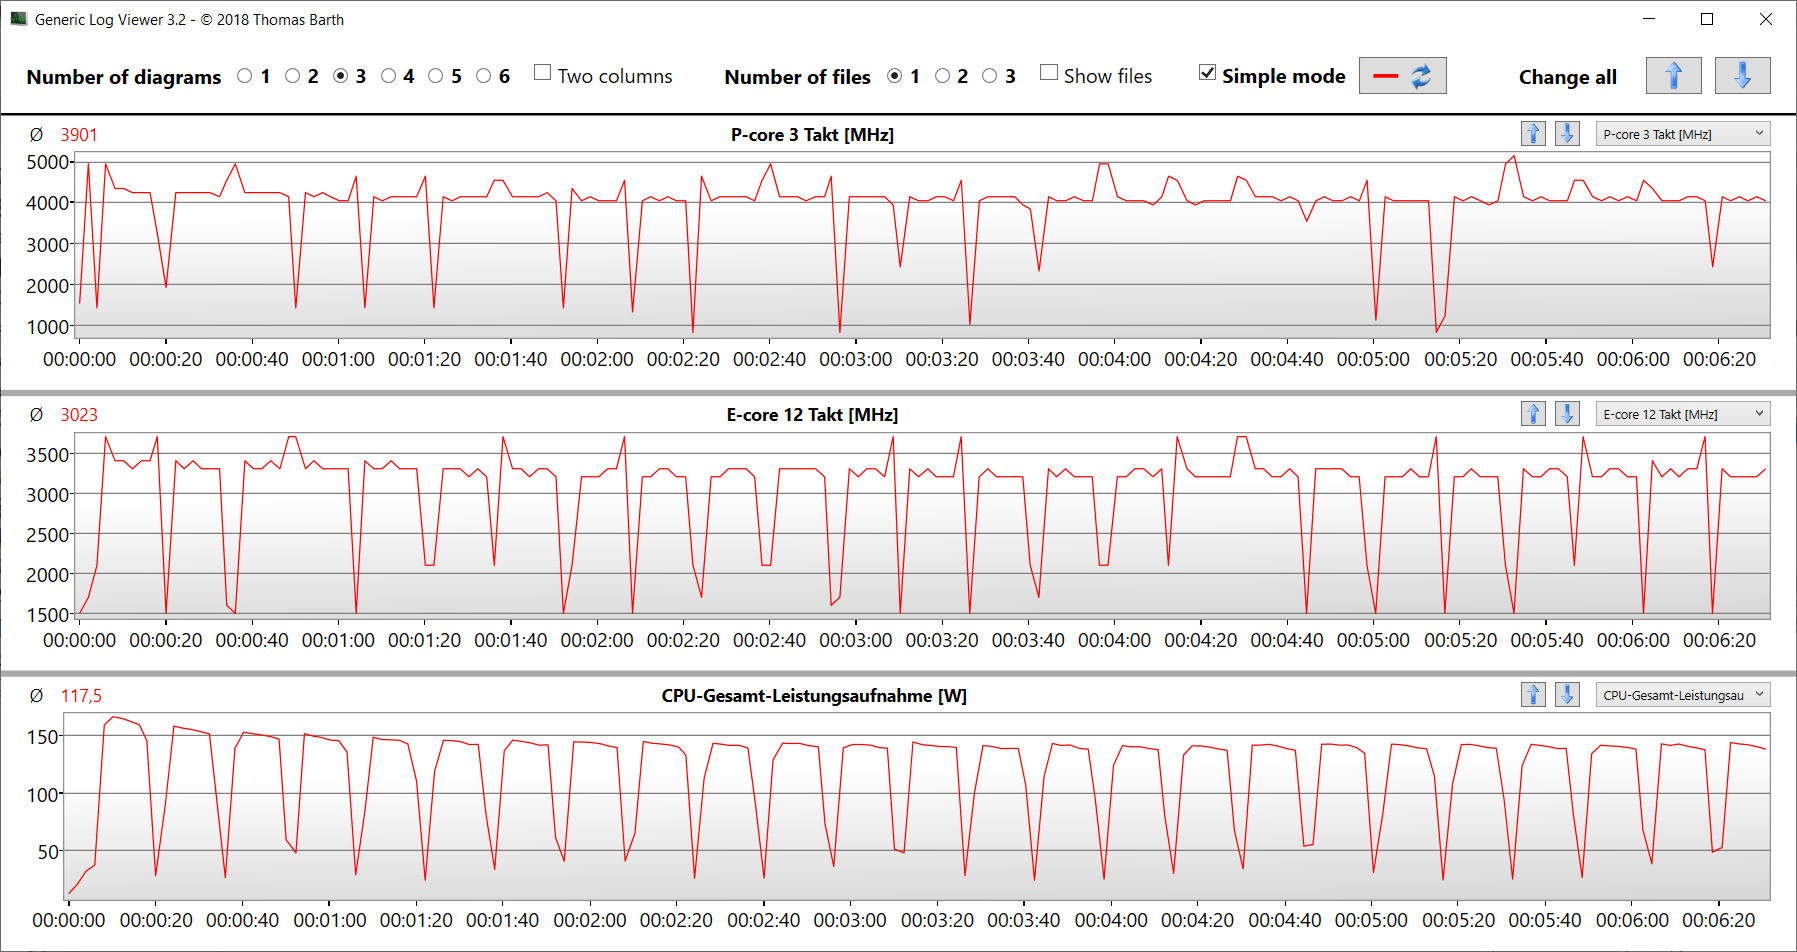
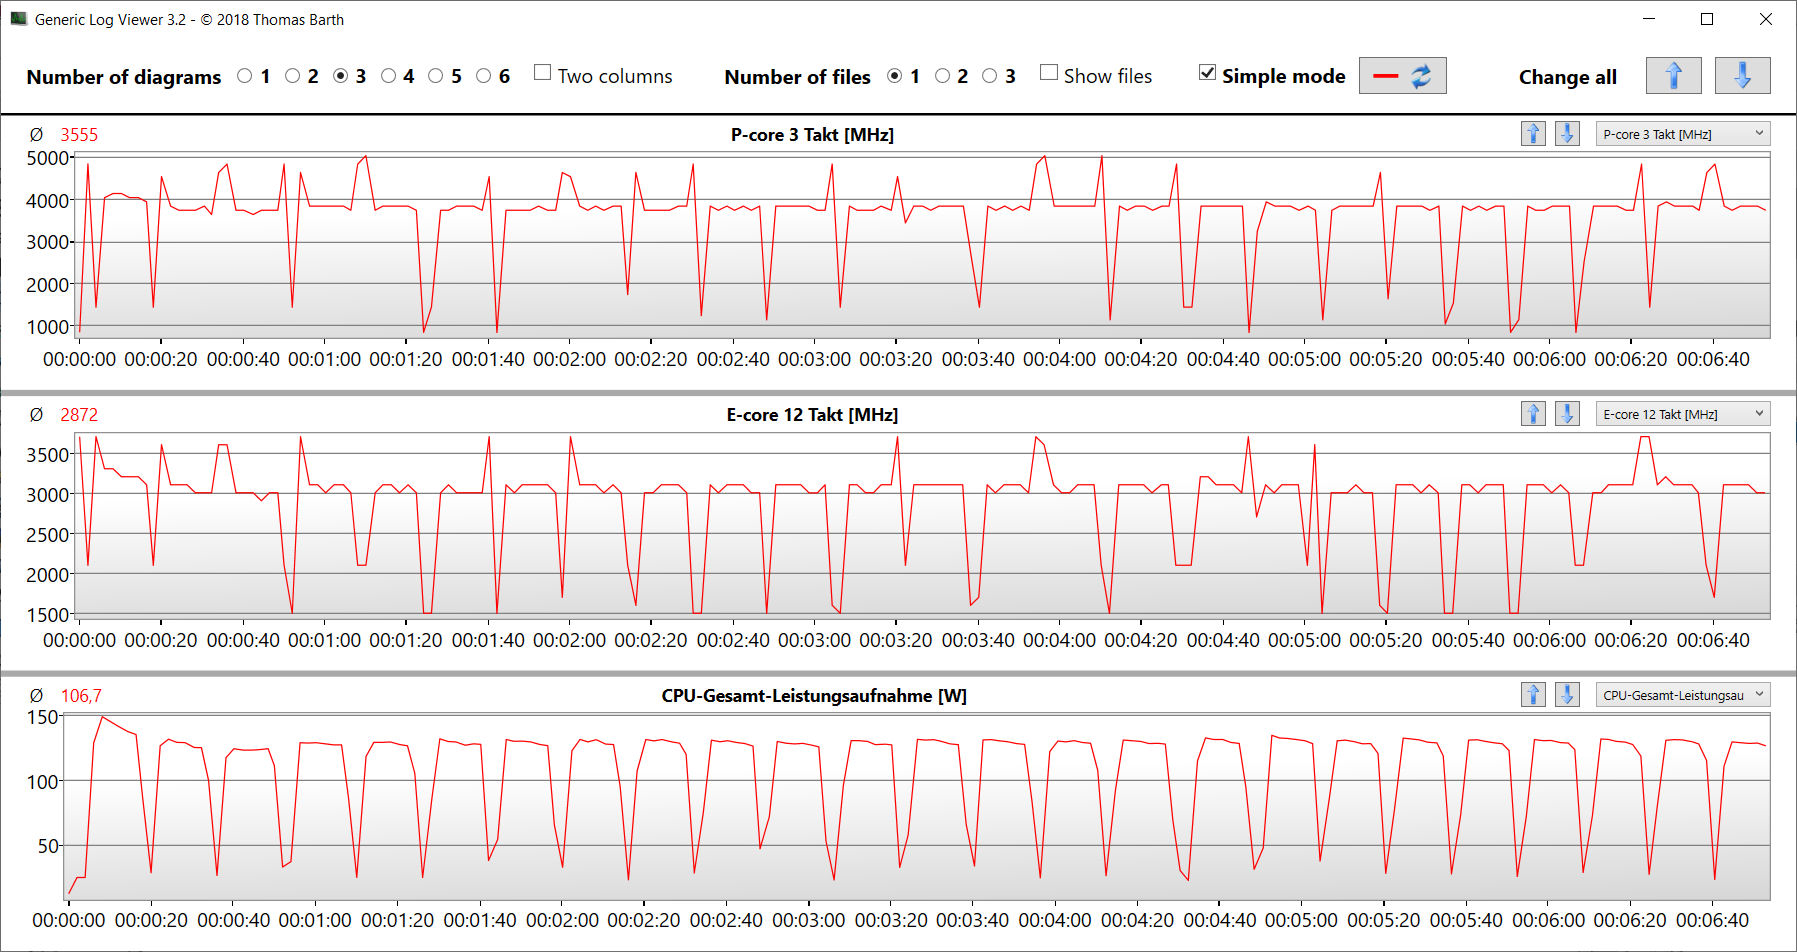
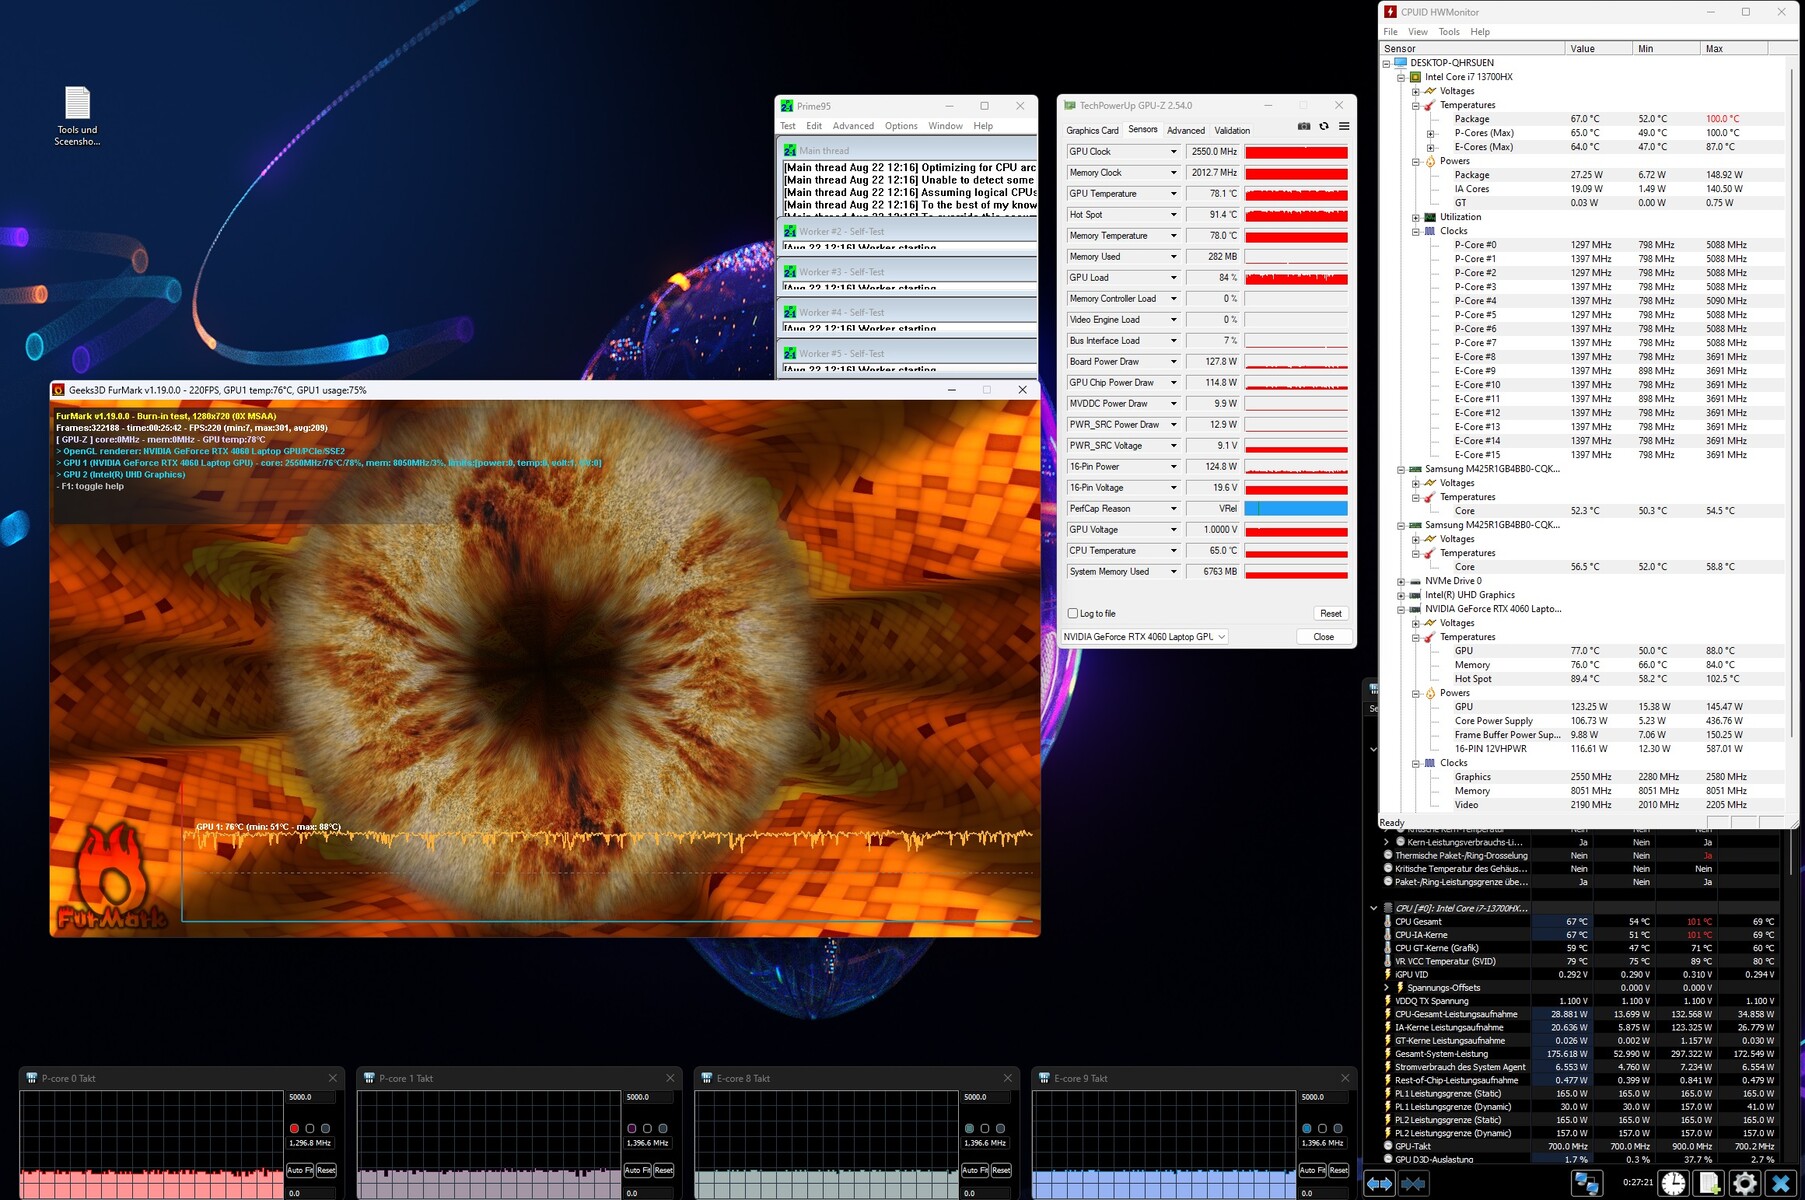
Stress Testing
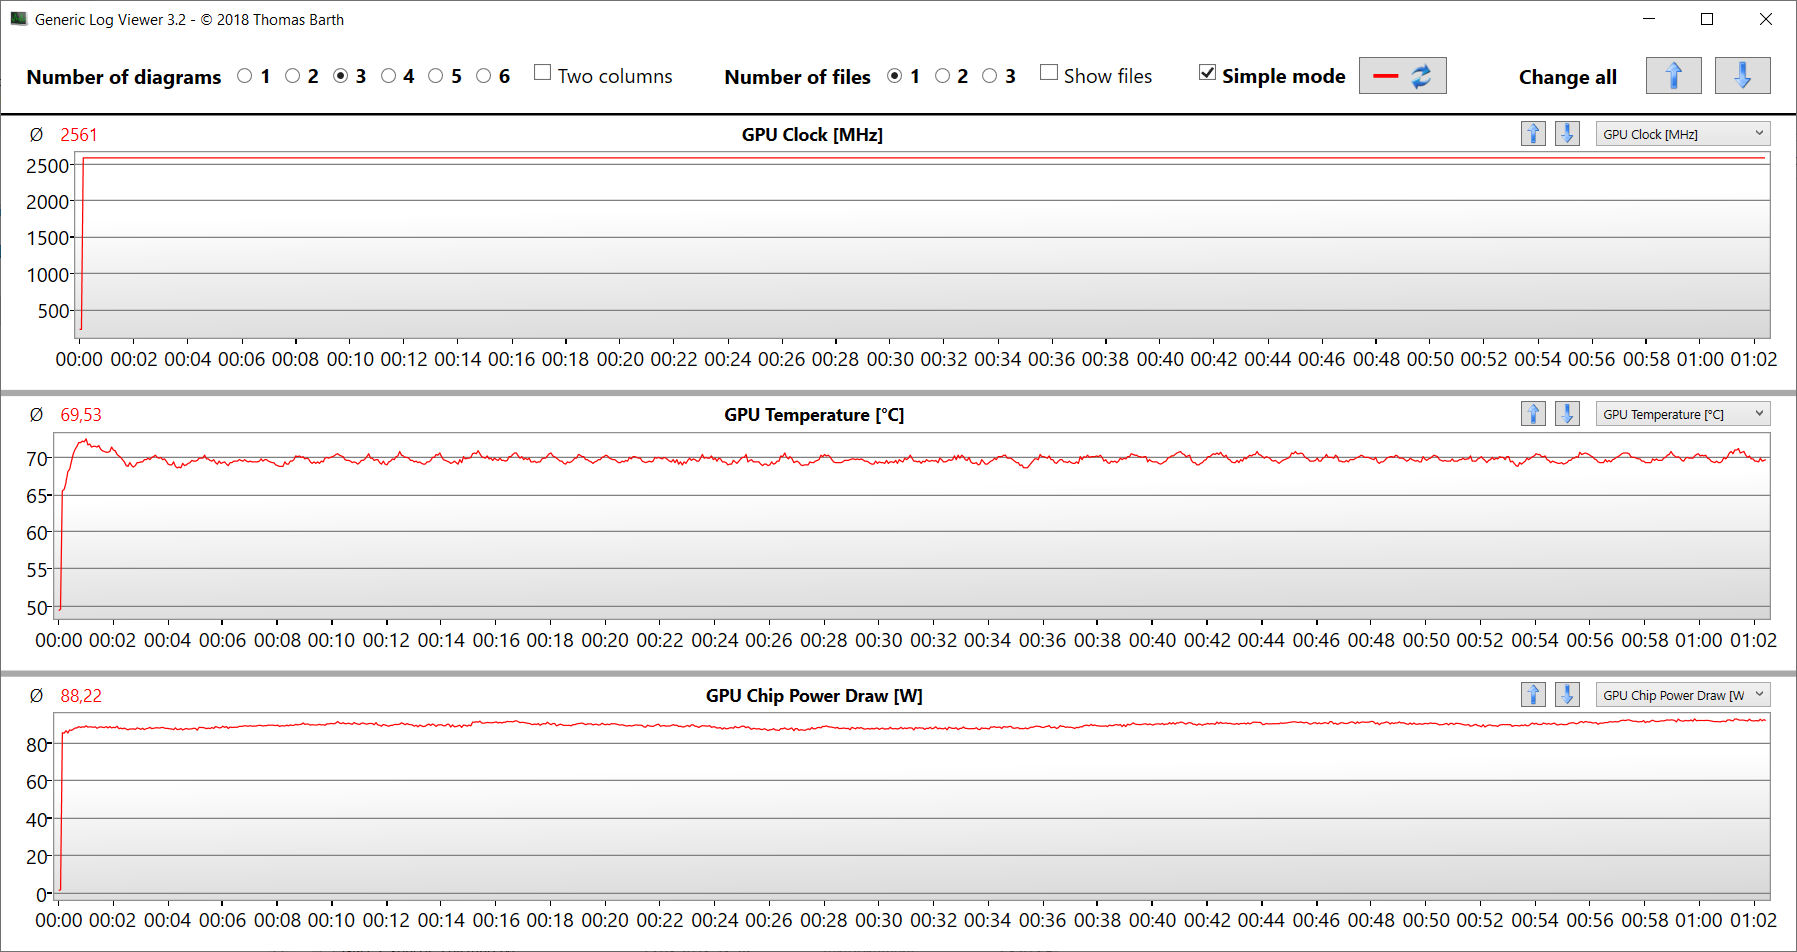
The stress test (Prime95 and Furmark in continuous operation) represents an extreme scenario for checking system stability under full load. The CPU (P: 4.2 GHz, E: 3.4 GHz) starts the test with high clock rates. As the test progresses, the clock drops slightly until it suddenly falls to values below the base clock after about 30 minutes. The GPU constantly works at full power.
Speakers
The stereo speakers produce decent sound, but there is hardly any bass. Headphones or external speakers are recommended for better sound experience.
Alienware m16 R1 Intel audio analysis
(+) | speakers can play relatively loud (87 dB)
Bass 100 - 315 Hz
(-) | nearly no bass - on average 24% lower than median
(±) | linearity of bass is average (13.5% delta to prev. frequency)
Mids 400 - 2000 Hz
(+) | balanced mids - only 1.4% away from median
(+) | mids are linear (3.3% delta to prev. frequency)
Highs 2 - 16 kHz
(+) | balanced highs - only 3.5% away from median
(+) | highs are linear (4.6% delta to prev. frequency)
Overall 100 - 16.000 Hz
(+) | overall sound is linear (13.4% difference to median)
Compared to same class
» 18% of all tested devices in this class were better, 6% similar, 76% worse
» The best had a delta of 6%, average was 18%, worst was 132%
Compared to all devices tested
» 11% of all tested devices were better, 3% similar, 86% worse
» The best had a delta of 4%, average was 25%, worst was 134%
Acer Predator Helios 16 PH16-71-731Q audio analysis
(±) | speaker loudness is average but good (76.12 dB)
Bass 100 - 315 Hz
(-) | nearly no bass - on average 15% lower than median
(-) | bass is not linear (15% delta to prev. frequency)
Mids 400 - 2000 Hz
(+) | balanced mids - only 2.5% away from median
(+) | mids are linear (5.9% delta to prev. frequency)
Highs 2 - 16 kHz
(+) | balanced highs - only 2.9% away from median
(±) | linearity of highs is average (8.4% delta to prev. frequency)
Overall 100 - 16.000 Hz
(+) | overall sound is linear (13.6% difference to median)
Compared to same class
» 19% of all tested devices in this class were better, 6% similar, 75% worse
» The best had a delta of 6%, average was 18%, worst was 132%
Compared to all devices tested
» 11% of all tested devices were better, 4% similar, 85% worse
» The best had a delta of 4%, average was 25%, worst was 134%
Power Management - The m16 delivers meager runtimes
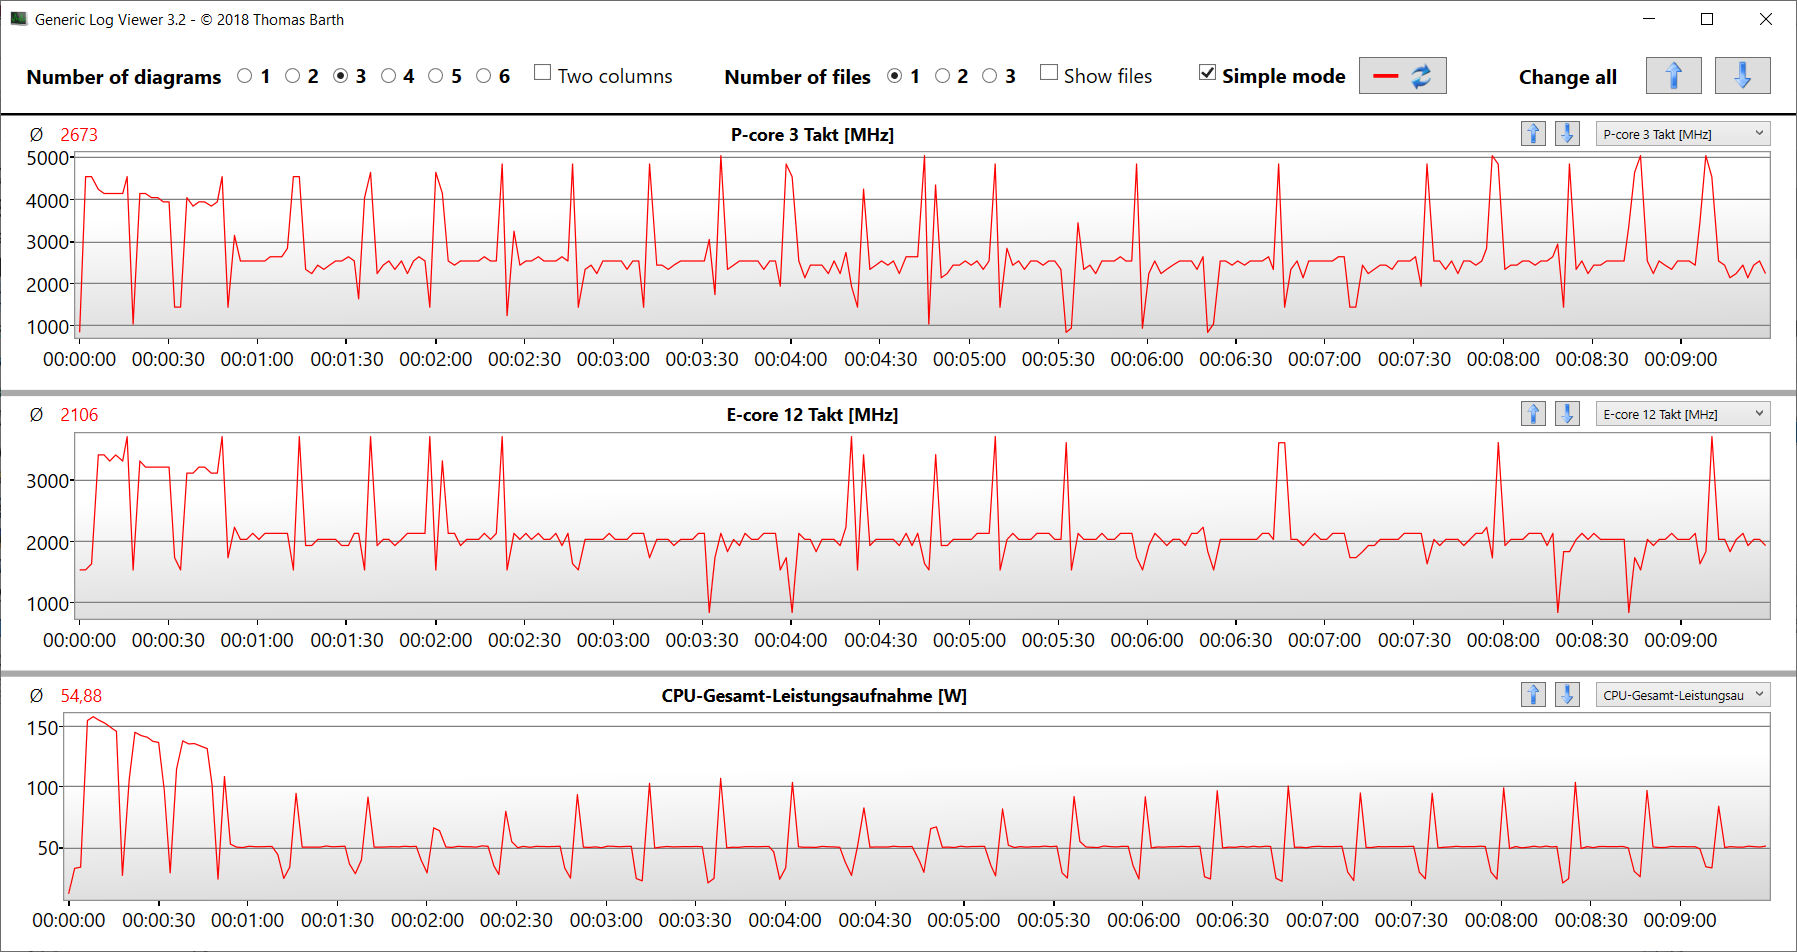
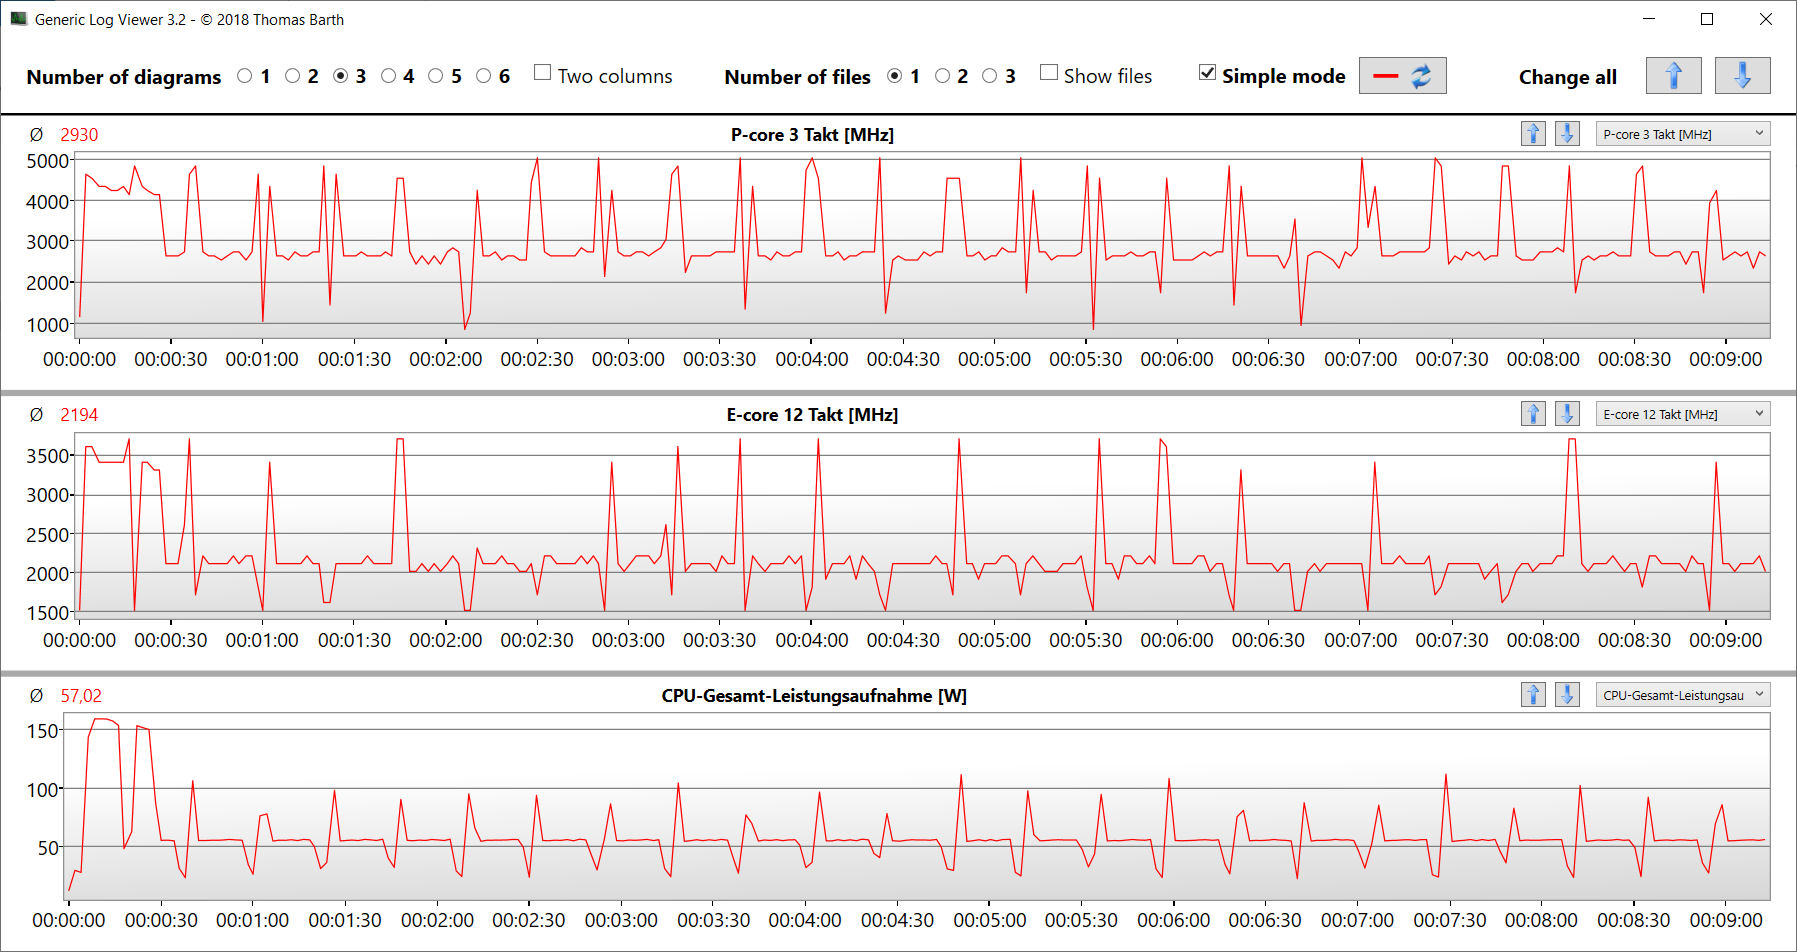
Power Consumption
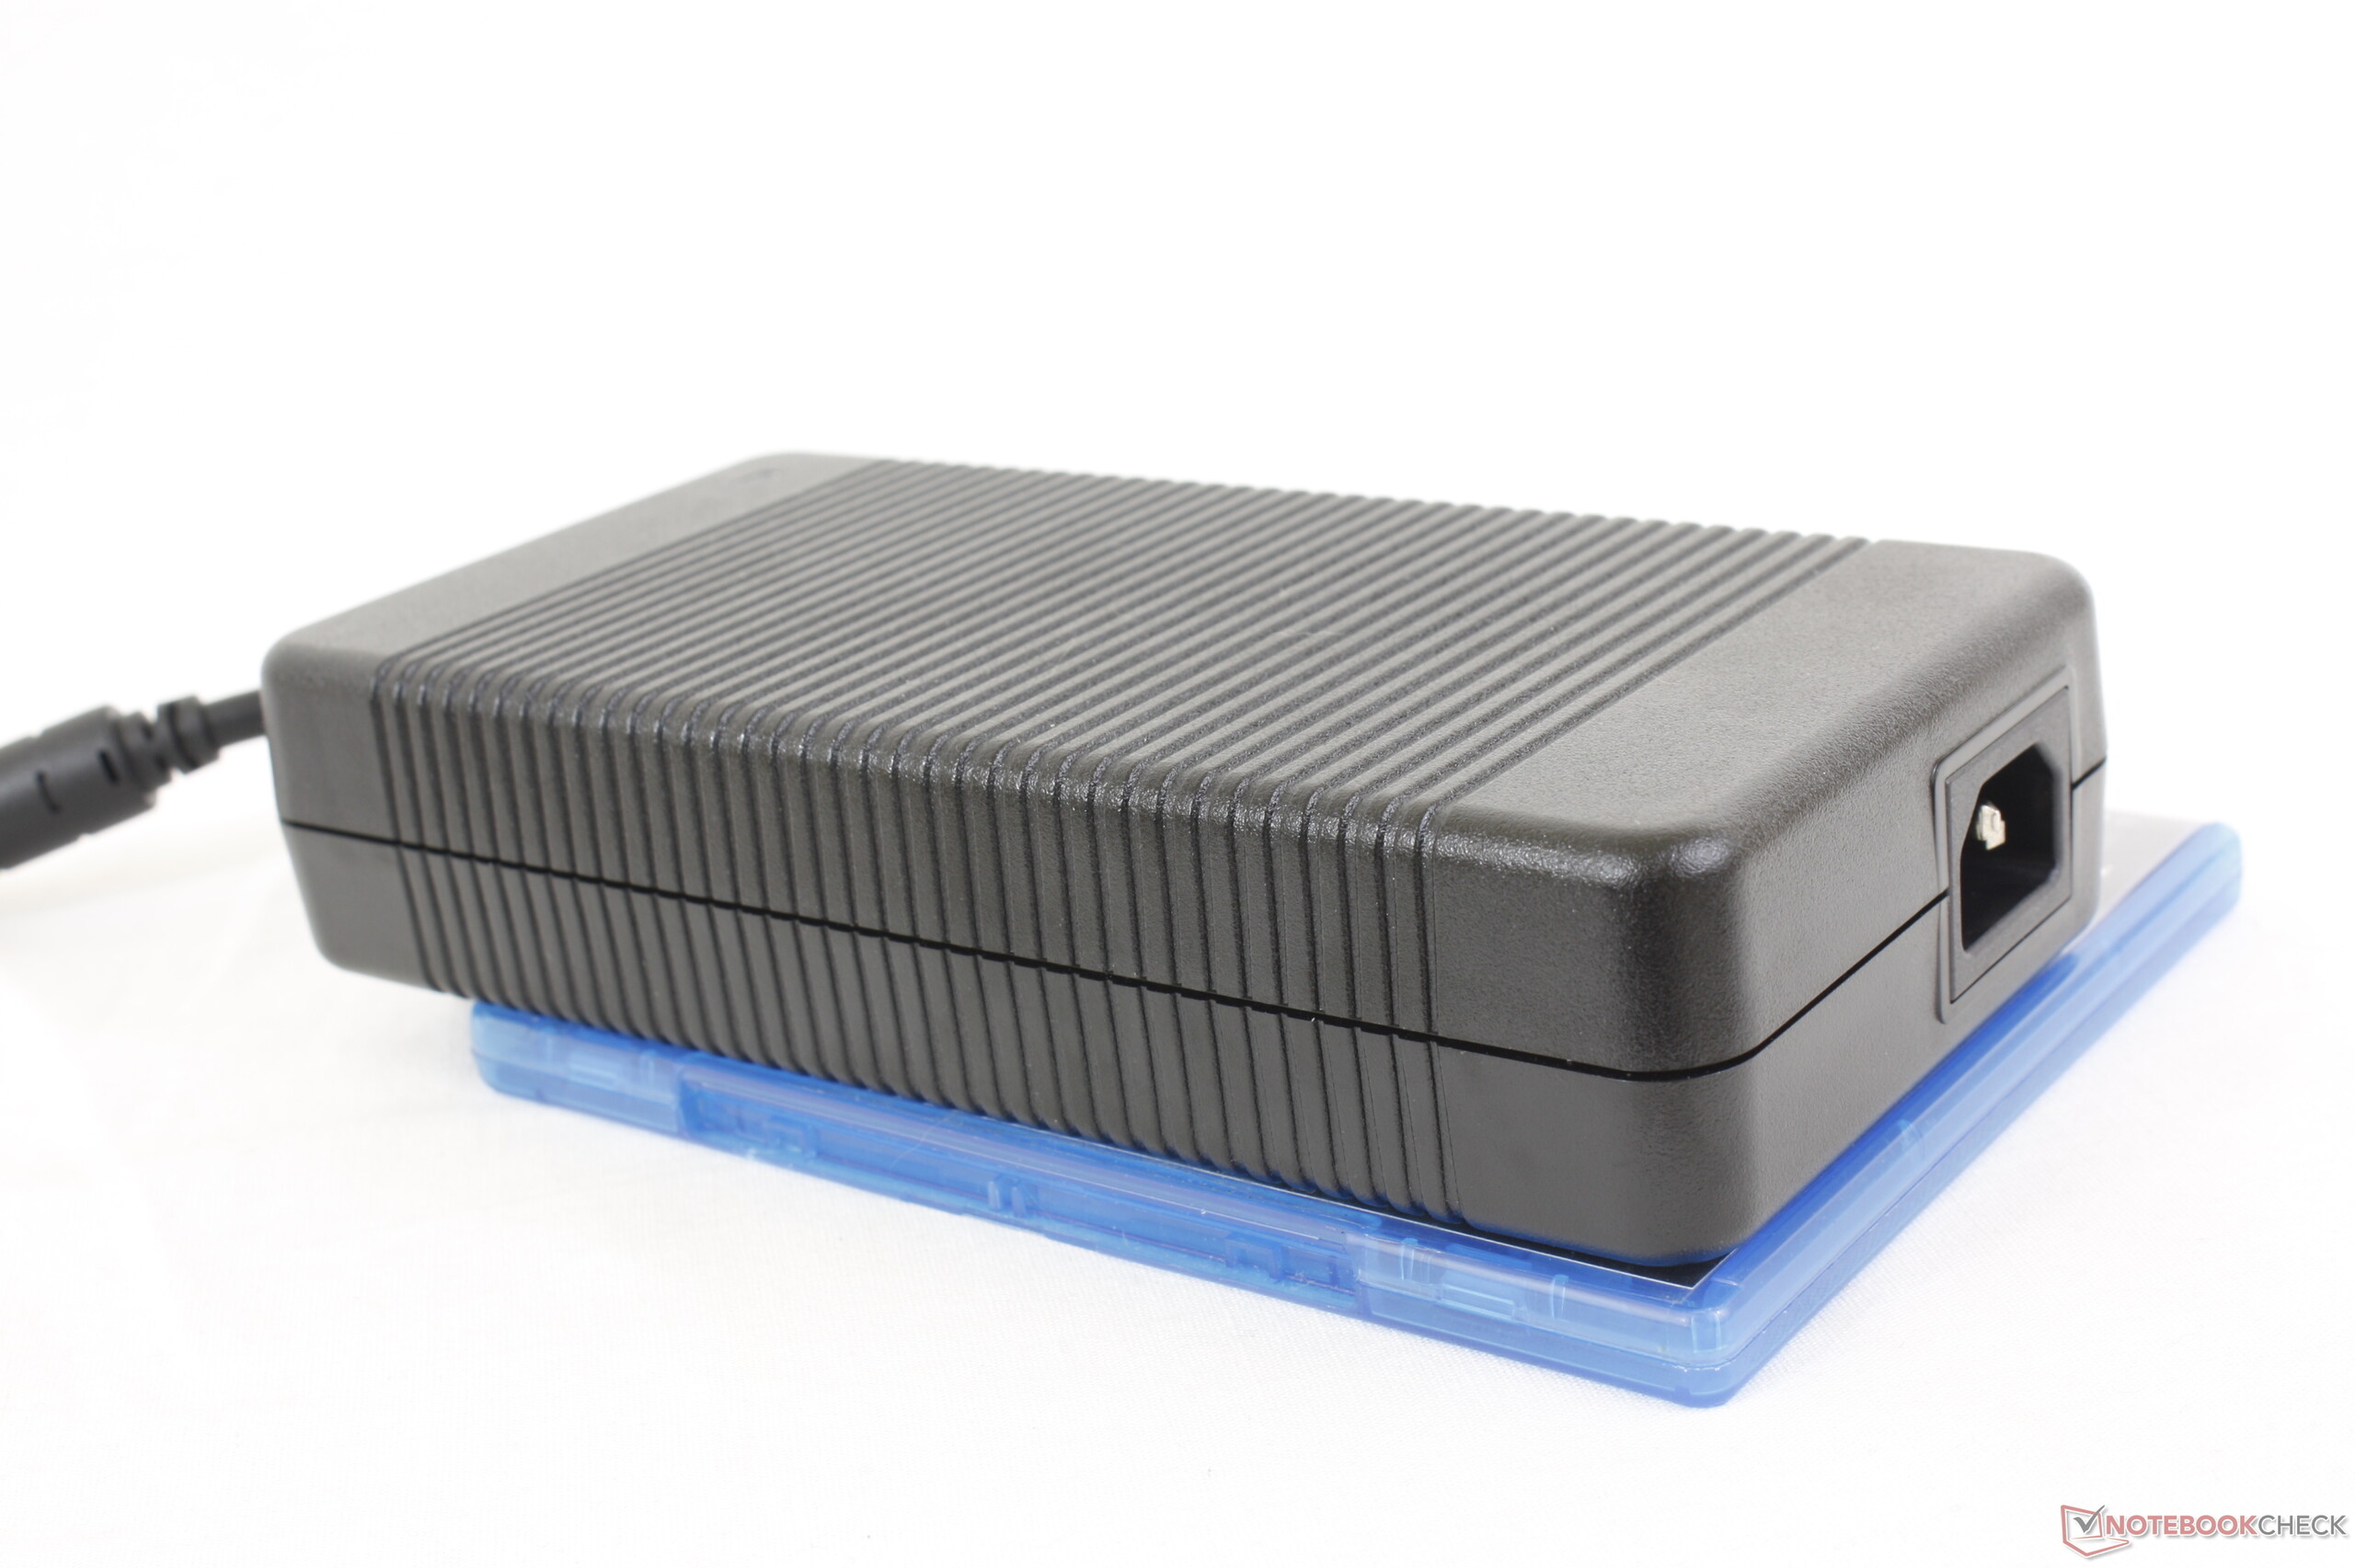
The m16 does not show any abnormalities in terms of energy consumption: the values are on a normal level for the installed hardware. The Witcher 3 test is run with constant power consumption. During the stress test, the demand decreases significantly over time. The power supply (330 watts) is thus sufficiently sized.
| Off / Standby | |
| Idle | |
| Load |
|
| Alienware m16 R1 Intel i7-13700HX, NVIDIA GeForce RTX 4060 Laptop GPU | Acer Predator Helios 16 PH16-71-731Q i7-13700HX, NVIDIA GeForce RTX 4060 Laptop GPU | Medion Erazer Defender P40 i7-13700HX, NVIDIA GeForce RTX 4060 Laptop GPU | Lenovo Legion Pro 5 16IRX8 i7-13700HX, NVIDIA GeForce RTX 4060 Laptop GPU | SCHENKER XMG Pro 15 (E23) i9-13900HX, NVIDIA GeForce RTX 4060 Laptop GPU | Aorus 15 BSF i7-13700H, NVIDIA GeForce RTX 4070 Laptop GPU | Alienware m16 R1 AMD R9 7845HX, NVIDIA GeForce RTX 4080 Laptop GPU | Average NVIDIA GeForce RTX 4060 Laptop GPU | Average of class Gaming | |
|---|---|---|---|---|---|---|---|---|---|
| Power Consumption | -12% | 13% | -46% | -62% | 17% | -133% | -0% | -15% | |
| Idle Minimum * | 10 | 15.9 -59% | 8 20% | 24.5 -145% | 21.6 -116% | 7 30% | 39 -290% | 12.9 ? -29% | 13.8 ? -38% |
| Idle Average * | 14 | 20.5 -46% | 12 14% | 29.2 -109% | 29 -107% | 12 14% | 44.6 -219% | 17 ? -21% | 19.1 ? -36% |
| Idle Maximum * | 21 | 20.9 -0% | 18 14% | 34.3 -63% | 42.7 -103% | 20 5% | 68.1 -224% | 21.5 ? -2% | 26.8 ? -28% |
| Load Average * | 119 | 106 11% | 101 15% | 98.7 17% | 190 -60% | 94 21% | 129.8 -9% | 97.2 ? 18% | 111 ? 7% |
| Witcher 3 ultra * | 186.7 | 175 6% | 180.8 3% | 178.6 4% | 189 -1% | 175.8 6% | 285 -53% | ||
| Load Maximum * | 323 | 276 15% | 284 12% | 249.6 23% | 269 17% | 247 24% | 327.3 -1% | 215 ? 33% | 251 ? 22% |
* ... smaller is better
Power consumption Witcher 3 / Stress test
Power consumption with an external monitor
Battery Life
The 16-incher achieves runtimes of 4:46 h and 5:36 h in the WLAN test (loading websites via a script) and video test (short film Big Buck Bunny, H.264 coding, FHD, in a loop), respectively. During both tests, the notebook's energy saving functions were deactivated and the display brightness set to around 150 cd/m². The wireless modules were also disabled for the video test.
Overall, the m16 offers meager runtimes. Some competitors deliver much better rates here. The advantage over AMD's sister model is likely due to the latter's active dGPU mode.
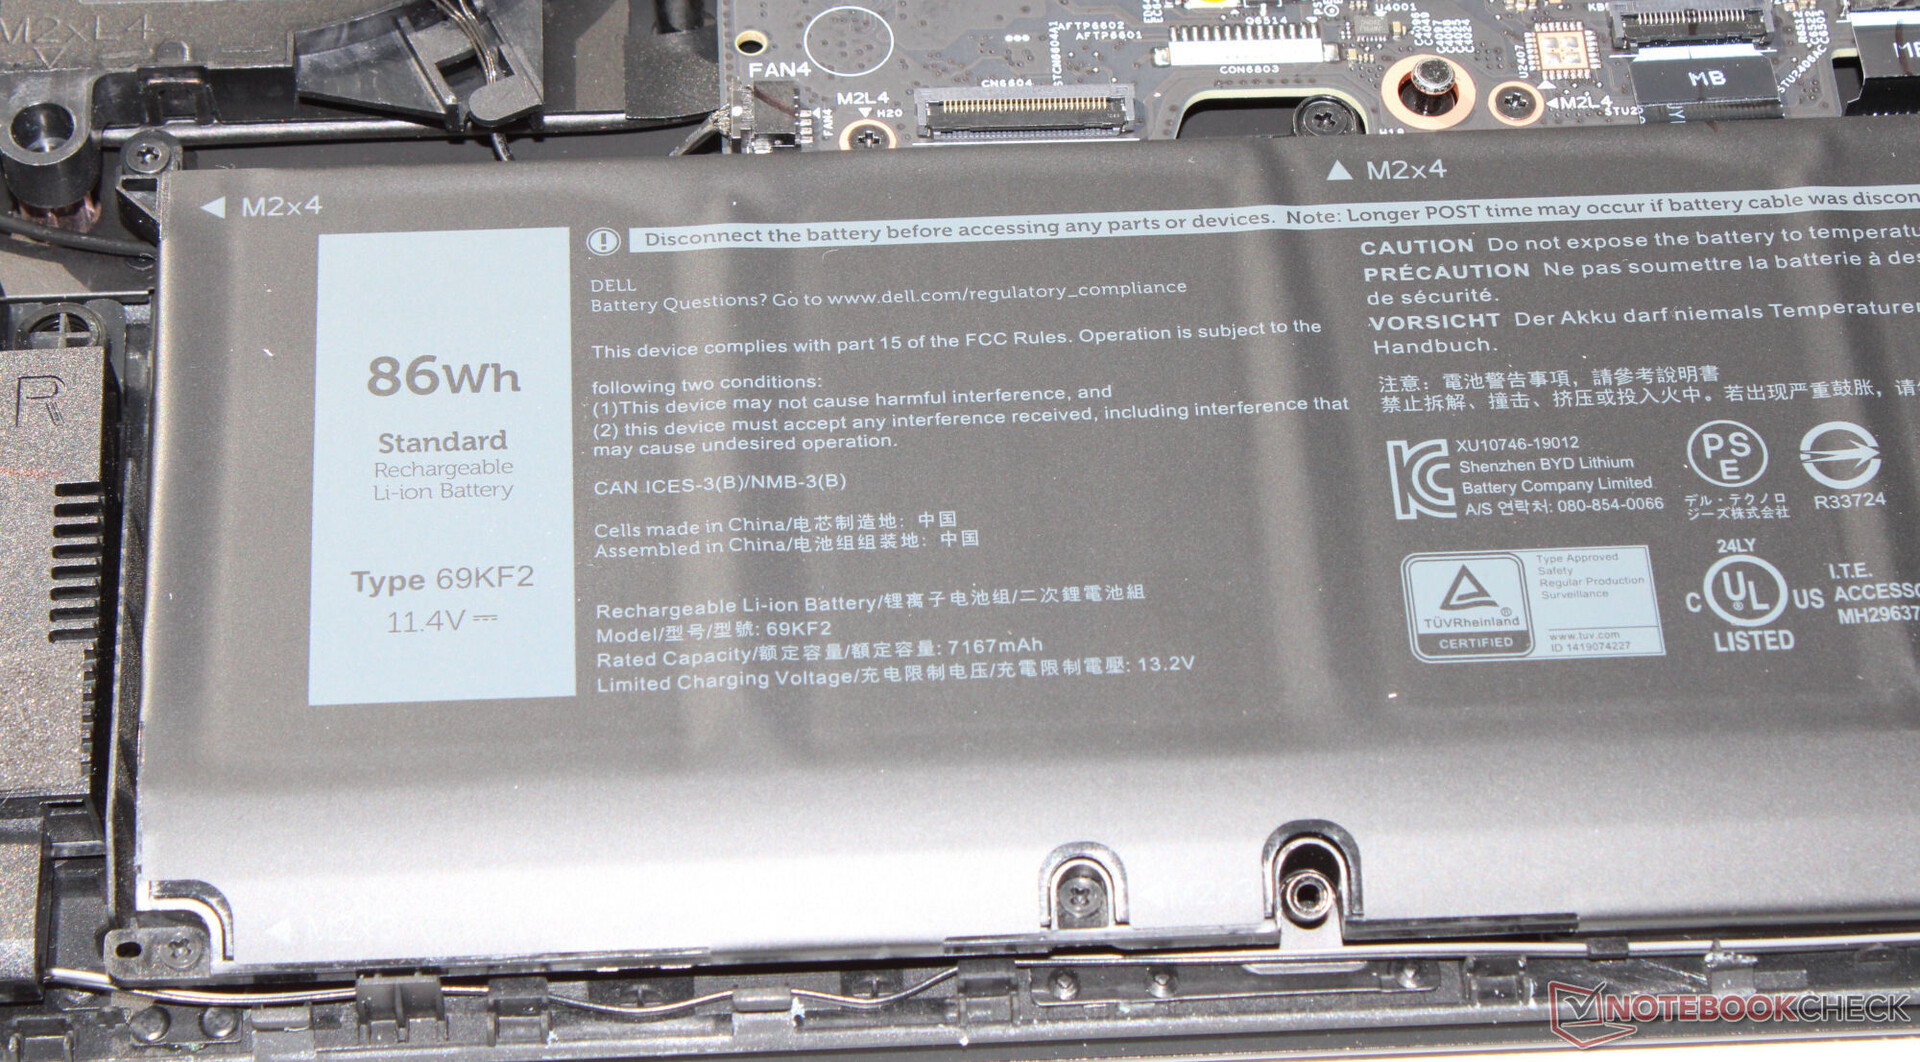
| Alienware m16 R1 Intel i7-13700HX, NVIDIA GeForce RTX 4060 Laptop GPU, 86 Wh | Acer Predator Helios 16 PH16-71-731Q i7-13700HX, NVIDIA GeForce RTX 4060 Laptop GPU, 90 Wh | Medion Erazer Defender P40 i7-13700HX, NVIDIA GeForce RTX 4060 Laptop GPU, 73 Wh | Lenovo Legion Pro 5 16IRX8 i7-13700HX, NVIDIA GeForce RTX 4060 Laptop GPU, 80 Wh | SCHENKER XMG Pro 15 (E23) i9-13900HX, NVIDIA GeForce RTX 4060 Laptop GPU, 80 Wh | Aorus 15 BSF i7-13700H, NVIDIA GeForce RTX 4070 Laptop GPU, 99 Wh | Alienware m16 R1 AMD R9 7845HX, NVIDIA GeForce RTX 4080 Laptop GPU, 86 Wh | Average of class Gaming | |
|---|---|---|---|---|---|---|---|---|
| Battery Runtime | 15% | 23% | -19% | 53% | 90% | -27% | 32% | |
| Reader / Idle | 383 | 528 38% | 401 5% | 654 71% | 239 -38% | 543 ? 42% | ||
| H.264 | 336 | 286 -15% | 339 1% | 541 61% | 399 ? 19% | |||
| WiFi v1.3 | 286 | 338 18% | 373 30% | 205 -28% | 343.1 20% | 619 116% | 224 -22% | 369 ? 29% |
| Load | 62 | 88 42% | 76 23% | 41 -34% | 115 85% | 132 113% | 49 -21% | 84.5 ? 36% |
| Witcher 3 ultra | 87 | 78.5 ? |
Pros
Cons
Verdict - Powerful gaming machine
Our variant of the Alienware m16 R1 - the entry-level model of the series - is designed for QHD+ gaming and rendering. The Core i7-13700HX and the GeForce RTX 4060 provide the necessary power. Both components work at mostly high clock speeds and an acceptable compromise between performance and noise is possible.
Dell delivers a powerful QHD+ gaming notebook in the Alienware m16 R1. Only secondary characteristics are deserving of criticism.
The IPS panel (16 inch, 2560x1600, sRGB, G-Sync) made a good impression overall. Alternatively, two other panels with higher refresh rates and greater color space coverage (DCI-P3) can be chosen. The hard drive offering (512 GB) is rather slim; 1 TB or 2 TB would be more suitable for the price of EUR 1900. Battery runtimes are also rather mediocre.
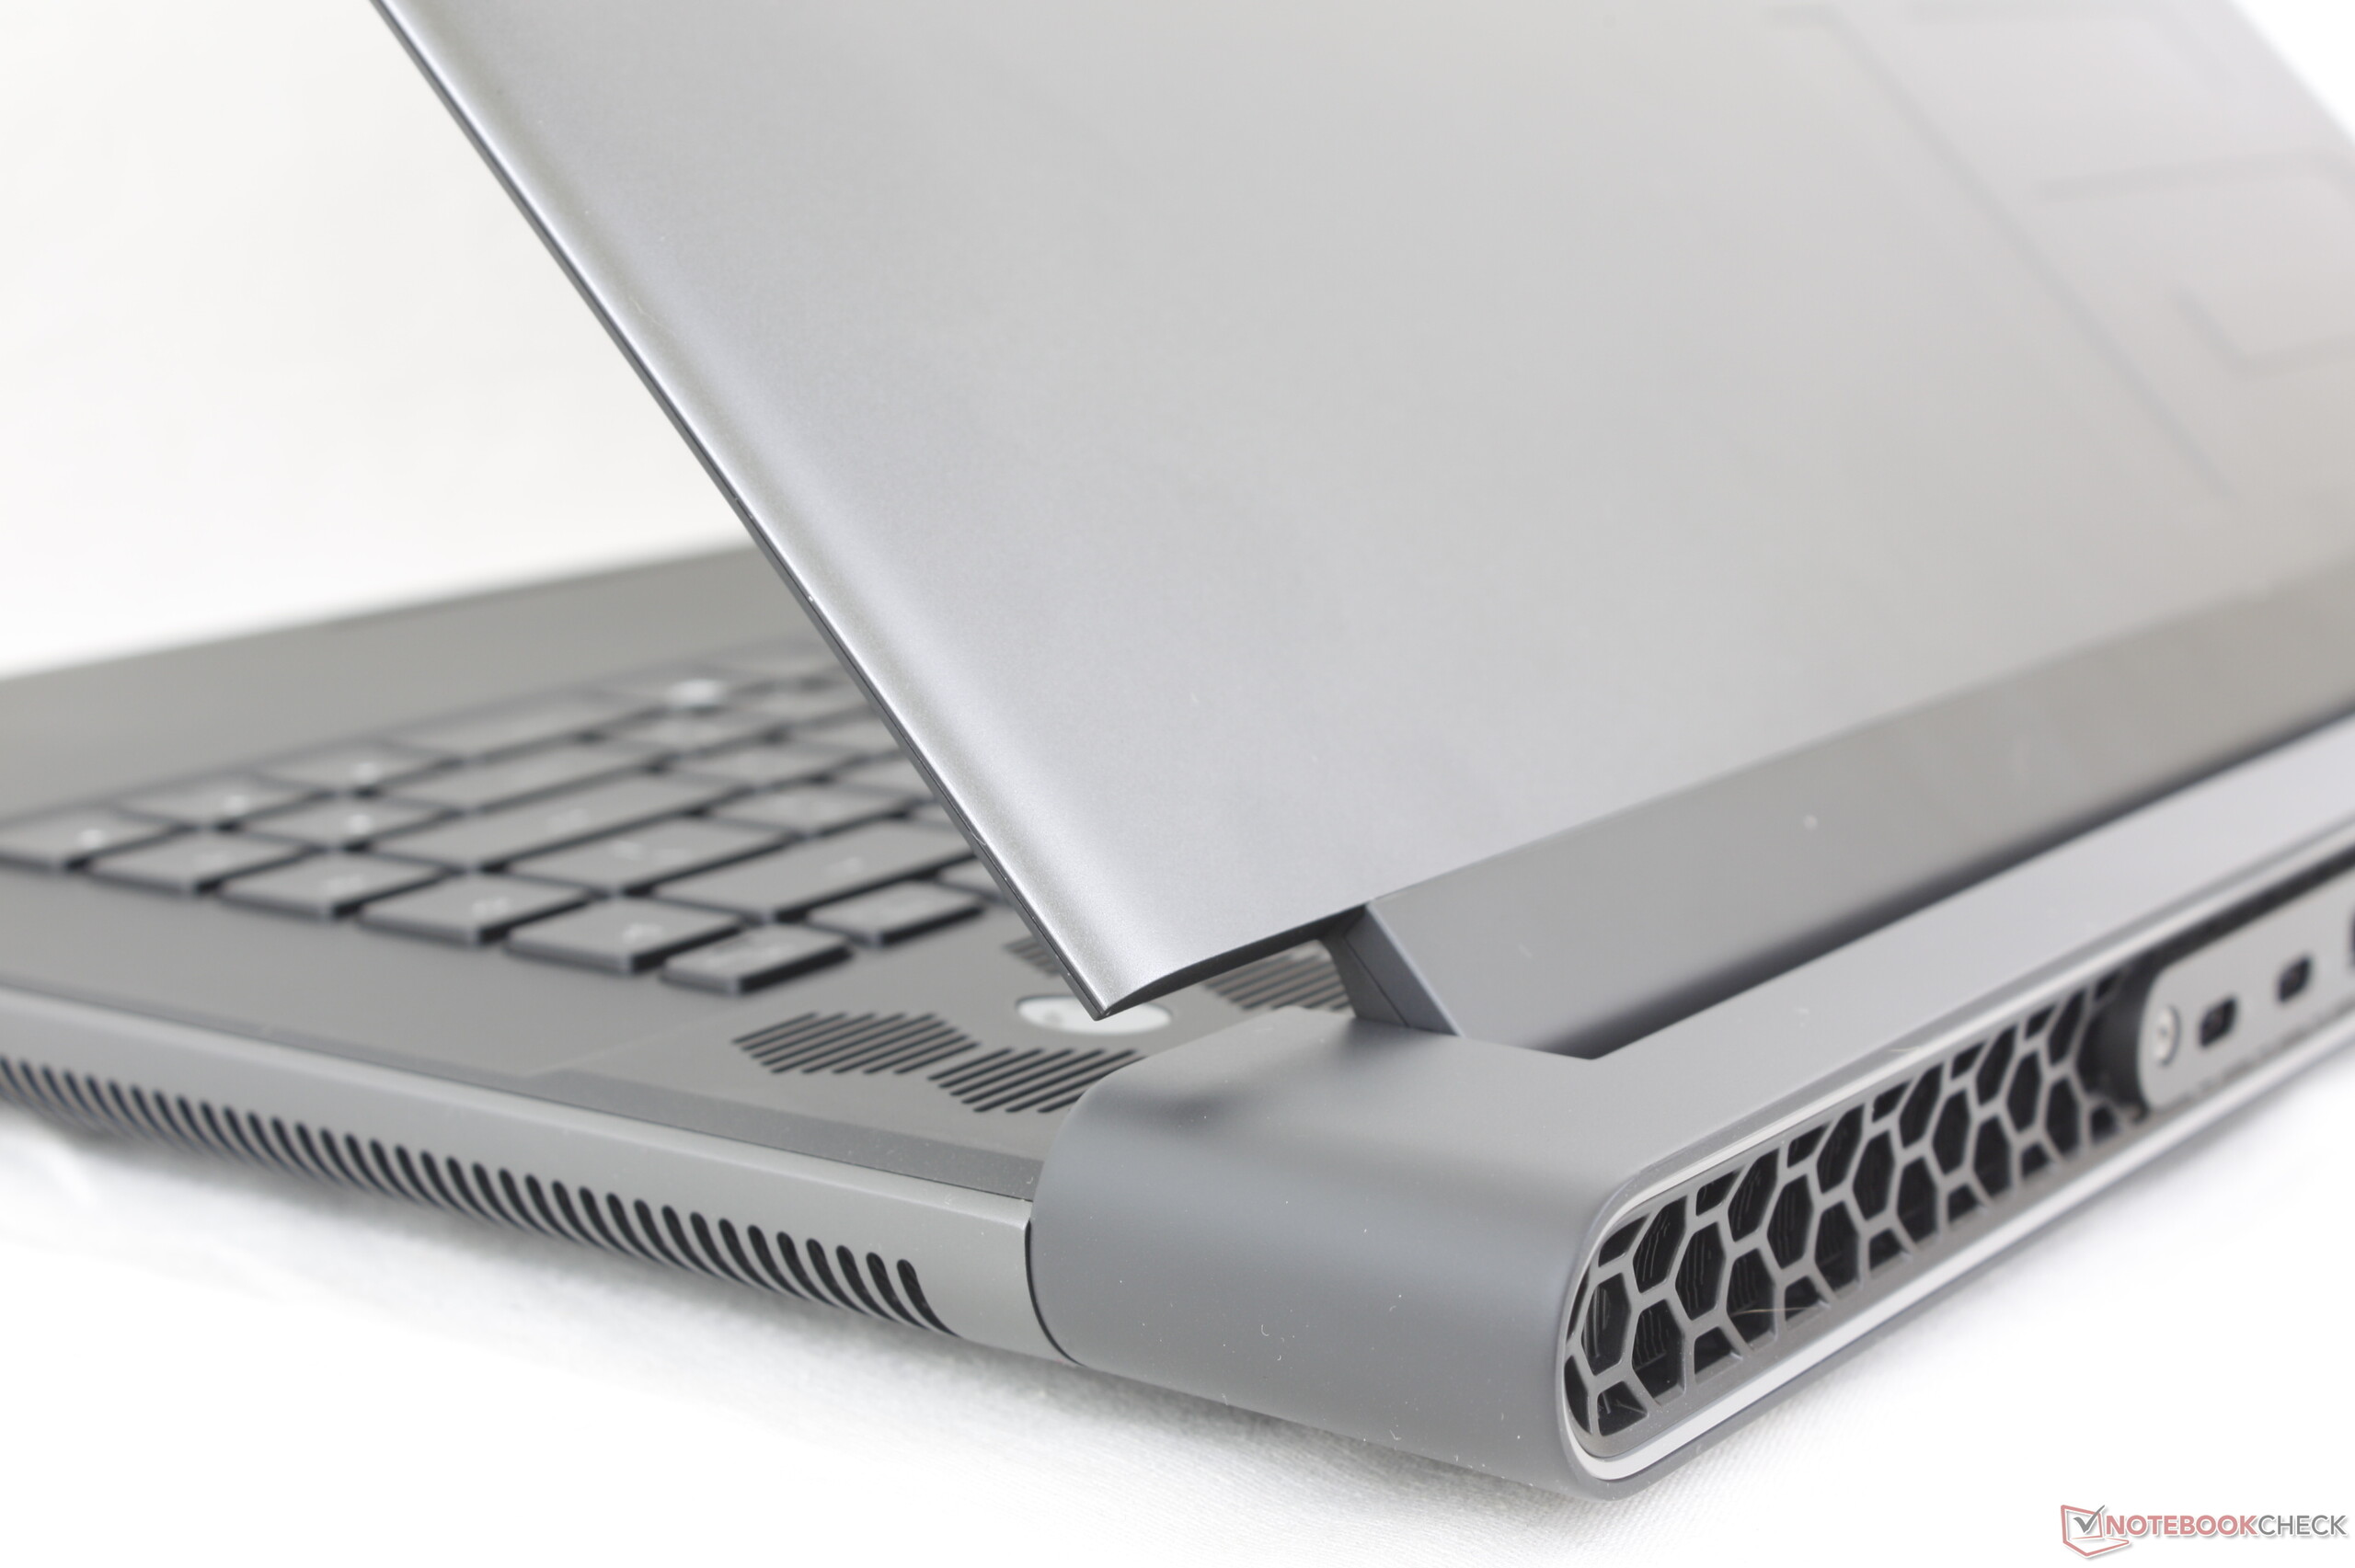
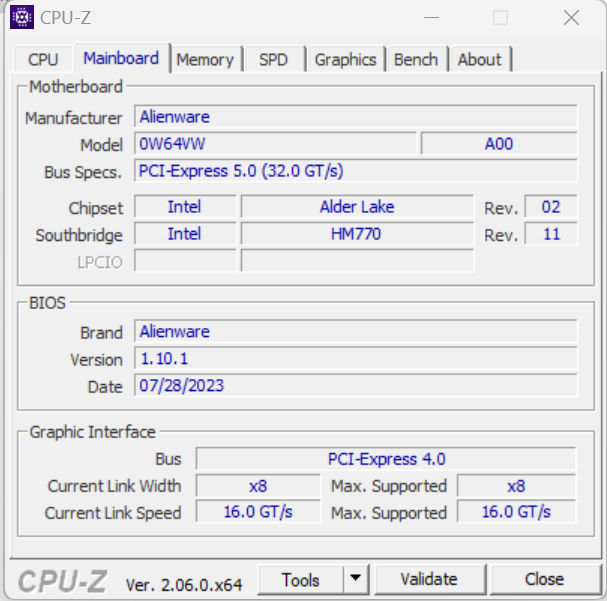
Two Thunderbolt 4 ports (Power Delivery, Displayport) ensure plentiful options for expansion (external GPU, docking). Power supply to the notebook via USB C is not possible; the USB C ports merely provide power.
An alternative is the Acer Predator Helios 16 PH16-71. It offers very much the same hardware configuration, but more hard drive space (1 TB). In addition, it scores with a brighter display.
Price and Availability
A configuration similar to our variant of the Alienware m16 R1, but with a 1 TB hard drive, is available in the US via Best Buy at a price of $1,999.99.
Prices are as of 05.09.2023 and are subject to change.
Alienware m16 R1 Intel
-
09/04/2023 v7
Sascha Mölck


Transparency
The present review sample was made available to the author as a loan by the manufacturer or a shop for the purposes of review. The lender had no influence on this review, nor did the manufacturer receive a copy of this review before publication. There was no obligation to publish this review.
Pricecompare

