

Intel Core i5-11500B vs Intel Core i7-9700 vs Intel Core i9-11900KB
Intel Core i5-11500B
► remove from comparison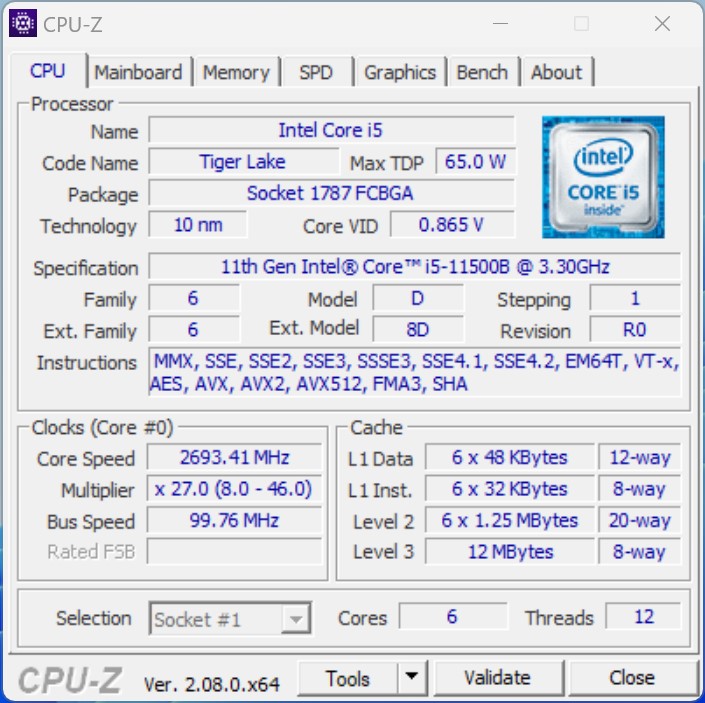
The Intel Core i5-11500B is a hexa-core processor for desktops and mini PCs. It is based on the Tiger Lake architecture (H45) and was presented in Q2 2021. The chip offers a TDP of 65 watts (configurable). The six processor cores can clock from 3.3 to 4.6 GHz (single-core turbo). The processor offers 12 MB level 3 cache and supports DDR4 RAM with up to 3,200 MT/s. The integrated graphics are based on the Xe architecture and are named UHD Graphics (32 EUs). In the 11500B it clocks from 350 to 1,450 MHz. The chip is manufactured using the 10 nm SuperFin process.
Performance
The performance of the Intel Core i5-11500B depends primarily on the performance of the installed cooling unit. The TDP of the SoC can also be lowered. In principle, however, the Intel Core i5-11500B should offer slightly more performance than an Intel Core i5-11400H (6 cores 2.7 - 4.5 GHz).
Features
As with the smaller Tiger Lake chips, Wi-Fi (Wi-Fi 6E) and Thunderbolt 4 / USB 4 are (partially) integrated into the chip for faster, cheaper and space-saving implementations in desktops and mini-PCs. The i5-11500B also offers 20 PCIe 4.0 lanes.
Intel Core i7-9700
► remove from comparisonThe Intel Core i7-9700 is a high end desktop processor based on the Coffee Lake architecture. It integrates 8 cores (no Hyperthreading therefore also 8 threads) clocked at 3 - 4.7 GHz. Compared to the similar named Core i7-9700K, the 9700 has no open multiplicator for easy overclocking, offers lower clock speeds and offers a reduced TDP.
Compared to the old Core i7-8700, the 9700 offers two more real cores but no Hyperthreading. Therefore, the performance gain is not that big - depending on the app. The single core performance was slightly improved thanks to the higher Turbo clocks. As a high end desktop CPU, the i7-9700 is well suited for demanding tasks and gaming.
The integrated Intel UHD Graphics 630 graphics card is clocked at up to 1.2 GHz and offers no advantage compared to previous generations. As it is a very low end GPU, only some low demanding games like Hearthstone can be played with it (see GPU page for benchmarks).
Intel specifies the TDP at 65 Watt (instead of the 95W of the faster models) and therefore the CPU wont need a high end desktop cooling system.
Intel Core i9-11900KB
► remove from comparisonThe Intel Core i9-11900KB is an Octa-Core-CPU that was used in the Intel Beast Canyon NUC. It is based on the Tiger-Lake-H45 series and was announced in the second quarter of 2021. The processor cores can clock from 3.3 to 5.3 GHz, all cores at once can reach up to 4.9 GHz. The CPU features 24 MB level 3 cache and DDR4-3200 memory. The integrated UHD graphics card is based on the Xe-architecture with 32 cores and clocks up to 1.45 GHz.
As with the slower Tiger Lake-H CPUs, the 11900KB has a partly integrated WiFi 6E and Thunderbolt 4 in the chip. Furthermore, the 11900KB supports 20 PCIe 4.0 lanes.
The TDP is rated at 65 Watt with 3.3. GHz base clock and can be configured to 55 Watt (cTDP-down).
| Model | Intel Core i5-11500B | Intel Core i7-9700 | Intel Core i9-11900KB | ||||||||||||||||||||||||||||||||||||||||||||||||||||||||||||||||||||||||||||||||||||||||||||||||||||||||||||||||
| Codename | Tiger Lake-H | Coffee Lake-R | Tiger Lake-H | ||||||||||||||||||||||||||||||||||||||||||||||||||||||||||||||||||||||||||||||||||||||||||||||||||||||||||||||||
| Series | Intel Tiger Lake | Intel Coffee Lake | Intel Tiger Lake | ||||||||||||||||||||||||||||||||||||||||||||||||||||||||||||||||||||||||||||||||||||||||||||||||||||||||||||||||
| Series: Tiger Lake Tiger Lake-H |
|
|
| ||||||||||||||||||||||||||||||||||||||||||||||||||||||||||||||||||||||||||||||||||||||||||||||||||||||||||||||||
| Clock | 3300 - 4600 MHz | 3000 - 4700 MHz | 3300 - 5300 MHz | ||||||||||||||||||||||||||||||||||||||||||||||||||||||||||||||||||||||||||||||||||||||||||||||||||||||||||||||||
| L1 Cache | 480 KB | 512 KB | 768 KB | ||||||||||||||||||||||||||||||||||||||||||||||||||||||||||||||||||||||||||||||||||||||||||||||||||||||||||||||||
| L2 Cache | 7.5 MB | 2 MB | 10 MB | ||||||||||||||||||||||||||||||||||||||||||||||||||||||||||||||||||||||||||||||||||||||||||||||||||||||||||||||||
| L3 Cache | 12 MB | 12 MB | 24 MB | ||||||||||||||||||||||||||||||||||||||||||||||||||||||||||||||||||||||||||||||||||||||||||||||||||||||||||||||||
| Cores / Threads | 6 / 12 | 8 / 8 | 8 / 16 | ||||||||||||||||||||||||||||||||||||||||||||||||||||||||||||||||||||||||||||||||||||||||||||||||||||||||||||||||
| TDP | 65 Watt | 65 Watt | 65 Watt | ||||||||||||||||||||||||||||||||||||||||||||||||||||||||||||||||||||||||||||||||||||||||||||||||||||||||||||||||
| Technology | 10 nm | 14++ nm | 10 nm | ||||||||||||||||||||||||||||||||||||||||||||||||||||||||||||||||||||||||||||||||||||||||||||||||||||||||||||||||
| max. Temp. | 100 °C | 100 °C | 100 °C | ||||||||||||||||||||||||||||||||||||||||||||||||||||||||||||||||||||||||||||||||||||||||||||||||||||||||||||||||
| Socket | BGA1787 | FCLGA1151 | BGA 1499 | ||||||||||||||||||||||||||||||||||||||||||||||||||||||||||||||||||||||||||||||||||||||||||||||||||||||||||||||||
| Features | DDR4-3200 RAM, PCIe 4, 8 GT/s bus, DL Boost, GNA, MMX, SSE, SSE2, SSE3, SSSE3, SSE4.1, SSE4.2, AVX, AVX2, AVX-512, BMI2, ABM, FMA, ADX, VMX, SMEP, SMAP, EIST, TM1, TM2, HT, Turbo, SST, AES-NI, RDRAND, RDSEED, SHA | Dual-Channel DDR4-2666 Memory Controller, HyperThreading, AVX, AVX2, AES-NI, TSX-NI, Quick Sync, Virtualization, vPro | AVX512, Intel Xe Graphics 32 EUs, DDR4-3200 | ||||||||||||||||||||||||||||||||||||||||||||||||||||||||||||||||||||||||||||||||||||||||||||||||||||||||||||||||
| iGPU | Intel UHD Graphics Xe 32EUs (Tiger Lake-H) (350 - 1450 MHz) | Intel UHD Graphics 630 (350 - 1200 MHz) | Intel UHD Graphics Xe 32EUs (Tiger Lake-H) (350 - 1450 MHz) | ||||||||||||||||||||||||||||||||||||||||||||||||||||||||||||||||||||||||||||||||||||||||||||||||||||||||||||||||
| Architecture | x86 | x86 | x86 | ||||||||||||||||||||||||||||||||||||||||||||||||||||||||||||||||||||||||||||||||||||||||||||||||||||||||||||||||
| Die Size | 178 mm2 | ||||||||||||||||||||||||||||||||||||||||||||||||||||||||||||||||||||||||||||||||||||||||||||||||||||||||||||||||||
| Announced | |||||||||||||||||||||||||||||||||||||||||||||||||||||||||||||||||||||||||||||||||||||||||||||||||||||||||||||||||||
| $539 U.S. |

Benchmarks

Average Benchmarks Intel Core i5-11500B → 100% n=41
Average Benchmarks Intel Core i7-9700 → 94% n=41
Average Benchmarks Intel Core i9-11900KB → 124% n=41
* Smaller numbers mean a higher performance
1 This benchmark is not used for the average calculation