Notebookcheck Logo

Intel Core Ultra 9 275HX vs Apple M4 Pro (12 cores)

Intel Core Ultra 9 275HX

► remove from comparison Intel Ultra 9 275HX

The Intel Core Ultra 9 275HX is a mobile high-end CPU for gaming notebooks based on the Arrow Lake architecture. It offers 24 cores consisting of 8 fast performance cores with up to 5.4 GHz and 16 smaller efficiency cores with up to 4.6 GHz clock speed. The CPU has access to 40 MB L2 cache and 36 MB L3 cache and is specified with a TDP of 55 watts.

The SoC integrates a small dedicated NPU called AI Boost with 13 TOPS (Int8) and optionally supports vPro Essentials. The integrated memory controller supports up to 192 GB DDR5-6400 (dual channel, ECC optional). The integrated GPU (iGPU) is a small Intel Graphics graphics card with four Xe cores running at 300 - 1900 MHz.

Performance - High End

The performance of the Ultra 9 275HX is only slightly behind the top model, the Core Ultra 9 285HX, due to the 100 MHz lower boost clock of the P-cores Core Ultra 9 285HX and therefore also remains below the similar Desktop Core Ultra 9 285K (higher clocked with up to 5.7 GHz and more TDP with 125 watts). Due to the improved IPC of the cores (especially the efficiency cores), the CPU should perform just behind or at the level of the Raptor Lake Core i9-14900HX (8 + 16 cores, max 5.8 / 4.1 GHz). This makes the CPU ideal for very demanding tasks such as high-end gaming and content creation.

Production - TSMC and Foveros

The Arrow Lake-HX chips are based on the desktop Arrow Lake-S chips and are composed of several chiplets. The CPU part is manufactured at TSMC in the modern N3B (3nm) process, the GPU also comes from TSMC in the N5P process. The SoC and I/O tile are manufactured in the TSMC N6 process. The base tile is manufactured by Intel in the 22nm process and carries the individual chiplets thanks to Fovero's 3D packaging.

Apple M4 Pro (12 cores)

► remove from comparison Apple M4 Pro (12 cores)

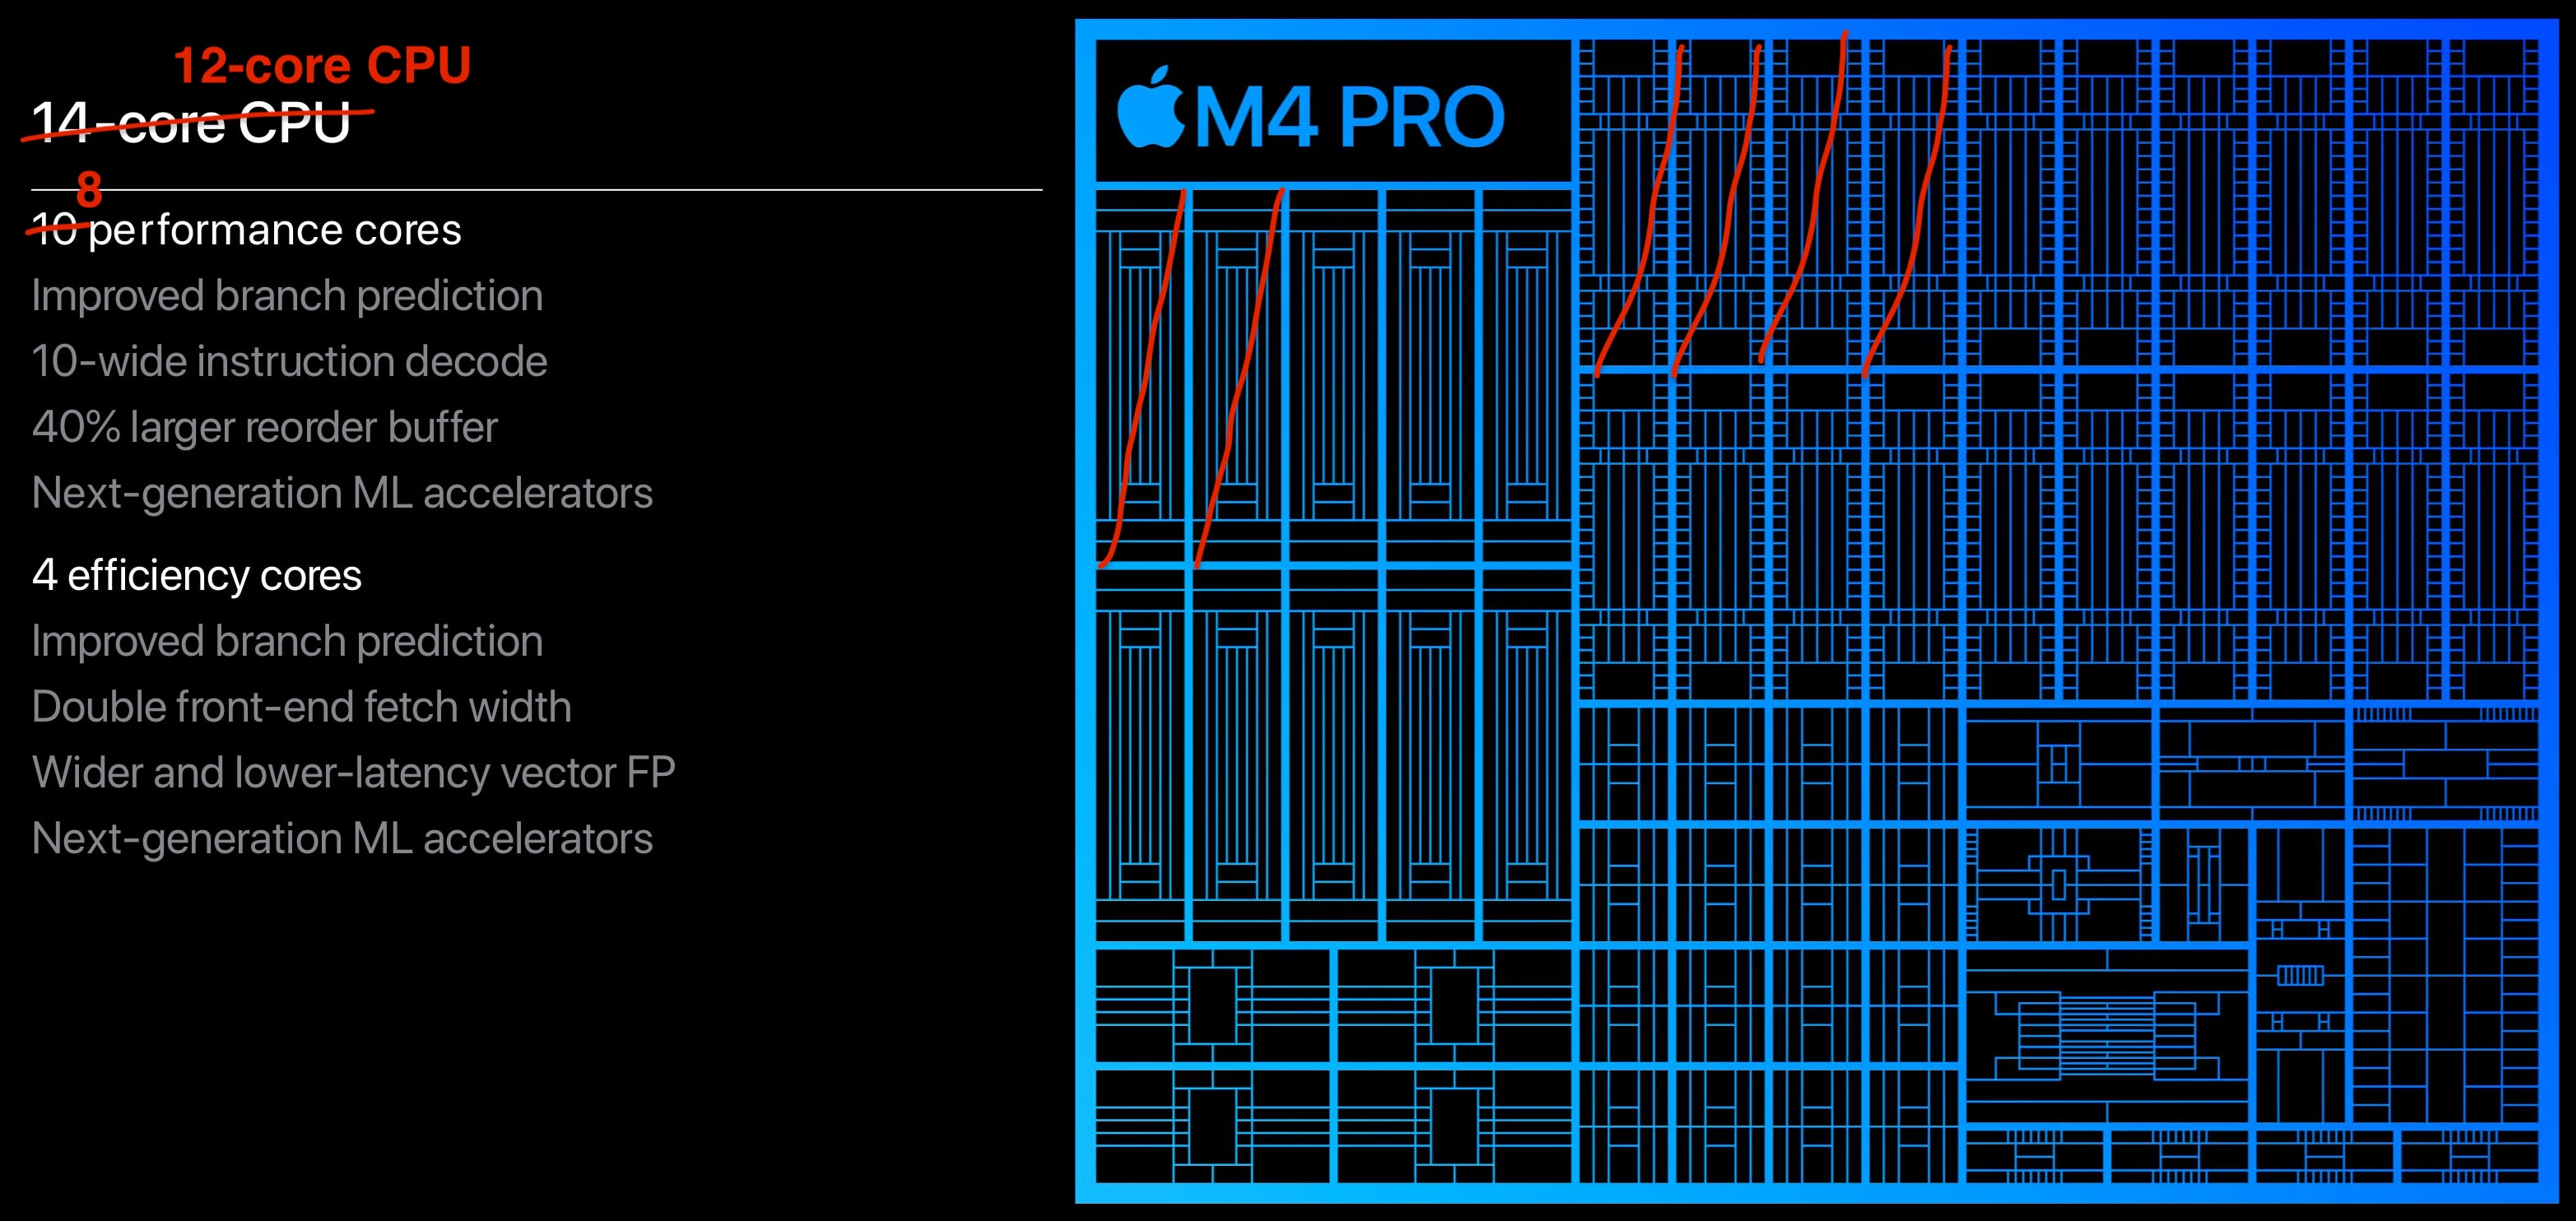
The Apple M4 Pro 12-Core CPU is a high-end SoC for laptops and mini PCs that was introduced in September 2024. It has 8 of the 10 powerful CPU cores running at up to 4.5 GHz and 4 efficient cores running at up to 2.6 GHz. The integrated 16-core GPU and at least 24 GB of fast LPDDR5x memory at 273 GB/s (depending on configuration) are included, as well as USB 4 and Thunderbolt 5 support.

The integrated neural engine with 16 cores (up to 38 TOPS) can be found in the entire M4 chip family. In addition, all M4 processors are assumed to be based on the ARM v9.4-A architecture to some degree.

The CPU performance when using all cores is similar to a AMD Ryzen AI 9 HX 370 (Cinebench R23 slightly faster on average). The modern Core Ultra 9 288V can be clearly outperformed. In terms of single-core performance, the M4 Pro scores very well and is on a par with the fastest Intel chips, such as the Core i9-14900HX. Interestingly enough, the M4 and the faster M4 Pro variant with 14 cores were 4-5% faster than the slimmed-down entry-level M4 Pro in Cinebench (Geekbench at the same level).

The power consumption during Cinebench 2024 Multi is around 40 Watt at the beginning (according to powermetrics) and then goes down to around 32 Watt (sustained). Combined with the GPU (Cinebench + Valley) the SoC can hit 47,5 Watt peak at the beginning, but then reduces its power draw to 31 Watt combined (22 W CPU + 9 W GPU).

The 3 nm TSMC process of the 2nd generation, with which the M4 Pro is manufactured, offers good energy efficiency.

ModelIntel Core Ultra 9 275HXApple M4 Pro (12 cores)
CodenameArrow Lake-HX
SeriesIntel Arrow LakeApple M4
Series: M4
Intel Core Ultra 9 285HX compare2.1 - 5.5 GHz24 / 24 cores36 MB L3
Intel Core Ultra 9 275HX « 2.1 - 5.4 GHz24 / 24 cores36 MB L3
Intel Core Ultra 7 265HX compare2.3 - 5.3 GHz20 / 20 cores36 MB L3
Intel Core Ultra 7 255HX compare2.3 - 5.2 GHz20 / 20 cores36 MB L3
Intel Core Ultra 5 245HX compare2.6 - 5.1 GHz14 / 14 cores26 MB L3
Intel Core Ultra 5 235HX compare2.6 - 5.1 GHz14 / 14 cores26 MB L3
Apple M4 Max (16 cores) compare2.59 - 4.51 GHz16 / 16 cores
Apple M4 Max (14 cores) compare2.59 - 4.51 GHz14 / 14 cores
Apple M4 Pro (14 cores) compare2.59 - 4.51 GHz14 / 14 cores
Apple M4 Pro (12 cores) « 2.59 - 4.51 GHz12 / 12 cores
Apple M4 (10 cores) compare2.89 - 4.46 GHz10 / 10 cores
Apple M4 (9 cores) compare2.9 - 4.4 GHz9 / 9 cores
Apple M4 (8 cores) compare2.9 - 4 GHz8 / 8 cores
Clock2100 - 5400 MHz2592 - 4512 MHz
L2 Cache40 MB4 MB
L3 Cache36 MB
Cores / Threads24 / 24
8 x 5.4 GHz Intel Lion Cove P-core
16 x 4.6 GHz Intel Skymont E-core
12 / 12
8 x 4.5 GHz Apple M4 P-Core
4 x 2.6 GHz Apple M4 E-Core
TDP55 Watt32 Watt
TDP Turbo PL2160 Watt40 Watt
Technology3 nm3 nm
iGPUIntel Graphics 4-Core iGPU (Arc) (300 - 1900 MHz)Apple M4 Pro 16-Core GPU
Architecturex86ARM
Announced
Manufacturerwww.intel.comwww.apple.com
FeaturesUnified Memory LPDDR5X-8533 (273 GB/s), 16-Core Neural Engine, Media Engine (Encoding / Decoding: H.264, HEVC, ProRes, ProRes RAW, AV1 Decoding only)

Benchmarks

Performance Rating - CB R15 + R20 + 7-Zip + X265 + Blender + 3DM11 CPU - Ultra 9 275HX
48.9 pt (81%)
Restrict / Search: Model: Max. age: years
Cinebench 2024 - Cinebench 2024 CPU Single Core
min: 123.1     avg: 134.2     median: 135.4 (76%)     max: 138.2 Points
min: 174     avg: 175     median: 175 (98%)     max: 176 Points
Cinebench 2024 - Cinebench 2024 CPU Multi Core
min: 1547     avg: 2022     median: 2128 (40%)     max: 2288 Points
min: 1403     avg: 1431     median: 1435 (27%)     max: 1455 Points
Cinebench R23 - Cinebench R23 Multi Core
min: 30712     avg: 35749     median: 36383 (34%)     max: 40970 Points
min: 18569     avg: 19207     median: 19206.5 (18%)     max: 19844 Points
Cinebench R23 - Cinebench R23 Single Core
min: 2009     avg: 2198     median: 2205.5 (93%)     max: 2267 Points
min: 2172     avg: 2213     median: 2213 (93%)     max: 2254 Points
Cinebench R20 - Cinebench R20 CPU (Single Core)
min: 774     avg: 846     median: 856.5 (94%)     max: 870 Points
557 Points (61%)
Cinebench R20 - Cinebench R20 CPU (Multi Core)
min: 12026     avg: 14027     median: 14245 (35%)     max: 16108 Points
5074 Points (12%)
Cinebench R15 - Cinebench R15 CPU Multi 64 Bit
min: 4756     avg: 5646     median: 5787 (37%)     max: 6271 Points
min: 2706     avg: 2711     median: 2708 (17%)     max: 2720 Points
Cinebench R15 - Cinebench R15 CPU Single 64 Bit
min: 306     avg: 333     median: 335.5 (93%)     max: 343 Points
min: 297     avg: 301.5     median: 301.5 (84%)     max: 306 Points
7-Zip 18.03 - 7-Zip 18.03 Multi Thread 4 runs
min: 98236     avg: 114645     median: 117732 (68%)     max: 124155 MIPS
7-Zip 18.03 - 7-Zip 18.03 Single Thread 4 runs
min: 6186     avg: 6785     median: 6754.5 (80%)     max: 7149 MIPS
HWBOT x265 Benchmark v2.2 - HWBOT x265 4k Preset
min: 30.7     avg: 38.2     median: 39.3 (69%)     max: 43.8 fps
Blender - Blender 3.3 Classroom CPU *
min: 134     avg: 155.7     median: 149 (2%)     max: 190 Seconds
237 Seconds (3%)
Blender - Blender 2.79 BMW27 CPU *
min: 82     avg: 95.7     median: 92.5 (1%)     max: 116 Seconds
270 Seconds (2%)
R Benchmark 2.5 - R Benchmark 2.5 *
min: 0.3943     avg: 0.4     median: 0.4 (9%)     max: 0.4568 sec
3DMark Vantage - 3DM Vant. Perf. CPU no Physx
123908 Points (95%)
3DMark 11 - 3DM11 Performance Physics
min: 21109     avg: 26515     median: 26691 (66%)     max: 29050 Points
3DMark - 3DMark Ice Storm Physics
min: 104288     avg: 107108     median: 107108 (87%)     max: 109928 Points
3DMark - 3DMark Cloud Gate Physics
min: 22080     avg: 25929     median: 26201.5 (66%)     max: 29274 Points
3DMark - 3DMark Fire Strike Standard Physics
min: 37357     avg: 46078     median: 47552 (85%)     max: 53054 Points
3DMark - 3DMark Time Spy CPU
min: 13836     avg: 16308     median: 16329 (69%)     max: 17607 Points
Geekbench 6.4 - Geekbench 6.4 Single-Core
min: 2917     avg: 3068     median: 3072 (77%)     max: 3160 Points
min: 3837     avg: 3870     median: 3844 (96%)     max: 3928 Points
Geekbench 6.4 - Geekbench 6.4 Multi-Core
min: 16033     avg: 19551     median: 19535 (76%)     max: 21668 Points
min: 20385     avg: 20487     median: 20458 (79%)     max: 20617 Points
Geekbench 5.5 - Geekbench 5.1 - 5.5 64 Bit Single-Core
min: 2034     avg: 2218     median: 2234 (87%)     max: 2292 Points
2555 Points (100%)
Geekbench 5.5 - Geekbench 5.1 - 5.5 64 Bit Multi-Core
min: 19105     avg: 23087     median: 23051 (41%)     max: 25855 Points
19529 Points (35%)
Mozilla Kraken 1.1 - Kraken 1.1 Total Score *
min: 402     avg: 411.3     median: 411 (0%)     max: 420 ms
min: 255.1     avg: 255.6     median: 255.6 (0%)     max: 256 ms
Sunspider - Sunspider 1.0 Total Score *
46.4 ms (1%)
Octane V2 - Octane V2 Total Score
min: 124210     avg: 127446     median: 127124 (96%)     max: 130140 Points
115983 Points (88%)
WebXPRT 4 - WebXPRT 4 Score
min: 317     avg: 332.4     median: 334 (92%)     max: 341 Points
min: 338     avg: 351     median: 351 (96%)     max: 364 Points
WebXPRT 3 - WebXPRT 3 Score
min: 315     avg: 357.3     median: 347 (62%)     max: 532 Points
min: 525     avg: 541     median: 541 (97%)     max: 557 Points
CrossMark - CrossMark Overall
min: 1857     avg: 2165     median: 2193 (82%)     max: 2339 Points
min: 2123     avg: 2141     median: 2141 (80%)     max: 2159 Points
Power Consumption - Prime95 Power Consumption - external Monitor *
min: 93.9     avg: 198.6     median: 218.5 (38%)     max: 270 Watt
36.4 Watt (6%)
Power Consumption - Cinebench R15 Multi Power Consumption - external Monitor *
min: 153.1     avg: 231.5     median: 243 (44%)     max: 259 Watt
min: 67.9     avg: 69     median: 69 (13%)     max: 70 Watt
Power Consumption - Geekbench 5.5 Power Consumption 150cd *
16.4 Watt (7%)
Power Consumption - Idle Power Consumption - external Monitor *
min: 10.3     avg: 29.5     median: 28.4 (19%)     max: 46.3 Watt
min: 2.59     avg: 4.2     median: 4.2 (3%)     max: 5.83 Watt
Power Consumption - Idle Power Consumption 150cd 1min *
min: 10.1     avg: 22.4     median: 22.3 (25%)     max: 38.4 Watt
4.3 Watt (5%)
Power Consumption - Power Efficiency - Cinebench R15 Multi external Monitor
min: 20.4     avg: 25.1     median: 24 (18%)     max: 33.8 Points per Watt
min: 38.7     avg: 39.4     median: 39.4 (29%)     max: 40.1 Points per Watt

Average Benchmarks Intel Core Ultra 9 275HX → 100% n=19

Average Benchmarks Apple M4 Pro (12 cores) → 91% n=19

- Range of benchmark values for this graphics card
red legend - Average benchmark values for this graphics card
* Smaller numbers mean a higher performance
1 This benchmark is not used for the average calculation

Add one or more devices and compare

In the following list you can select (and also search for) devices that should be added to the comparison. You can select more than one device.

restrict list:
v1.33
log 03. 13:27:36

#0 ran 0s before starting gpusingle class +0s ... 0s

#1 checking url part for id 18886 +0s ... 0s

#2 checking url part for id 18557 +0s ... 0s

#3 redirected to Ajax server, took 1751542056s time from redirect:0 +0s ... 0s

#4 did not recreate cache, as it is less than 5 days old! Created at Tue, 01 Jul 2025 05:20:16 +0200 +0s ... 0s

#5 composed specs +0.005s ... 0.006s

#6 did output specs +0s ... 0.006s

#7 getting avg benchmarks for device 18886 +0.003s ... 0.009s

#8 got single benchmarks 18886 +0.02s ... 0.029s

#9 getting avg benchmarks for device 18557 +0.001s ... 0.03s

#10 got single benchmarks 18557 +0.004s ... 0.034s

#11 got avg benchmarks for devices +0s ... 0.034s

#12 min, max, avg, median took s +0.029s ... 0.064s

#13 return log +0.002s ... 0.066s

Please share our article, every link counts!
Mail Logo
> Expert Reviews and News on Laptops, Smartphones and Tech Innovations > Benchmarks / Tech > Processor Comparison - Head 2 Head
Redaktion, 2017-09- 8 (Update: 2023-07- 1)