AMD Radeon Pro Vega 16 vs AMD Radeon Pro WX Vega M GL
AMD Radeon Pro Vega 16 ► remove from comparison
The AMD Radeon Pro Vega 16 is a dedicated graphics card for laptops. It was introduced as an option to the 2018 MacBook Pro. The graphics card offers 16 CUs (1024 shaders) and 4 GB HBM2 memory. The performance should be below the Radeon RX Vega M GL (1280 shaders) and therefore between a Nvidia GeForce GTX 1050 and 1050 Ti.
AMD Radeon Pro WX Vega M GL ► remove from comparison
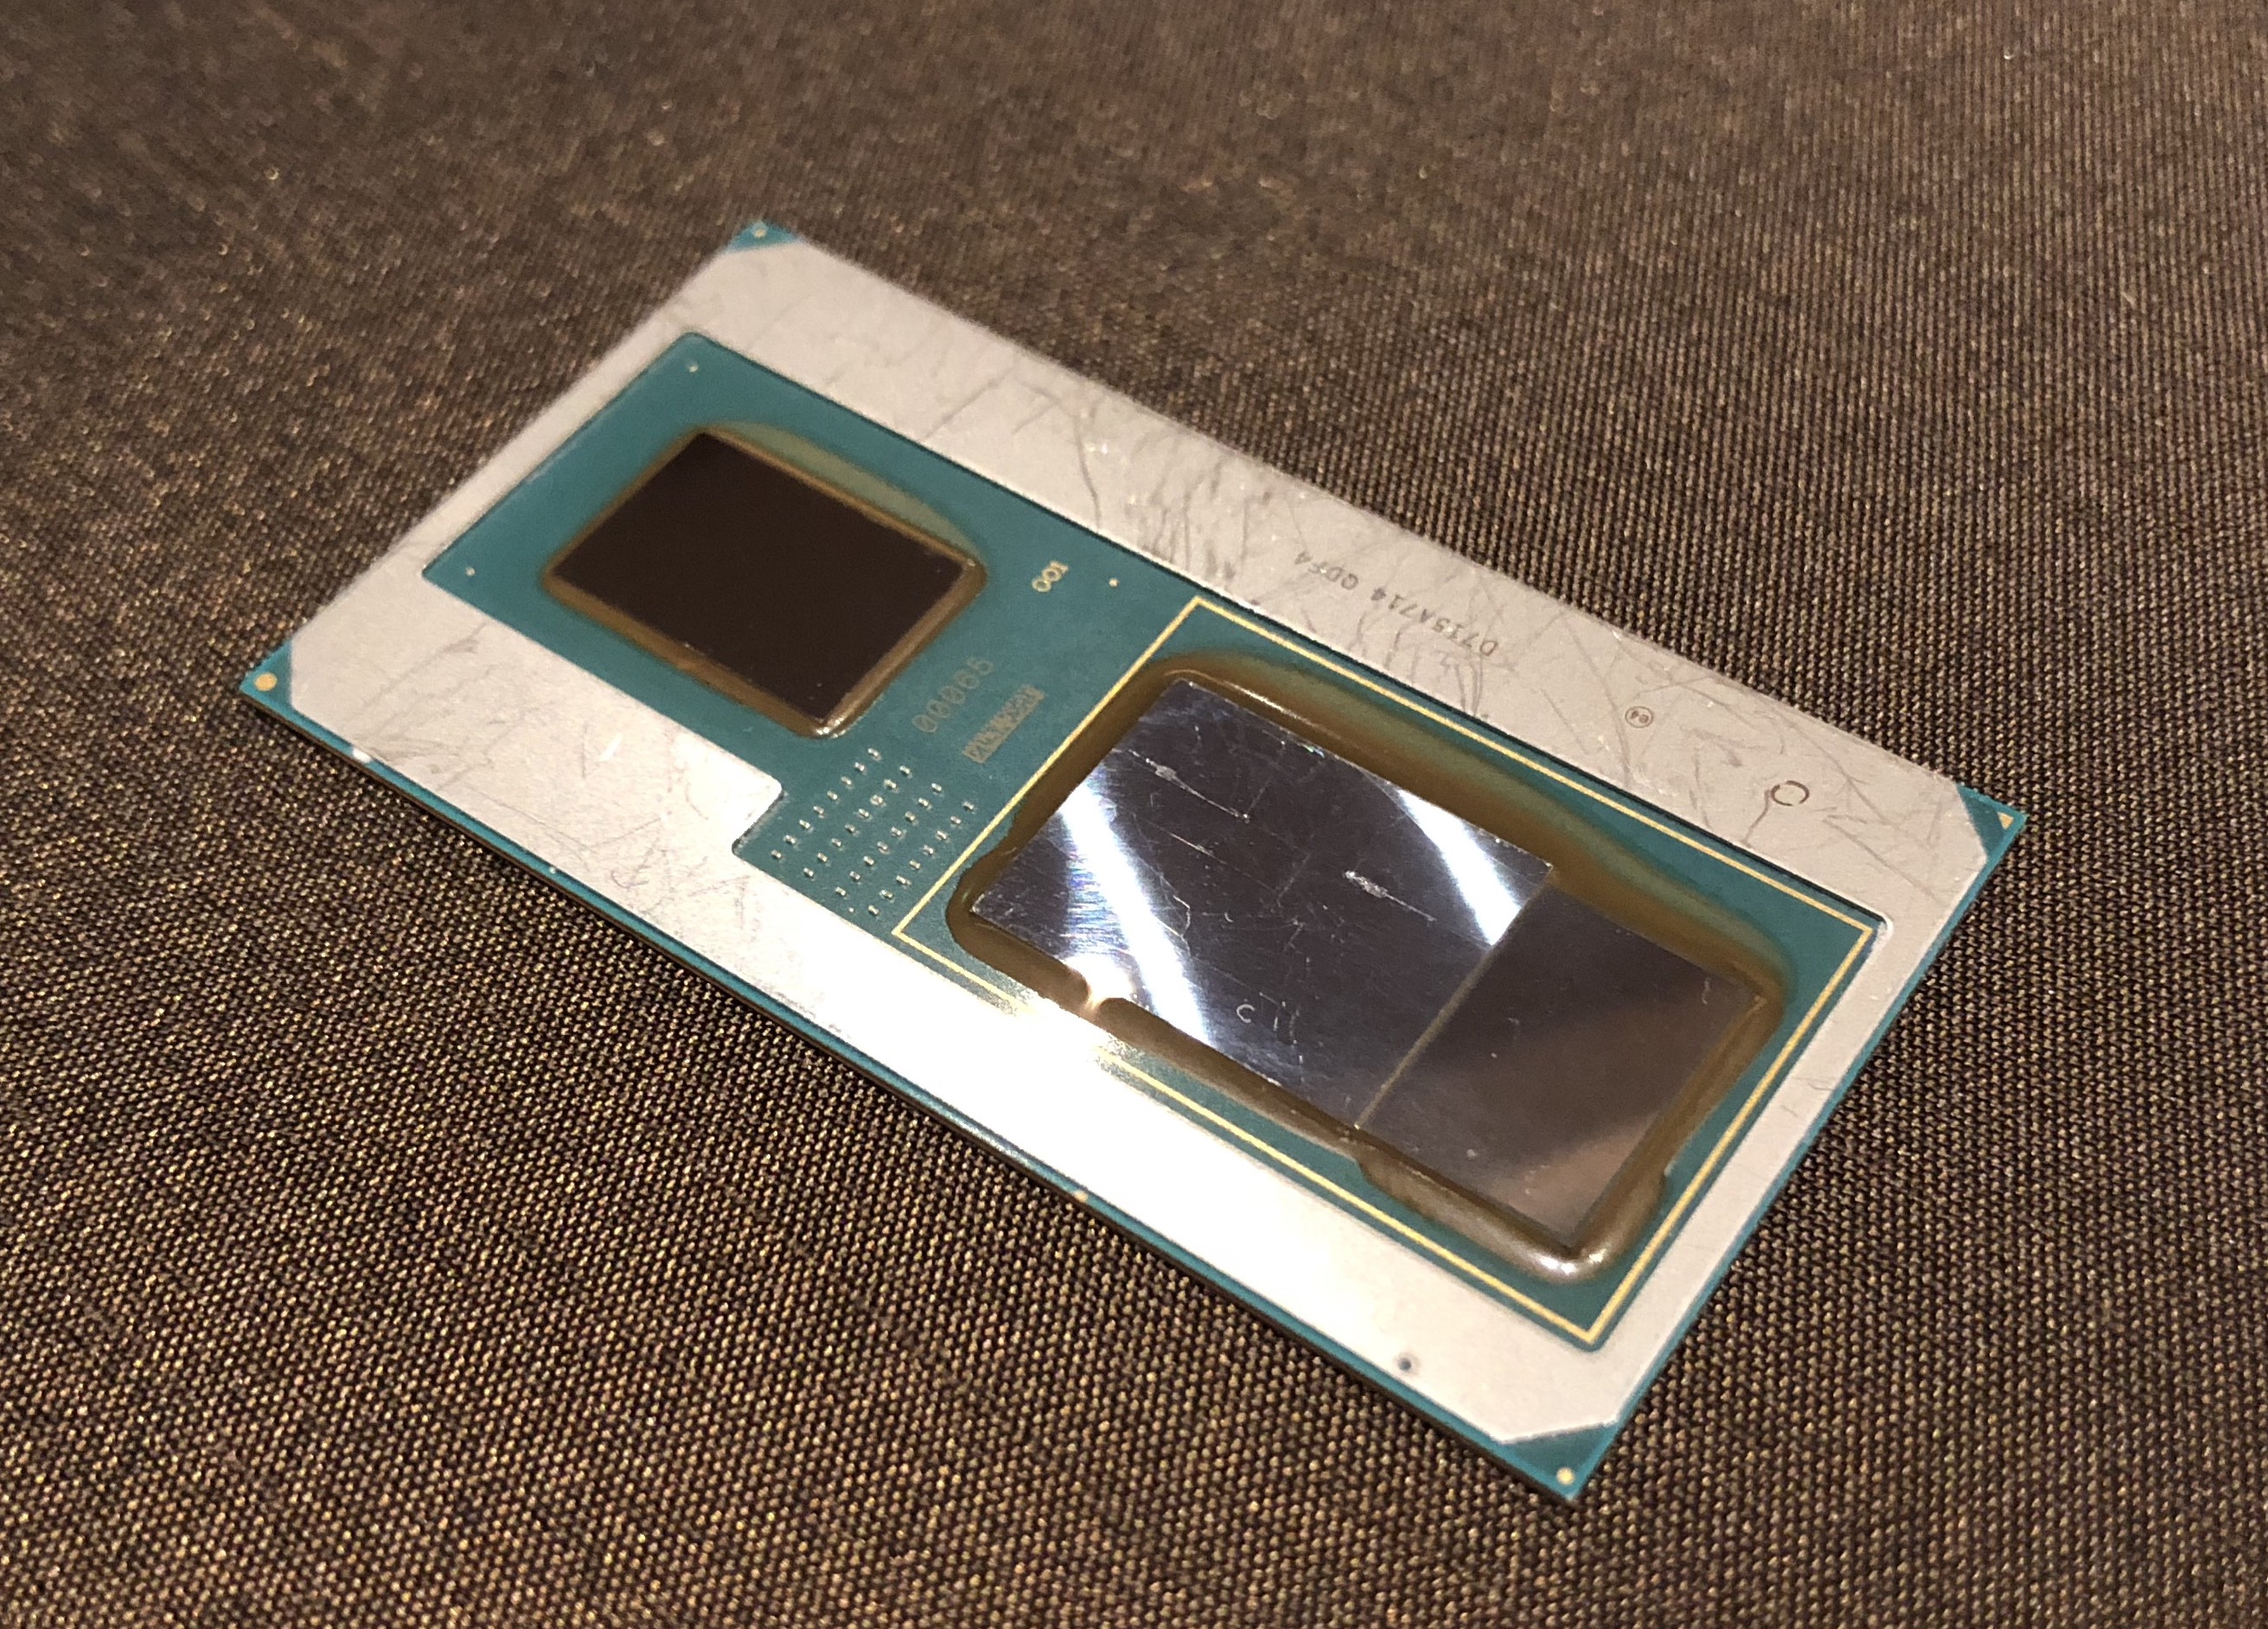
The AMD Radeon WX Vega M GL is an integrated GPU in the slower Intel Kaby-Lake-G SoC. It combines a Kaby-Lake processor, a Vega graphics card and 4 GB HBM2 memory on a single package. The graphics card offers 20 CUs (1280 shaders) and is clocked from 931 - 1011 MHz. It is technically identical to the consumer Radeon RX Vega M GL . The AMD Radeon Pro (formerly known as FirePro) is the counterpart to the Quadro series from Nvidia and offers certified drivers for professional 3D applications (CAD and DCC).
Currently it looks like the GPU is a mixture of Polaris (Shaders?) and Vega (HBM memory controller at least). E.g. the graphics card is called Polaris 22 internally. Detailed information on the Vega architecture can be found in our dedicated article about the Raven Ridge architecture .
The performance of the Vega M GL should be between the Nvidia GeForce GTX 1050 and 1050 Ti .
The power consumption should be quite similar to a dedicated Vega Mobile GPU, but due to the small form factor, smaller laptops can be built with the Kaby-Lake-G SoC. The TDP is specified at 65 Watt for the whole package including GPU, CPU and HBM2 memory.
AMD Radeon Pro Vega 16 AMD Radeon Pro WX Vega M GL AMD Radeon RX Vega Series Codename Vega Mobile Vega Kaby Lake-G Architecture Vega Vega Pipelines 1024 - unified 1280 - unified Memory Type HBM2 HBM2 Max. Amount of Memory 4 GB 4 GB Shared Memory no no technology 14 nm 14 nm Notebook Size large medium sized Date of Announcement 15.11.2018 07.01.2018 Core Speed 931 - 1011 (Boost) MHz API DirectX 12_1 Power Consumption 65 Watt Features Tiled Rasterization, Shared Memory (up to Dual-Channel DDR4-2400)
Benchmarks Performance Rating - 3DMark 11 + Fire Strike + Time Spy - WX Vega M GL
3.3 pt (10%)
...
AMD Radeon Pro WX Vega M GL
...
max:
3DMark - 3DMark Time Spy Score
2443 Points (7%)
2213 Points (6%)
3DMark - 3DMark Time Spy Graphics
2198 Points (6%)
2062 Points (5%)
3DMark - 3DMark Cloud Gate Score
29958 Points (32%)
19765 Points (21%)
3DMark - 3DMark Cloud Gate Graphics
56273 Points (15%)
38986 Points (10%)
3DMark - 3DMark Fire Strike Standard Score
6902 Points (12%)
6253 Points (11%)
3DMark - 3DMark Fire Strike Standard Graphics
7745 Points (9%)
7333 Points (8%)
3DMark - 3DMark Ice Storm Graphics
53170 Points (6%)
3DMark 11 - 3DM11 Performance Score
10926 Points (15%)
9731 Points (13%)
3DMark 11 - 3DM11 Performance GPU
10569 Points (9%)
10020 Points (9%)
SPECviewperf 12 + AMD Radeon Pro WX Vega M GL SPECviewperf 12 - specvp12 sw-03
75.2 fps (19%)
specvp12 snx-02 + AMD Radeon Pro WX Vega M GL SPECviewperf 12 - specvp12 snx-02
60 fps (9%)
specvp12 showcase-01 + AMD Radeon Pro WX Vega M GL SPECviewperf 12 - specvp12 showcase-01
38.3 fps (8%)
specvp12 mediacal-01 + AMD Radeon Pro WX Vega M GL SPECviewperf 12 - specvp12 mediacal-01
19.9 fps (5%)
specvp12 maya-04 + AMD Radeon Pro WX Vega M GL SPECviewperf 12 - specvp12 maya-04
42.8 fps (12%)
specvp12 energy-01 + AMD Radeon Pro WX Vega M GL SPECviewperf 12 - specvp12 energy-01
2.9 fps (3%)
specvp12 creo-01 + AMD Radeon Pro WX Vega M GL SPECviewperf 12 - specvp12 creo-01
57.4 fps (23%)
specvp12 catia-04 + AMD Radeon Pro WX Vega M GL SPECviewperf 12 - specvp12 catia-04
64.4 fps (11%)
SPECviewperf 13 specvp13 sw-04 + AMD Radeon Pro Vega 16 SPECviewperf 13 - specvp13 sw-04
77.9 fps (21%)
specvp13 snx-03 + AMD Radeon Pro Vega 16 SPECviewperf 13 - specvp13 snx-03
33.7 fps (4%)
specvp13 showcase-02 + AMD Radeon Pro Vega 16 SPECviewperf 13 - specvp13 showcase-02
42.5 fps (9%)
specvp13 medical-02 + AMD Radeon Pro Vega 16 SPECviewperf 13 - specvp13 medical-02
14.7 fps (3%)
specvp13 maya-05 + AMD Radeon Pro Vega 16 SPECviewperf 13 - specvp13 maya-05
106.3 fps (12%)
specvp13 energy-02 + AMD Radeon Pro Vega 16 SPECviewperf 13 - specvp13 energy-02
4.1 fps (1%)
specvp13 creo-02 + AMD Radeon Pro Vega 16 SPECviewperf 13 - specvp13 creo-02
70.2 fps (10%)
specvp13 catia-05 + AMD Radeon Pro Vega 16 SPECviewperf 13 - specvp13 catia-05
104.9 fps (12%)
specvp13 3dsmax-06 + AMD Radeon Pro Vega 16 SPECviewperf 13 - specvp13 3dsmax-06
64.2 fps (11%)
Cinebench R10 Cinebench R10 Shading (32bit) + AMD Radeon Pro WX Vega M GL Cinebench R10 - Cinebench R10 Shading (32bit)
9667 Points (7%)
Cinebench R11.5 Cinebench R11.5 OpenGL 64 Bit + AMD Radeon Pro WX Vega M GL Cinebench R11.5 - Cinebench R11.5 OpenGL 64 Bit
108.9 fps (38%)
Cinebench R15 + AMD Radeon Pro Vega 16 Cinebench R15 - Cinebench R15 OpenGL 64 Bit
130.2 fps (8%)
Cinebench R15 OpenGL 64 Bit + AMD Radeon Pro WX Vega M GL
132.5 fps (8%)
Cinebench R15 OpenGL Ref. Match 64 Bit + AMD Radeon Pro Vega 16 Cinebench R15 - Cinebench R15 OpenGL Ref. Match 64 Bit
99.5 % (100%)
Cinebench R15 OpenGL Ref. Match 64 Bit + AMD Radeon Pro WX Vega M GL
98 % (98%)
LuxMark v2.0 64Bit - LuxMark v2.0 Room GPU
845 Samples/s (4%)
LuxMark v2.0 64Bit - LuxMark v2.0 Sala GPU
1567 Samples/s (3%)
ComputeMark v2.1 - ComputeMark v2.1 Result
967 Points (1%)
Power Consumption - Witcher 3 Power Consumption *
82.2 Watt (18%)
Power Consumption - Witcher 3 ultra Power Efficiency
0.3 fps per Watt (29%)
Emissions Witcher 3 Fan Noise + AMD Radeon Pro WX Vega M GL Emissions - Witcher 3 Fan Noise
47 dB(A) (75%)
Average Benchmarks AMD Radeon Pro Vega 16 → 100% n=10 Average Benchmarks AMD Radeon Pro WX Vega M GL → 89% n=10
- Range of benchmark values for this graphics card
- Average benchmark values for this graphics card
* Smaller numbers mean a higher performance
1 This benchmark is not used for the average calculation
Game Benchmarks The following benchmarks stem from our benchmarks of review laptops. The performance depends on the used graphics memory, clock rate, processor, system settings, drivers, and operating systems. So the results don't have to be representative for all laptops with this GPU. For detailed information on the benchmark results, click on the fps number.
100%
Radeon Pro Vega 16:
65 fps
100%
Radeon Pro Vega 16:
50.8 fps
100%
Radeon Pro Vega 16:
43.5 fps
100%
Radeon Pro Vega 16:
103 fps
100%
Radeon Pro Vega 16:
99 fps
100%
Radeon Pro Vega 16:
75 fps
100%
Radeon Pro Vega 16:
72 fps
100%
Radeon Pro Vega 16:
38.4 fps
100%
Radeon Pro Vega 16:
27 fps
89%
WX Vega M GL:
23.9 fps
Average Gaming AMD Radeon Pro Vega 16 → 100% Average Gaming 30-70 fps → 100%
Average Gaming AMD Radeon Pro WX Vega M GL → 89% AMD Radeon Pro WX Vega M GL low med. high ultra QHD 4K Assassin´s Creed Odyssey 44 33 27 17 10 Shadow of the Tomb Raider 82 37 33 28 8 F1 2018 107 65 54 34 15 Final Fantasy XV Benchmark 63 32.5 21.8 8.3 F1 2017 122 78 65 40 17 Dirt 4 194.3 97.1 54.5 31.3 18.3 Rocket League 185.6 146.2 100.2 34.3 Prey 116.1 91.3 74.9 65.5 19.9 Overwatch 193.7 173.4 109.8 52.3 32.9 Ashes of the Singularity 50.3 34.8 16 Rise of the Tomb Raider 74.4 77.6 40.4 31.8 13.8 Fallout 4 106.9 80.4 49.8 35.5 14.7 Metal Gear Solid V 60 60 60 50 25.1 Batman: Arkham Knight 73 73 50 16 The Witcher 3 94.7 79 44.2 23.9 15.1 Thief 68.6 67.1 64.3 42.7 Metro: Last Light 98.2 94.8 77.5 41 BioShock Infinite 106.5 101.2 102.9 59.6 StarCraft II: Heart of the Swarm 254 146 134.1 71.4 Sleeping Dogs 113.1 95.9 84.6 36 < 30 fps < 60 fps < 120 fps ≥ 120 fps 2 13 5 4 13 3 3 7 9 1 3 11 2 12 2
AMD Radeon Pro Vega 16 low med. high ultra QHD 4K X-Plane 11.11 65 50.8 43.5 Dota 2 Reborn 103 99 75 72 38.4 The Witcher 3 27 < 30 fps < 60 fps < 120 fps ≥ 120 fps 2 1 1 1 1 1 1 1
For more games that might be playable and a list of all games and graphics cards visit our Gaming List
v1.26
log 04. 11:48:20
#0 checking url part for id 9376 +0s ... 0s
#1 checking url part for id 9018 +0s ... 0s
#2 not redirecting to Ajax server +0s ... 0s
#3 did not recreate cache, as it is less than 5 days old! Created at Sat, 04 May 2024 05:42:18 +0200 +0.001s ... 0.001s
#4 composed specs +0.109s ... 0.11s
#5 did output specs +0s ... 0.11s
#6 start showIntegratedCPUs +0s ... 0.11s
#7 getting avg benchmarks for device 9376 +0.032s ... 0.142s
#8 got single benchmarks 9376 +0.007s ... 0.149s
#9 getting avg benchmarks for device 9018 +0.021s ... 0.17s
#10 got single benchmarks 9018 +0.007s ... 0.177s
#11 got avg benchmarks for devices +0s ... 0.177s
#12 min, max, avg, median took s +0.166s ... 0.343s
#13 before gaming benchmark output +0s ... 0.343s
#14 Got 99 rows for game benchmarks. +0.016s ... 0.36s
#15 composed SQL query for gamebenchmarks +0s ... 0.36s
#16 got data and put it in $dataArray +0.018s ... 0.378s
#17 benchmarks composed for output. +0.053s ... 0.43s
#18 calculated avg scores. +0s ... 0.43s
#19 return log +0.056s ... 0.486s
Please share our article, every link counts!
Redaktion, 2017-09- 8 (Update: 2023-07- 1)
 Deutsch
 English
 Español
 Français
 Italiano
 Nederlands
 Polski
 Português
 Русский
 Türkçe
 Svenska
 Chinese
 Magyar