Notebookcheck Logo

AMD Ryzen 7 5800X vs AMD Ryzen 5 PRO 7640U vs AMD Ryzen 7 5800X3D

AMD Ryzen 7 5800X

► remove from comparison AMD R7 5800X

The AMD Ryzen 7 5800X is an 8-core desktop processor with Simultaneous Multithreading (SMT), which allows it to process 16 threads simultaneously. With its launch on 08.10.2020, it is the fastest 8-core processor from AMD. The second fastest 8-core processor will be the AMD Ryzen 7 3800XT, followed by the more economical AMD Ryzen 7 3700X, also with 8 cores and 16 threads.

The Ryzen 7 5800X clocks with a base clock of 3.8 GHz and reaches up to 4.7 GHz on one core in turbo mode. When all 8 cores are utilized, the AMD Ryzen 7 5800X, like the AMD Ryzen 9 5900X, achieves up to 4.5 GHz.

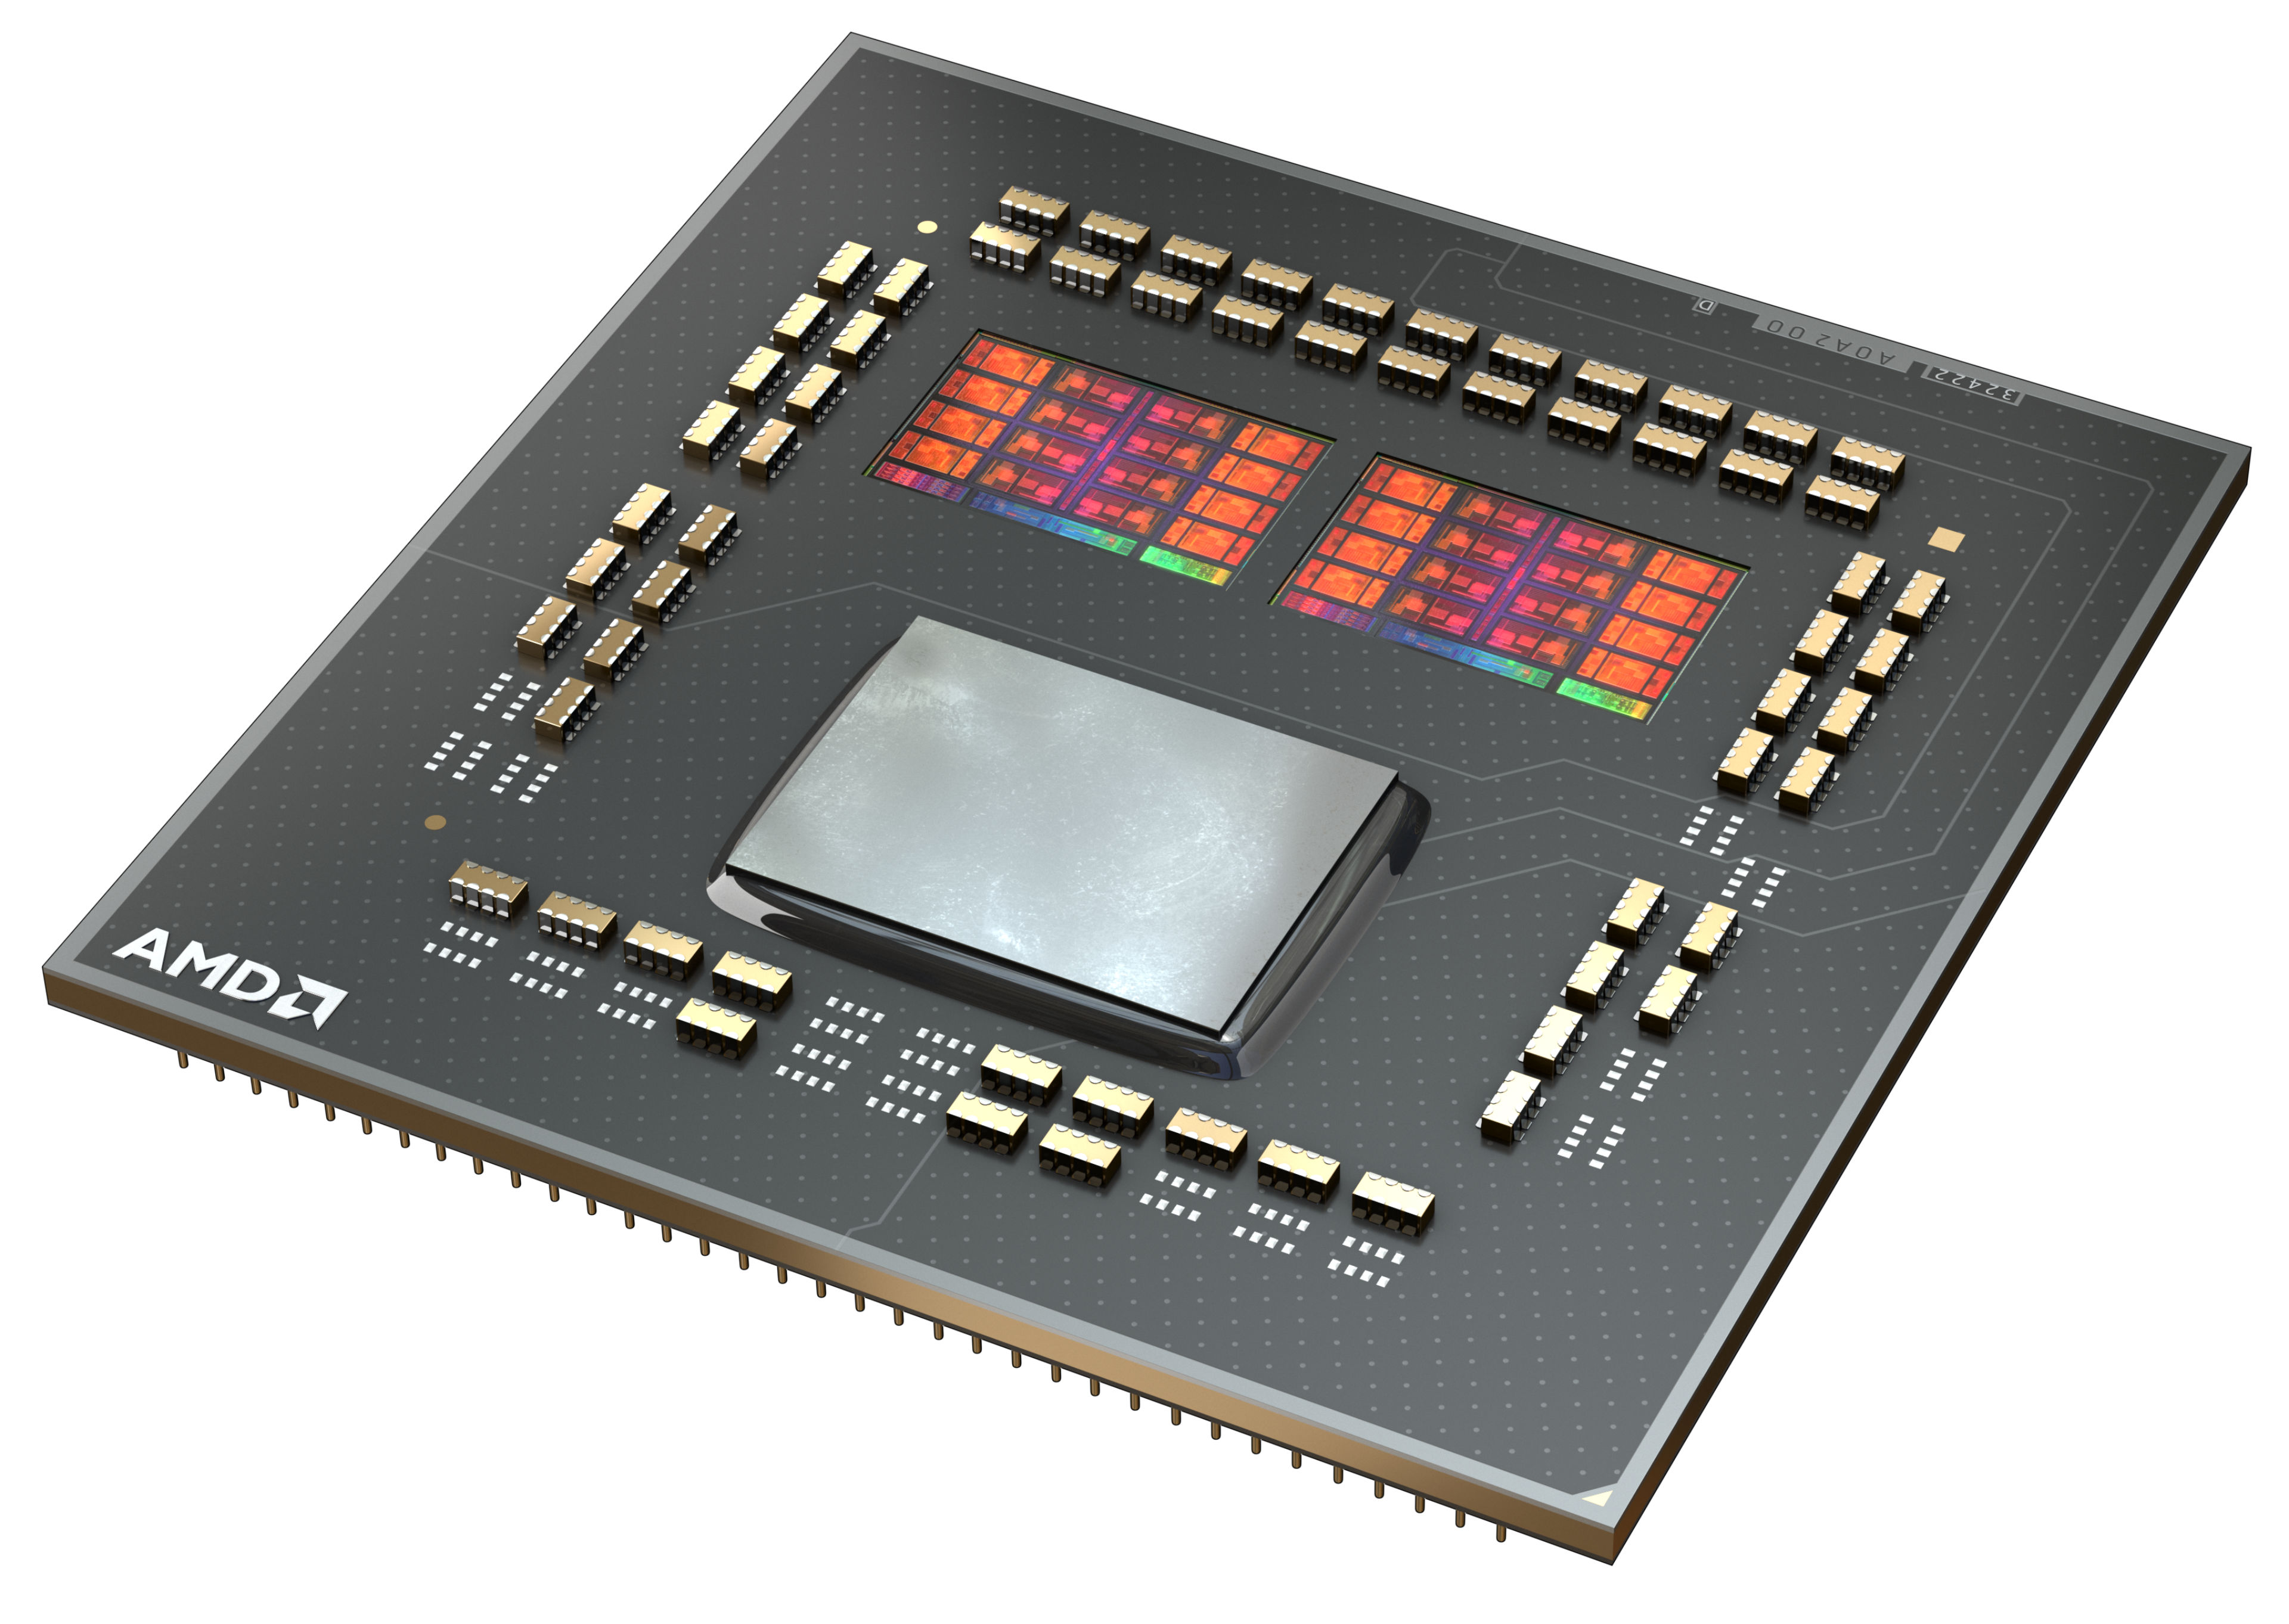
At first glance, the internal structure of the processor has not changed fundamentally. The CCX structure has changed somewhat compared to Zen2, because now a CCX consists of up to 8-CPU cores. So each individual core can access the complete L3 cache (32 MByte). Furthermore the CCX modules are connected to each other via the same I/O die, which we already know from Zen2. According to AMD, the Infinity-Fabric should now reach clock rates of up to 2Ghz, which in turn allows a RAM clock of 4.000 MHz without performance loss.

Performance

The average 5800X in our database is in the same league as the Core i9-10900K and also the Core i7-12700F, as far as multi-thread benchmark scores are concerned.

In games, AMD's Ryzen 7 5800X can convince with its significantly improved IPC and even put Intel in its place. With the AMD Ryzen 7 5800X, gamers are well prepared for the future as simultaneous streaming is no problem with the new Ryzen 7 5800X. Semi-professional content creators, who need even more power, can choose a Ryzen 9 5900X or the Ryzen 9 5950X on the shelf.

Power consumption

The Ryzen 7 has a default TDP (also known as the long-term power limit) of 105 W. This applies as long as the CPU runs at stock clock speeds.

Ryzen 7 5800X is built with TSMC's 7 nm process; as rumors have it, the I/O die is manufactured separately on the 12 nm Global Foundries process.

AMD Ryzen 5 PRO 7640U

► remove from comparison AMD R5 PRO 7640U

The AMD Ryzen 5 PRO 7640U is a fast mid-range laptop processor of the Phoenix series. It offers 6 cores (hexa core) based on the Zen 4 architecture that supports hyperthreading (12 threads). The cores clock from 3.5 (base) up to 4.9 GHz (single core boost). The processor includes 6 MB L2 cache and 16 MB L3 cache.

Compared to the consumer Ryzen 5 7640U, the PRO models offer additional security, manageability, and reliability features designed for professional users and workstation environments.

Thanks to the new Zen 4 architecture and higher clock speeds, the R5 PRO 7640U is clearly faster than the old Ryzen 5 6600U (Zen 3, 6 cores, 4.5 GHz). Compared to the similar 7640HS, the U-series offers a lower TDP and slightly lower core clocks.

The chip integrates a modern and fasts RDNA 3 graphics card (iGPU) called Radeon 760M with 8 of the 12 CUs and 2.6 GHz clock speed. Furthermore, the Phoenix series include a video engine with AV1 de- and encoding, a new Xilinx FPGA based XDNA AI accelerator (Ryzen AI) that should be faster than the AI engine in the Apple M2 SOC and a dual-channel DDR5-5600 / LPDDR5x-7500 memory controller (with ECC support). The connectivity features includes 2 possible USB 4 (40 Gbps) ports and 20 PCIe 4.0 lanes for a GPU and SSDs.

The Phoenix series uses a single monolithic design (unlike the chiplet design of the 7045HX series) and is manufactured in the modern 4nm process at TSMC. The TDP can be configured between 35 and 45 Watt.

AMD Ryzen 7 5800X3D

► remove from comparison AMD R7 5800X3D

The AMD Ryzen 7 5800X3D is an 8-core desktop processor with a large level 3 cache (3DV cache) that is aimed mostly for increased gaming performance. It offers 8 Zen 3 based cores clocked at 3.4 - 4.5 GHz and therefore a bit slower than the 3.4 - 4.7 GHz of the R7 5800X. The power consumption of both chips is rated at 105 Watt (TDP) and the efficiency compared to Alder Lake desktop CPUs is rather good.

ModelAMD Ryzen 7 5800XAMD Ryzen 5 PRO 7640UAMD Ryzen 7 5800X3D
SeriesAMD Vermeer (Ryzen 5000)AMD Phoenix (Zen 4, Ryzen 7040)AMD Vermeer (Ryzen 5000)
CodenameVermeer (Zen 3)Phoenix (Zen4)Vermeer (Zen3)
Series: Vermeer (Ryzen 5000) Vermeer (Zen3)
AMD Ryzen 9 5950X3.4 - 4.9 GHz16 / 32 cores64 MB L3
AMD Ryzen 7 5800X « 3.8 - 4.7 GHz8 / 16 cores32 MB L3
AMD Ryzen 7 5700X3.4 - 4.6 GHz8 / 16 cores32 MB L3
AMD Ryzen 5 5600X3.7 - 4.6 GHz6 / 12 cores32 MB L3
AMD Ryzen 5 PRO 7640HS4.3 - 5 GHz6 / 12 cores16 MB L3
AMD Ryzen Z13.2 - 4.9 GHz6 / 12 cores16 MB L3
AMD Ryzen 5 PRO 7640U « 3.5 - 4.9 GHz6 / 12 cores16 MB L3
AMD Ryzen 5 PRO 7540U3.2 - 4.9 GHz6 / 12 cores16 MB L3
AMD Ryzen 5 7545U3.2 - 4.9 GHz6 / 12 cores16 MB L3
AMD Ryzen 5 7540U3.2 - 4.9 GHz6 / 12 cores16 MB L3
AMD Ryzen 9 5900X3.7 - 4.8 GHz12 / 24 cores64 MB L3
AMD Ryzen 7 5800X3D « 3.4 - 4.5 GHz8 / 16 cores96 MB L3
Clock3800 - 4700 MHz3500 - 4900 MHz3400 - 4500 MHz
L1 Cache512 KB384 KB512 KB
L2 Cache4 MB6 MB4 MB
L3 Cache32 MB16 MB96 MB
Cores / Threads8 / 166 / 12
6 x 4.9 GHz AMD Zen 4
8 / 16
TDP105 Watt15 Watt105 Watt
Technology7 nm4 nm7 nm
Die Size2 x 80.7 sq. mm; I/O = 125 mm2178 mm2
max. Temp.90 °C100 °C90 °C
SocketAM4 (LGA1331)AM4 (1331)
FeaturesDDR4-3200 RAM, PCIe 4, MMX (+), SSE, SSE2, SSE3, SSSE3, SSE4.1, SSE4.2, SSE4A, AES, AVX, AVX2, FMA3, SHAMMX(+), SSE, SSE2, SSE3, SSSE3, SSE4.1, SSE4.2, SSE4A, x86-64, AMD-V, AES, AVX, AVX2, FMA3, SHA, Precision Boost 2
Architecturex86x86x86
$449 U.S.
Announced
Manufacturerwww.amd.comwww.amd.comwww.amd.com
iGPUAMD Radeon 760M ( - 2600 MHz)

Benchmarks

Performance Rating - CB R15 + R20 + 7-Zip + X265 + Blender + 3DM11 CPU - R7 5800X
44.8 pt (62%)
Performance Rating - CB R15 + R20 + 7-Zip + X265 + Blender + 3DM11 CPU - R7 5800X3D
42.7 pt (59%)
Cinebench R23 - Cinebench R23 Multi Core
min: 15241     avg: 15476     median: 15476 (14%)     max: 15711 Points
14317 Points (13%)
Cinebench R23 - Cinebench R23 Single Core
min: 1554     avg: 1575     median: 1574.5 (67%)     max: 1595 Points
1452 Points (62%)
Cinebench R20 - Cinebench R20 CPU (Single Core)
min: 624     avg: 625     median: 624.5 (69%)     max: 625 Points
Cinebench R20 - Cinebench R20 CPU (Multi Core)
min: 6068     avg: 6075     median: 6074.5 (15%)     max: 6081 Points
5479 Points (13%)
Cinebench R15 - Cinebench R15 CPU Multi 64 Bit
min: 2601     avg: 2609     median: 2608.5 (16%)     max: 2616 Points
2413 Points (15%)
Cinebench R15 - Cinebench R15 CPU Single 64 Bit
min: 265     avg: 265.5     median: 265.5 (80%)     max: 266 Points
Cinebench R11.5 - Cinebench R11.5 CPU Multi 64 Bit
29.3 Points (38%)
27.2 Points (35%)
Cinebench R11.5 - Cinebench R11.5 CPU Single 64 Bit
3.1 Points (77%)
2.8 Points (69%)
Cinebench R10 - Cinebench R10 Rend. Single (32bit)
6835 Points (41%)
6008 Points (36%)
Cinebench R10 - Cinebench R10 Rend. Multi (32bit)
45548 Points (33%)
42010 Points (30%)
Cinebench R10 - Cinebench R10 Rend. Multi (64bit)
83426 Points (58%)
Cinebench R10 - Cinebench R10 Rend. Single (64bit)
13039 Points (16%)
wPrime 2.10 - wPrime 2.0 1024m *
86.1 s (1%)
wPrime 2.10 - wPrime 2.0 32m *
3 s (1%)
WinRAR - WinRAR 4.0
15604 Points (25%)
14431 Points (23%)
7-Zip 18.03 - 7-Zip 18.03 Multli Thread 4 runs
min: 69921     avg: 72114     median: 72113.5 (41%)     max: 74306 MIPS
69518 MIPS (40%)
7-Zip 18.03 - 7-Zip 18.03 Single Thread 4 runs
min: 6843     avg: 6907     median: 6906.5 (83%)     max: 6970 MIPS
X264 HD Benchmark 4.0 - x264 Pass 2
152 fps (53%)
138.3 fps (48%)
X264 HD Benchmark 4.0 - x264 Pass 1
339 fps (78%)
HWBOT x265 Benchmark v2.2 - HWBOT x265 4k Preset
min: 19.8     avg: 20.3     median: 20.3 (36%)     max: 20.8 fps
TrueCrypt - TrueCrypt Serpent
1.3 GB/s (0%)
TrueCrypt - TrueCrypt Twofish
2 GB/s (34%)
TrueCrypt - TrueCrypt AES
15 GB/s (39%)
Blender - Blender 3.3 Classroom CPU *
min: 331     avg: 336     median: 336 (4%)     max: 341 Seconds
Blender - Blender 2.79 BMW27 CPU *
min: 196.8     avg: 196.9     median: 196.9 (1%)     max: 197 Seconds
212.6 Seconds (1%)
R Benchmark 2.5 - R Benchmark 2.5 *
min: 0.4509     avg: 0.5     median: 0.5 (10%)     max: 0.4545 sec
3DMark 06 - CPU - 3DMark 06 - CPU
15873 Points (34%)
14479 Points (31%)
Super Pi mod 1.5 XS 1M - Super Pi mod 1.5 XS 1M *
7.3 s (2%)
Super Pi mod 1.5 XS 2M - Super Pi mod 1.5 XS 2M *
15.8 s (1%)
Super Pi Mod 1.5 XS 32M - Super Pi mod 1.5 XS 32M *
365.8 s (2%)
385.5 s (2%)
3DMark Vantage - 3DM Vant. Perf. CPU no Physx
86050 Points (75%)
3DMark 11 - 3DM11 Performance Physics
min: 23381     avg: 23704     median: 23703.5 (64%)     max: 24026 Points
3DMark - 3DMark Ice Storm Physics
94127 Points (76%)
3DMark - 3DMark Ice Storm Extreme Physics
94179 Points (76%)
3DMark - 3DMark Ice Storm Unlimited Physics
96702 Points (81%)
3DMark - 3DMark Cloud Gate Physics
22992 Points (58%)
3DMark - 3DMark Fire Strike Standard Physics
min: 29163     avg: 30051     median: 30050.5 (54%)     max: 30938 Points
3DMark - 3DMark Time Spy CPU
min: 11599     avg: 11652     median: 11652 (49%)     max: 11705 Points
Geekbench 5.5 - Geekbench 5.1 - 5.4 64 Bit Single-Core
min: 1665     avg: 1683     median: 1683 (71%)     max: 1701 Points
1622 Points (68%)
Geekbench 5.5 - Geekbench 5.1 - 5.4 64 Bit Multi-Core
min: 10093     avg: 10724     median: 10723.5 (19%)     max: 11354 Points
10856 Points (19%)
Geekbench 5.0 - Geekbench 5.0 64 Bit Single-Core
1673 Points (7%)
1526 Points (7%)
Geekbench 5.0 - Geekbench 5.0 64 Bit Multi-Core
11246 Points (35%)
10836 Points (34%)
Geekbench 4.4 - Geekbench 4.1 - 4.4 64 Bit Single-Core
7333 Points (73%)
7187 Points (72%)
Geekbench 4.4 - Geekbench 4.1 - 4.4 64 Bit Multi-Core
44131 Points (48%)
43687 Points (48%)
Mozilla Kraken 1.1 - Kraken 1.1 Total Score *
min: 558     avg: 576     median: 575.5 (1%)     max: 593 ms
WebXPRT 4 - WebXPRT 4 Score
245 Points (70%)
WebXPRT 3 - WebXPRT 3 Score
min: 296     avg: 301.5     median: 301.5 (63%)     max: 307 Points
CrossMark - CrossMark Overall
1541 Points (59%)
1770 Points (68%)
Power Consumption - Prime95 Power Consumption - external Monitor *
242.3 Watt (42%)
Power Consumption - Cinebench R15 Multi Power Consumption - external Monitor *
220.7 Watt (40%)
Power Consumption - Idle Power Consumption - external Monitor *
102 Watt (67%)
Power Consumption - Cinebench R15 Multi Power Efficiency - external Monitor
11.9 Points per Watt (9%)
11.5 Points per Watt (9%)

Average Benchmarks AMD Ryzen 7 5800X → 0% n=

Average Benchmarks AMD Ryzen 7 5800X3D → 0% n=

- Range of benchmark values for this graphics card
- Average benchmark values for this graphics card
* Smaller numbers mean a higher performance
1 This benchmark is not used for the average calculation

v1.26
log 23. 05:11:58

#0 checking url part for id 12783 +0s ... 0s

#1 checking url part for id 15060 +0s ... 0s

#2 checking url part for id 14390 +0s ... 0s

#3 not redirecting to Ajax server +0s ... 0s

#4 did not recreate cache, as it is less than 5 days old! Created at Wed, 22 May 2024 05:37:27 +0200 +0.001s ... 0.001s

#5 composed specs +0.039s ... 0.041s

#6 did output specs +0s ... 0.041s

#7 getting avg benchmarks for device 12783 +0.023s ... 0.064s

#8 got single benchmarks 12783 +0.022s ... 0.085s

#9 getting avg benchmarks for device 15060 +0.003s ... 0.089s

#10 got single benchmarks 15060 +0.001s ... 0.089s

#11 getting avg benchmarks for device 14390 +0.022s ... 0.112s

#12 got single benchmarks 14390 +0.017s ... 0.128s

#13 got avg benchmarks for devices +0s ... 0.128s

#14 min, max, avg, median took s +0.433s ... 0.562s

#15 return log +0s ... 0.562s

Please share our article, every link counts!
> Expert Reviews and News on Laptops, Smartphones and Tech Innovations > Benchmarks / Tech > Processor Comparison - Head 2 Head
Redaktion, 2017-09- 8 (Update: 2023-07- 1)