Notebookcheck Logo

AMD Ryzen 5 PRO 2500U vs Intel Core i5-11500B vs Intel Core i9-11900KB

AMD Ryzen 5 PRO 2500U

► remove from comparison AMD R5 PRO 2500U

The AMD Ryzen 5 PRO 2500U is a mobile APU for thin and light business laptops that was announced in January 2017. Compared to the similar consumer Ryzen 5 2500U, the PRO 2500U offers additional security features and longer part availability / warranty.

It includes four Zen cores clocked at 2 to 3.6 GHz and offers 4 MB L3-Cache. The integrated graphics card is called Radeon RX Vega 8 and offers 8 CUs (512 Shaders) clocked at up to 1100 MHz. The TDP is configurable between 12 and 25 Watt (15 Watt nominal). More information on Raven Ridge can be found in our launch article.

Intel Core i5-11500B

► remove from comparison Intel i5-11500B

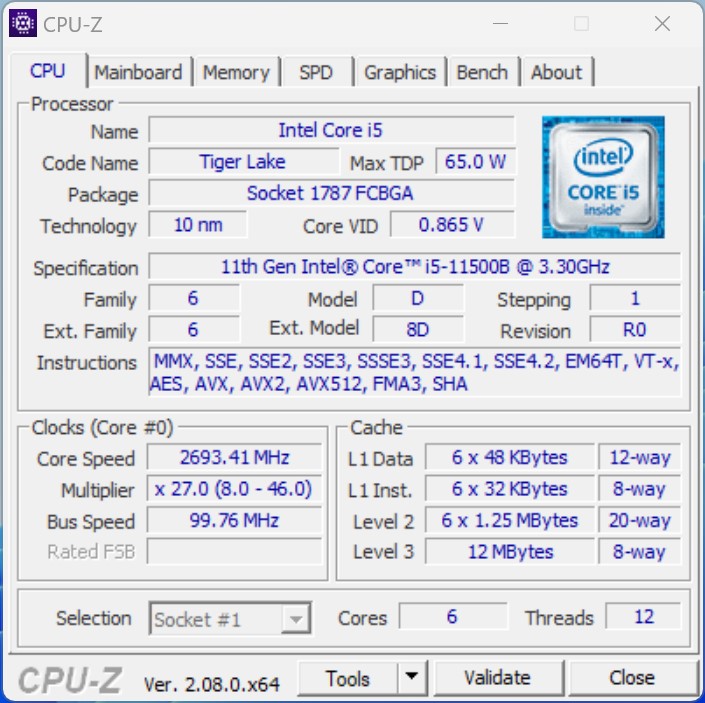
The Intel Core i5-11500B is a hexa-core processor for desktops and mini PCs. It is based on the Tiger Lake architecture (H45) and was presented in Q2 2021. The chip offers a TDP of 65 watts (configurable). The six processor cores can clock from 3.3 to 4.6 GHz (single-core turbo). The processor offers 12 MB level 3 cache and supports DDR4 RAM with up to 3,200 MT/s. The integrated graphics are based on the Xe architecture and are named UHD Graphics (32 EUs). In the 11500B it clocks from 350 to 1,450 MHz. The chip is manufactured using the 10 nm SuperFin process.

Performance

The performance of the Intel Core i5-11500B depends primarily on the performance of the installed cooling unit. The TDP of the SoC can also be lowered. In principle, however, the Intel Core i5-11500B should offer slightly more performance than an Intel Core i5-11400H (6 cores 2.7 - 4.5 GHz).

Features

As with the smaller Tiger Lake chips, Wi-Fi (Wi-Fi 6E) and Thunderbolt 4 / USB 4 are (partially) integrated into the chip for faster, cheaper and space-saving implementations in desktops and mini-PCs. The i5-11500B also offers 20 PCIe 4.0 lanes.

Intel Core i9-11900KB

► remove from comparison Intel i9-11900KB

The Intel Core i9-11900KB is an Octa-Core-CPU that was used in the Intel Beast Canyon NUC. It is based on the Tiger-Lake-H45 series and was announced in the second quarter of 2021. The processor cores can clock from 3.3 to 5.3 GHz, all cores at once can reach up to 4.9 GHz. The CPU features 24 MB level 3 cache and DDR4-3200 memory. The integrated UHD graphics card is based on the Xe-architecture with 32 cores and clocks up to 1.45 GHz.

As with the slower Tiger Lake-H CPUs, the 11900KB has a partly integrated WiFi 6E and Thunderbolt 4 in the chip. Furthermore, the 11900KB supports 20 PCIe 4.0 lanes.

The TDP is rated at 65 Watt with 3.3. GHz base clock and can be configured to 55 Watt (cTDP-down).

ModelAMD Ryzen 5 PRO 2500UIntel Core i5-11500BIntel Core i9-11900KB
CodenameZenTiger Lake-HTiger Lake-H
SeriesAMD Raven Ridge (Ryzen 2000 APU)Intel Tiger LakeIntel Tiger Lake
Series: Tiger Lake Tiger Lake-H
AMD Ryzen 5 2400G3.6 - 3.9 GHz4 / 8 cores4 MB L3
AMD Ryzen 7 2700U2.2 - 3.8 GHz4 / 8 cores4 MB L3
AMD Ryzen 7 PRO 2700U2.2 - 3.8 GHz4 / 8 cores4 MB L3
AMD Ryzen 3 2200G3.5 - 3.7 GHz4 / 4 cores4 MB L3
AMD Ryzen 5 2600H3.2 - 3.6 GHz4 / 8 cores4 MB L3
AMD Ryzen 5 2500U2 - 3.6 GHz4 / 8 cores4 MB L3
AMD Ryzen 5 PRO 2500U « 2 - 3.6 GHz4 / 8 cores4 MB L3
AMD Ryzen Embedded V1605B2 - 3.6 GHz4 / 8 cores4 MB L3
AMD Ryzen 3 2300U2 - 3.4 GHz4 / 4 cores4 MB L3
AMD Ryzen 3 PRO 2300U2 - 3.4 GHz4 / 4 cores4 MB L3
AMD Ryzen Embedded R1606G2.6 - 3.5 GHz2 / 4 cores4 MB L3
AMD Ryzen 3 2200U2.5 - 3.4 GHz2 / 4 cores4 MB L3
AMD Ryzen 3 PRO 2200U2.5 - 3.4 GHz2 / 4 cores4 MB L3
AMD Ryzen Embedded R1505G2.4 - 3.3 GHz2 / 4 cores4 MB L3
AMD Athlon 300U2.4 - 3.3 GHz2 / 4 cores4 MB L3
Intel Core i9-11900KB3.3 - 5.3 GHz8 / 16 cores24 MB L3
Intel Core i9-11900H2.5 - 4.9 GHz8 / 16 cores24 MB L3
Intel Core i9-11950H2.6 - 5 GHz8 / 16 cores24 MB L3
Intel Xeon W-11955M2.6 - 5 GHz8 / 16 cores24 MB L3
Intel Core i7-11850H2.5 - 4.8 GHz8 / 16 cores24 MB L3
Intel Core i7-11800H2.3 - 4.6 GHz8 / 16 cores24 MB L3
Intel Xeon W-11855M3.2 - 4.9 GHz6 / 12 cores18 MB L3
Intel Core i5-11500B « 3.3 - 4.6 GHz6 / 12 cores12 MB L3
Intel Core i5-11400H2.7 - 4.5 GHz6 / 12 cores12 MB L3
Intel Core i5-11260H2.6 - 4.4 GHz6 / 12 cores12 MB L3
Intel Core i9-11900KB « 3.3 - 5.3 GHz8 / 16 cores24 MB L3
Intel Core i9-11900H2.5 - 4.9 GHz8 / 16 cores24 MB L3
Intel Core i9-11950H2.6 - 5 GHz8 / 16 cores24 MB L3
Intel Xeon W-11955M2.6 - 5 GHz8 / 16 cores24 MB L3
Intel Core i7-11850H2.5 - 4.8 GHz8 / 16 cores24 MB L3
Intel Core i7-11800H2.3 - 4.6 GHz8 / 16 cores24 MB L3
Intel Xeon W-11855M3.2 - 4.9 GHz6 / 12 cores18 MB L3
Intel Core i5-11500B3.3 - 4.6 GHz6 / 12 cores12 MB L3
Intel Core i5-11400H2.7 - 4.5 GHz6 / 12 cores12 MB L3
Intel Core i5-11260H2.6 - 4.4 GHz6 / 12 cores12 MB L3
Clock2000 - 3600 MHz3300 - 4600 MHz3300 - 5300 MHz
L1 Cache384 KB480 KB768 KB
L2 Cache2 MB7.5 MB10 MB
L3 Cache4 MB12 MB24 MB
Cores / Threads4 / 86 / 128 / 16
TDP15 Watt65 Watt65 Watt
Transistors4500 Million
Technology14 nm10 nm10 nm
max. Temp.105 °C100 °C100 °C
SocketAM4BGA1787BGA 1499
FeaturesXFR, FMA3, SSE 4.2, AVX2, SMTDDR4-3200 RAM, PCIe 4, 8 GT/s bus, DL Boost, GNA, MMX, SSE, SSE2, SSE3, SSSE3, SSE4.1, SSE4.2, AVX, AVX2, AVX-512, BMI2, ABM, FMA, ADX, VMX, SMEP, SMAP, EIST, TM1, TM2, HT, Turbo, SST, AES-NI, RDRAND, RDSEED, SHAAVX512, Intel Xe Graphics 32 EUs, DDR4-3200
iGPUAMD Radeon RX Vega 8 (Ryzen 2000/3000) ( - 1100 MHz)Intel UHD Graphics Xe 32EUs (Tiger Lake-H) (350 - 1450 MHz)Intel UHD Graphics Xe 32EUs (Tiger Lake-H) (350 - 1450 MHz)
Architecturex86x86x86
Announced
Manufacturerwww.amd.com
$539 U.S.

Benchmarks

Performance Rating - CB R15 + R20 + 7-Zip + X265 + Blender + 3DM11 CPU - i5-11500B
33.7 pt (56%)
Restrict / Search: Model: Max. age: years
Performance Rating - CB R15 + R20 + 7-Zip + X265 + Blender + 3DM11 CPU - i9-11900KB
36.9 pt (61%)
Restrict / Search: Model: Max. age: years
Cinebench 2024 - Cinebench 2024 CPU Single Core
88 Points (49%)
Cinebench 2024 - Cinebench 2024 CPU Multi Core
451 Points (8%)
Cinebench R23 - Cinebench R23 Multi Core
8318 Points (8%)
11726 Points (11%)
Cinebench R23 - Cinebench R23 Single Core
1484 Points (62%)
1621 Points (68%)
Cinebench R20 - Cinebench R20 CPU (Single Core)
566 Points (62%)
629 Points (69%)
Cinebench R20 - Cinebench R20 CPU (Multi Core)
3236 Points (8%)
4644 Points (11%)
Cinebench R15 - Cinebench R15 CPU Multi 64 Bit
min: 541     avg: 561     median: 553 (3%)     max: 589 Points
1322 Points (8%)
2027 Points (13%)
Cinebench R15 - Cinebench R15 CPU Single 64 Bit
min: 132     avg: 135     median: 134 (37%)     max: 139 Points
223 Points (62%)
247 Points (68%)
Cinebench R11.5 - Cinebench R11.5 CPU Multi 64 Bit
min: 6.04     avg: 6.3     median: 6.1 (8%)     max: 6.74 Points
15 Points (19%)
22.1 Points (29%)
Cinebench R11.5 - Cinebench R11.5 CPU Single 64 Bit
min: 1.5     avg: 1.5     median: 1.6 (37%)     max: 1.58 Points
2.6 Points (62%)
2.8 Points (67%)
Cinebench R10 - Cinebench R10 Rend. Single (32bit)
min: 4204     avg: 4312     median: 4349 (26%)     max: 4382 Points
9000 Points (54%)
9538 Points (58%)
Cinebench R10 - Cinebench R10 Rend. Multi (32bit)
min: 12294     avg: 14380     median: 14336 (10%)     max: 16509 Points
41001 Points (30%)
50665 Points (37%)
Cinebench R10 - Cinebench R10 Rend. Multi (64bit)
min: 20209     avg: 20660     median: 20659.5 (13%)     max: 21110 Points
54928 Points (35%)
67183 Points (43%)
Cinebench R10 - Cinebench R10 Rend. Single (64bit)
min: 6921     avg: 7052     median: 7052 (9%)     max: 7183 Points
11802 Points (14%)
12508 Points (15%)
wPrime 2.10 - wPrime 2.0 1024m *
min: 386.4     avg: 386.6     median: 386.6 (5%)     max: 386.7 s
152 s (2%)
102.2 s (1%)
wPrime 2.10 - wPrime 2.0 32m *
min: 12.25     avg: 12.4     median: 12.4 (2%)     max: 12.47 s
4.6 s (1%)
3.4 s (1%)
WinRAR - WinRAR 4.0
min: 2677     avg: 2700     median: 2699.5 (4%)     max: 2722 Points
6789 Points (11%)
9584 Points (15%)
7-Zip 18.03 - 7-Zip 18.03 Multi Thread 4 runs
2794 MIPS (2%)
36194 MIPS (21%)
50152 MIPS (29%)
7-Zip 18.03 - 7-Zip 18.03 Single Thread 4 runs
4102 MIPS (48%)
5498 MIPS (65%)
5979 MIPS (70%)
X264 HD Benchmark 4.0 - x264 Pass 2
min: 32.42     avg: 33.9     median: 33.9 (11%)     max: 35.4 fps
68.7 fps (23%)
106 fps (35%)
X264 HD Benchmark 4.0 - x264 Pass 1
min: 68.4     avg: 97.7     median: 97.7 (23%)     max: 127 fps
234.5 fps (54%)
272.5 fps (63%)
HWBOT x265 Benchmark v2.2 - HWBOT x265 4k Preset
3 fps (5%)
10.3 fps (18%)
14.4 fps (25%)
TrueCrypt - TrueCrypt Serpent
min: 0.376     avg: 0.4     median: 0.4 (12%)     max: 0.409 GB/s
0.8 GB/s (24%)
1.1 GB/s (32%)
TrueCrypt - TrueCrypt Twofish
min: 0.54     avg: 0.6     median: 0.6 (10%)     max: 0.662 GB/s
1.3 GB/s (22%)
1.7 GB/s (29%)
TrueCrypt - TrueCrypt AES
min: 3.3     avg: 3.4     median: 3.4 (9%)     max: 3.5 GB/s
8.3 GB/s (22%)
11.6 GB/s (30%)
Blender - Blender 3.3 Classroom CPU *
673 Seconds (9%)
Blender - Blender 2.79 BMW27 CPU *
min: 900     avg: 1007     median: 1007 (7%)     max: 1114 Seconds
379 Seconds (3%)
262.7 Seconds (2%)
R Benchmark 2.5 - R Benchmark 2.5 *
0.6 sec (12%)
0.5 sec (12%)
3DMark 06 - CPU - 3DMark 06 - CPU
min: 3945     avg: 5161     median: 5635 (12%)     max: 5904 Points
12580 Points (27%)
14961 Points (32%)
Super Pi mod 1.5 XS 1M - Super Pi mod 1.5 XS 1M *
min: 12.56     avg: 12.7     median: 12.7 (3%)     max: 12.84 s
7.3 s (2%)
6.7 s (1%)
Super Pi mod 1.5 XS 2M - Super Pi mod 1.5 XS 2M *
min: 28.85     avg: 29.4     median: 29.3 (1%)     max: 29.84 s
16 s (1%)
14.4 s (1%)
Super Pi Mod 1.5 XS 32M - Super Pi mod 1.5 XS 32M *
min: 714     avg: 729     median: 728.5 (3%)     max: 743 s
373 s (2%)
343.2 s (2%)
3DMark Vantage - 3DM Vant. Perf. CPU no Physx
47824 Points (37%)
66833 Points (51%)
3DMark 11 - 3DM11 Performance Physics
min: 5540     avg: 5874     median: 5673 (14%)     max: 6608 Points
13784 Points (34%)
17803 Points (44%)
3DMark - 3DMark Ice Storm Physics
min: 34587     avg: 35370     median: 35245 (29%)     max: 36279 Points
70795 Points (58%)
77901 Points (63%)
3DMark - 3DMark Ice Storm Extreme Physics
min: 30318     avg: 33819     median: 35419 (29%)     max: 35721 Points
70878 Points (58%)
78146 Points (63%)
3DMark - 3DMark Ice Storm Unlimited Physics
min: 28138     avg: 29521     median: 29789 (24%)     max: 30637 Points
74085 Points (59%)
89952 Points (72%)
3DMark - 3DMark Cloud Gate Physics
min: 3259     avg: 5254     median: 5586.5 (14%)     max: 6584 Points
12557 Points (32%)
16497 Points (42%)
3DMark - 3DMark Fire Strike Standard Physics
min: 6370     avg: 8014     median: 8405 (15%)     max: 8877 Points
19930 Points (36%)
24327 Points (43%)
3DMark - 3DMark Time Spy CPU
min: 1922     avg: 2225     median: 2322 (10%)     max: 2432 Points
7021 Points (30%)
10035 Points (42%)
Geekbench 6.4 - Geekbench 6.4 Single-Core
2173 Points (54%)
Geekbench 6.4 - Geekbench 6.4 Multi-Core
8148 Points (32%)
Geekbench 6.0 - Geekbench 6.0 Single-Core
2058 Points (65%)
Geekbench 6.0 - Geekbench 6.0 Multi-Core
7760 Points (32%)
Geekbench 5.5 - Geekbench 5.1 - 5.5 64 Bit Single-Core
887 Points (35%)
1566 Points (61%)
1656 Points (65%)
Geekbench 5.5 - Geekbench 5.1 - 5.5 64 Bit Multi-Core
3135 Points (6%)
7132 Points (13%)
8924 Points (16%)
Geekbench 5.0 - Geekbench 5.0 64 Bit Single-Core
1535 Points (7%)
1638 Points (7%)
Geekbench 5.0 - Geekbench 5.0 64 Bit Multi-Core
7012 Points (22%)
8845 Points (28%)
Geekbench 4.4 - Geekbench 4.1 - 4.4 64 Bit Single-Core
min: 3353     avg: 3492     median: 3492 (35%)     max: 3631 Points
6663 Points (67%)
6991 Points (70%)
Geekbench 4.4 - Geekbench 4.1 - 4.4 64 Bit Multi-Core
min: 9096     avg: 9629     median: 9343 (9%)     max: 10447 Points
28454 Points (28%)
36310 Points (36%)
Geekbench 4.0 - Geekbench 4.0 64 Bit Single-Core
min: 3430     avg: 3480     median: 3480 (38%)     max: 3530 Points
Geekbench 4.0 - Geekbench 4.0 64 Bit Multi-Core
min: 9398     avg: 9760     median: 9759.5 (13%)     max: 10121 Points
Geekbench 3 - Geekbench 3 32 Bit Multi-Core
min: 12111     avg: 12422     median: 12421.5 (22%)     max: 12732 Points
Geekbench 3 - Geekbench 3 32 Bit Single-Core
min: 3218     avg: 3326     median: 3326 (43%)     max: 3434 Points
Geekbench 3 - Geekbench 3 64 Bit Multi-Core
min: 12561     avg: 12956     median: 12956 (20%)     max: 13351 Points
Geekbench 3 - Geekbench 3 64 Bit Single-Core
min: 3486     avg: 3600     median: 3600 (54%)     max: 3714 Points
Geekbench 2 - 32 Bit - Geekbench Stream
min: 5889     avg: 6820     median: 6820 (36%)     max: 7751 Points
Geekbench 2 - 32 Bit - Geekbench Memory
min: 5363     avg: 6035     median: 6034.5 (42%)     max: 6706 Points
Geekbench 2 - 32 Bit - Geekbench Floating Point
min: 16158     avg: 16310     median: 16310 (32%)     max: 16462 Points
Geekbench 2 - 32 Bit - Geekbench Integer
min: 10070     avg: 10169     median: 10168.5 (20%)     max: 10267 Points
Geekbench 2 - 32 Bit - Geekbench Total Score
min: 10841     avg: 11156     median: 11156 (29%)     max: 11471 Points
Mozilla Kraken 1.1 - Kraken 1.1 Total Score *
min: 1376     avg: 1488     median: 1429 (2%)     max: 1659 ms
649 ms (1%)
602 ms (1%)
Sunspider - Sunspider 1.0 Total Score *
138.1 ms (2%)
Octane V2 - Octane V2 Total Score
min: 23903     avg: 24308     median: 24308 (18%)     max: 24713 Points
WebXPRT 3 - WebXPRT 3 Score
271 Points (49%)
269 Points (48%)
CrossMark - CrossMark Overall
1416 Points (53%)
1785 Points (67%)
Power Consumption - Prime95 Power Consumption - external Monitor *
75.7 Watt (13%)
112.9 Watt (19%)
Power Consumption - Cinebench R15 Multi Power Consumption - external Monitor *
95 Watt (17%)
123.9 Watt (23%)
Power Consumption - Idle Power Consumption - external Monitor *
14.5 Watt (10%)
Power Consumption - Power Efficiency - Cinebench R15 Multi external Monitor
13.9 Points per Watt (10%)
16.4 Points per Watt (12%)

Average Benchmarks AMD Ryzen 5 PRO 2500U → 100% n=36

Average Benchmarks Intel Core i5-11500B → 256% n=36

Average Benchmarks Intel Core i9-11900KB → 328% n=36

- Range of benchmark values for this graphics card
red legend - Average benchmark values for this graphics card
* Smaller numbers mean a higher performance
1 This benchmark is not used for the average calculation

v1.33
log 24. 15:03:39

#0 ran 0s before starting gpusingle class +0s ... 0s

#1 checking url part for id 10130 +0s ... 0s

#2 checking url part for id 17400 +0s ... 0s

#3 checking url part for id 14024 +0s ... 0s

#4 redirected to Ajax server, took 1756040618s time from redirect:0 +0s ... 0s

#5 did not recreate cache, as it is less than 5 days old! Created at Fri, 22 Aug 2025 05:18:47 +0200 +0s ... 0s

#6 composed specs +0.005s ... 0.005s

#7 did output specs +0s ... 0.005s

#8 getting avg benchmarks for device 10130 +0s ... 0.006s

#9 got single benchmarks 10130 +0.001s ... 0.006s

#10 getting avg benchmarks for device 17400 +0.004s ... 0.011s

#11 got single benchmarks 17400 +0.004s ... 0.015s

#12 getting avg benchmarks for device 14024 +0.005s ... 0.02s

#13 got single benchmarks 14024 +0.005s ... 0.024s

#14 got avg benchmarks for devices +0s ... 0.024s

#15 min, max, avg, median took s +0.064s ... 0.088s

#16 return log +0s ... 0.088s

Please share our article, every link counts!
Mail Logo
> Expert Reviews and News on Laptops, Smartphones and Tech Innovations > Benchmarks / Tech > Processor Comparison - Head 2 Head
Redaktion, 2017-09- 8 (Update: 2023-07- 1)