Notebookcheck Logo

AMD Ryzen 5 5600G vs AMD Ryzen 7 7730U vs AMD Ryzen 7 5700G

AMD Ryzen 5 5600G

► remove from comparison AMD R5 5600G

The AMD Ryzen 5 5600G is a Zen 3-based, desktop-grade APU featuring the Radeon Vega 7 graphics adapter. This Ryzen 5 was unveiled in H1 2021. It features six SMT-enabled CPU cores for 12 threads in total, running at 3.9 GHz to 4.4 GHz.

The CPU ships with AMD's Wraith Stealth cooler (as long as it's not an OEM version).

Architecture

Zen 3-based processors bring a moderate performance boost over Zen 2 generation CPUs. Core counts are left where they were before, while per-MHz performance is getting several percentage points higher.

Ryzen 5 5600G's CPU cores have access to 16 MB of L3 cache. The processor is compatible with DDR4-3200 RAM and has plenty of PCI-Express 3.0 lanes for connecting graphics cards, SSDs and other devices. Four PCI-Express 3.0 lanes allow for read/write rates of up to 3.9 GB/s, provided a sufficiently fast NVMe SSD is used. PCI-Express 4.0 spec is not supported here, since Ryzen 5 5600G is pretty much a laptop-grade SoC in disguise rather than a "proper" desktop chip, like a Ryzen 5 5600X.

You can replace this Ryzen with a faster CPU easily as it uses AMD's AM4 socket interface. Another way to get a performance boost would be to overclock the CPU, which is easy to do with AMD's very own software (many motherboard vendors offer overclocking software of their own as well).

Performance

The six Zen 3 cores will rip through most workloads rutlessly, more demanding ones included (like gaming and high-res video editing). Multi-thread benchmarks put the R5 5600G in the same league as the Core i5-10600K, Core i7-10700, Core i5-11600K, Core i7-11850H. A huge advantage of the Ryzen over the aforementioned alternatives is its decent integrated graphics adapter - more on this below.

Graphics

The Radeon RX Vega 7 iGPU has seven Compute Units (= 448 shaders) and runs at up to 1,900 MHz. It is casual gaming-friendly, allowing one to play most games at 900p / Low quality preset. On the other hand, there is no SUHD 4320p monitor support here, nor can the graphics adapter HW-decode AV1, the latest video codec.

Fast RAM is a prerequisite for decent gaming performance as the Vega has no memory of its own.

Power consumption

This Ryzen 5 is manufactured on TSMC's 7 nm process for great, as of early 2022, energy efficiency.

The chip has a default TDP of 65 W (also known as the long-term Power Limit). According to AMD's guidelines, that 65 W value can be reduced by PC makers significantly, the lower limit being 45 W, resulting in lower temperatures, lower clock speeds and lower performance. Either way, an active cooling solution is a must for a system built around this Ryzen.

AMD Ryzen 7 7730U

► remove from comparison AMD R7 7730U

The AMD Ryzen 7 7730U is a processor for thin and light laptops based on the Cezanne generation. It is part of the second "Barcelo" refresh in early 2023 and offers the same specifications as the old Ryzen 7 5825U. The CPU integrates all eight cores based on the Zen 3 microarchitecture clocked at 2 (guaranteed base clock) to 4.5 GHz (Turbo) and support SMT / Hyperthreading (16 threads). The chip is manufactured in 7nm at TSMC.

The Zen 3 microarchitecture offers a significantly higher IPC (instructions per clock) compared to Zen 2 but stays behind the current Zen 4 based CPUs (e.g. 7040HS series).

Performance

The average 7730U in our database is in the same league as the Ryzen 7 5825U, Ryzen 7 6800U, Ryzen 7 PRO 6850U and also the Core i7-1360P, as far as multi-thread benchmark scores are concerned.

Thanks to its decent cooling solution and a long-term CPU power limit of 30 W, the ThinkPad E14 G5-21JSS05C00 is among the fastest laptops built around the 7730U that we know of. It can be almost 40% faster in CPU-bound workloads than the slowest system featuring the same chip in our database, as of August 2023.

In addition to the eight CPU cores, the APU also integrates a Radeon RX Vega 8 GPU with 8 CUs at up to 2000 MHz. The dual channel memory controller supports DDR4-3200 and energy efficient LPDDR4-4266 RAM. Furthermore, 16 MB level 3 cache (up from 8 MB at the 4800U) can be found on the chip.

The TDP of the APU is specified at 15 Watt (the 5825U was specified at 10 - 25W). 

AMD Ryzen 7 5700G

► remove from comparison AMD R7 5700G

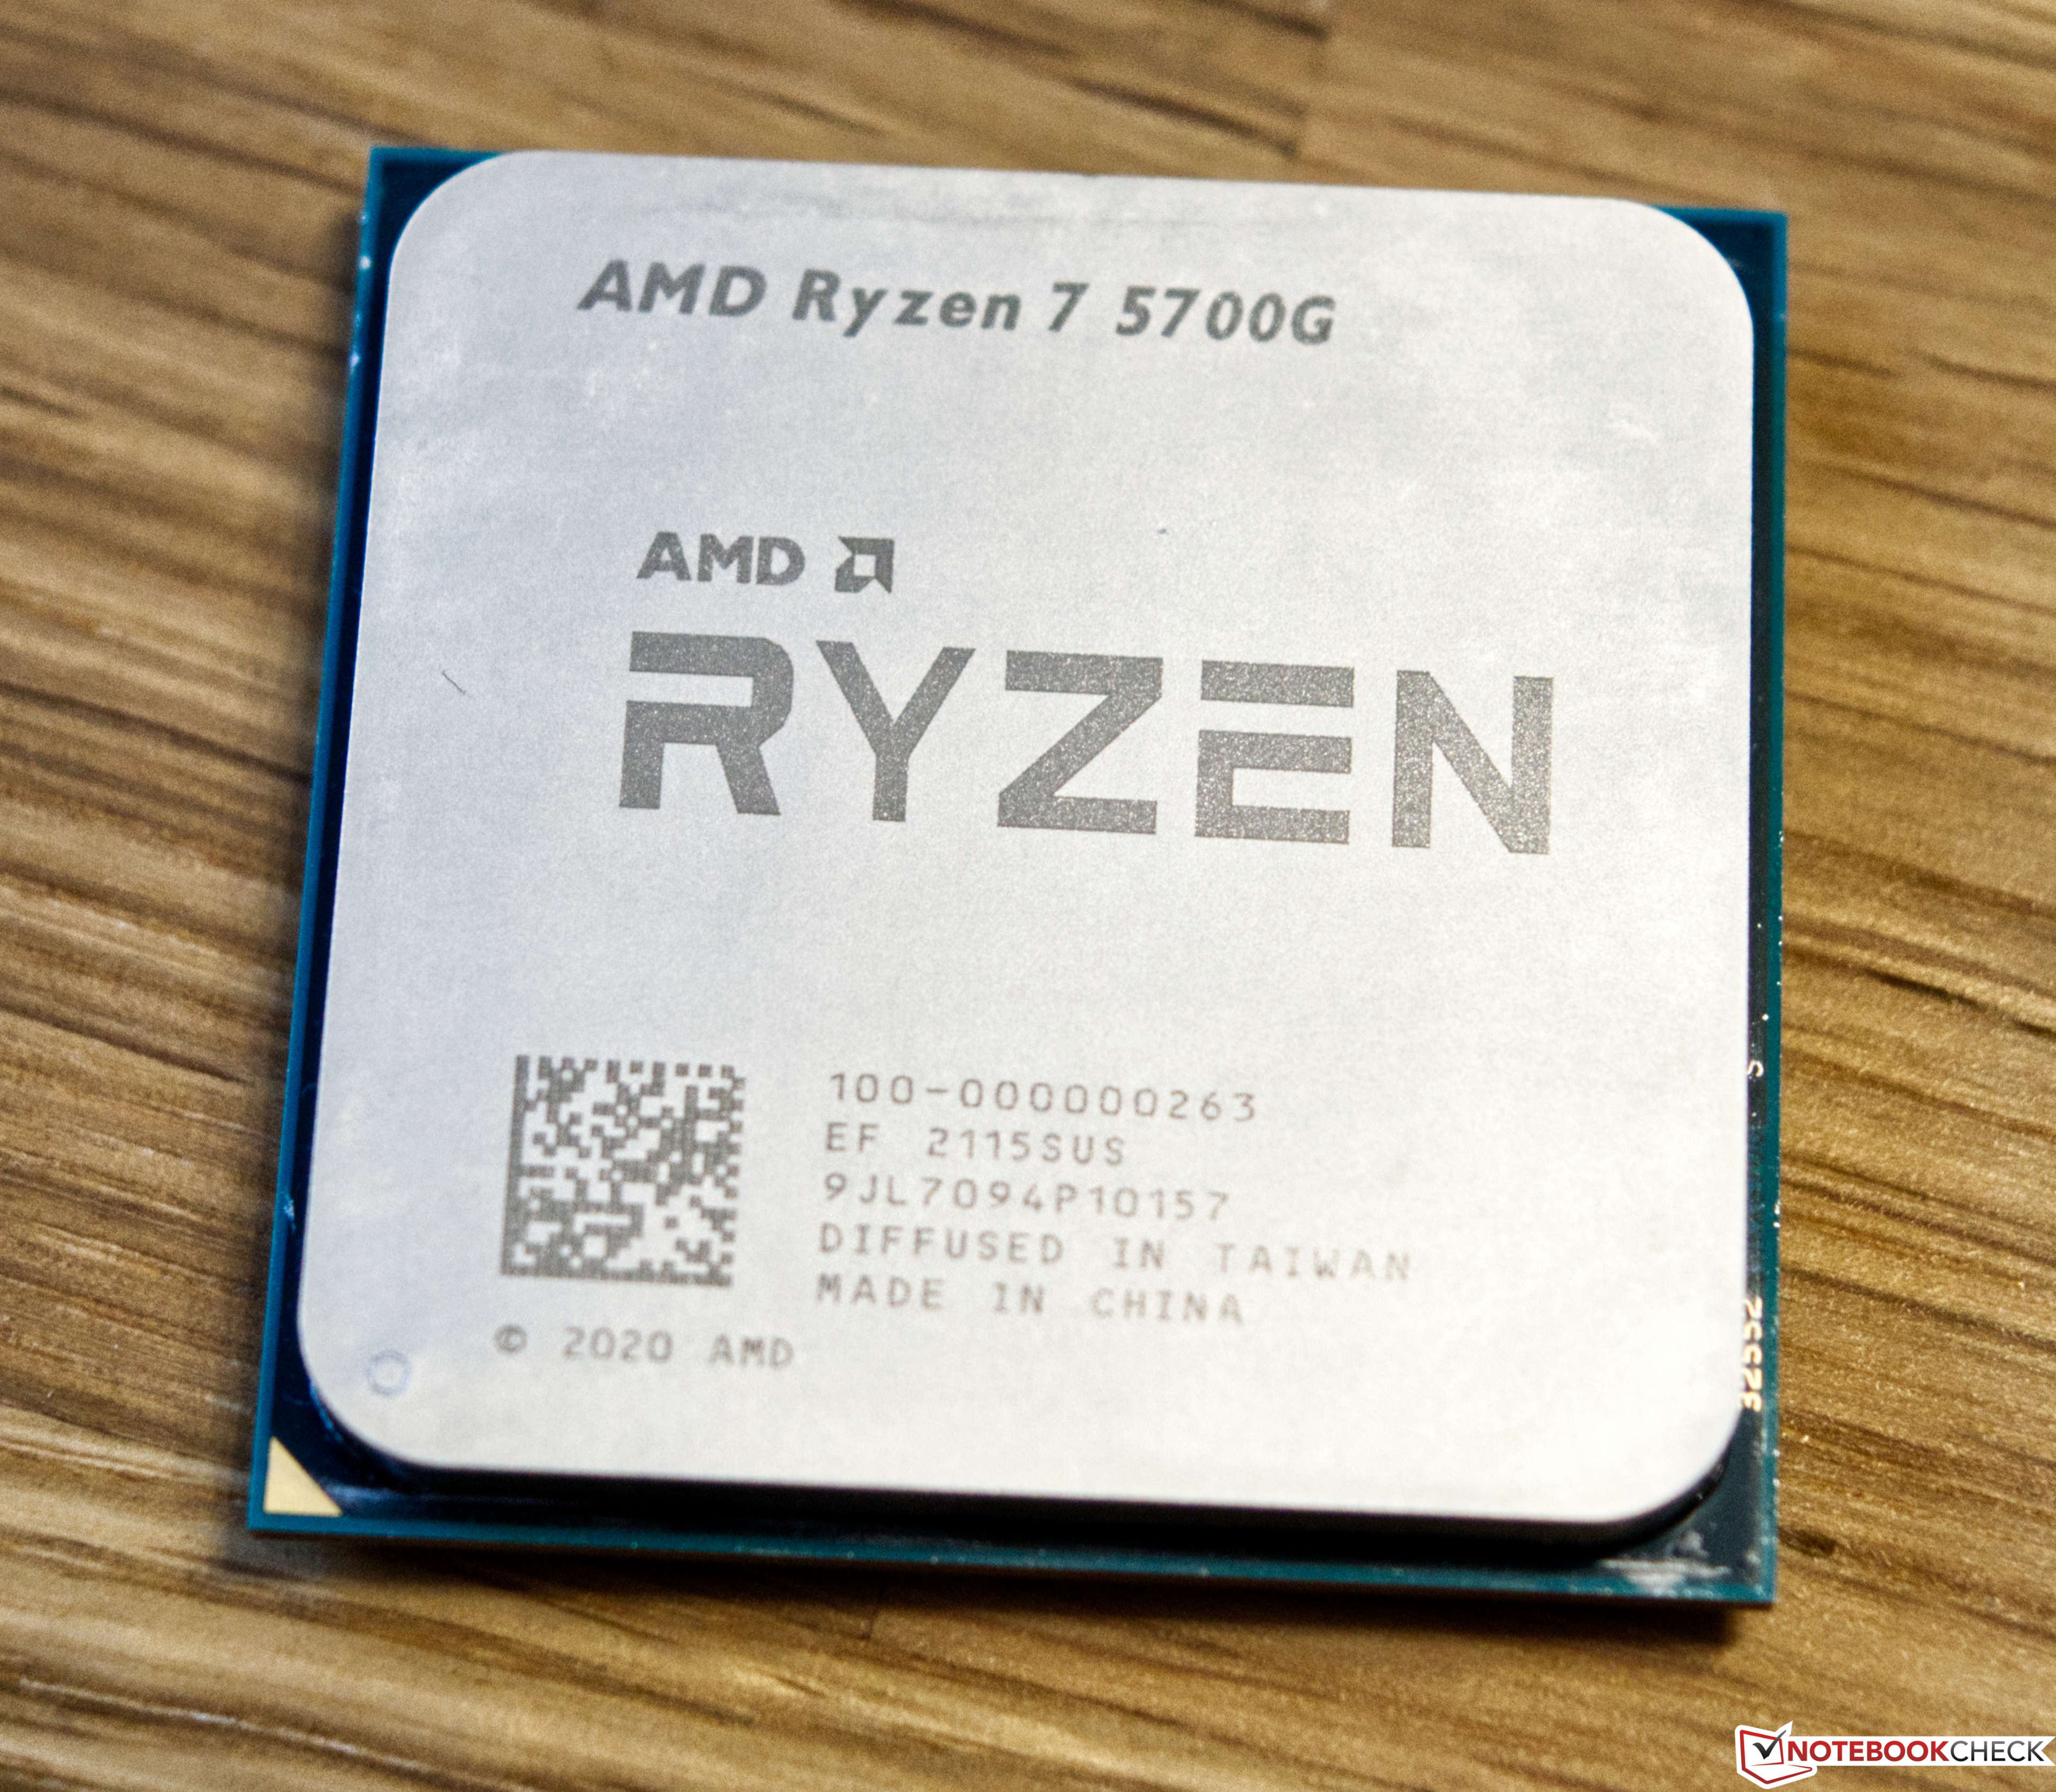
The AMD Ryzen 7 5700G is a desktop APU with 8 cores and part of the Cezanne product family. The 8 cores are based on the Zen 3 architecture and can clock between 3.8 to 4.6 GHz. Thanks to Simultaneous Multithreading (SMT), the CPU supports up to 16 threads at once. At time of the launch, the 5700G is the fastest 8-core-CPU with an iGPU from AMD.

The integrated AMD Radeon RX Vega 8 is currently one of the fastest iGPUs and capable of 1080p gaming at low details.

Performance

The 5700G delivers very serviceable multi-thread performance, as of mid 2022, trading blows with upper mid-range chips such as the Ryzen 7 3700X and the Core i5-12500H. Besides, the consumer is officially allowed to overclock the thing, creating a bit of a performance gain out of thin air. Find out more by reading our full Ryzen 7 5700G review.

Power consumption

This Ryzen 7 series APU has a default TDP, also known as the long-term power limit, of 65 W. PC makers are free to reduce that somewhat with 45 W being the minimum AMD-recommended value. Clock speeds and performance would take a hit as a result.

The R7 5700G is built with TSMC's 7 nm manufacturing process for average, as of mid 2023, energy efficiency.

ModelAMD Ryzen 5 5600GAMD Ryzen 7 7730UAMD Ryzen 7 5700G
SeriesAMD Cezanne (Zen 3, Ryzen 5000)AMD Cezanne (Zen 3, Ryzen 5000)AMD Cezanne (Zen 3, Ryzen 5000)
CodenameCezanneBarcelo-U RefreshCezanne (Zen 3)
Clock3900 - 4400 MHz2000 - 4500 MHz3800 - 4600 MHz
L1 Cache384 KB512 KB512 KB
L2 Cache3 MB4 MB4 MB
L3 Cache16 MB16 MB16 MB
Cores / Threads6 / 128 / 168 / 16
TDP65 Watt15 Watt65 Watt
Technology7 nm7 nm7 nm
max. Temp.95 °C95 °C95 °C
SocketAM4FP6AM4
FeaturesDDR4-3200 RAM, PCIe 3, MMX, SSE, SSE2, SSE3, SSSE3, SSE4A, SSE4.1, SSE4.2, AVX, AVX2, BMI2, ABM, FMA, ADX, SMEP, SMAP, SMT, CPB, AES-NI, RDRAND, RDSEED, SHA, SMEDDR4-3200/LPDDR4x-4266 RAM (incl. ECC), PCIe 3, MMX, SSE, SSE2, SSE3, SSSE3, SSE4A, SSE4.1, SSE4.2, AVX, AVX2, BMI2, ABM, FMA, ADX, SMEP, SMAP, SMT, CPB, AES-NI, RDRAND, RDSEED, SHA, SMEDDR4-3200 RAM, PCIe 3, MMX, SSE, SSE2, SSE3, SSSE3, SSE4A, SSE4.1, SSE4.2, AVX, AVX2, BMI2, ABM, FMA, ADX, SMEP, SMAP, SMT, CPB, AES-NI, RDRAND, RDSEED, SHA, SME
iGPUAMD Radeon RX Vega 7 ( - 1900 MHz)AMD Radeon RX Vega 8 (Ryzen 4000/5000) ( - 2000 MHz)AMD Radeon RX Vega 8 (Ryzen 4000/5000) ( - 2000 MHz)
Architecturex86x86x86
Announced
Manufacturerwww.amd.comwww.amd.comwww.amd.com
Series: Cezanne (Zen 3, Ryzen 5000) Barcelo-U Refresh
AMD Ryzen 7 7730U « 2 - 4.5 GHz8 / 16 cores16 MB L3
AMD Ryzen 7 PRO 7730U2 - 4.5 GHz8 / 16 cores16 MB L3
AMD Ryzen 5 7530U2 - 4.5 GHz6 / 12 cores16 MB L3
AMD Ryzen 5 PRO 7530U2 - 4.5 GHz6 / 12 cores16 MB L3
$359 U.S.

Benchmarks

Performance Rating - CB R15 + R20 + 7-Zip + X265 + Blender + 3DM11 CPU - R5 5600G
38.1 pt (53%)
Performance Rating - CB R15 + R20 + 7-Zip + X265 + Blender + 3DM11 CPU - R7 7730U
38.3 pt (53%)
Performance Rating - CB R15 + R20 + 7-Zip + X265 + Blender + 3DM11 CPU - R7 5700G
40.7 pt (56%)
Cinebench R23 - Cinebench R23 Multi Core
10551 Points (10%)
min: 7286     avg: 10291     median: 10801.5 (10%)     max: 11490 Points
min: 11873     avg: 12831     median: 12830.5 (12%)     max: 13788 Points
Cinebench R23 - Cinebench R23 Single Core
1409 Points (60%)
min: 1335     avg: 1435     median: 1454.5 (62%)     max: 1466 Points
min: 1493     avg: 1494     median: 1494 (64%)     max: 1495 Points
Cinebench R20 - Cinebench R20 CPU (Single Core)
552 Points (61%)
min: 533     avg: 560     median: 566.5 (63%)     max: 573 Points
min: 583     avg: 584     median: 584 (65%)     max: 585 Points
Cinebench R20 - Cinebench R20 CPU (Multi Core)
4072 Points (10%)
min: 2849     avg: 3885     median: 4070.5 (10%)     max: 4267 Points
min: 4660     avg: 5016     median: 5015.5 (12%)     max: 5371 Points
Cinebench R15 - Cinebench R15 CPU Multi 64 Bit
1724 Points (11%)
min: 1588     avg: 1800     median: 1830 (12%)     max: 1942 Points
min: 1980     avg: 2107     median: 2107 (13%)     max: 2234 Points
Cinebench R15 - Cinebench R15 CPU Single 64 Bit
228 Points (69%)
min: 221     avg: 229.2     median: 231 (70%)     max: 233 Points
min: 242     avg: 242.5     median: 242.5 (73%)     max: 243 Points
Cinebench R11.5 - Cinebench R11.5 CPU Multi 64 Bit
19.9 Points (26%)
19.1 Points (25%)
min: 22.79     avg: 23.6     median: 23.6 (31%)     max: 24.37 Points
Cinebench R11.5 - Cinebench R11.5 CPU Single 64 Bit
2.7 Points (67%)
2.8 Points (69%)
min: 2.84     avg: 2.9     median: 2.9 (71%)     max: 2.87 Points
Cinebench R10 - Cinebench R10 Rend. Single (32bit)
6052 Points (37%)
6243 Points (38%)
min: 6183     avg: 6196     median: 6196 (37%)     max: 6209 Points
Cinebench R10 - Cinebench R10 Rend. Multi (32bit)
35552 Points (26%)
32670 Points (24%)
min: 37541     avg: 38827     median: 38826.5 (28%)     max: 40112 Points
Cinebench R10 - Cinebench R10 Rend. Multi (64bit)
57058 Points (40%)
min: 66237     avg: 68700     median: 68699.5 (48%)     max: 71162 Points
Cinebench R10 - Cinebench R10 Rend. Single (64bit)
11653 Points (14%)
min: 11351     avg: 11732     median: 11732 (14%)     max: 12113 Points
wPrime 2.10 - wPrime 2.0 1024m *
125.3 s (1%)
121.2 s (1%)
min: 90.5     avg: 94.6     median: 94.6 (1%)     max: 98.635 s
wPrime 2.10 - wPrime 2.0 32m *
4.5 s (1%)
4.4 s (1%)
min: 3.595     avg: 4.3     median: 4.3 (1%)     max: 5.067 s
WinRAR - WinRAR 4.0
7652 Points (12%)
5881 Points (9%)
min: 6960     avg: 7681     median: 7680.5 (12%)     max: 8401 Points
7-Zip 18.03 - 7-Zip 18.03 Multli Thread 4 runs
48700 MIPS (28%)
min: 40263     avg: 48295     median: 49424.5 (28%)     max: 51898 MIPS
min: 55046     avg: 59702     median: 59702 (34%)     max: 64358 MIPS
7-Zip 18.03 - 7-Zip 18.03 Single Thread 4 runs
5549 MIPS (66%)
min: 5222     avg: 5348     median: 5356 (64%)     max: 5426 MIPS
min: 5809     avg: 5814     median: 5813.5 (69%)     max: 5818 MIPS
X264 HD Benchmark 4.0 - x264 Pass 2
102.5 fps (36%)
90.9 fps (32%)
min: 116.8     avg: 123.4     median: 123.4 (43%)     max: 130 fps
X264 HD Benchmark 4.0 - x264 Pass 1
261.5 fps (60%)
236.2 fps (54%)
min: 263.5     avg: 273.8     median: 273.8 (63%)     max: 284 fps
HWBOT x265 Benchmark v2.2 - HWBOT x265 4k Preset
13.9 fps (24%)
min: 9.91     avg: 12.4     median: 12.7 (22%)     max: 13.7 fps
min: 14.8     avg: 15.8     median: 15.8 (28%)     max: 16.8 fps
TrueCrypt - TrueCrypt Serpent
0.9 GB/s (0%)
1 GB/s (0%)
min: 1     avg: 1.1     median: 1.1 (0%)     max: 1.1 GB/s
TrueCrypt - TrueCrypt Twofish
1.3 GB/s (22%)
1.4 GB/s (24%)
min: 1.5     avg: 1.6     median: 1.6 (28%)     max: 1.7 GB/s
TrueCrypt - TrueCrypt AES
9.7 GB/s (25%)
10.1 GB/s (26%)
min: 7.6     avg: 10.5     median: 10.5 (27%)     max: 13.4 GB/s
Blender - Blender 3.3 Classroom CPU *
min: 479     avg: 523     median: 499.5 (6%)     max: 648 Seconds
Blender - Blender 2.79 BMW27 CPU *
299.1 Seconds (2%)
min: 277     avg: 306.8     median: 296 (2%)     max: 374 Seconds
min: 213.6     avg: 232.9     median: 232.9 (2%)     max: 252.1 Seconds
R Benchmark 2.5 - R Benchmark 2.5 *
0.5 sec (11%)
min: 0.515     avg: 0.5     median: 0.5 (11%)     max: 0.543 sec
min: 0.4896     avg: 0.5     median: 0.5 (11%)     max: 0.4975 sec
3DMark 06 - CPU - 3DMark 06 - CPU
12904 Points (27%)
min: 14162     avg: 14372     median: 14324 (30%)     max: 14631 Points
Super Pi mod 1.5 XS 1M - Super Pi mod 1.5 XS 1M *
8.1 s (2%)
8 s (2%)
min: 7.685     avg: 7.8     median: 7.8 (2%)     max: 7.905 s
Super Pi mod 1.5 XS 2M - Super Pi mod 1.5 XS 2M *
17.5 s (1%)
17.5 s (1%)
min: 16.699     avg: 16.9     median: 16.9 (1%)     max: 17.15 s
Super Pi Mod 1.5 XS 32M - Super Pi mod 1.5 XS 32M *
416.8 s (2%)
438.1 s (2%)
min: 411.3     avg: 415.3     median: 415.3 (2%)     max: 419.234 s
3DMark Vantage - 3DM Vant. Perf. CPU no Physx
min: 68538     avg: 68808     median: 68807.5 (60%)     max: 69077 Points
3DMark 11 - 3DM11 Performance Physics
16538 Points (45%)
min: 12032     avg: 13262     median: 13137.5 (36%)     max: 14468 Points
min: 14277     avg: 16199     median: 15947 (43%)     max: 18372 Points
3DMark - 3DMark Ice Storm Physics
82675 Points (67%)
min: 86274     avg: 89153     median: 87786 (71%)     max: 93399 Points
3DMark - 3DMark Ice Storm Extreme Physics
82504 Points (67%)
min: 83584     avg: 88301     median: 87869 (71%)     max: 93449 Points
3DMark - 3DMark Ice Storm Unlimited Physics
84083 Points (71%)
min: 88825     avg: 92226     median: 90430 (76%)     max: 97422 Points
3DMark - 3DMark Cloud Gate Physics
14444 Points (37%)
min: 14599     avg: 15565     median: 15564.5 (39%)     max: 16530 Points
min: 16256     avg: 18080     median: 18640 (47%)     max: 19345 Points
3DMark - 3DMark Fire Strike Standard Physics
22382 Points (40%)
min: 17814     avg: 20902     median: 21100.5 (38%)     max: 22553 Points
min: 25160     avg: 26172     median: 26056 (46%)     max: 27300 Points
3DMark - 3DMark Time Spy CPU
8016 Points (34%)
min: 6221     avg: 6983     median: 6921.5 (29%)     max: 7756 Points
min: 7087     avg: 8705     median: 9285 (39%)     max: 9743 Points
Geekbench 6.2 - Geekbench 6.2 Single-Core
min: 1836     avg: 1924     median: 1960 (53%)     max: 1976 Points
Geekbench 6.2 - Geekbench 6.2 Multi-Core
min: 6918     avg: 7230     median: 7013 (28%)     max: 7760 Points
Geekbench 5.5 - Geekbench 5.1 - 5.4 64 Bit Single-Core
1506 Points (64%)
min: 1464     avg: 1480     median: 1479.5 (62%)     max: 1500 Points
min: 1560     avg: 1579     median: 1579 (67%)     max: 1598 Points
Geekbench 5.5 - Geekbench 5.1 - 5.4 64 Bit Multi-Core
8003 Points (14%)
min: 6747     avg: 7546     median: 7573 (14%)     max: 8257 Points
min: 7818     avg: 8681     median: 8681 (16%)     max: 9544 Points
Geekbench 5.0 - Geekbench 5.0 64 Bit Single-Core
1441 Points (6%)
min: 1408     avg: 1429     median: 1429 (6%)     max: 1450 Points
min: 1518     avg: 1522     median: 1521.5 (7%)     max: 1525 Points
Geekbench 5.0 - Geekbench 5.0 64 Bit Multi-Core
7991 Points (25%)
min: 7404     avg: 7765     median: 7765 (24%)     max: 8126 Points
min: 7806     avg: 8685     median: 8684.5 (27%)     max: 9563 Points
Geekbench 4.4 - Geekbench 4.1 - 4.4 64 Bit Single-Core
6450 Points (64%)
6092 Points (61%)
min: 6517     avg: 6630     median: 6630 (66%)     max: 6743 Points
Geekbench 4.4 - Geekbench 4.1 - 4.4 64 Bit Multi-Core
31424 Points (34%)
29078 Points (32%)
min: 31835     avg: 34403     median: 34402.5 (38%)     max: 36970 Points
Mozilla Kraken 1.1 - Kraken 1.1 Total Score *
min: 616     avg: 630     median: 630 (1%)     max: 649 ms
min: 587     avg: 596     median: 595.5 (1%)     max: 604 ms
Sunspider - Sunspider 1.0 Total Score *
min: 0     avg: 55.3     median: 55.3 (1%)     max: 110.6 ms
Octane V2 - Octane V2 Total Score
min: 69506     avg: 71631     median: 71624 (64%)     max: 73179 Points
74010 Points (67%)
WebXPRT 4 - WebXPRT 4 Score
min: 191.5     avg: 207.4     median: 210.5 (60%)     max: 211 Points
WebXPRT 3 - WebXPRT 3 Score
min: 251     avg: 262.5     median: 263 (55%)     max: 271 Points
min: 284     avg: 289.5     median: 289.5 (60%)     max: 295 Points
CrossMark - CrossMark Overall
1452 Points (56%)
min: 1296     avg: 1319     median: 1321 (51%)     max: 1350 Points
min: 1424     avg: 1450     median: 1449.5 (56%)     max: 1475 Points
Power Consumption - Prime95 Power Consumption - external Monitor *
165 Watt (28%)
min: 31.5     avg: 46.2     median: 46 (8%)     max: 58.3 Watt
min: 88.3     avg: 106.7     median: 106.7 (18%)     max: 125 Watt
Power Consumption - Cinebench R15 Multi Power Consumption - external Monitor *
144 Watt (26%)
min: 31.5     avg: 50.9     median: 46.3 (8%)     max: 67 Watt
min: 76.1     avg: 104.6     median: 104.6 (19%)     max: 133 Watt
Power Consumption - Idle Power Consumption - external Monitor *
min: 3.23     avg: 6.4     median: 6.5 (4%)     max: 11.5 Watt
min: 9.64     avg: 27.6     median: 27.6 (18%)     max: 45.6 Watt
Power Consumption - Idle Power Consumption 150cd 1min *
min: 4.99     avg: 7.6     median: 7.5 (8%)     max: 11.6 Watt
Power Consumption - Cinebench R15 Multi Power Efficiency - external Monitor
12 Points per Watt (9%)
min: 28.9     avg: 33.7     median: 33.7 (25%)     max: 38.6 Points per Watt
min: 16.8     avg: 21.4     median: 21.4 (16%)     max: 26 Points per Watt

Average Benchmarks AMD Ryzen 5 5600G → 100% n=37

Average Benchmarks AMD Ryzen 7 7730U → 98% n=37

Average Benchmarks AMD Ryzen 7 5700G → 109% n=37

- Range of benchmark values for this graphics card
- Average benchmark values for this graphics card
* Smaller numbers mean a higher performance
1 This benchmark is not used for the average calculation

v1.26
log 23. 07:45:37

#0 checking url part for id 14131 +0s ... 0s

#1 checking url part for id 14956 +0s ... 0s

#2 checking url part for id 14050 +0s ... 0s

#3 not redirecting to Ajax server +0s ... 0s

#4 did not recreate cache, as it is less than 5 days old! Created at Wed, 22 May 2024 05:37:27 +0200 +0.001s ... 0.001s

#5 composed specs +0.053s ... 0.054s

#6 did output specs +0s ... 0.054s

#7 getting avg benchmarks for device 14131 +0.02s ... 0.074s

#8 got single benchmarks 14131 +0.009s ... 0.083s

#9 getting avg benchmarks for device 14956 +0.015s ... 0.099s

#10 got single benchmarks 14956 +0.045s ... 0.143s

#11 getting avg benchmarks for device 14050 +0.022s ... 0.165s

#12 got single benchmarks 14050 +0.023s ... 0.188s

#13 got avg benchmarks for devices +0s ... 0.188s

#14 min, max, avg, median took s +0.619s ... 0.808s

#15 return log +0s ... 0.808s

Please share our article, every link counts!
> Expert Reviews and News on Laptops, Smartphones and Tech Innovations > Benchmarks / Tech > Processor Comparison - Head 2 Head
Redaktion, 2017-09- 8 (Update: 2023-07- 1)