Notebookcheck Logo

Intel Core 5 120U vs AMD Ryzen 7 7730U

Intel Core 5 120U

► remove from comparison Intel Core 5 120U

The Intel Core 5 120U is a mid-range notebook CPU based on the Raptor Lake-U Refresh (RPL-U) series (Alder Lake architecture), which was introduced in January 2024. The CPU offers 2 performance cores (P-cores, Golden Cove architecture) and 8 efficiency cores (E-cores, Gracemont architecture). The P-cores support hyperthreading (therefore 12 threads together) and clock from 1.4 to 5 GHz. The E-cores clock from 0.9 - 3.8 GHz and should offer comparable performance to old Skylake cores (e.g. i7-6300HQ). The C5 120U also supports vPro Essentials management features.

Performance

Due to the high clock rates, the performance is comparable to the old Core i7-1355U. As usual with Alder Lake, the performance is heavily dependent on the cooling and the TDP settings.

Graphics unit

Like its predecessor, Intel integrates an Intel Xe-based graphics unit in Alder Lake. 80 of the 96 EUs are activated on the 120U.

Features

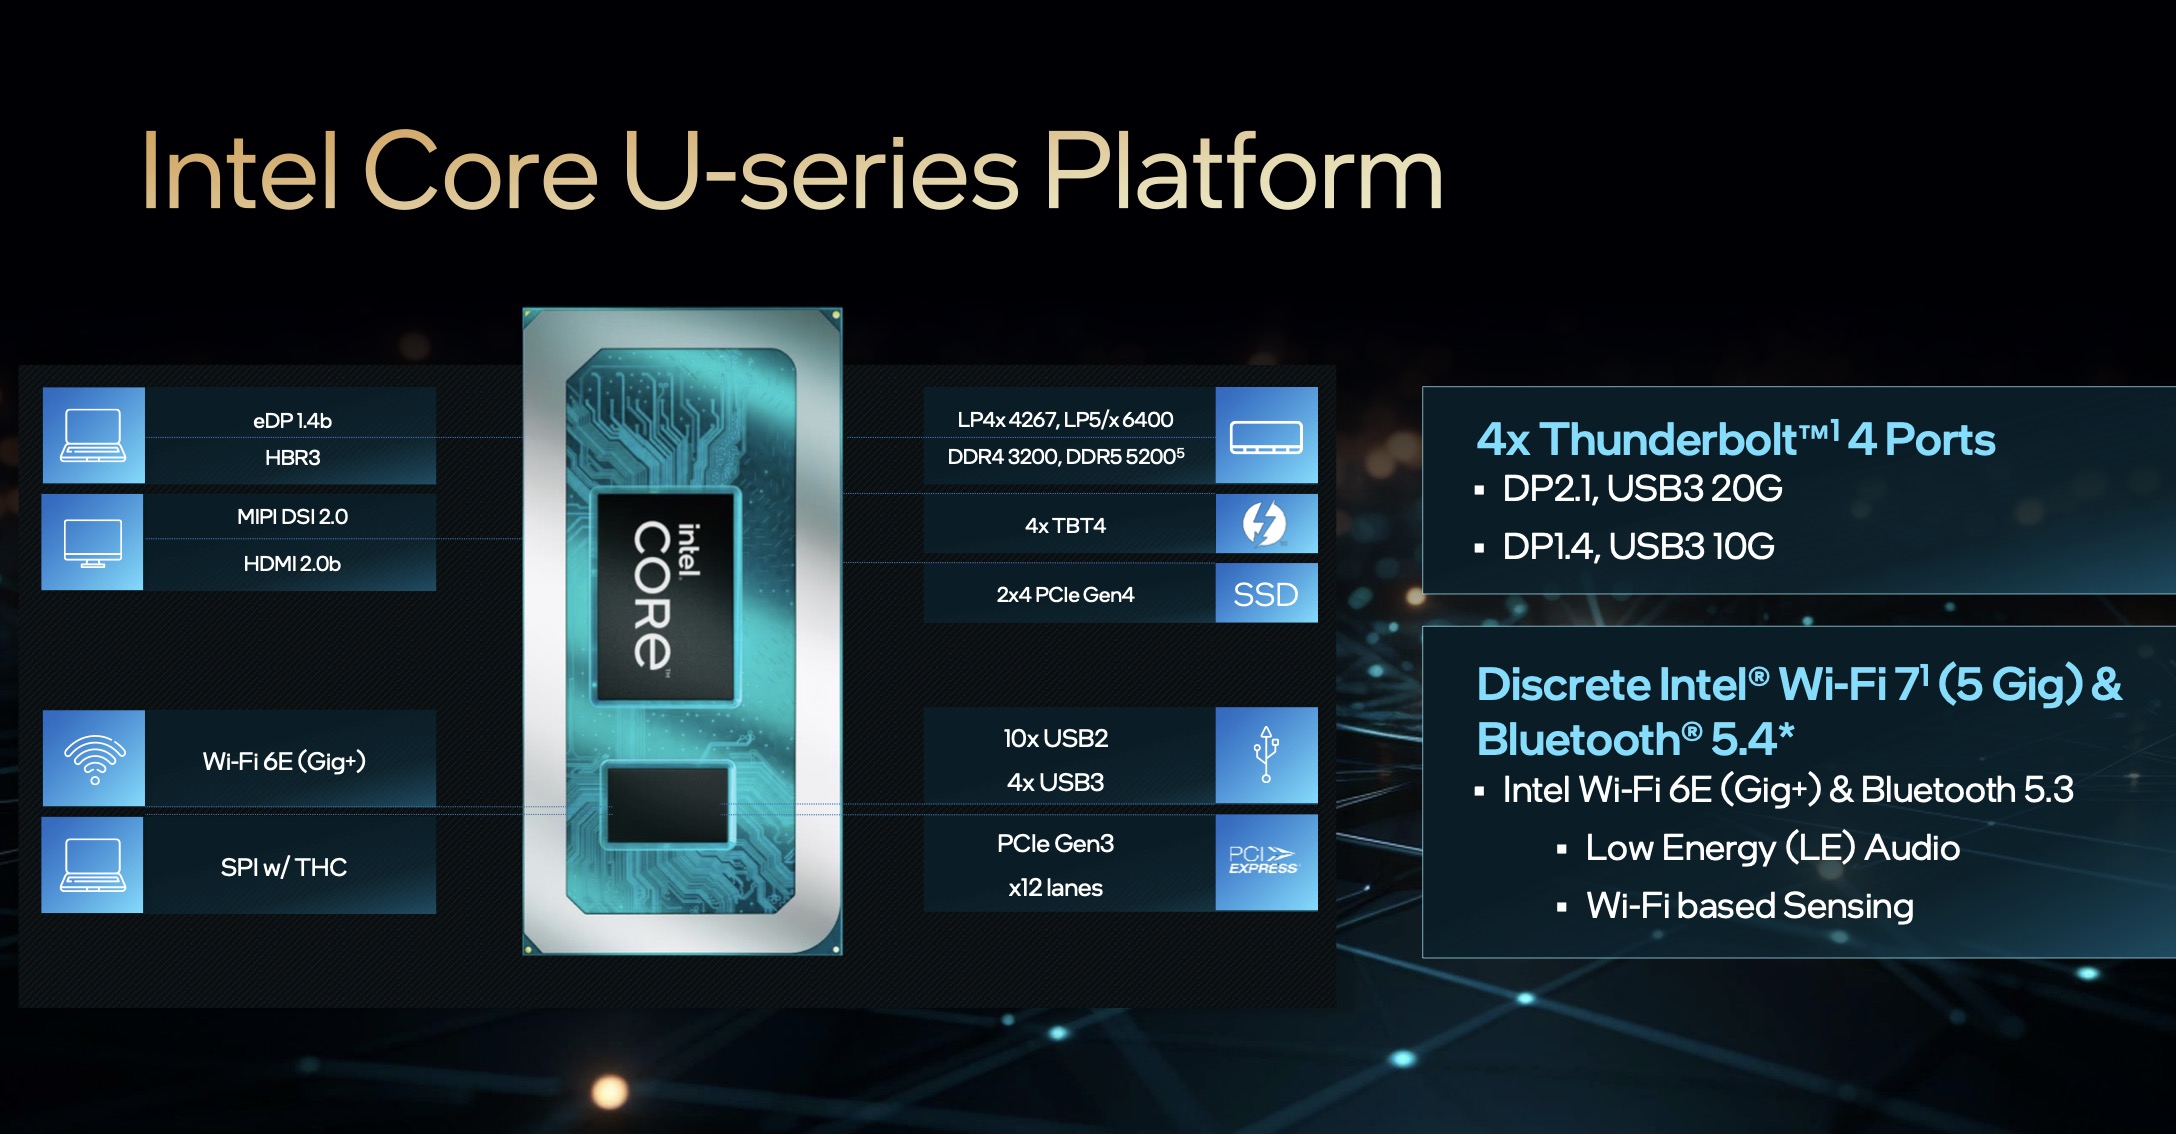
Like Tiger Lake, Alder-Lake-P also has WiFi 6E and Thunderbolt 4 (4x) partially integrated. The integrated memory controller supports LPDDR5-6400 and the integrated Gaussian and Neural Accelerator (GNA) is installed in version 3.0. The Quick Sync 8 media engine is the same as in Rocket Lake and supports MPEG-2, AVC, VC-1 decode, JPEG, VP8 decode, VP9, HEVC and AV1 decode. The chip still only supports PCIe 4.0 (x8 for GPU and two x4 for SSDs).

Power consumption

The Intel Core 5 120U is specified with 15 watts (PL1) TDP and 55 watts (PL2) max. turbo power. The processor is manufactured using the further improved Intel 7 process (10 nm SuperFin).

AMD Ryzen 7 7730U

► remove from comparison AMD R7 7730U

The AMD Ryzen 7 7730U is a processor for thin and light laptops based on the Cezanne generation. It is part of the second "Barcelo" refresh in early 2023 and offers the same specifications as the old Ryzen 7 5825U. The CPU integrates all eight cores based on the Zen 3 microarchitecture clocked at 2 (guaranteed base clock) to 4.5 GHz (Turbo) and support SMT / Hyperthreading (16 threads). The chip is manufactured in 7nm at TSMC.

The Zen 3 microarchitecture offers a significantly higher IPC (instructions per clock) compared to Zen 2 but stays behind the current Zen 4 based CPUs (e.g. 7040HS series).

Performance

The average 7730U in our database is in the same league as the Ryzen 7 5825U, Ryzen 7 6800U, Ryzen 7 PRO 6850U and also the Core i7-1360P, as far as multi-thread benchmark scores are concerned.

Thanks to its decent cooling solution and a long-term CPU power limit of 30 W, the ThinkPad E14 G5-21JSS05C00 is among the fastest laptops built around the 7730U that we know of. It can be almost 40% faster in CPU-bound workloads than the slowest system featuring the same chip in our database, as of August 2023.

In addition to the eight CPU cores, the APU also integrates a Radeon RX Vega 8 GPU with 8 CUs at up to 2000 MHz. The dual channel memory controller supports DDR4-3200 and energy efficient LPDDR4-4266 RAM. Furthermore, 16 MB level 3 cache (up from 8 MB at the 4800U) can be found on the chip.

The TDP of the APU is specified at 15 Watt (the 5825U was specified at 10 - 25W). 

ModelIntel Core 5 120UAMD Ryzen 7 7730U
CodenameRaptor Lake-U RefreshBarcelo-U Refresh
SeriesIntel Raptor Lake-UAMD Cezanne (Zen 3, Ryzen 5000)
Series: Cezanne (Zen 3, Ryzen 5000) Barcelo-U Refresh
Intel Core 7 150U compare1.2 - 5.4 GHz10 / 12 cores12 MB L3
Intel Core 5 120U « 0.9 - 5 GHz10 / 12 cores12 MB L3
Intel Core 3 100U compare0.9 - 4.7 GHz6 / 8 cores10 MB L3
AMD Ryzen 7 PRO 7730U compare2 - 4.5 GHz8 / 16 cores16 MB L3
AMD Ryzen 7 7730U « 2 - 4.5 GHz8 / 16 cores16 MB L3
AMD Ryzen 5 7530U compare2 - 4.5 GHz6 / 12 cores16 MB L3
AMD Ryzen 5 PRO 7530U compare2 - 4.5 GHz6 / 12 cores16 MB L3
Clock900 - 5000 MHz2000 - 4500 MHz
L1 Cache928 KB512 KB
L2 Cache9.5 MB4 MB
L3 Cache12 MB16 MB
Cores / Threads10 / 12
2 x 5.0 GHz Intel Golden Cove P-Core
8 x 3.8 GHz Intel Gracemont E-Core
8 / 16
TDP15 Watt15 Watt
TDP Turbo PL255 Watt
Technology10 nm7 nm
max. Temp.100 °C95 °C
SocketBGA1700FP6
FeaturesThread DirectorDDR4-3200/LPDDR4x-4266 RAM (incl. ECC), PCIe 3, MMX, SSE, SSE2, SSE3, SSSE3, SSE4A, SSE4.1, SSE4.2, AVX, AVX2, BMI2, ABM, FMA, ADX, SMEP, SMAP, SMT, CPB, AES-NI, RDRAND, RDSEED, SHA, SME
iGPUIntel Iris Xe Graphics G7 80EUs ( - 1250 MHz)AMD Radeon RX Vega 8 (Ryzen 4000/5000) ( - 2000 MHz)
Architecturex86x86
Announced
Manufacturerark.intel.comwww.amd.com

Benchmarks

Performance Rating - CB R15 + R20 + 7-Zip + X265 + Blender + 3DM11 CPU - Core 5 120U
37.1 pt (62%)
Restrict / Search: Model: Max. age: years
Performance Rating - CB R15 + R20 + 7-Zip + X265 + Blender + 3DM11 CPU - R7 7730U
34.5 pt (57%)
Restrict / Search: Model: Max. age: years
Cinebench 2024 - Cinebench 2024 CPU Multi Core
421 Points (8%)
Cinebench R23 - Cinebench R23 Multi Core
7862 Points (7%)
min: 7286     avg: 10291     median: 10801.5 (10%)     max: 11490 Points
Cinebench R23 - Cinebench R23 Single Core
1844 Points (78%)
min: 1335     avg: 1435     median: 1454.5 (61%)     max: 1466 Points
Cinebench R20 - Cinebench R20 CPU (Single Core)
714 Points (78%)
min: 533     avg: 560     median: 566.5 (62%)     max: 573 Points
Cinebench R20 - Cinebench R20 CPU (Multi Core)
3046 Points (7%)
min: 2849     avg: 3885     median: 4070.5 (10%)     max: 4267 Points
Cinebench R15 - Cinebench R15 CPU Multi 64 Bit
1432 Points (9%)
min: 1588     avg: 1800     median: 1830 (12%)     max: 1942 Points
Cinebench R15 - Cinebench R15 CPU Single 64 Bit
257 Points (71%)
min: 221     avg: 229.2     median: 231 (64%)     max: 233 Points
Cinebench R11.5 - Cinebench R11.5 CPU Multi 64 Bit
19.1 Points (25%)
Cinebench R11.5 - Cinebench R11.5 CPU Single 64 Bit
2.8 Points (66%)
Cinebench R10 - Cinebench R10 Rend. Single (32bit)
6243 Points (38%)
Cinebench R10 - Cinebench R10 Rend. Multi (32bit)
32670 Points (24%)
Cinebench R10 - Cinebench R10 Rend. Multi (64bit)
57058 Points (36%)
Cinebench R10 - Cinebench R10 Rend. Single (64bit)
11653 Points (14%)
wPrime 2.10 - wPrime 2.0 1024m *
121.2 s (1%)
wPrime 2.10 - wPrime 2.0 32m *
4.4 s (1%)
WinRAR - WinRAR 4.0
5881 Points (9%)
7-Zip 18.03 - 7-Zip 18.03 Multi Thread 4 runs
33657 MIPS (19%)
min: 40263     avg: 48295     median: 49424.5 (28%)     max: 51898 MIPS
7-Zip 18.03 - 7-Zip 18.03 Single Thread 4 runs
5882 MIPS (69%)
min: 5222     avg: 5348     median: 5356 (63%)     max: 5426 MIPS
X264 HD Benchmark 4.0 - x264 Pass 2
90.9 fps (2%)
X264 HD Benchmark 4.0 - x264 Pass 1
236.2 fps (6%)
HWBOT x265 Benchmark v2.2 - HWBOT x265 4k Preset
8.7 fps (15%)
min: 9.91     avg: 12.4     median: 12.7 (22%)     max: 13.7 fps
TrueCrypt - TrueCrypt Serpent
1 GB/s (29%)
TrueCrypt - TrueCrypt Twofish
1.4 GB/s (24%)
TrueCrypt - TrueCrypt AES
10.1 GB/s (26%)
Blender - Blender 3.3 Classroom CPU *
816 Seconds (10%)
min: 479     avg: 523     median: 499.5 (6%)     max: 648 Seconds
Blender - Blender 2.79 BMW27 CPU *
437 Seconds (3%)
min: 277     avg: 306.8     median: 296 (2%)     max: 374 Seconds
R Benchmark 2.5 - R Benchmark 2.5 *
0.5 sec (10%)
min: 0.515     avg: 0.5     median: 0.5 (11%)     max: 0.543 sec
Super Pi mod 1.5 XS 1M - Super Pi mod 1.5 XS 1M *
8 s (2%)
Super Pi mod 1.5 XS 2M - Super Pi mod 1.5 XS 2M *
17.5 s (1%)
Super Pi Mod 1.5 XS 32M - Super Pi mod 1.5 XS 32M *
438.1 s (2%)
3DMark 11 - 3DM11 Performance Physics
11497 Points (28%)
min: 12032     avg: 13262     median: 13137.5 (32%)     max: 14468 Points
3DMark - 3DMark Cloud Gate Physics
9548 Points (24%)
min: 14599     avg: 15565     median: 15564.5 (39%)     max: 16530 Points
3DMark - 3DMark Fire Strike Standard Physics
15732 Points (28%)
min: 17814     avg: 20902     median: 21100.5 (38%)     max: 22553 Points
3DMark - 3DMark Time Spy CPU
5203 Points (22%)
min: 6221     avg: 6983     median: 6921.5 (29%)     max: 7756 Points
Geekbench 6.5 - Geekbench 6.5 Single-Core
2570 Points (62%)
min: 1836     avg: 1924     median: 1960 (47%)     max: 1976 Points
Geekbench 6.5 - Geekbench 6.5 Multi-Core
9733 Points (38%)
min: 6918     avg: 7230     median: 7013 (27%)     max: 7760 Points
Geekbench 5.5 - Geekbench 5.1 - 5.5 64 Bit Single-Core
1858 Points (71%)
min: 1464     avg: 1480     median: 1479.5 (56%)     max: 1500 Points
Geekbench 5.5 - Geekbench 5.1 - 5.5 64 Bit Multi-Core
8576 Points (15%)
min: 6747     avg: 7546     median: 7573 (14%)     max: 8257 Points
Geekbench 5.0 - Geekbench 5.0 64 Bit Single-Core
min: 1408     avg: 1429     median: 1429 (6%)     max: 1450 Points
Geekbench 5.0 - Geekbench 5.0 64 Bit Multi-Core
min: 7404     avg: 7765     median: 7765 (24%)     max: 8126 Points
Geekbench 4.4 - Geekbench 4.1 - 4.4 64 Bit Single-Core
6092 Points (61%)
Geekbench 4.4 - Geekbench 4.1 - 4.4 64 Bit Multi-Core
29078 Points (28%)
Mozilla Kraken 1.1 - Kraken 1.1 Total Score *
502 ms (1%)
min: 616     avg: 630     median: 630 (1%)     max: 649 ms
Octane V2 - Octane V2 Total Score
min: 69506     avg: 71631     median: 71624 (52%)     max: 73179 Points
WebXPRT 4 - WebXPRT 4 Score
264 Points (73%)
min: 191.5     avg: 207.4     median: 210.5 (58%)     max: 211 Points
WebXPRT 3 - WebXPRT 3 Score
291 Points (52%)
min: 251     avg: 262.5     median: 263 (47%)     max: 271 Points
CrossMark - CrossMark Overall
1671 Points (62%)
min: 1296     avg: 1319     median: 1321 (49%)     max: 1350 Points
Power Consumption - Prime95 Power Consumption - external Monitor *
41.8 Watt (7%)
min: 31.5     avg: 46.2     median: 46 (8%)     max: 58.3 Watt
Power Consumption - Cinebench R15 Multi Power Consumption - external Monitor *
40.9 Watt (7%)
min: 31.5     avg: 50.9     median: 46.3 (8%)     max: 67 Watt
Power Consumption - Idle Power Consumption - external Monitor *
4.1 Watt (3%)
min: 3.23     avg: 6.4     median: 6.5 (4%)     max: 11.5 Watt
Power Consumption - Idle Power Consumption 150cd 1min *
5.1 Watt (6%)
min: 4.99     avg: 7.6     median: 7.5 (9%)     max: 11.6 Watt
Power Consumption - Power Efficiency - Cinebench R15 Multi external Monitor
35 Points per Watt (26%)
min: 28.9     avg: 33.7     median: 33.7 (25%)     max: 38.6 Points per Watt

Average Benchmarks Intel Core 5 120U → 100% n=24

Average Benchmarks AMD Ryzen 7 7730U → 109% n=24

- Range of benchmark values for this graphics card
red legend - Average benchmark values for this graphics card
* Smaller numbers mean a higher performance
1 This benchmark is not used for the average calculation

Add one or more devices and compare

In the following list you can select (and also search for) devices that should be added to the comparison. You can select more than one device.

restrict list:
v1.34
log 17. 06:42:59

#0 ran 0s before starting gpusingle class +0s ... 0s

#1 checking url part for id 17178 +0s ... 0s

#2 checking url part for id 14956 +0s ... 0s

#3 redirected to Ajax server, took 1760676178s time from redirect:1 +0s ... 0s

#4 did not recreate cache, as it is less than 5 days old! Created at Thu, 16 Oct 2025 05:21:56 +0200 +0s ... 0s

#5 composed specs +0.006s ... 0.006s

#6 did output specs +0s ... 0.006s

#7 getting avg benchmarks for device 17178 +0.004s ... 0.01s

#8 got single benchmarks 17178 +0.006s ... 0.015s

#9 getting avg benchmarks for device 14956 +0.003s ... 0.019s

#10 got single benchmarks 14956 +0.011s ... 0.03s

#11 got avg benchmarks for devices +0s ... 0.03s

#12 min, max, avg, median took s +0.037s ... 0.066s

#13 return log +0.003s ... 0.069s

Please share our article, every link counts!
Mail Logo
> Expert Reviews and News on Laptops, Smartphones and Tech Innovations > Benchmarks / Tech > Processor Comparison - Head 2 Head
Redaktion, 2017-09- 8 (Update: 2023-07- 1)