

Qualcomm Adreno 650 vs Qualcomm Adreno 730
Qualcomm Adreno 650
► remove from comparison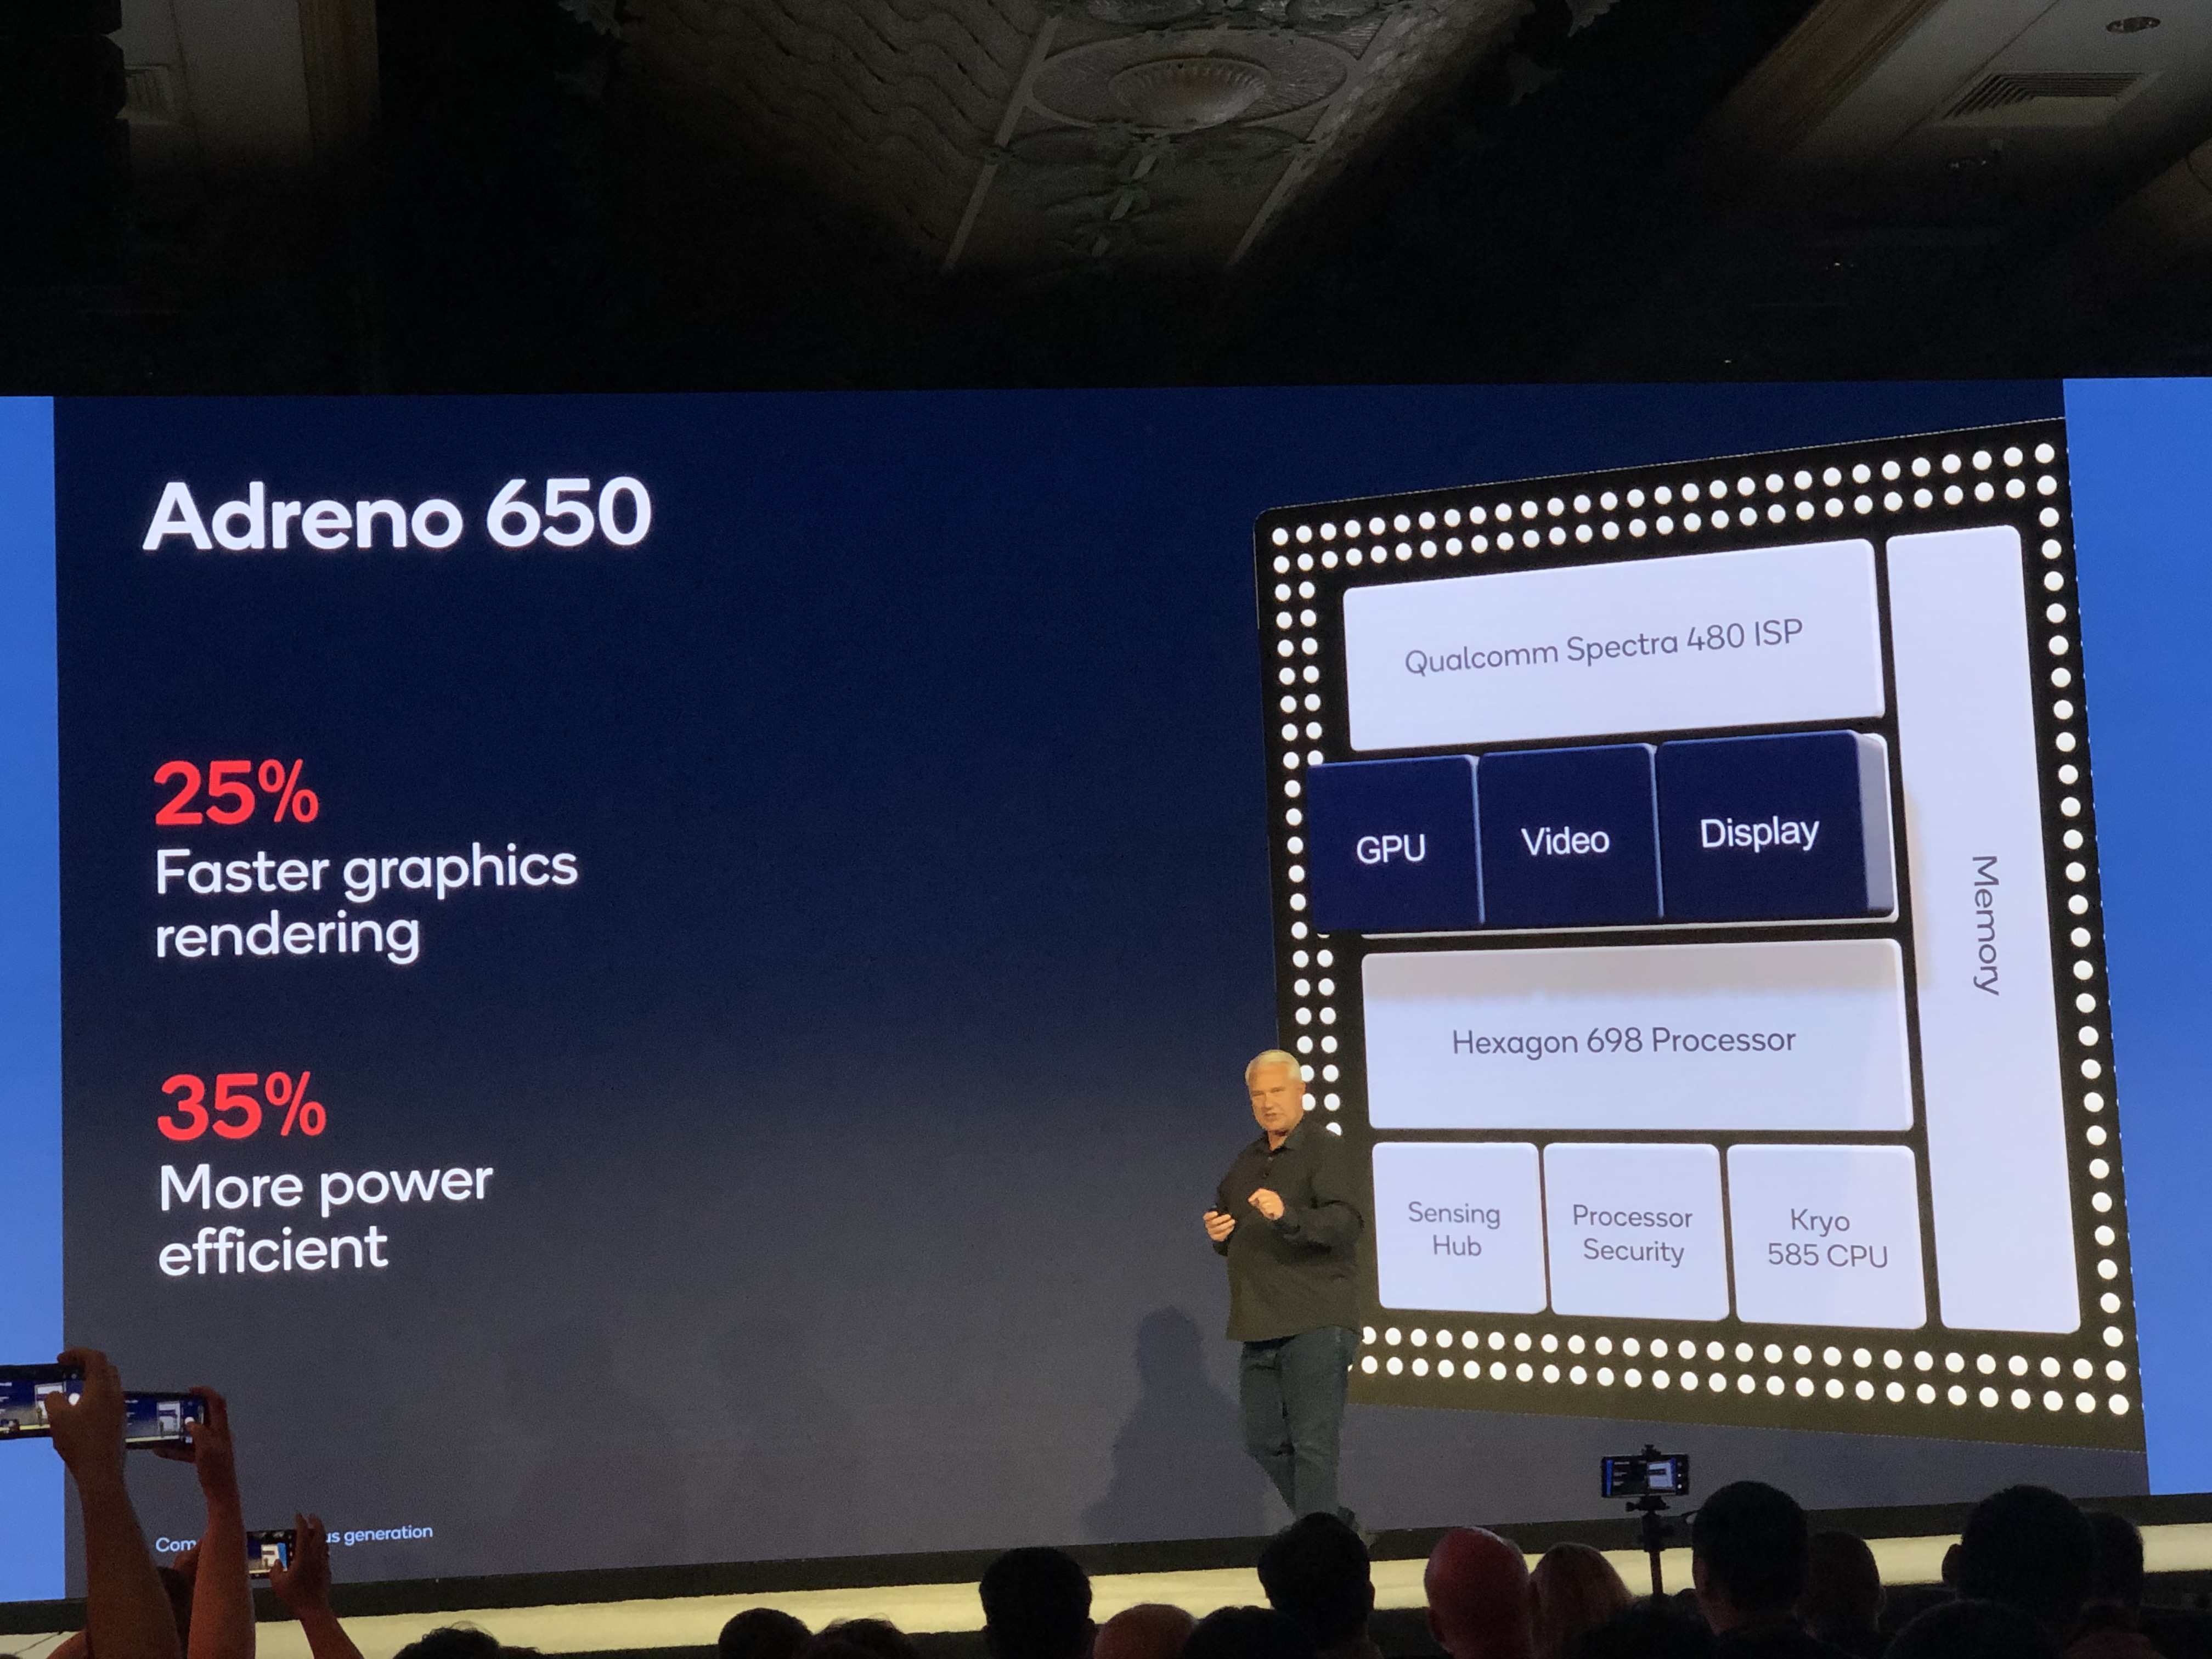
The Qualcomm Adreno 650 is a smartphone and tablet GPU that is integrated within the Qualcomm Snapdragon 865, 865+ and 870 SoCs. The chip will be available from early 2020 and will be used mainly in high-end Android devices. The base clock speed of the GPU is 250 MHz and the boost depends on the used SoC. For the 865 it is 587 MHz, the 865 Plus increased to 846 MHz and the 2021 870 reached 670 MHz.
According to Qualcomm, the Adreno 650 GPU offers a 25% improved performance over the Adreno 640, its predecessor, which is integrated into the Snapdragon 855 SoC. The enhanced performance is achieved by the Adreno 650 having 50% more compute units (ALUs) than the Adreno 640. Furthermore, the clock speed of the pixel shaders was also increased by 50%.
The performance in our first benchmarks of a reference system positions itself above the ARM Mali-G76 MP16 and e.g. in 3DMark Sling Shot Extreme even on the top spot. In GFXBench only the Apple A13 GPU is able to best the Adreno 650 (regarding smartphone GPUs).
As a novelty, the GPU driver can be updated in the Android Play Store. Furthermore, some features are running under the Elite Gaming brand (e.g., 144 Hz display support, desktop forward rendering).
The Adreno 650 supports Vulkan 1.1, DirectX 12, OpenGL ES 3.2, and OpenCL 2.0 FP. Furthermore, games and videos can use HDR10+ and Dolby Vision (with a supported display). The 650 supports 2 displays with up to 4K 60 Hz / QHD+ 144 Hz.
Qualcomm Adreno 730
► remove from comparison
The Qualcomm Adreno 730 is a smartphone and tablet GPU that is integrated within the Qualcomm Snapdragon 8 Gen 1 SoC. The chip will be available starting early 2022 and will be used mainly in high-end Android devices.
According to Qualcomm, the Adreno 730 GPU offers a 30% improved performance thanks to 30% more ALUs over the Adreno 660, its predecessor, which is integrated into the Snapdragon 888 SoC. Thanks to the new 4nm process, the power efficiency should also be improved.
The Adreno 730 supports Vulkan 1.1, OpenGL ES 3.2, and OpenCL 2.0 FP.
| Qualcomm Adreno 650 | Qualcomm Adreno 730 | |||||||||||||||||||||||||||||||||||||||||||||||||||||||||||||||||||||||||||||||||||||
| Adreno 700 Series |
|
| ||||||||||||||||||||||||||||||||||||||||||||||||||||||||||||||||||||||||||||||||||||
| Architecture | Adreno 600 | |||||||||||||||||||||||||||||||||||||||||||||||||||||||||||||||||||||||||||||||||||||
| Core Speed | 250 - 670 (Boost) MHz | 800 (Boost) MHz | ||||||||||||||||||||||||||||||||||||||||||||||||||||||||||||||||||||||||||||||||||||
| Shared Memory | yes | yes | ||||||||||||||||||||||||||||||||||||||||||||||||||||||||||||||||||||||||||||||||||||
| API | DirectX 12, OpenGL ES 3.2 | DirectX 12, OpenGL ES 3.2 | ||||||||||||||||||||||||||||||||||||||||||||||||||||||||||||||||||||||||||||||||||||
| technology | 7 nm | 4 nm | ||||||||||||||||||||||||||||||||||||||||||||||||||||||||||||||||||||||||||||||||||||
| Features | OpenGL ES 3.2, OpenCL 2.0, DirectX 12, Vulkan 1.1 | OpenGL ES 3.2, OpenCL 2.0, DirectX 12, Vulkan 1.1 | ||||||||||||||||||||||||||||||||||||||||||||||||||||||||||||||||||||||||||||||||||||
| Date of Announcement | 04.12.2019 | 30.11.2021 |
|
| ||||||||||||||||||||||||||||||||||||
Benchmarks
| Model | CPU | GPU | RAM | Value |
|---|---|---|---|---|
| Lenovo Legion Tab TB320FC | SD 8+ Gen 1 | Adreno 730 | 12 GB | 858 |
| Honor Magic V Flip | SD 8+ Gen 1 | Adreno 730 | 12 GB | 872 |
| Model | CPU | GPU | RAM | Value |
|---|---|---|---|---|
| Huawei MatePad 11 2021 | SD 865 | Adreno 650 | 6 GB | 1103 |
| Lenovo Yoga Tab 13 | SD 870 | Adreno 650 | 8 GB | 1195 |
| ZTE Axon 30 5G | SD 870 | Adreno 650 | 8 GB | 1216 |
| Huawei MatePad Pro 11 2022 | SD 870 | Adreno 650 | 8 GB | 1216 |
| Xiaomi Poco F4 | SD 870 | Adreno 650 | 6 GB | 1218 |
| Xiaomi Poco F3 | SD 870 | Adreno 650 | 6 GB | 1222 |
| Realme GT Neo 3T | SD 870 | Adreno 650 | 8 GB | 1222 |
| Vivo X60 Pro | SD 870 | Adreno 650 | 12 GB | 1223 |
| Motorola Edge 20 Pro | SD 870 | Adreno 650 | 12 GB | 1223 |
| Lenovo Tab P12 Pro | SD 870 | Adreno 650 | 8 GB | 1225 |
| Xiaomi 12X | SD 870 | Adreno 650 | 8 GB | 1232 |
| Xiaomi Pad 6 | SD 870 | Adreno 650 | 6 GB | 1233 |
| Xiaomi Pad 5 Pro | SD 870 | Adreno 650 | 6 GB | 1235 |
| Realme GT Neo 2 | SD 870 | Adreno 650 | 12 GB | 1236 |
| Xiaomi Black Shark 5 | SD 870 | Adreno 650 | 12 GB | 1241 |
| Xiaomi Black Shark 4 | SD 870 | Adreno 650 | 6 GB | 1246 |
| Model | CPU | GPU | RAM | Value |
|---|---|---|---|---|
| Honor Magic V Flip | SD 8+ Gen 1 | Adreno 730 | 12 GB | (!) |
| Model | CPU | GPU | RAM | Value |
|---|---|---|---|---|
| Xiaomi 12 | SD 8 Gen 1 | Adreno 730 | 8 GB | (!) |
| Samsung Galaxy Tab S8 5G | SD 8 Gen 1 | Adreno 730 | 8 GB | (!) |
| ZTE Axon 40 Ultra | SD 8 Gen 1 | Adreno 730 | 8 GB | (!) |
| Xiaomi Poco F5 Pro | SD 8+ Gen 1 | Adreno 730 | 12 GB | (!) |
| Model | CPU | GPU | RAM | Value |
|---|---|---|---|---|
| Xiaomi Pad 6 | SD 870 | Adreno 650 | 6 GB | 9.7 |
| Realme GT Neo 3T | SD 870 | Adreno 650 | 8 GB | 10 |
| Xiaomi Black Shark 5 | SD 870 | Adreno 650 | 12 GB | 10 |
| Xiaomi Poco F4 | SD 870 | Adreno 650 | 6 GB | 10 |
| Huawei MatePad Pro 11 2022 | SD 870 | Adreno 650 | 8 GB | 10 |
GFXBench T-Rex HD Offscreen C24Z16 + Qualcomm Adreno 650
| Model | CPU | GPU | RAM | Value |
|---|---|---|---|---|
| Huawei MatePad 11 2021 | SD 865 | Adreno 650 | 6 GB | 214123 |
| Lenovo Yoga Tab 13 | SD 870 | Adreno 650 | 8 GB | 233989 |
| Motorola Moto G100 | SD 870 | Adreno 650 | 8 GB | 234980 |
| ZTE Axon 30 5G | SD 870 | Adreno 650 | 8 GB | 235410 |
| Motorola Edge 20 Pro | SD 870 | Adreno 650 | 12 GB | 235903 |
| Xiaomi Poco F4 | SD 870 | Adreno 650 | 6 GB | 238054 |
| Huawei MatePad Pro 11 2022 | SD 870 | Adreno 650 | 8 GB | 238701 |
| Lenovo Tab P12 Pro | SD 870 | Adreno 650 | 8 GB | 240035 |
| Xiaomi Pad 6 | SD 870 | Adreno 650 | 6 GB | 240724 |
| Xiaomi Poco F3 | SD 870 | Adreno 650 | 6 GB | 240809 |
| Realme GT Neo 3T | SD 870 | Adreno 650 | 8 GB | 240910 |
| Vivo X60 Pro | SD 870 | Adreno 650 | 12 GB | 241371 |
| Xiaomi Pad 5 Pro | SD 870 | Adreno 650 | 6 GB | 241855 |
| Xiaomi 12X | SD 870 | Adreno 650 | 8 GB | 247691 |
| Oppo Find X3 Neo | SD 865 | Adreno 650 | 12 GB | 276746 |
| Model | CPU | GPU | RAM | Value |
|---|---|---|---|---|
| Honor Magic V Flip | SD 8+ Gen 1 | Adreno 730 | 12 GB | 428974 |
| Lenovo Legion Tab TB320FC | SD 8+ Gen 1 | Adreno 730 | 12 GB | 486753 |
| Xiaomi Poco F5 Pro | SD 8+ Gen 1 | Adreno 730 | 12 GB | 489270 |
| Model | CPU | GPU | RAM | Value |
|---|---|---|---|---|
| Oppo Find X2 Pro etc2 | SD 865 | Adreno 650 | 12 GB | 72.6 |
Oppo Find X2  etc2 etc2 | SD 865 | Adreno 650 | 12 GB | 74.2 |
| Motorola Moto G100 | SD 870 | Adreno 650 | 8 GB | 74.2 |
| Nubia RedMagic 5G astc | SD 865 | Adreno 650 | 12 GB | 75.8 |
| Xiaomi Poco F3 | SD 870 | Adreno 650 | 6 GB | 77.8 |
| Xiaomi Poco F4 | SD 870 | Adreno 650 | 6 GB | 78.57 |
| Model | CPU | GPU | RAM | Value |
|---|---|---|---|---|
| Xiaomi 12 Pro | SD 8 Gen 1 | Adreno 730 | 12 GB | |
| Asus ROG Phone 6 Pro | SD 8+ Gen 1 | Adreno 730 | 18 GB | 128.28 |
| OnePlus 10T | SD 8+ Gen 1 | Adreno 730 | 16 GB | 161.33 |
| Model | CPU | GPU | RAM | Value |
|---|---|---|---|---|
| Xiaomi Pad 6 | SD 870 | Adreno 650 | 6 GB | 2688 |
| Model | CPU | GPU | RAM | Value |
|---|---|---|---|---|
| Xiaomi Pad 6 Max 14 | SD 8+ Gen 1 | Adreno 730 | 12 GB | 5301 |
| Xiaomi Poco F5 Pro | SD 8+ Gen 1 | Adreno 730 | 12 GB | 5535 |
| Honor Magic V Flip | SD 8+ Gen 1 | Adreno 730 | 12 GB | 6421 |
| Model | CPU | GPU | RAM | Value |
|---|---|---|---|---|
| Xiaomi Pad 6 | SD 870 | Adreno 650 | 6 GB | 2532 |
| Model | CPU | GPU | RAM | Value |
|---|---|---|---|---|
| Xiaomi Pad 6 Max 14 | SD 8+ Gen 1 | Adreno 730 | 12 GB | 6354 |
| Huawei Mate X3 | SD 8+ Gen 1 | Adreno 730 | 12 GB | 6503 |
| Xiaomi Poco F5 Pro | SD 8+ Gen 1 | Adreno 730 | 12 GB | 7108 |
| Honor Magic V Flip | SD 8+ Gen 1 | Adreno 730 | 12 GB | 8322 |
| Model | CPU | GPU | RAM | Value |
|---|---|---|---|---|
| Motorola Moto G100 | SD 870 | Adreno 650 | 8 GB | 54110 |
| Model | CPU | GPU | RAM | Value |
|---|---|---|---|---|
| Motorola Moto G100 | SD 870 | Adreno 650 | 8 GB | 42627 |
| Model | CPU | GPU | RAM | Value |
|---|---|---|---|---|
| Xiaomi 12X | SD 870 | Adreno 650 | 8 GB | 5.18 |
| Motorola Edge 20 Pro | SD 870 | Adreno 650 | 12 GB | 5.55 |
| Huawei MatePad 11 2021 | SD 865 | Adreno 650 | 6 GB | 6.24 |
| ZTE Axon 30 5G | SD 870 | Adreno 650 | 8 GB | 7.37 |
| Vivo X60 Pro | SD 870 | Adreno 650 | 12 GB | 7.47 |
| Xiaomi Pad 6 | SD 870 | Adreno 650 | 6 GB | 7.5 |
| Xiaomi Pad 5 Pro | SD 870 | Adreno 650 | 6 GB | 7.62 |
| Xiaomi Poco F4 | SD 870 | Adreno 650 | 6 GB | 7.89 |
| Realme GT Neo 3T | SD 870 | Adreno 650 | 8 GB | 9.16 |
| Lenovo Tab P12 Pro | SD 870 | Adreno 650 | 8 GB | 9.67 |
| Huawei MatePad Pro 11 2022 | SD 870 | Adreno 650 | 8 GB | 12.4 |
| Lenovo Yoga Tab 13 | SD 870 | Adreno 650 | 8 GB | 12.7 |
Average Benchmarks Qualcomm Adreno 650 → 100% n=21
Average Benchmarks Qualcomm Adreno 730 → 153% n=21
* Smaller numbers mean a higher performance
1 This benchmark is not used for the average calculation
Game Benchmarks
The following benchmarks stem from our benchmarks of review laptops. The performance depends on the used graphics memory, clock rate, processor, system settings, drivers, and operating systems. So the results don't have to be representative for all laptops with this GPU. For detailed information on the benchmark results, click on the fps number.

Diablo Immortal
20221.7.0
Qualcomm Snapdragon 870 5G 2.4GHz
Adreno 650
min: 56 fps, max: 61 fps
1.8.4
Qualcomm Snapdragon 8+ Gen 1 1.8GHz
Adreno 730
min: 56 fps, max: 61 fps
1.7.0
Qualcomm Snapdragon 870 5G 2.4GHz
Adreno 650
min: 54 fps, max: 61 fps

League of Legends: Wild Rift
20202.2.0.4027
Qualcomm Snapdragon 870 5G 2.4GHz
Adreno 650
min: 53 fps, max: 61 fps
2.0.0.3727
Qualcomm Snapdragon 865+ (Plus) 2.4GHz
Adreno 650
min: 106 fps, max: 122 fps
3.3.0.5735
Qualcomm Snapdragon 8+ Gen 1 1.8GHz
Adreno 730
min: 68 fps, max: 120 fps
2.0.0.3727
Qualcomm Snapdragon 865+ (Plus) 2.4GHz
Adreno 650
min: 97 fps, max: 121 fps
3.5.0.6093
Qualcomm Snapdragon 8 Gen 1 1.8GHz
Adreno 730
min: 59 fps, max: 60 fps
2.2.0.4027
Qualcomm Snapdragon 870 5G 2.4GHz
Adreno 650
min: 58 fps, max: 61 fps
2.0.0.3727
Qualcomm Snapdragon 865+ (Plus) 2.4GHz
Adreno 650
min: 111 fps, max: 121 fps
3.1.0.5408
Qualcomm Snapdragon 8 Gen 1 1.8GHz
Adreno 730
min: 55 fps, max: 61 fps
3.3.0.5735
Qualcomm Snapdragon 8+ Gen 1 1.8GHz
Adreno 730
min: 57 fps, max: 61 fps

Call of Duty Mobile
20201.0.34
Qualcomm Snapdragon 8+ Gen 1 1.8GHz
Adreno 730
min: 88 fps, max: 91 fps
1.0.17
Qualcomm Snapdragon 865+ (Plus) 2.4GHz
Adreno 650
min: 56 fps, max: 61 fps
1.0.34
Qualcomm Snapdragon 8+ Gen 1 1.8GHz
Adreno 730
min: 55 fps, max: 60 fps

Genshin Impact
20201.0.0_1112729_1135452
Qualcomm Snapdragon 865+ (Plus) 2.4GHz
Adreno 650
min: 53 fps, max: 61 fps
1.0.0_1112729_1135452
Qualcomm Snapdragon 865 2.4GHz
Adreno 650
min: 54 fps, max: 61 fps
2.4.0_5199000_5224067
Qualcomm Snapdragon 8 Gen 1 1.8GHz
Adreno 730
min: 21 fps, max: 61 fps
5.0.0_26041933_26161852
Qualcomm Snapdragon 8+ Gen 1 1.8GHz
Adreno 730
min: 39 fps, max: 61 fps
Qualcomm Snapdragon 8+ Gen 1 1.8GHz
Adreno 730
min: 51 fps, P1: 55.14 fps, max: 60 fps
2.4.0_5199000_5224067
Qualcomm Snapdragon 8 Gen 1 1.8GHz
Adreno 730
min: 25 fps, max: 36 fps
4.3.0_19705728_19706476
Qualcomm Snapdragon 8+ Gen 1 1.8GHz
Adreno 730
min: 51 fps, max: 61 fps
1.0.0_1112729_1135452
Qualcomm Snapdragon 865+ (Plus) 2.4GHz
Adreno 650
min: 48 fps, max: 60 fps
1.0.0_1112729_1135452
Qualcomm Snapdragon 865 2.4GHz
Adreno 650
min: 50 fps, max: 61 fps
1.1.1_1437351_1398019
Qualcomm Snapdragon 865+ (Plus) 2.4GHz
Adreno 650
min: 29 fps, max: 61 fps
1.5.0_2574575_2578841
Qualcomm Snapdragon 870 5G 2.4GHz
Adreno 650
min: 37 fps, max: 61 fps
2.4.0_5199000_5224067
Qualcomm Snapdragon 8 Gen 1 1.8GHz
Adreno 730
min: 22 fps, max: 36 fps
5.0.0_26041933_26161852
Qualcomm Snapdragon 8+ Gen 1 1.8GHz
Adreno 730
min: 22 fps, max: 61 fps
Qualcomm Snapdragon 8+ Gen 1 1.8GHz
Adreno 730
min: 49 fps, P1: 55.09 fps, max: 60 fps
4.3.0_19705728_19706476
Qualcomm Snapdragon 8+ Gen 1 1.8GHz
Adreno 730
min: 53 fps, max: 61 fps

Armajet
20201.55.5
Qualcomm Snapdragon 865 2.4GHz
Adreno 650
min: 56 fps, max: 60 fps
1.55.3
Qualcomm Snapdragon 865+ (Plus) 2.4GHz
Adreno 650
min: 89 fps, max: 91 fps
1.15.1
Qualcomm Snapdragon 865+ (Plus) 2.4GHz
Adreno 650
min: 102 fps, max: 120 fps
1.55.5
Qualcomm Snapdragon 865+ (Plus) 2.4GHz
Adreno 650
min: 114 fps, max: 123 fps
Qualcomm Snapdragon 8 Gen 1 1.8GHz
Adreno 730
min: 46 fps, P1: 47.3 fps, max: 61 fps
1.61.6
Qualcomm Snapdragon 8 Gen 1 1.8GHz
Adreno 730
min: 58 fps, max: 61 fps
1.61.6
Qualcomm Snapdragon 8 Gen 1 1.8GHz
Adreno 730
min: 78 fps, max: 119 fps

PUBG Mobile
20182.3.0
Qualcomm Snapdragon 870 5G 2.4GHz
Adreno 650
min: 38 fps, max: 41 fps
1.0.0
Qualcomm Snapdragon 865+ (Plus) 2.4GHz
Adreno 650
min: 58 fps, max: 60 fps
2.6.0
Qualcomm Snapdragon 8+ Gen 1 1.8GHz
Adreno 730
min: 51 fps, max: 61 fps
Qualcomm Snapdragon 8 Gen 1 1.8GHz
Adreno 730
min: 57 fps, P1: 57.59 fps, max: 61 fps
Qualcomm Snapdragon 8+ Gen 1 1.8GHz
Adreno 730
min: 84 fps, P1: 84 fps, max: 91 fps
1.0.0
Qualcomm Snapdragon 865+ (Plus) 2.4GHz
Adreno 650
min: 24 fps, max: 31 fps
0.19.0
Qualcomm Snapdragon 865 2.4GHz
Adreno 650
min: 58 fps, max: 61 fps
1.0.0
Qualcomm Snapdragon 865+ (Plus) 2.4GHz
Adreno 650
min: 52 fps, max: 60 fps
1.0.0
Qualcomm Snapdragon 865+ (Plus) 2.4GHz
Adreno 650
min: 56 fps, max: 60 fps
1.9.0
Qualcomm Snapdragon 8 Gen 1 1.8GHz
Adreno 730
min: 29 fps, max: 31 fps
1.9.0
Qualcomm Snapdragon 8 Gen 1 1.8GHz
Adreno 730
min: 50 fps, max: 61 fps
Qualcomm Snapdragon 8 Gen 1 1.8GHz
Adreno 730
min: 57 fps, P1: 58 fps, max: 61 fps
2.1.0
Qualcomm Snapdragon 8+ Gen 1 1.8GHz
Adreno 730
min: 51 fps, max: 61 fps
2.2.0
Qualcomm Snapdragon 8+ Gen 1 1.8GHz
Adreno 730
min: 52 fps, max: 61 fps
1.0.0
Qualcomm Snapdragon 865+ (Plus) 2.4GHz
Adreno 650
min: 38 fps, max: 41 fps
2.3.0
Qualcomm Snapdragon 870 5G 2.4GHz
Adreno 650
min: 38 fps, max: 41 fps
1.9.0
Qualcomm Snapdragon 8 Gen 1 1.8GHz
Adreno 730
min: 36 fps, max: 42 fps
2.1.0
Qualcomm Snapdragon 8+ Gen 1 1.8GHz
Adreno 730
min: 39 fps, max: 41 fps
2.2.0
Qualcomm Snapdragon 8+ Gen 1 1.8GHz
Adreno 730
min: 39 fps, max: 41 fps
2.6.0
Qualcomm Snapdragon 8+ Gen 1 1.8GHz
Adreno 730
min: 33 fps, max: 41 fps
Qualcomm Snapdragon 8+ Gen 1 1.8GHz
Adreno 730
min: 39 fps, P1: 39 fps, max: 40 fps

Dead Trigger 2
2013
Asphalt 9: Legends
2013
Average Gaming Qualcomm Adreno 650 → 100%
Average Gaming 30-70 fps → 100%
Average Gaming Qualcomm Adreno 730 → 93%
Average Gaming 30-70 fps → 90%
| Qualcomm Adreno 650 | Qualcomm Adreno 730 | |||||||||||||
|---|---|---|---|---|---|---|---|---|---|---|---|---|---|---|
| low | med. | high | ultra | QHD | 4K | low | med. | high | ultra | QHD | 4K | |||
| Diablo Immortal | 60 | 60 | 60 | 60 | ||||||||||
| League of Legends: Wild Rift | 90 | 89 | 89 | 110 | 60 | 60 | ||||||||
| Call of Duty Mobile | 60 | 73 | 55 | 58 | ||||||||||
| Genshin Impact | 60 | 60 | 51 | 48 | 45 | |||||||||
| Armajet | 71 | 75 | ||||||||||||
| PUBG Mobile | 61 | 58 | 53 | 40 | 61 | 59 | 57 | 40 | ||||||
| Arena of Valor | 61 | 60 | ||||||||||||
| Dead Trigger 2 | 100 | 60 | ||||||||||||
| Asphalt 9: Legends | 45 | 41 | 45 | |||||||||||
| Real Racing 3 | 102 | |||||||||||||
| Qualcomm Adreno 650 | Qualcomm Adreno 730 | |||||||||||||
| low | med. | high | ultra | QHD | 4K | low | med. | high | ultra | QHD | 4K | < 30 fps < 60 fps < 120 fps ≥ 120 fps | 1 5 | 1 | 2 4 | 1 5 | | | < 30 fps < 60 fps < 120 fps ≥ 120 fps | 1 4 | 2 | 3 3 | 3 2 | | |
For more games that might be playable and a list of all games and graphics cards visit our Gaming List
#0 ran 0s before starting gpusingle class +0s ... 0s
#1 checking url part for id 9971 +0s ... 0s
#2 checking url part for id 11105 +0s ... 0s
#3 redirected to Ajax server, took 1766259290s time from redirect:0 +0s ... 0s
#4 did not recreate cache, as it is less than 5 days old! Created at Fri, 19 Dec 2025 14:52:56 +0100 +0s ... 0s
#5 composed specs +0.026s ... 0.026s
#6 did output specs +0s ... 0.026s
#7 start showIntegratedCPUs +0s ... 0.026s
#8 getting avg benchmarks for device 9971 +0.015s ... 0.041s
#9 got single benchmarks 9971 +0.038s ... 0.08s
#10 getting avg benchmarks for device 11105 +0s ... 0.08s
#11 got single benchmarks 11105 +0.044s ... 0.124s
#12 got avg benchmarks for devices +0s ... 0.124s
#13 No cached benchmark found, getting uncached values +0.007s ... 0.131s
#14 No cached benchmark found, getting uncached values +0.008s ... 0.139s
#15 No cached benchmark found, getting uncached values +0.001s ... 0.141s
#16 No cached benchmark found, getting uncached values +0.001s ... 0.142s
#17 No cached benchmark found, getting uncached values +0.001s ... 0.143s
#18 min, max, avg, median took s +0.017s ... 0.16s
#19 before gaming benchmark output +0s ... 0.16s
#20 Got 302 rows for game benchmarks. +0.034s ... 0.194s
#21 composed SQL query for gamebenchmarks +0s ... 0.194s
#22 got data and put it in $dataArray +0.001s ... 0.195s
#23 benchmarks composed for output. +0.005s ... 0.2s
#24 calculated avg scores. +0s ... 0.201s
#25 return log +0.001s ... 0.202s