Notebookcheck Logo

Intel Core i3-5010U vs AMD PRO A8-9600B vs Intel Core i3-5005U

Intel Core i3-5010U

► remove from comparison Intel 5010U

The Intel Core i3-5010U is an ULV (ultra low voltage) dual-core processor based on the Broadwell architecture, which has been launched in January 2015. In addition to two CPU cores with Hyper-Threading clocked at 2.1 GHz (no Turbo), the chip also integrates an HD Graphics 5500 GPU and a dual-channel DDR3(L)-1600 memory controller. The Core i3 is manufactured in a 14 nm process with FinFET transistors.

Architecture

Broadwell represents the "Tick" in Intel's Tick-Tock model, which means a shrink of its predecessor Haswell. The new 14 nm manufacturing process with three-dimensional FinFET transistors allows not only improvements in energy efficiency, but also a significantly smaller die size fit for more compact packages and devices.

Further advantages result from the revised microarchitecture of Broadwell. Due to its improved branch prediction, bigger buffer sizes (1500 instead of 1000 entries in the L2 TLB) and other tweaks, the performance per clock has been increased by more than 5 percent over its predecessor. There are also some new instruction set extensions designed for cryptographic applications.

Performance

Thanks to its improved architecture and the slightly higher clock rate, the Core i3-5010U ends up 10 - 15 percent faster than the Core i3-4030U (1.9 GHz, Haswell). Thus, the CPU has sufficient power for office and multimedia purposes as well as more demanding applications and multitasking.

Graphics

The integrated HD Graphics 5500 offers 24 Execution Units (EUs), however only 23 EUs (clocked at 300 - 900 MHz) are active in this case. Similar to the CPU core, the GPU architecture (Intel Gen 8) has been thoroughly revised for improved performance-per-clock. Therefore, the HD Graphics 5500 is able to beat the HD Graphics 4400 (20 EUs) as well as the HD Graphics 5000 (40 EUs), both part of the Haswell generation. Nevertheless, most games as of 2015 will be playable only in low settings.

Broadwell is the first Intel chip to fully support DirectX 11.2 as well as OpenCL 1.3/2.0 and OpenGL 4.3. Video will output natively via DisplayPort 1.2 or HDMI 1.4a. However, the new HDMI 2.0 standard is not supported.

Power Consumption

The i3-5010U is rated at a TDP of 15 W (10 W cTDP Down) including the graphics card, memory controller, VRMs and the integrated chipset. Therefore, the CPU is suited even for small ultrabooks 11-inches and greater.

AMD PRO A8-9600B

► remove from comparison AMD A8-9600B

The AMD PRO A8-9600B is a mid-range APU of the Bristol Ridge series (7th generation of APUs) with 4 CPU-cores (two Excavator modules) clocked at 2.4 - 3.3 GHz. It is intended for business laptops and features the same specifications as the consumer AMD A10-9600P SoC.

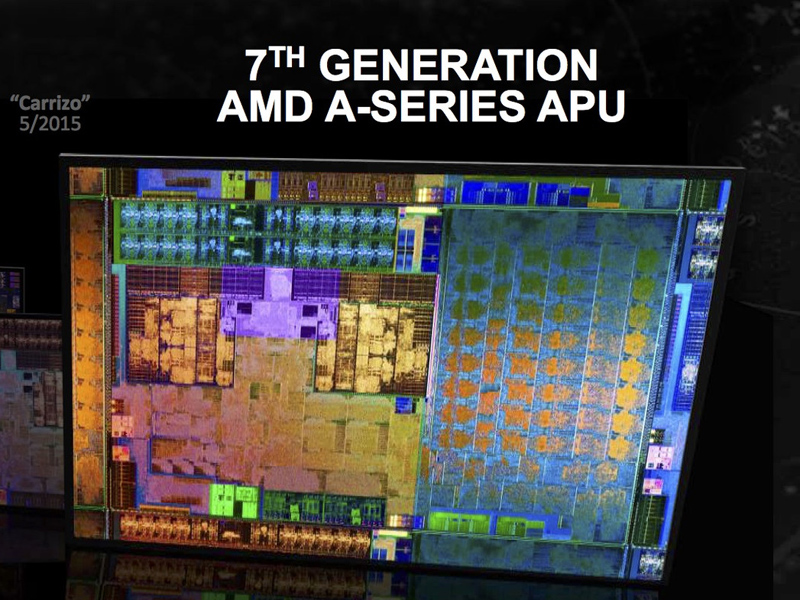
It was announced in mid 2016 and is based on the same silicon as Carrizo but with more and refined features. It is a ULV-chip with a TDP of 15 Watt and integrates a Radeon R5 graphics card (384 shader cores / 6 compute cores) and a dual-channel DDR4-1866 memory controller. As Carrizo its a full featured SoC that offers all I/O ports on the chip.

The A10-9600P is slightly faster than the old 15-Watt top model of Carrizo, the FX-8800P. Therefore, the CPU performance is similar to a Broadwell 15 Watt Core i3 like The i3-5010U. See our Bristol Ridge article for more information on the architecture and improvements compared to Carrizo.

Intel Core i3-5005U

► remove from comparison Intel 5005U

The Intel Core i3-5005U is an ULV (ultra low voltage) dual-core processor based on the Broadwell architecture, which has been launched in January 2015. In addition to two CPU cores with Hyper-Threading clocked at 2.0 GHz (no Turbo), the chip also integrates an HD Graphics 5500 GPU and a dual-channel DDR3(L)-1600 memory controller. The Core i3 is manufactured in a 14 nm process with FinFET transistors.

Architecture

Broadwell represents the "Tick" in Intel's Tick-Tock model, which means a shrink of its predecessor Haswell. The new 14 nm manufacturing process with three-dimensional FinFET transistors allows not only improvements in energy efficiency, but also a significantly smaller die size fit for more compact packages and devices.

Further advantages result from the revised microarchitecture of Broadwell. Due to its improved branch prediction, bigger buffer sizes (1500 instead of 1000 entries in the L2 TLB) and other tweaks, the performance per clock has been increased by more than 5 percent over its predecessor. There are also some new instruction set extensions designed for cryptographic applications.

Performance

Thanks to its improved architecture and the slightly higher clock rate, the Core i3-5005U ends up 5 - 10 percent faster than the Core i3-4025U (1.9 GHz, Haswell). Thus, the CPU has sufficient power for office and multimedia purposes as well as more demanding applications and multitasking.

Graphics

The integrated HD Graphics 5500 offers 24 Execution Units (EUs), however only 23 EUs (clocked at 300 - 850 MHz) are active in this case. Similar to the CPU core, the GPU architecture (Intel Gen 8) has been thoroughly revised for improved performance-per-clock. Therefore, the HD Graphics 5500 is able to beat the HD Graphics 4400 (20 EUs) as well as the HD Graphics 5000 (40 EUs), both part of the Haswell generation. Nevertheless, most games as of 2015 will be playable only in low settings.

Broadwell is the first Intel chip to fully support DirectX 11.2 as well as OpenCL 1.3/2.0 and OpenGL 4.3. Video will output natively via DisplayPort 1.2 or HDMI 1.4a. However, the new HDMI 2.0 standard is not supported.

Power Consumption

The i3-5005U is rated at a TDP of 15 W (10 W cTDP Down) including the graphics card, memory controller, VRMs and the integrated chipset. Therefore, the CPU is suited even for small ultrabooks 11-inches and greater.

ModelIntel Core i3-5010UAMD PRO A8-9600BIntel Core i3-5005U
SeriesIntel Core i3AMD Bristol RidgeIntel Core i3
CodenameBroadwellBristol RidgeBroadwell
Series: Core i3 Broadwell
Intel Core i3-5157U2.5 GHz2 / 4 cores3 MB L3
Intel Core i3-5020U2.2 GHz2 / 4 cores3 MB L3
Intel Core i3-5010U « 2.1 GHz2 / 4 cores3 MB L3
Intel Core i3-5015U2.1 GHz2 / 4 cores3 MB L3
Intel Core i3-5005U2 GHz2 / 4 cores3 MB L3
AMD FX-9830P3 - 3.7 GHz4 / 4 cores
AMD PRO A12-9830B3 - 3.7 GHz4 / 4 cores
AMD FX-9800P2.7 - 3.6 GHz4 / 4 cores
AMD PRO A12-9800B2.7 - 3.6 GHz4 / 4 cores
AMD A12-9720P2.7 - 3.6 GHz4 / 4 cores
AMD A12-9700P2.5 - 3.4 GHz4 / 4 cores
AMD A10-9620P2.5 - 3.4 GHz4 / 4 cores
AMD A10-9600P2.4 - 3.3 GHz4 / 4 cores
AMD PRO A8-9600B « 2.4 - 3.3 GHz4 / 4 cores
Intel Core i3-5157U2.5 GHz2 / 4 cores3 MB L3
Intel Core i3-5020U2.2 GHz2 / 4 cores3 MB L3
Intel Core i3-5010U2.1 GHz2 / 4 cores3 MB L3
Intel Core i3-5015U2.1 GHz2 / 4 cores3 MB L3
Intel Core i3-5005U « 2 GHz2 / 4 cores3 MB L3
Clock2100 MHz2400 - 3300 MHz2000 MHz
L1 Cache128 KB128 KB
L2 Cache512 KB2 MB512 KB
L3 Cache3 MB3 MB
Cores / Threads2 / 44 / 42 / 4
TDP15 Watt15 Watt15 Watt
Transistors1300 Million3100 Million1300 Million
Technology14 nm28 nm14 nm
Die Size82 mm2250 mm282 mm2
max. Temp.105 °C90 °C105 °C
SocketBGAFP4BGA
FeaturesDDR3(L)-1600 Memory Controller, HyperThreading, AVX, AVX2, Quick Sync, Virtualization, AES-NIDual-Channel DDR3/DDR4-1866 Memory Controller, PCIe 3.0 x8DDR3(L)-1600 Memory Controller, HyperThreading, AVX, AVX2, Quick Sync, Virtualization, AES-NI
iGPUIntel HD Graphics 5500 (300 - 900 MHz)AMD Radeon R5 (Bristol Ridge) ( - 720 MHz)Intel HD Graphics 5500 (300 - 850 MHz)
Architecturex86x86x86
$281 U.S.$275 U.S.
Announced
Manufacturerark.intel.comproducts.amd.comark.intel.com

Benchmarks

Performance Rating - CB R15 + R20 + 7-Zip + X265 + Blender + 3DM11 CPU - 5005U
18.4 pt (26%)
Cinebench R23 - Cinebench R23 Multi Core
100%
1 5010U +
834 Points (1%)
147%
1 5005U +
1225 Points (1%)
Cinebench R23 - Cinebench R23 Single Core
100%
1 5010U +
411 Points (17%)
121%
1 5005U +
499 Points (21%)
Cinebench R20 - Cinebench R20 CPU (Single Core)
100%
1 5010U +
200 Points (22%)
96%
1 5005U +
191 Points (21%)
Cinebench R20 - Cinebench R20 CPU (Multi Core)
100%
1 5010U +
491 Points (1%)
99%
1 5005U +
486 Points (1%)
Cinebench R15 - Cinebench R15 CPU Multi 64 Bit
min: 211     avg: 216.8     median: 218 (1%)     max: 220 Points
203 Points (1%)
min: 206     avg: 208     median: 208 (1%)     max: 210 Points
Cinebench R15 - Cinebench R15 CPU Single 64 Bit
min: 84     avg: 85.3     median: 85 (26%)     max: 87 Points
71 Points (21%)
min: 80.1     avg: 81.7     median: 82 (25%)     max: 83 Points
Cinebench R11.5 - Cinebench R11.5 CPU Multi 64 Bit
min: 2.32     avg: 2.4     median: 2.4 (3%)     max: 2.41 Points
2.4 Points (3%)
min: 2.27     avg: 2.3     median: 2.3 (3%)     max: 2.29 Points
Cinebench R11.5 - Cinebench R11.5 CPU Single 64 Bit
min: 0.92     avg: 0.9     median: 0.9 (24%)     max: 0.97 Points
0.8 Points (21%)
min: 0.92     avg: 0.9     median: 1 (24%)     max: 0.96 Points
Cinebench R10 - Cinebench R10 Rend. Single (32bit)
3114 Points (19%)
2336 Points (14%)
min: 3113     avg: 3131     median: 3133 (19%)     max: 3151 Points
Cinebench R10 - Cinebench R10 Rend. Multi (32bit)
7222 Points (5%)
5703 Points (4%)
min: 6837     avg: 6932     median: 6927 (5%)     max: 7048 Points
Cinebench R10 - Cinebench R10 Rend. Multi (64bit)
100%
1 5010U +
7576 Points (5%)
105%
1 5005U +
min: 6936     avg: 7951     median: 7951 (6%)     max: 8966 Points
Cinebench R10 - Cinebench R10 Rend. Single (64bit)
100%
1 5010U +
4196 Points (5%)
87%
1 5005U +
min: 3134     avg: 3659     median: 3658.5 (4%)     max: 4183 Points
wPrime 2.10 - wPrime 2.0 1024m *
min: 730     avg: 746     median: 732 (9%)     max: 775 s
577 s (7%)
775 s (9%)
wPrime 2.10 - wPrime 2.0 32m *
min: 23.1     avg: 23.4     median: 23.2 (5%)     max: 23.89 s
16.8 s (3%)
24.4 s (5%)
WinRAR - WinRAR 4.0
min: 2111     avg: 2131     median: 2119 (3%)     max: 2162 Points
1444 Points (2%)
1952 Points (3%)
7-Zip 18.03 - 7-Zip 18.03 Multli Thread 4 runs
100%
1 5010U +
6040 MIPS (3%)
97%
1 5005U +
5871 MIPS (3%)
7-Zip 18.03 - 7-Zip 18.03 Single Thread 4 runs
100%
1 5010U +
2132 MIPS (25%)
112%
1 5005U +
2389 MIPS (29%)
X264 HD Benchmark 4.0 - x264 Pass 2
min: 13.5     avg: 13.6     median: 13.6 (5%)     max: 13.75 fps
13.3 fps (5%)
13 fps (5%)
X264 HD Benchmark 4.0 - x264 Pass 1
min: 67.7     avg: 71.9     median: 73.9 (17%)     max: 74 fps
70 fps (16%)
69.7 fps (16%)
HWBOT x265 Benchmark v2.2 - HWBOT x265 4k Preset
0 fps (0%)
100%
1 5005U +
1.7 fps (3%)
TrueCrypt - TrueCrypt Serpent
min: 0.116     avg: 0.1     median: 0.1 (0%)     max: 0.133 GB/s
0.2 GB/s (0%)
0.1 GB/s (0%)
TrueCrypt - TrueCrypt Twofish
min: 0.199     avg: 0.2     median: 0.2 (3%)     max: 0.203 GB/s
0.3 GB/s (5%)
0.2 GB/s (3%)
TrueCrypt - TrueCrypt AES
min: 1.2     avg: 1.3     median: 1.3 (3%)     max: 1.3 GB/s
1.5 GB/s (4%)
1.2 GB/s (3%)
Blender - Blender 3.3 Classroom CPU *
100%
1 5010U +
3836 Seconds (49%)
Blender - Blender 2.79 BMW27 CPU *
100%
1 5005U +
2101 Seconds (15%)
R Benchmark 2.5 - R Benchmark 2.5 *
100%
1 5010U +
1.3 sec (28%)
98%
1 5005U +
1.3 sec (29%)
3DMark 06 - CPU - 3DMark 06 - CPU
min: 2772     avg: 2829     median: 2828.5 (6%)     max: 2885 Points
2930 Points (6%)
2713 Points (6%)
Super Pi mod 1.5 XS 1M - Super Pi mod 1.5 XS 1M *
min: 18.2     avg: 25.7     median: 18.3 (4%)     max: 40.5 s
19.5 s (4%)
19.3 s (4%)
Super Pi mod 1.5 XS 2M - Super Pi mod 1.5 XS 2M *
min: 40.9     avg: 51     median: 40.9 (2%)     max: 71.3 s
43.7 s (2%)
43.5 s (2%)
Super Pi Mod 1.5 XS 32M - Super Pi mod 1.5 XS 32M *
min: 898     avg: 1012     median: 903 (4%)     max: 1236 s
1000 s (4%)
962 s (4%)
3DMark Vantage - 3DM Vant. Perf. CPU no Physx
100%
1 5010U +
min: 8083     avg: 8137     median: 8137 (7%)     max: 8191 Points
89%
1 5005U +
7264 Points (6%)
3DMark 11 - 3DM11 Performance Physics
min: 2741     avg: 2938     median: 3002 (8%)     max: 3072 Points
2081 Points (6%)
min: 2700     avg: 2767     median: 2711 (7%)     max: 2906 Points
3DMark - 3DMark Ice Storm Physics
min: 29311     avg: 29383     median: 29383 (24%)     max: 29455 Points
21428 Points (17%)
min: 25552     avg: 26631     median: 26953 (22%)     max: 27065 Points
3DMark - 3DMark Ice Storm Extreme Physics
28754 Points (23%)
23396 Points (19%)
25796 Points (21%)
3DMark - 3DMark Ice Storm Unlimited Physics
24627 Points (21%)
119%
1 5005U +
29332 Points (25%)
3DMark - 3DMark Cloud Gate Physics
min: 2441     avg: 2470     median: 2470 (6%)     max: 2499 Points
2071 Points (5%)
min: 2289     avg: 2338     median: 2347.5 (6%)     max: 2368 Points
3DMark - 3DMark Fire Strike Standard Physics
min: 3495     avg: 3504     median: 3503 (6%)     max: 3514 Points
2427 Points (4%)
min: 3250     avg: 3293     median: 3288 (6%)     max: 3346 Points
3DMark - 3DMark Time Spy CPU
100%
1 5010U +
1199 Points (5%)
Geekbench 5.5 - Geekbench 5.1 - 5.4 64 Bit Single-Core
100%
1 5005U +
531 Points (22%)
Geekbench 5.5 - Geekbench 5.1 - 5.4 64 Bit Multi-Core
100%
1 5005U +
1150 Points (2%)
Geekbench 4.4 - Geekbench 4.1 - 4.4 64 Bit Single-Core
100%
1 5010U +
2613 Points (26%)
2139 Points (21%)
Geekbench 4.4 - Geekbench 4.1 - 4.4 64 Bit Multi-Core
100%
1 5010U +
5066 Points (6%)
4506 Points (5%)
Geekbench 4.0 - Geekbench 4.0 64 Bit Single-Core
1991 Points (27%)
Geekbench 4.0 - Geekbench 4.0 64 Bit Multi-Core
4389 Points (11%)
Geekbench 3 - Geekbench 3 32 Bit Multi-Core
min: 4540     avg: 4546     median: 4545.5 (8%)     max: 4551 Points
4764 Points (8%)
min: 4016     avg: 4061     median: 4075 (7%)     max: 4093 Points
Geekbench 3 - Geekbench 3 32 Bit Single-Core
min: 2164     avg: 2166     median: 2165.5 (42%)     max: 2167 Points
1965 Points (38%)
min: 1907     avg: 1916     median: 1912 (37%)     max: 1928 Points
Geekbench 3 - Geekbench 3 64 Bit Multi-Core
100%
1 5010U +
min: 4777     avg: 4795     median: 4794.5 (8%)     max: 4812 Points
5002 Points (8%)
Geekbench 3 - Geekbench 3 64 Bit Single-Core
100%
1 5010U +
min: 2293     avg: 2297     median: 2296.5 (34%)     max: 2300 Points
2102 Points (31%)
Geekbench 2 - 32 Bit - Geekbench Stream
min: 6698     avg: 6746     median: 6745.5 (54%)     max: 6793 Points
4436 Points (36%)
4744 Points (38%)
Geekbench 2 - 32 Bit - Geekbench Memory
min: 5336     avg: 5382     median: 5382 (49%)     max: 5428 Points
3385 Points (31%)
4089 Points (37%)
Geekbench 2 - 32 Bit - Geekbench Floating Point
min: 4801     avg: 4822     median: 4822 (9%)     max: 4843 Points
5779 Points (11%)
4524 Points (9%)
Geekbench 2 - 32 Bit - Geekbench Integer
min: 4398     avg: 4417     median: 4417 (9%)     max: 4436 Points
5660 Points (11%)
4193 Points (8%)
Geekbench 2 - 32 Bit - Geekbench Total Score
min: 4971     avg: 4984     median: 4984 (13%)     max: 4997 Points
5124 Points (13%)
4343 Points (11%)
Mozilla Kraken 1.1 - Kraken 1.1 Total Score *
min: 1727     avg: 2710     median: 3171 (4%)     max: 3232 ms
2552 ms (3%)
min: 1636     avg: 2420     median: 1961 (2%)     max: 3339 ms
Sunspider - Sunspider 1.0 Total Score *
min: 146.7     avg: 153.5     median: 153.5 (2%)     max: 160.3 ms
177.7 ms (2%)
min: 136.3     avg: 174.6     median: 151.1 (2%)     max: 275 ms
Octane V2 - Octane V2 Total Score
min: 10182     avg: 13330     median: 10221 (9%)     max: 19588 Points
15170 Points (14%)
min: 9479     avg: 14507     median: 14425 (13%)     max: 19700 Points
WebXPRT 4 - WebXPRT 4 Score
100%
1 5010U +
77.2 Points (22%)
WebXPRT 3 - WebXPRT 3 Score
100%
1 5005U +
89.2 Points (19%)
Power Consumption - Prime95 Power Consumption - external Monitor *
100%
1 5010U +
24.1 Watt (4%)
101%
1 5005U +
21 Watt (4%)
Power Consumption - Cinebench R15 Multi Power Consumption - external Monitor *
100%
1 5010U +
17.4 Watt (3%)
100%
1 5005U +
15 Watt (3%)
Power Consumption - Cinebench R15 Multi Power Efficiency - external Monitor
100%
1 5010U +
12.6 Points per Watt (9%)
110%
1 5005U +
13.8 Points per Watt (10%)

Average Benchmarks Intel Core i3-5010U → 100% n=33

Average Benchmarks AMD PRO A8-9600B → 98% n=33

Average Benchmarks Intel Core i3-5005U → 95% n=33

- Range of benchmark values for this graphics card
- Average benchmark values for this graphics card
* Smaller numbers mean a higher performance
1 This benchmark is not used for the average calculation

v1.26
log 01. 15:50:17

#0 checking url part for id 6389 +0s ... 0s

#1 checking url part for id 9948 +0s ... 0s

#2 checking url part for id 6390 +0s ... 0s

#3 not redirecting to Ajax server +0s ... 0s

#4 did not recreate cache, as it is less than 5 days old! Created at Sat, 01 Jun 2024 05:37:57 +0200 +0.001s ... 0.001s

#5 composed specs +0.031s ... 0.032s

#6 did output specs +0s ... 0.032s

#7 getting avg benchmarks for device 6389 +0.003s ... 0.035s

#8 got single benchmarks 6389 +0.021s ... 0.057s

#9 getting avg benchmarks for device 9948 +0.003s ... 0.059s

#10 got single benchmarks 9948 +0.008s ... 0.067s

#11 getting avg benchmarks for device 6390 +0.016s ... 0.083s

#12 got single benchmarks 6390 +0.043s ... 0.127s

#13 got avg benchmarks for devices +0s ... 0.127s

#14 No cached benchmark found, getting uncached values +0.142s ... 0.268s

#15 min, max, avg, median took s +0.286s ... 0.554s

#16 return log +0s ... 0.554s

Please share our article, every link counts!
> Expert Reviews and News on Laptops, Smartphones and Tech Innovations > Benchmarks / Tech > Processor Comparison - Head 2 Head
Redaktion, 2017-09- 8 (Update: 2023-07- 1)