Notebookcheck Logo

Intel Core i3-350M vs Intel Core i3-1115G4

Intel Core i3-350M

► remove from comparison Intel 350M

The Intel Core i3-350M is a lower-middle class dual core CPU for laptops and clocks with 2.26 GHz. The difference to the Core i5-430M is the lacking Turbo Boost overclocking, and the missing AES, VT-d and Trusted Execution functions. Each core is based on the Nehalem (Westmere) micro-architecture. Hyperthreading enables the Dual Core CPU to handle 4 threads at once (for a better usage of the pipeline). 

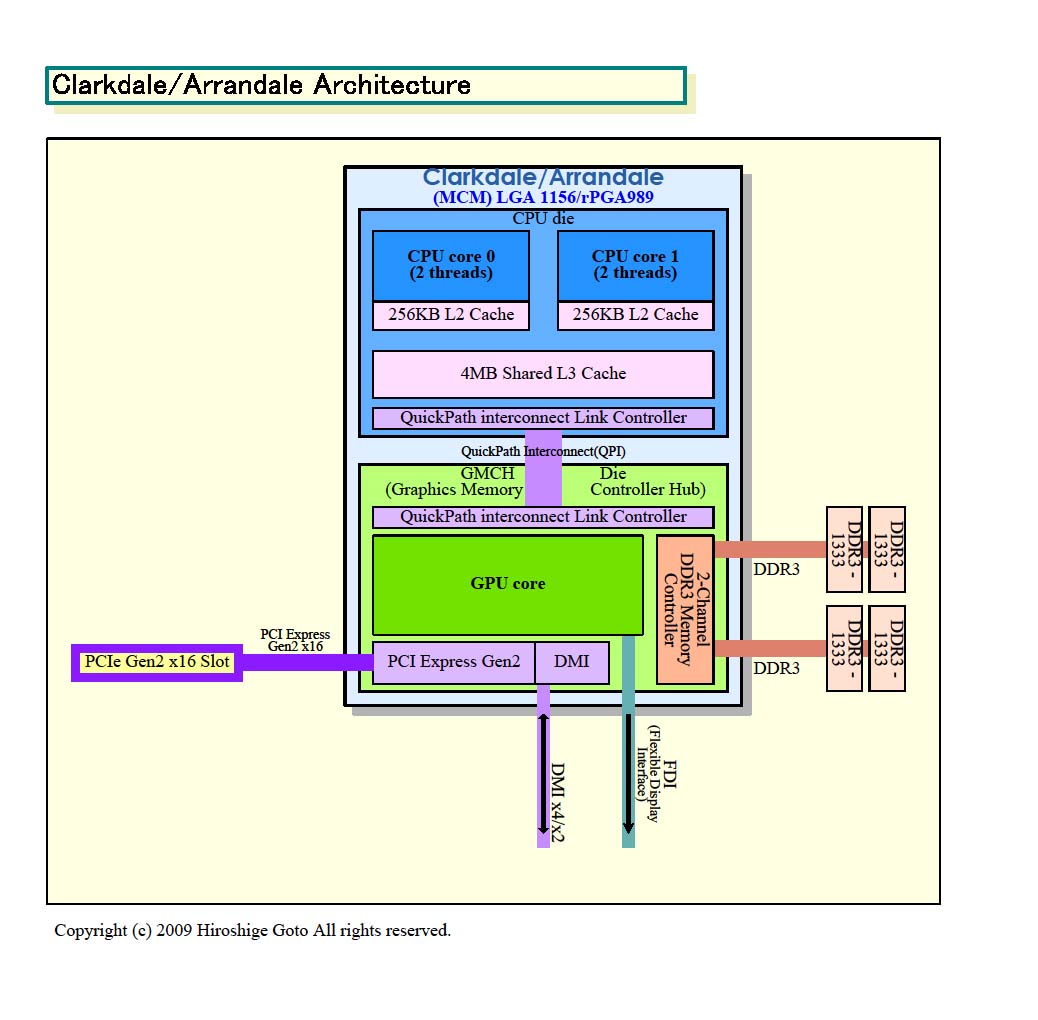
A feature of the new Core i3-350M is the integrated graphics card called GMA HD and the memory controller. Both are on a separate die that is still manufactured in 45nm whereas the CPU die is already manufactured in the new 32nm process. 

First performance results from [pconline.com.cn] indicate a very good performance per MHz. The site reviewed the upcoming Core i3 530 (2.93 GHz - no turbo) which was on average faster than a Core 2 Duo E8400 (3.0 GHz). Therefore, the mobile Core i3-350M should be faster than a Core 2 Duo P8400.

The integrated Intel Graphics Media Accelerator HD (GMA HD) graphics card is known to be clocked up to 500-667 MHz (due to Turbo Boost) and should be clearly faster than the old GMA 4500MHD. The Core i5 and i7 models should still be a bit faster because of the higher max. clock speed of the GPU. The performance of the graphics in 3D should be on par with a Radeon HD 4200 but the driver support is usually worse.

The power consumption of 35 Watt TDP (max.) counts for the whole package and therefore it is clearly better than the 35 Watt TDP of the Core 2 Duo T-series (CPU alone).

Intel Core i3-1115G4

► remove from comparison Intel i3-1115G4

The Intel Core i3-1115G4 is a dual-core SoC for laptops and Ultrabooks based on the Tiger Lake-U generation (UP3) that was launched in September 2020. It integrates two Willow Cove processor cores (4 threads thanks to HyperThreading). Each core can clock from 3 GHz (base speed) to 4.1 GHz (single- and dual-core boost). The faster Core i5 and i7 models offer more cores and are therefore significantly faster.

Another novelty is the integrated Xe graphics card based on the completely new Gen 12 architecture. In the i3-1115G4 Intel is naming the GPU UHD Graphics and offers only 48 of the 96 EUs clocked at 400 - 1250 MHz. GPU and CPU can together use the 6 MB of L3 cache.

Furthermore, Tiger Lake SoCs add PCIe 4 support (four lanes), AI hardware acceleration, and the partial integration of Thunderbolt 4 / USB 4 and WiFi 6 in the chip.

The chip is produced on the second-gen 10 nm Intel SuperFin process that should be comparable to the 7 nm TSMC process (e.g. Ryzen 4000 series).

Performance

Multi-thread peformance is most comparable to what the Intel Core i5-8250U and the AMD Ryzen 5 3450U deliver. This makes the i3 a more than decent option for day-to-day tasks; that said, any workload of the more taxing kind (such as exporting a high-bitrate, hour long UHD video) will be enough to bring the i3 to its knees.

Thanks to its decent cooling solution and a long-term CPU power limit of 25 W, the ThinkPad L15 G2-20X4S0KU00 is one of the fastest laptops powered by the 1115G4 we know of. It can be more than 20% faster in CPU-bound workloads than the slowest system featuring the same chip in our database, as of August 2023.

Power consumption

This Core i3 series chip has a default TDP of 12 W to 28 W, the expectation being that laptop makers will go for a higher value in exchange for higher performance. Either way, that's a tad too high to allow for passively cooled laptops, tablets, mini-PCs.

The Core i3-1115G4 is built with Intel's third-gen 10 nm process marketed as SuperFin for decent, as of mid 2022, energy efficiency.

ModelIntel Core i3-350MIntel Core i3-1115G4
CodenameArrandaleTiger Lake-UP3
SeriesIntel Core i3Intel Tiger Lake
Series: Tiger Lake Tiger Lake-UP3
Intel Core i3-390M compare2.67 GHz2 / 4 cores3 MB L3
Intel Core i3-380M compare2.53 GHz2 / 4 cores3 MB L3
Intel Core i3-370M compare2.4 GHz2 / 4 cores3 MB L3
Intel Core i3-350M « 2.26 GHz2 / 4 cores3 MB L3
Intel Core i3-330M compare2.13 GHz2 / 4 cores3 MB L3
Intel Core i3-380UM compare1.33 GHz2 / 4 cores3 MB L3
Intel Core i3-330UM compare1.2 GHz2 / 4 cores3 MB L3
Intel Core i7-1195G7 compare2.9 - 5 GHz4 / 8 cores12 MB L3
Intel Core i7-1185G7 compare3 - 4.8 GHz4 / 8 cores12 MB L3
Intel Core i7-1165G7 compare2.8 - 4.7 GHz4 / 8 cores12 MB L3
Intel Core i5-1155G7 compare2.5 - 4.5 GHz4 / 8 cores8 MB L3
Intel Core i5-1145G7 compare2.6 - 4.4 GHz4 / 8 cores8 MB L3
Intel Core i5-1135G7 compare2.4 - 4.2 GHz4 / 8 cores8 MB L3
Intel Core i3-1125G4 compare2 - 3.7 GHz4 / 8 cores8 MB L3
Intel Core i3-1115G4 « 3 - 4.1 GHz2 / 4 cores6 MB L3
Clock2260 MHz3000 - 4100 MHz
FSB2500
L2 Cache512 KB2.5 MB
L3 Cache3 MB6 MB
Cores / Threads2 / 42 / 4
TDP35 Watt28 Watt
Transistors382+177 Million
Technology32 nm10 nm
Die Size81+114 mm2
max. Temp.105 °C100 °C
SocketBGA1288, PGA988BGA1449
FeaturesHyper Threading, Enhanced Speedstep, integrierte GMA HD 667MHz,DDR4-3200/LPDDR4x-3733 RAM, PCIe 4, 4 GT/s bus, DL Boost, GNA, MMX, SSE, SSE2, SSE3, SSSE3, SSE4.1, SSE4.2, AVX, AVX2, AVX-512, BMI2, ABM, FMA, ADX, VMX, SMEP, SMAP, EIST, TM1, TM2, HT, Turbo, SST, AES-NI, RDRAND, RDSEED, SHA
Architecturex86x86
Announced
Manufacturerark.intel.comark.intel.com
L1 Cache160 KB
iGPUIntel UHD Graphics Xe G4 48EUs (400 - 1250 MHz)

Benchmarks

Performance Rating - CB R15 + R20 + 7-Zip + X265 + Blender + 3DM11 CPU - i3-1115G4
29.1 pt (48%)
Restrict / Search: Model: Max. age: years
Cinebench R23 - Cinebench R23 Multi Core
min: 2725     avg: 3038     median: 3125 (3%)     max: 3244 Points
Cinebench R23 - Cinebench R23 Single Core
min: 1242     avg: 1299     median: 1312 (55%)     max: 1319 Points
Cinebench R20 - Cinebench R20 CPU (Single Core)
min: 504     avg: 507     median: 504.5 (55%)     max: 515 Points
Cinebench R20 - Cinebench R20 CPU (Multi Core)
min: 961     avg: 1120     median: 1114 (3%)     max: 1251 Points
Cinebench R15 - Cinebench R15 CPU Multi 64 Bit
min: 384.7     avg: 461.6     median: 480.5 (3%)     max: 507 Points
Cinebench R15 - Cinebench R15 CPU Single 64 Bit
min: 137     avg: 179.9     median: 190 (53%)     max: 197 Points
Cinebench R11.5 - Cinebench R11.5 CPU Multi 64 Bit
100%
1 350M +
min: 1.49     avg: 1.8     median: 1.9 (2%)     max: 1.89 Points
Cinebench R10 - Cinebench R10 Rend. Single (32bit)
100%
350M +
min: 2152     avg: 2445     median: 2453 (15%)     max: 2559 Points
8018 Points (48%)
Cinebench R10 - Cinebench R10 Rend. Multi (32bit)
100%
350M +
min: 5616     avg: 5826     median: 5843 (4%)     max: 5943 Points
16265 Points (12%)
Cinebench R10 - Cinebench R10 Rend. Multi (64bit)
100%
1 350M +
min: 6763     avg: 6999     median: 7000 (4%)     max: 7146 Points
Cinebench R10 - Cinebench R10 Rend. Single (64bit)
100%
1 350M +
min: 2920     avg: 3066     median: 3073.5 (4%)     max: 3183 Points
wPrime 2.10 - wPrime 2.0 1024m *
100%
350M +
min: 696     avg: 923     median: 706.5 (8%)     max: 1820 s
wPrime 2.10 - wPrime 2.0 32m *
100%
350M +
min: 22     avg: 29.2     median: 22.6 (5%)     max: 57 s
7-Zip 18.03 - 7-Zip 18.03 Multi Thread 4 runs
min: 11122     avg: 12669     median: 12919.5 (7%)     max: 13422 MIPS
7-Zip 18.03 - 7-Zip 18.03 Single Thread 4 runs
min: 4497     avg: 4586     median: 4599.5 (54%)     max: 4674 MIPS
X264 HD Benchmark 4.0 - x264 Pass 2
26.2 fps (1%)
X264 HD Benchmark 4.0 - x264 Pass 1
141.6 fps (4%)
HWBOT x265 Benchmark v2.2 - HWBOT x265 4k Preset
min: 3.25     avg: 3.7     median: 3.7 (7%)     max: 4.1 fps
TrueCrypt - TrueCrypt Serpent
0.2 GB/s (7%)
TrueCrypt - TrueCrypt Twofish
0.4 GB/s (7%)
TrueCrypt - TrueCrypt AES
2.8 GB/s (7%)
Blender - Blender 3.3 Classroom CPU *
2408 Seconds (31%)
Blender - Blender 2.79 BMW27 CPU *
min: 940     avg: 1037     median: 1021.5 (7%)     max: 1188 Seconds
R Benchmark 2.5 - R Benchmark 2.5 *
min: 0.636     avg: 0.7     median: 0.7 (14%)     max: 0.671 sec
3DMark 06 - CPU - 3DMark 06 - CPU
100%
350M +
min: 2315     avg: 2371     median: 2366 (5%)     max: 2461 Points
6331 Points (13%)
Super Pi mod 1.5 XS 1M - Super Pi mod 1.5 XS 1M *
100%
350M +
min: 19     avg: 19.4     median: 19 (4%)     max: 20 s
Super Pi mod 1.5 XS 2M - Super Pi mod 1.5 XS 2M *
100%
350M +
min: 44     avg: 45.9     median: 45.4 (2%)     max: 50 s
Super Pi Mod 1.5 XS 32M - Super Pi mod 1.5 XS 32M *
100%
350M +
min: 1033     avg: 1057     median: 1049 (5%)     max: 1121 s
SiSoft Sandra Dhrystone (MIPS) - SiSoft Sandra Dhrystone (MIPS)
100%
1 350M +
min: 27700     avg: 30348     median: 30475 (14%)     max: 32510 MIPS
SiSoft Sandra Whetstone (MFLOPS) - SiSoft Sandra Whetstone (MFLOPS)
100%
1 350M +
min: 21530     avg: 22088     median: 21575 (17%)     max: 24100 MFLOPS
3DMark Vantage - 3DM Vant. Perf. CPU no Physx
100%
350M +
min: 6466     avg: 6552     median: 6515 (5%)     max: 6747 Points
16869 Points (13%)
3DMark 11 - 3DM11 Performance Physics
min: 5128     avg: 5771     median: 5579.5 (14%)     max: 6640 Points
3DMark - 3DMark Ice Storm Physics
min: 57115     avg: 59888     median: 60028 (49%)     max: 62520 Points
3DMark - 3DMark Ice Storm Extreme Physics
min: 48647     avg: 55626     median: 56348 (46%)     max: 61883 Points
3DMark - 3DMark Ice Storm Unlimited Physics
min: 65022     avg: 65592     median: 65591.5 (53%)     max: 66161 Points
3DMark - 3DMark Cloud Gate Physics
min: 3986     avg: 4871     median: 5038 (13%)     max: 5250 Points
3DMark - 3DMark Fire Strike Standard Physics
min: 6125     avg: 7184     median: 7331.5 (13%)     max: 7786 Points
3DMark - 3DMark Time Spy CPU
min: 2227     avg: 2623     median: 2635 (11%)     max: 2937 Points
3DMark - 3DMark Sling Shot Extreme (ES 3.1) Unlimited Physics
5487 Points (52%)
Geekbench 6.5 - Geekbench 6.5 Single-Core
1786 Points (43%)
Geekbench 6.5 - Geekbench 6.5 Multi-Core
3428 Points (13%)
Geekbench 5.5 - Geekbench 5.1 - 5.5 64 Bit Single-Core
min: 1190     avg: 1296     median: 1311.5 (50%)     max: 1352 Points
Geekbench 5.5 - Geekbench 5.1 - 5.5 64 Bit Multi-Core
min: 2341     avg: 2628     median: 2605 (5%)     max: 2983 Points
Geekbench 5.0 - Geekbench 5.0 64 Bit Single-Core
1328 Points (6%)
Geekbench 5.0 - Geekbench 5.0 64 Bit Multi-Core
2399 Points (8%)
Geekbench 4.4 - Geekbench 4.1 - 4.4 64 Bit Single-Core
5601 Points (56%)
Geekbench 4.4 - Geekbench 4.1 - 4.4 64 Bit Multi-Core
9945 Points (10%)
Mozilla Kraken 1.1 - Kraken 1.1 Total Score *
min: 657.9     avg: 749     median: 755 (1%)     max: 805 ms
Sunspider - Sunspider 1.0 Total Score *
145.8 ms (2%)
Octane V2 - Octane V2 Total Score
min: 49170     avg: 55606     median: 58151 (43%)     max: 59497 Points
WebXPRT 4 - WebXPRT 4 Score
152.3 Points (42%)
WebXPRT 3 - WebXPRT 3 Score
min: 200     avg: 213.7     median: 204.5 (37%)     max: 257 Points
PCMark for Android - PCM f. Android Storage 2.0 score
20509 Points (9%)
PCMark for Android - PCM f. Android Work Score 3.0
11801 Points (43%)
CrossMark - CrossMark Overall
min: 950     avg: 1029     median: 1033 (39%)     max: 1094 Points
CrXPRT 2 - CrXPRT2 Performance Score
147 Points (81%)
Power Consumption - Prime95 Power Consumption - external Monitor *
min: 24.7     avg: 36.1     median: 35.2 (6%)     max: 44.6 Watt
Power Consumption - Cinebench R15 Multi Power Consumption - external Monitor *
min: 25.6     avg: 36.3     median: 39.1 (7%)     max: 41.3 Watt
Power Consumption - Geekbench 5.5 Power Consumption 150cd *
22.5 Watt (10%)
Power Consumption - Idle Power Consumption - external Monitor *
3.7 Watt (2%)
Power Consumption - Idle Power Consumption 150cd 1min *
min: 5.66     avg: 6.2     median: 5.8 (7%)     max: 7.67 Watt
Power Consumption - Power Efficiency - Cinebench R15 Multi external Monitor
min: 12.1     avg: 13.5     median: 12.8 (10%)     max: 16.3 Points per Watt

Average Benchmarks Intel Core i3-350M → 100% n=9

Average Benchmarks Intel Core i3-1115G4 → 246% n=9

- Range of benchmark values for this graphics card
red legend - Average benchmark values for this graphics card
* Smaller numbers mean a higher performance
1 This benchmark is not used for the average calculation

Add one or more devices and compare

In the following list you can select (and also search for) devices that should be added to the comparison. You can select more than one device.

restrict list:
v1.34
log 08. 13:18:50

#0 ran 0s before starting gpusingle class +0s ... 0s

#1 checking url part for id 536 +0s ... 0s

#2 checking url part for id 12242 +0s ... 0s

#3 redirected to Ajax server, took 1759922330s time from redirect:0 +0s ... 0s

#4 did not recreate cache, as it is less than 5 days old! Created at Tue, 07 Oct 2025 05:18:31 +0200 +0s ... 0s

#5 composed specs +0.006s ... 0.006s

#6 did output specs +0s ... 0.006s

#7 getting avg benchmarks for device 536 +0.001s ... 0.006s

#8 got single benchmarks 536 +0.027s ... 0.033s

#9 getting avg benchmarks for device 12242 +0.004s ... 0.037s

#10 got single benchmarks 12242 +0.023s ... 0.06s

#11 got avg benchmarks for devices +0s ... 0.06s

#12 min, max, avg, median took s +0.034s ... 0.095s

#13 return log +0.008s ... 0.103s

Please share our article, every link counts!
Mail Logo
> Expert Reviews and News on Laptops, Smartphones and Tech Innovations > Benchmarks / Tech > Processor Comparison - Head 2 Head
Redaktion, 2017-09- 8 (Update: 2023-07- 1)