

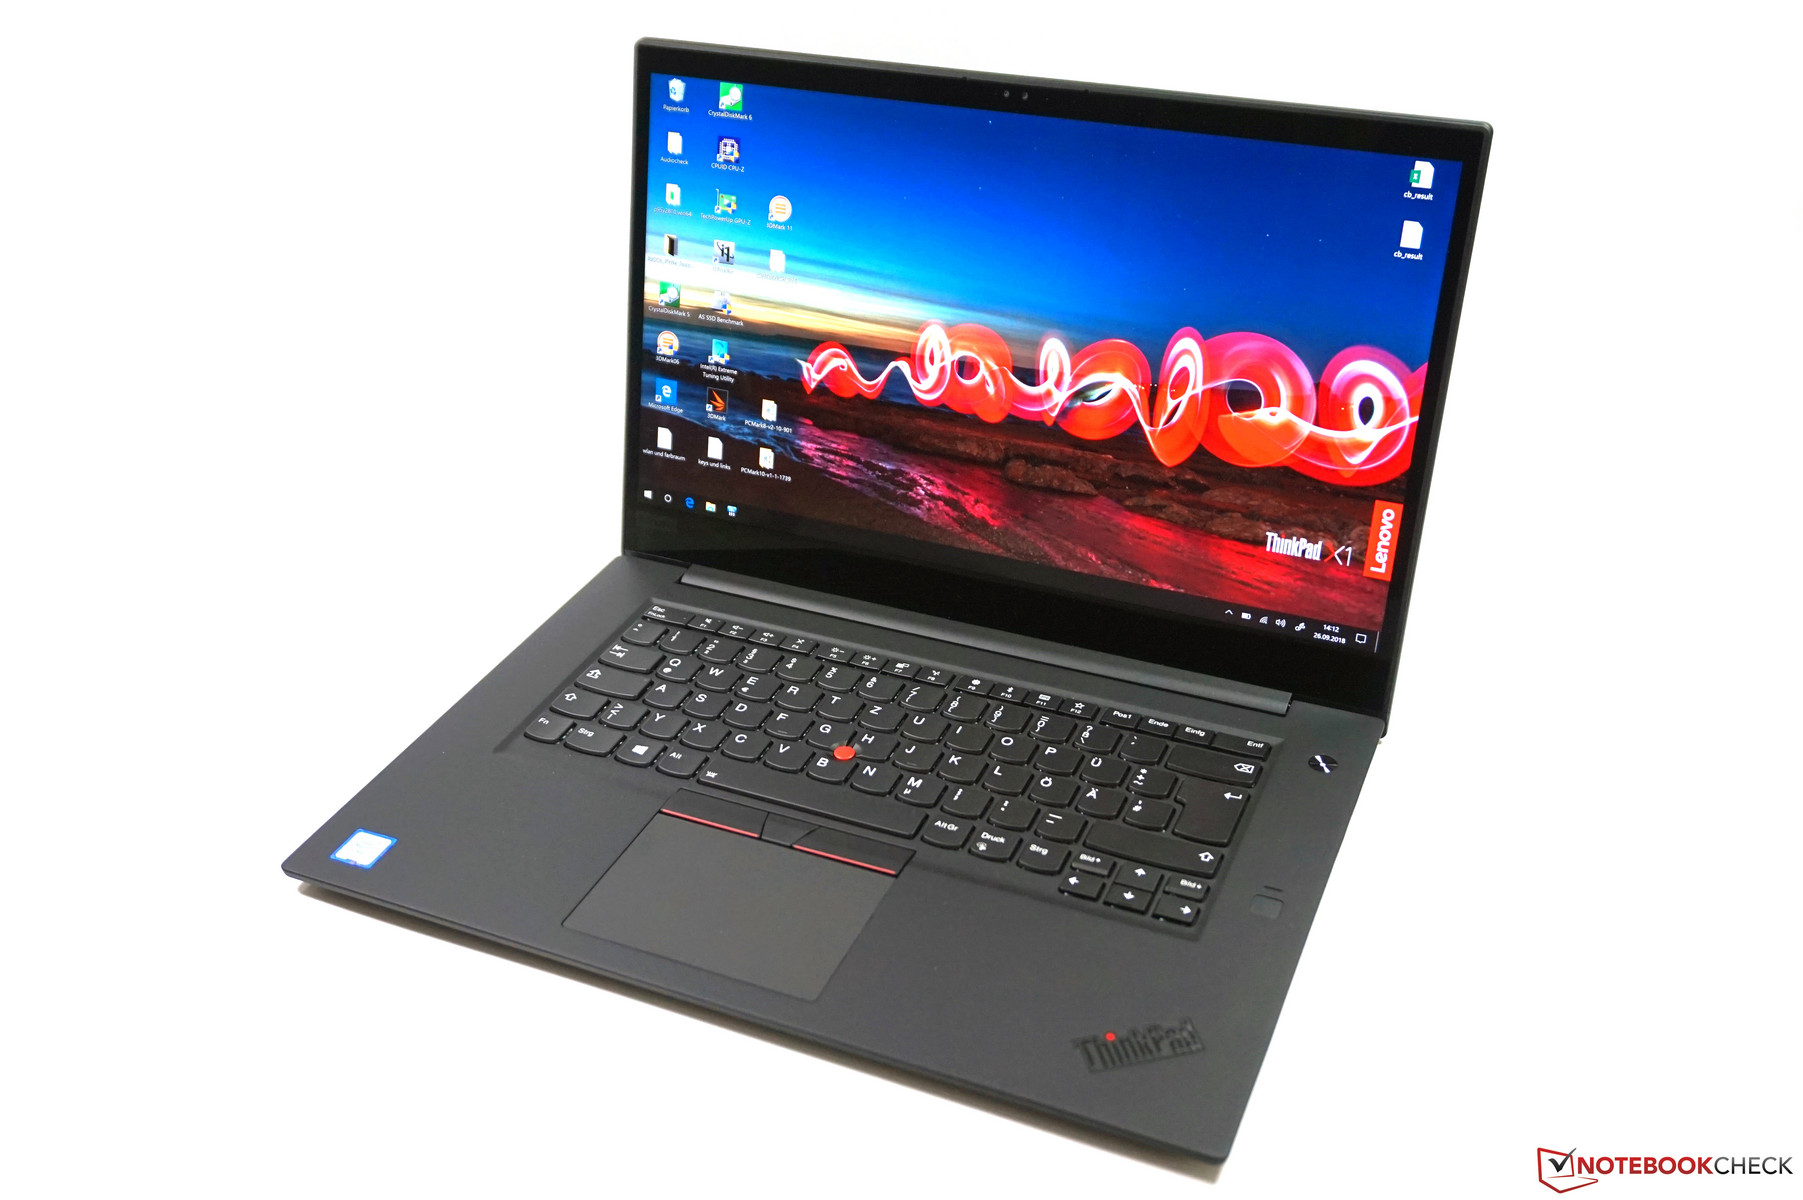
Lenovo ThinkPad X1 Extreme (i7, 4K-HDR, GTX 1050 Ti Max-Q) Laptop Review
The ThinkPad X1-series has been the pinnacle of Lenovo's slim and light business lineup for the last couple of years. So far, it was limited to 14-inch devices with the ThinkPad X1 Carbon and ThinkPad X1 Yoga, and there were no options for discreet GPUs. The Chinese manufacturer now adds launches the ThinkPad X1 Extreme, a slim and light 15.6-inch laptop. It is therefore a direct rival for devices like the Dell XPS 15, Apple MacBook Pro 15, or the new HP EliteBook 1050 G1. Lenovo will also offer a workstation version of the X1 Extreme called ThinkPad P1, which will be equipped with professional Nvidia Quadro GPUs and Intel Xeon CPUs (optional).
It is hard to classify the ThinkPad X1 Extreme, and a look at the specs does not make it any easier. Things like a 4K touchscreen with HDR support and the Max-Q version of the Nvidia GeForce GTX 1050 Ti are perfect for a multimedia laptop, but also get maintenance options, familiar ThinkPad input devices, and comprehensive service options.
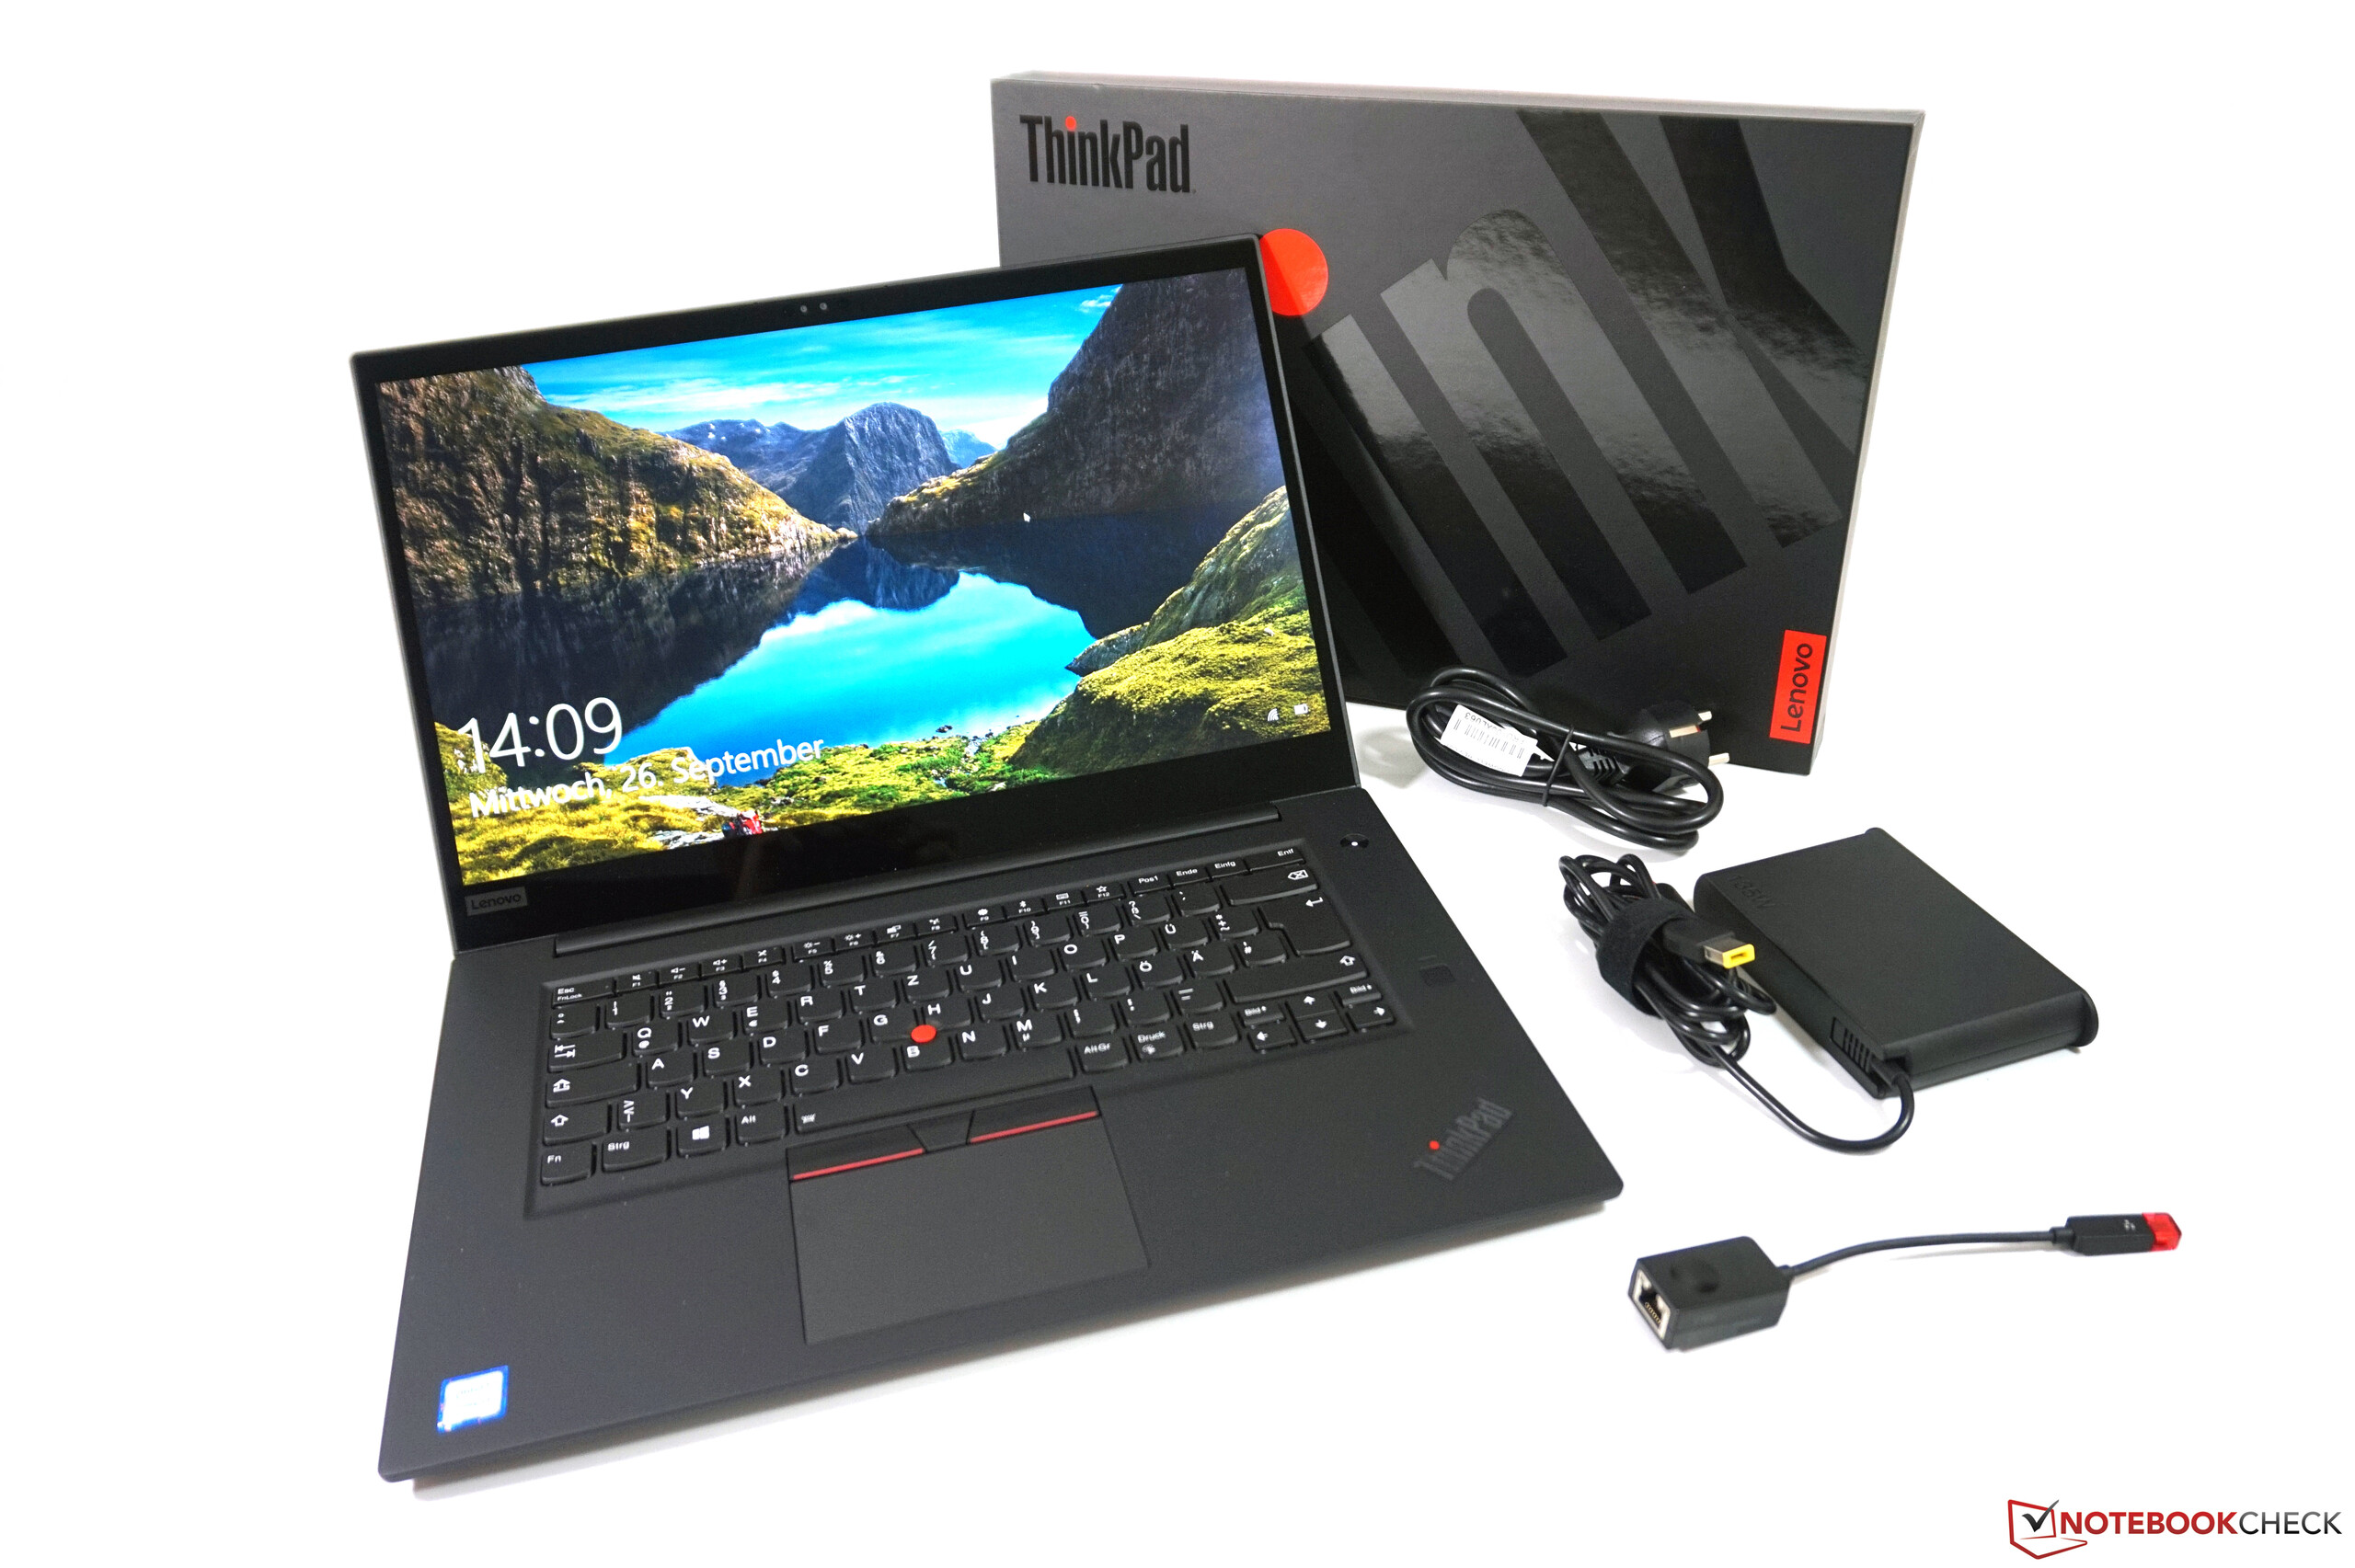
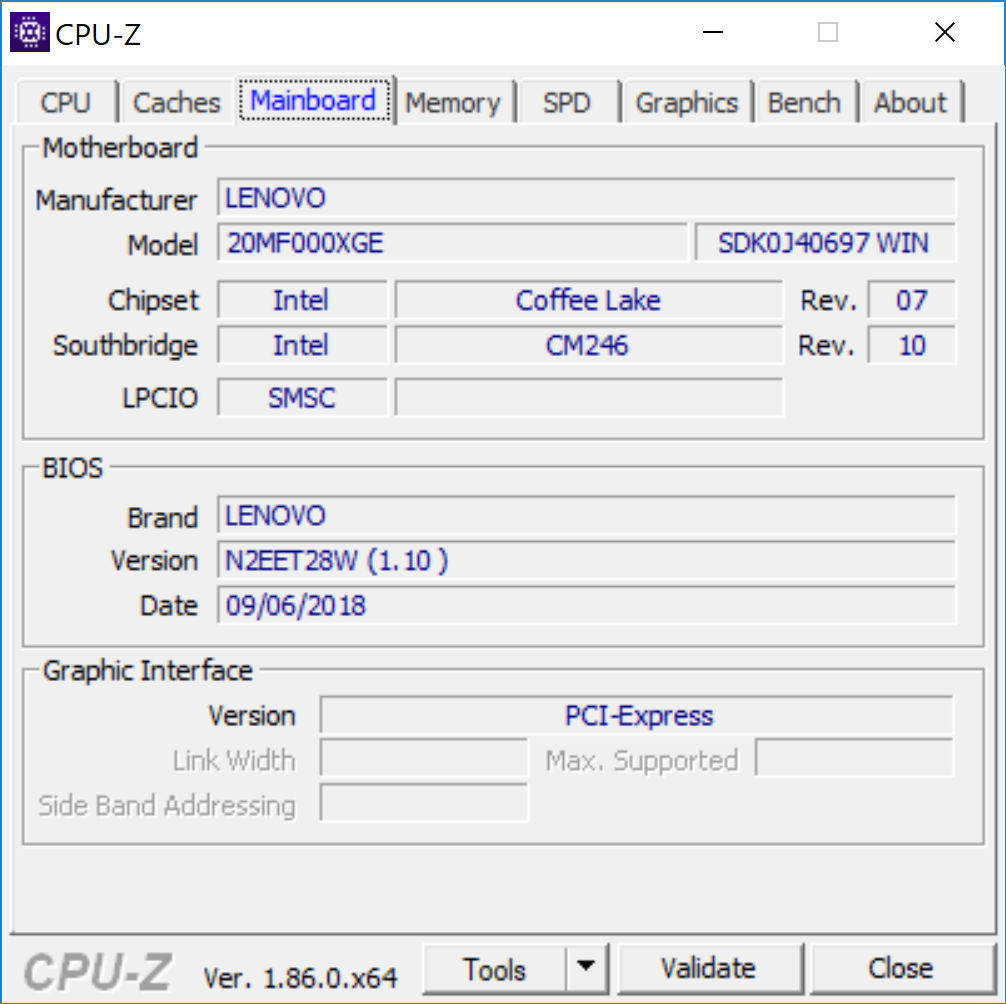
Our test model carries the designation 20MF000XGE and is exclusive for Lenovo's Campus program (eligible for student, teachers and scientific employees). It is currently the most expensive SKU at 2799 Euros, but you also get a lot of features in return: the previously mentioned 4K UHD HDR display and the Nvidia GPU, but also a modern Intel CPU with six cores (Coffee Lake). The memory equipment with 32 GB RAM and 1 TB SSD storage is not bad, either. The corresponding topseller model for regular customers (also 20MF000XGE) is 500 Euros more expensive (3299 Euros). You can also build your own device in Lenovo's online shop where the X1 Extreme starts at 2119 Euros all the way up to 4900 Euros with 2x 32 GB RAM and 2x 1TB SSDs.
Dell's XPS 15 9570 starts at a much lower price, but is closer when you select similar components. The HP EliteBook 1050 G1 is a bit more expensive and the, which is also the case for Apple's MacBook Pro 15. We will also compare the ThinkPad X1 Extreme with some Lenovo models over the course of the review, including the ThinkPad T580 with the UHD screen and GeForce MX150 graphics.
- Update 1: Maintenance, system noise, temperature, battery runtime
- Update 2: Case, response times, CPU tuning, system performance, battery runtime
- Update 3: Communication, security, accessories, warranty, input devices, HDR, battery runtime gaming + HDR
- Update 4: Performance on battery power, power consumption, gaming performance, speakers, pros & cons, verdict, rating
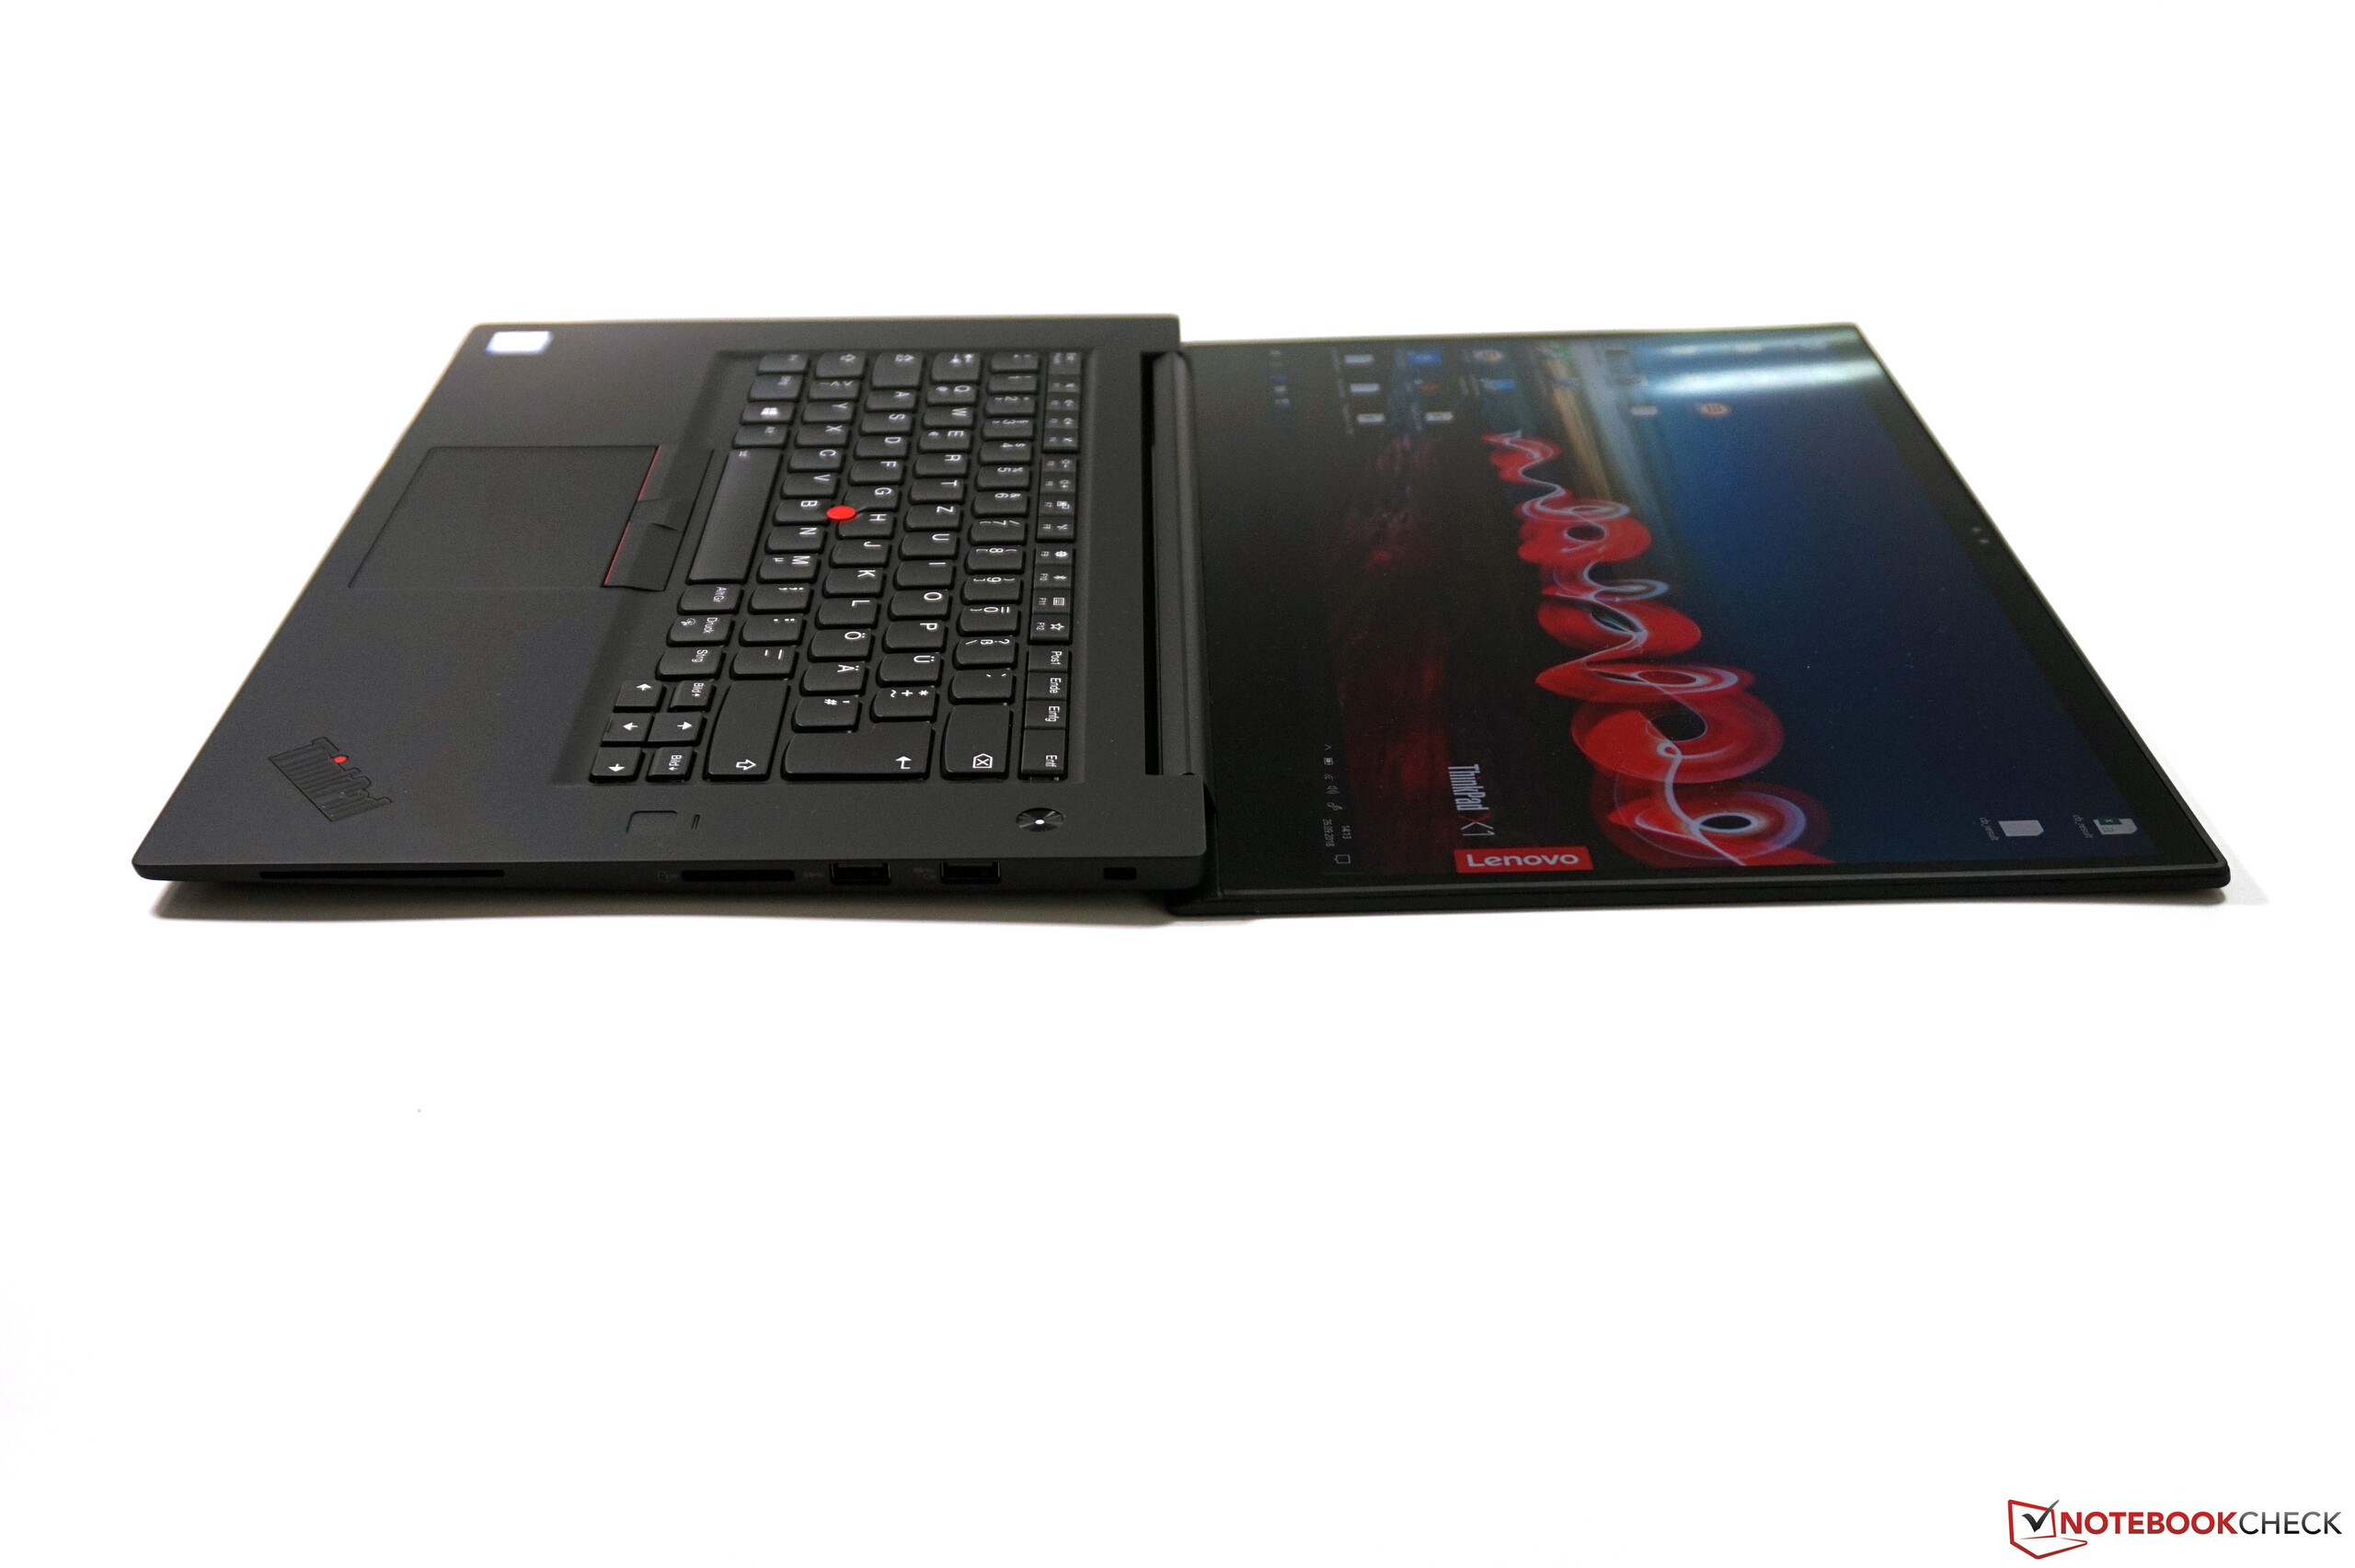
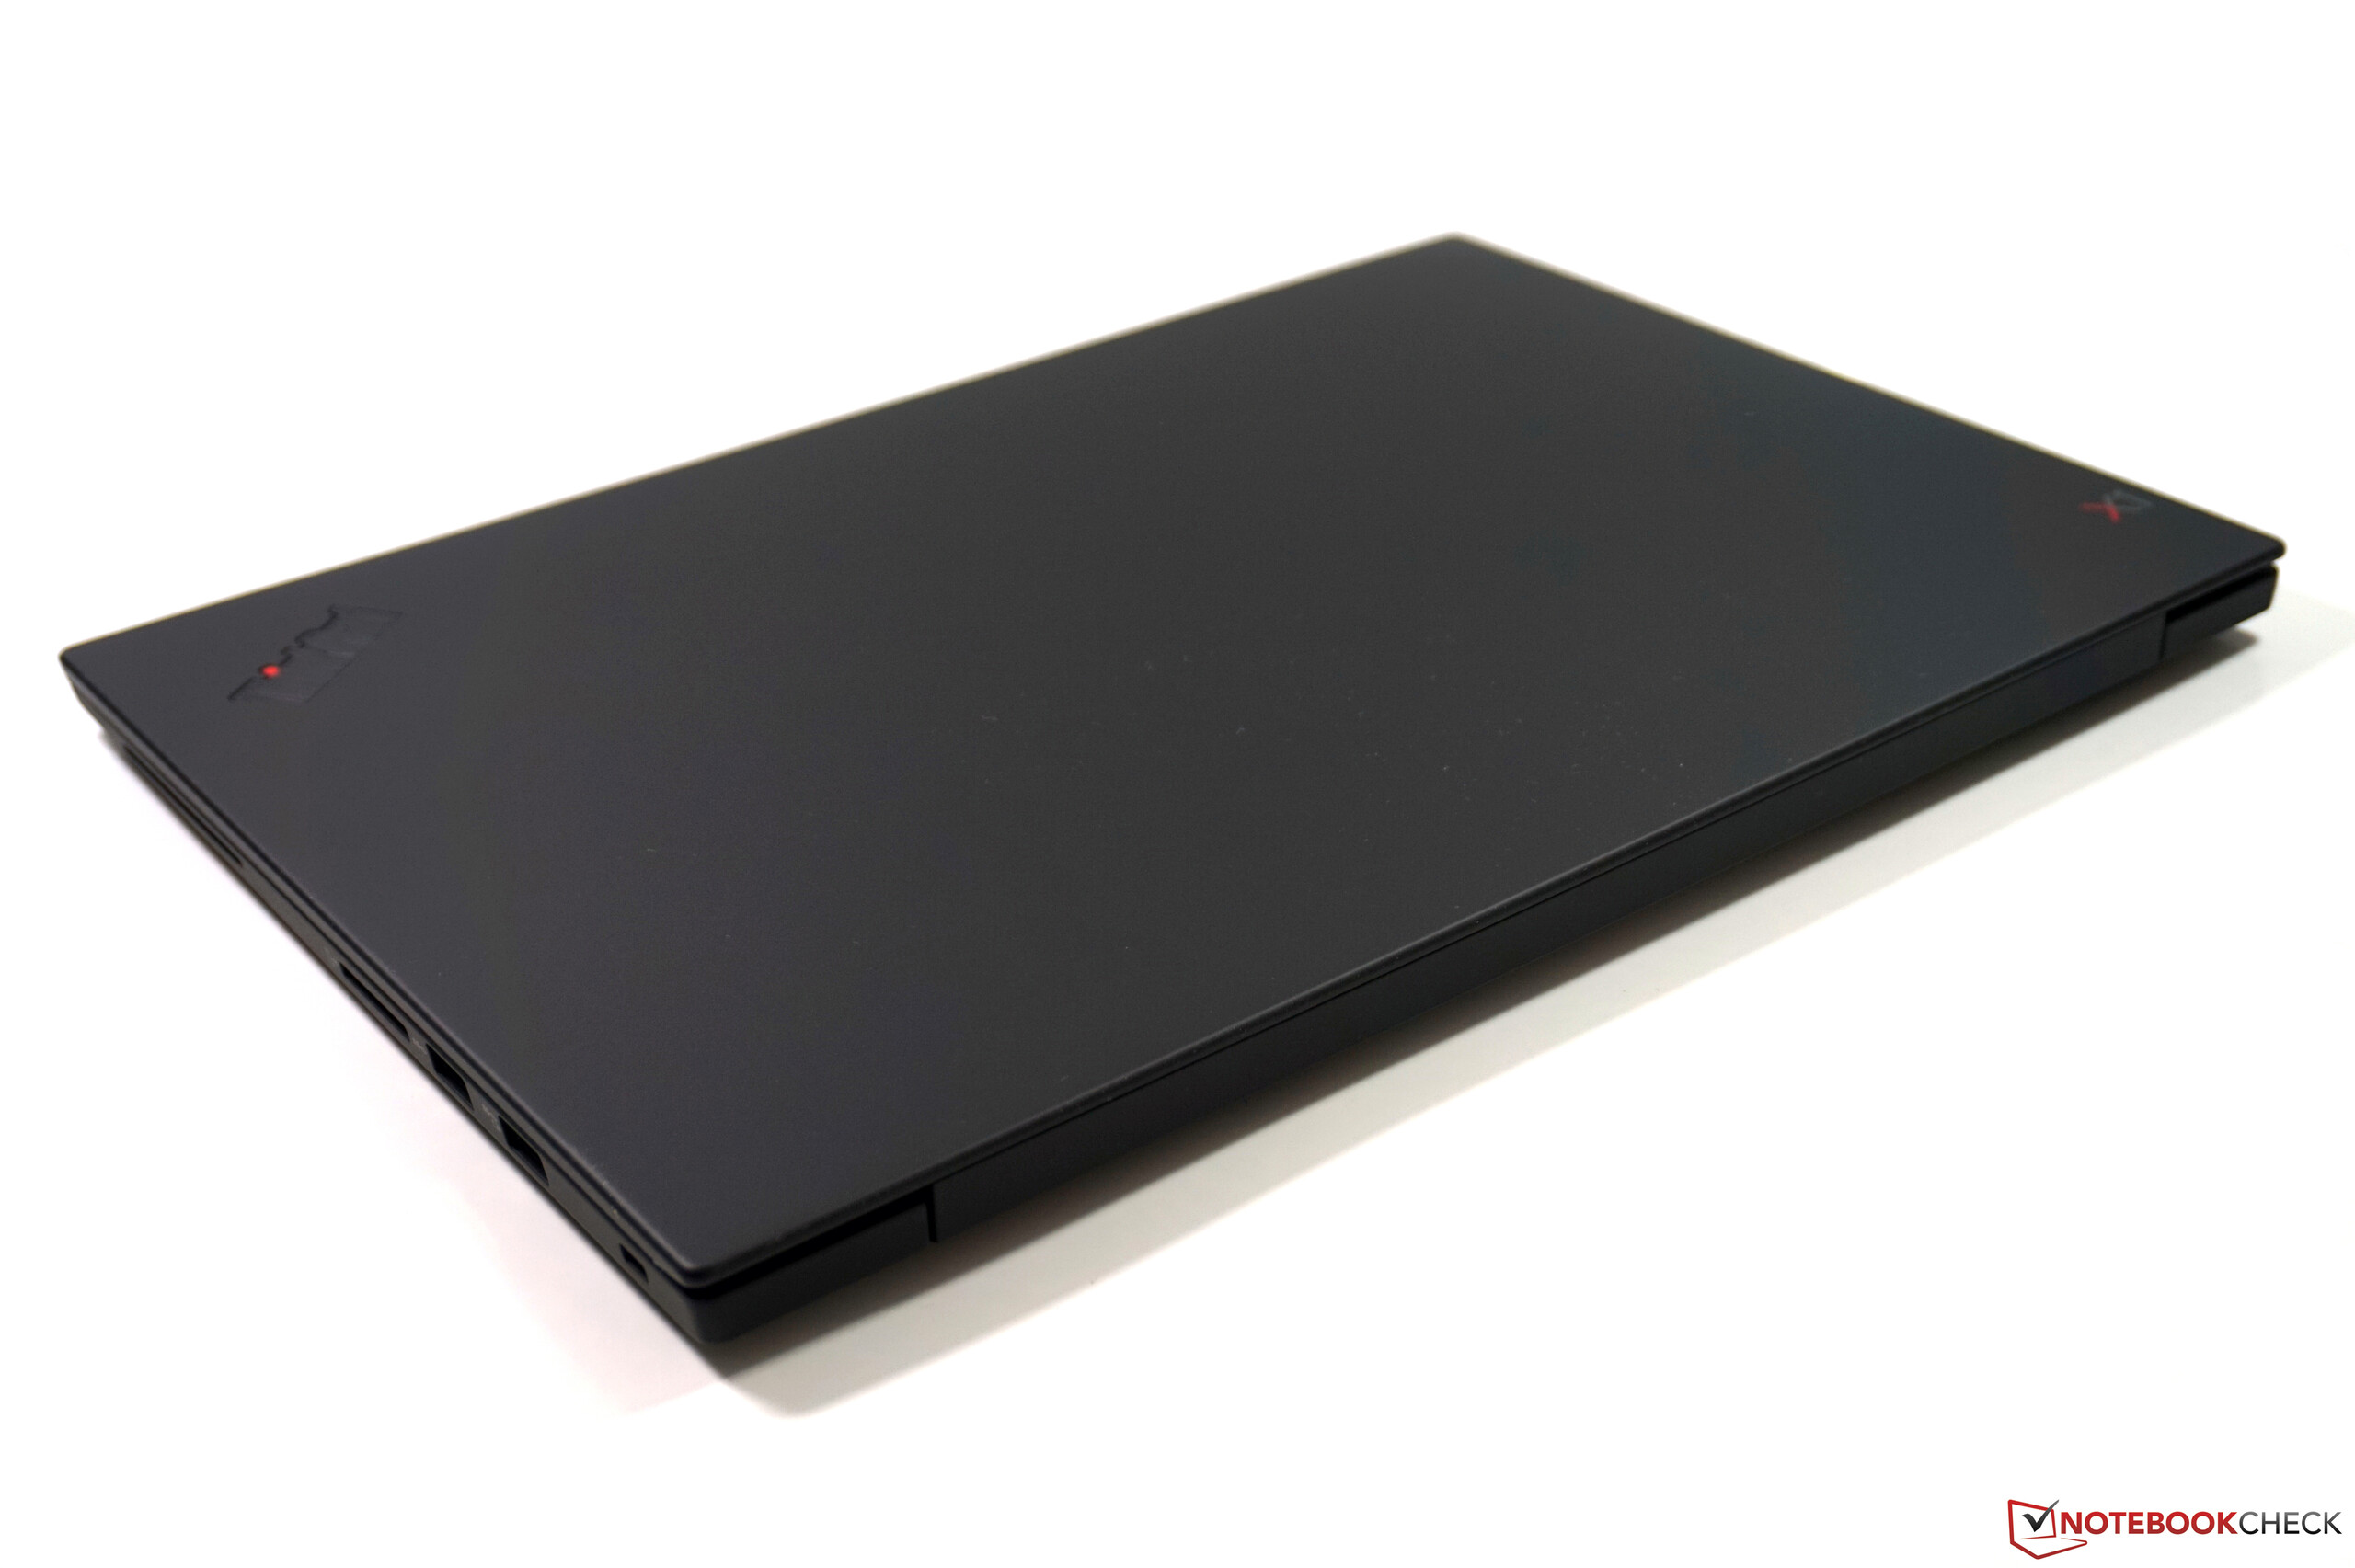
Case - ThinkPad from every angle
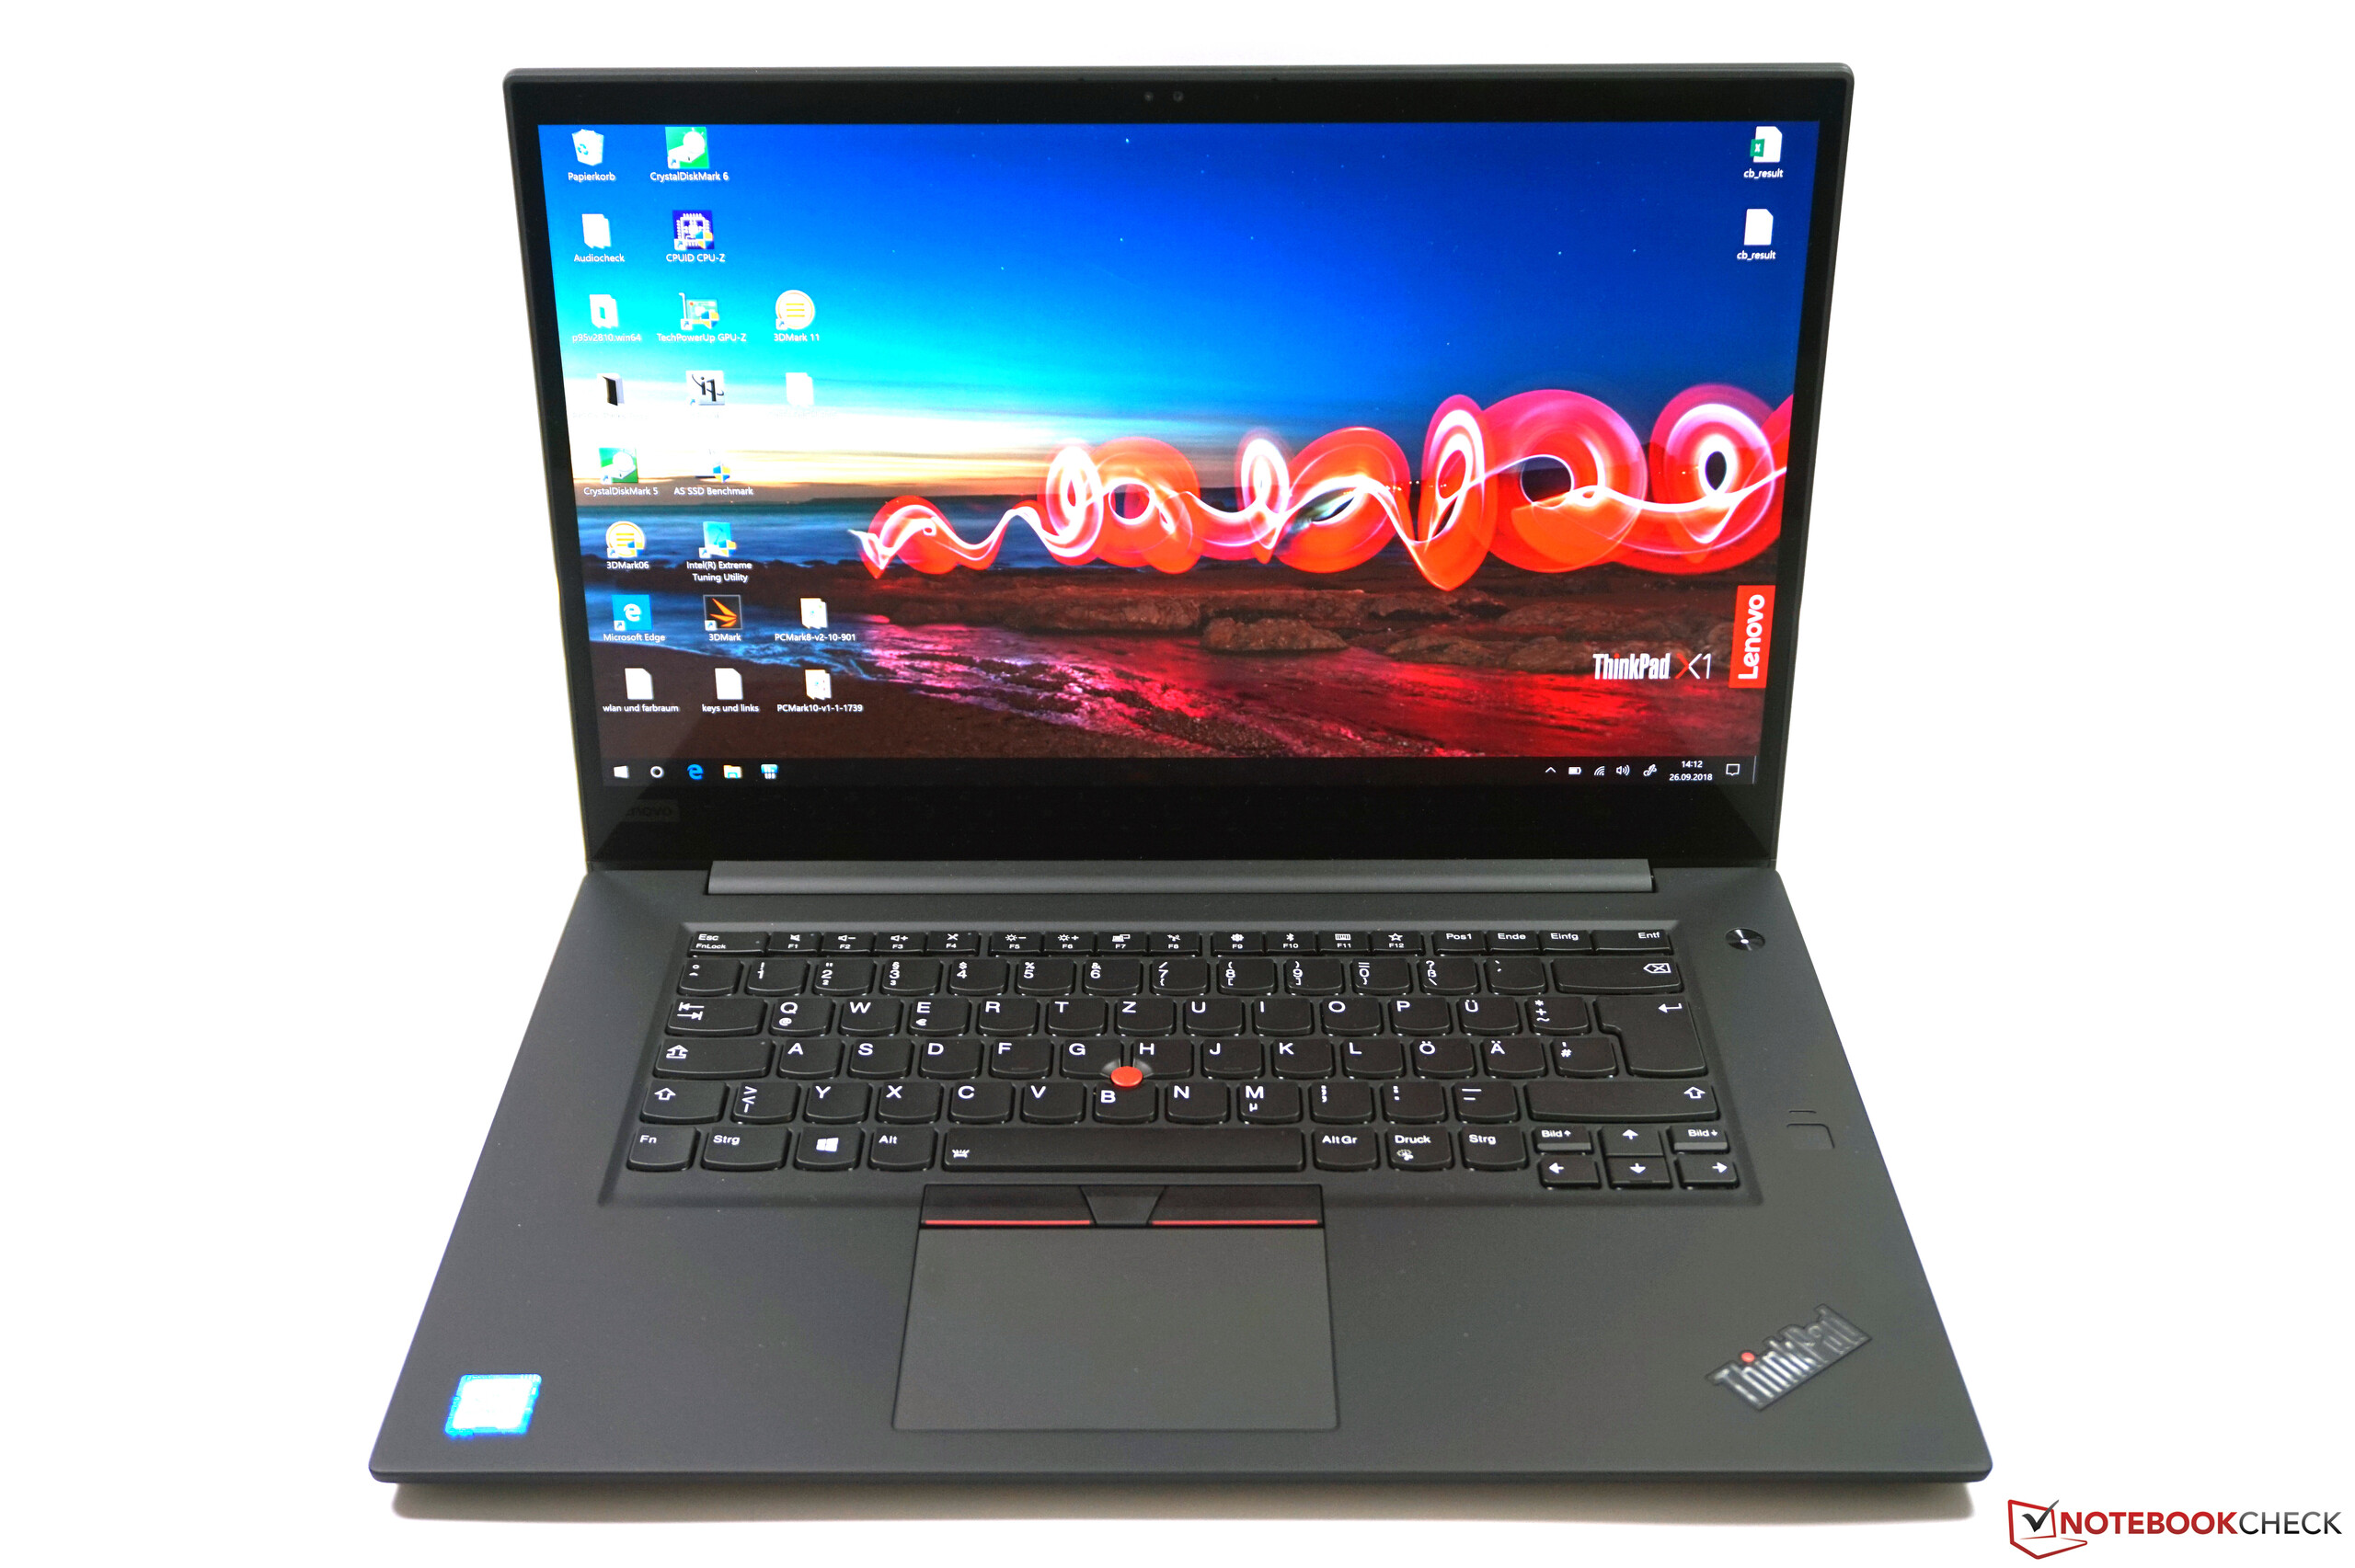
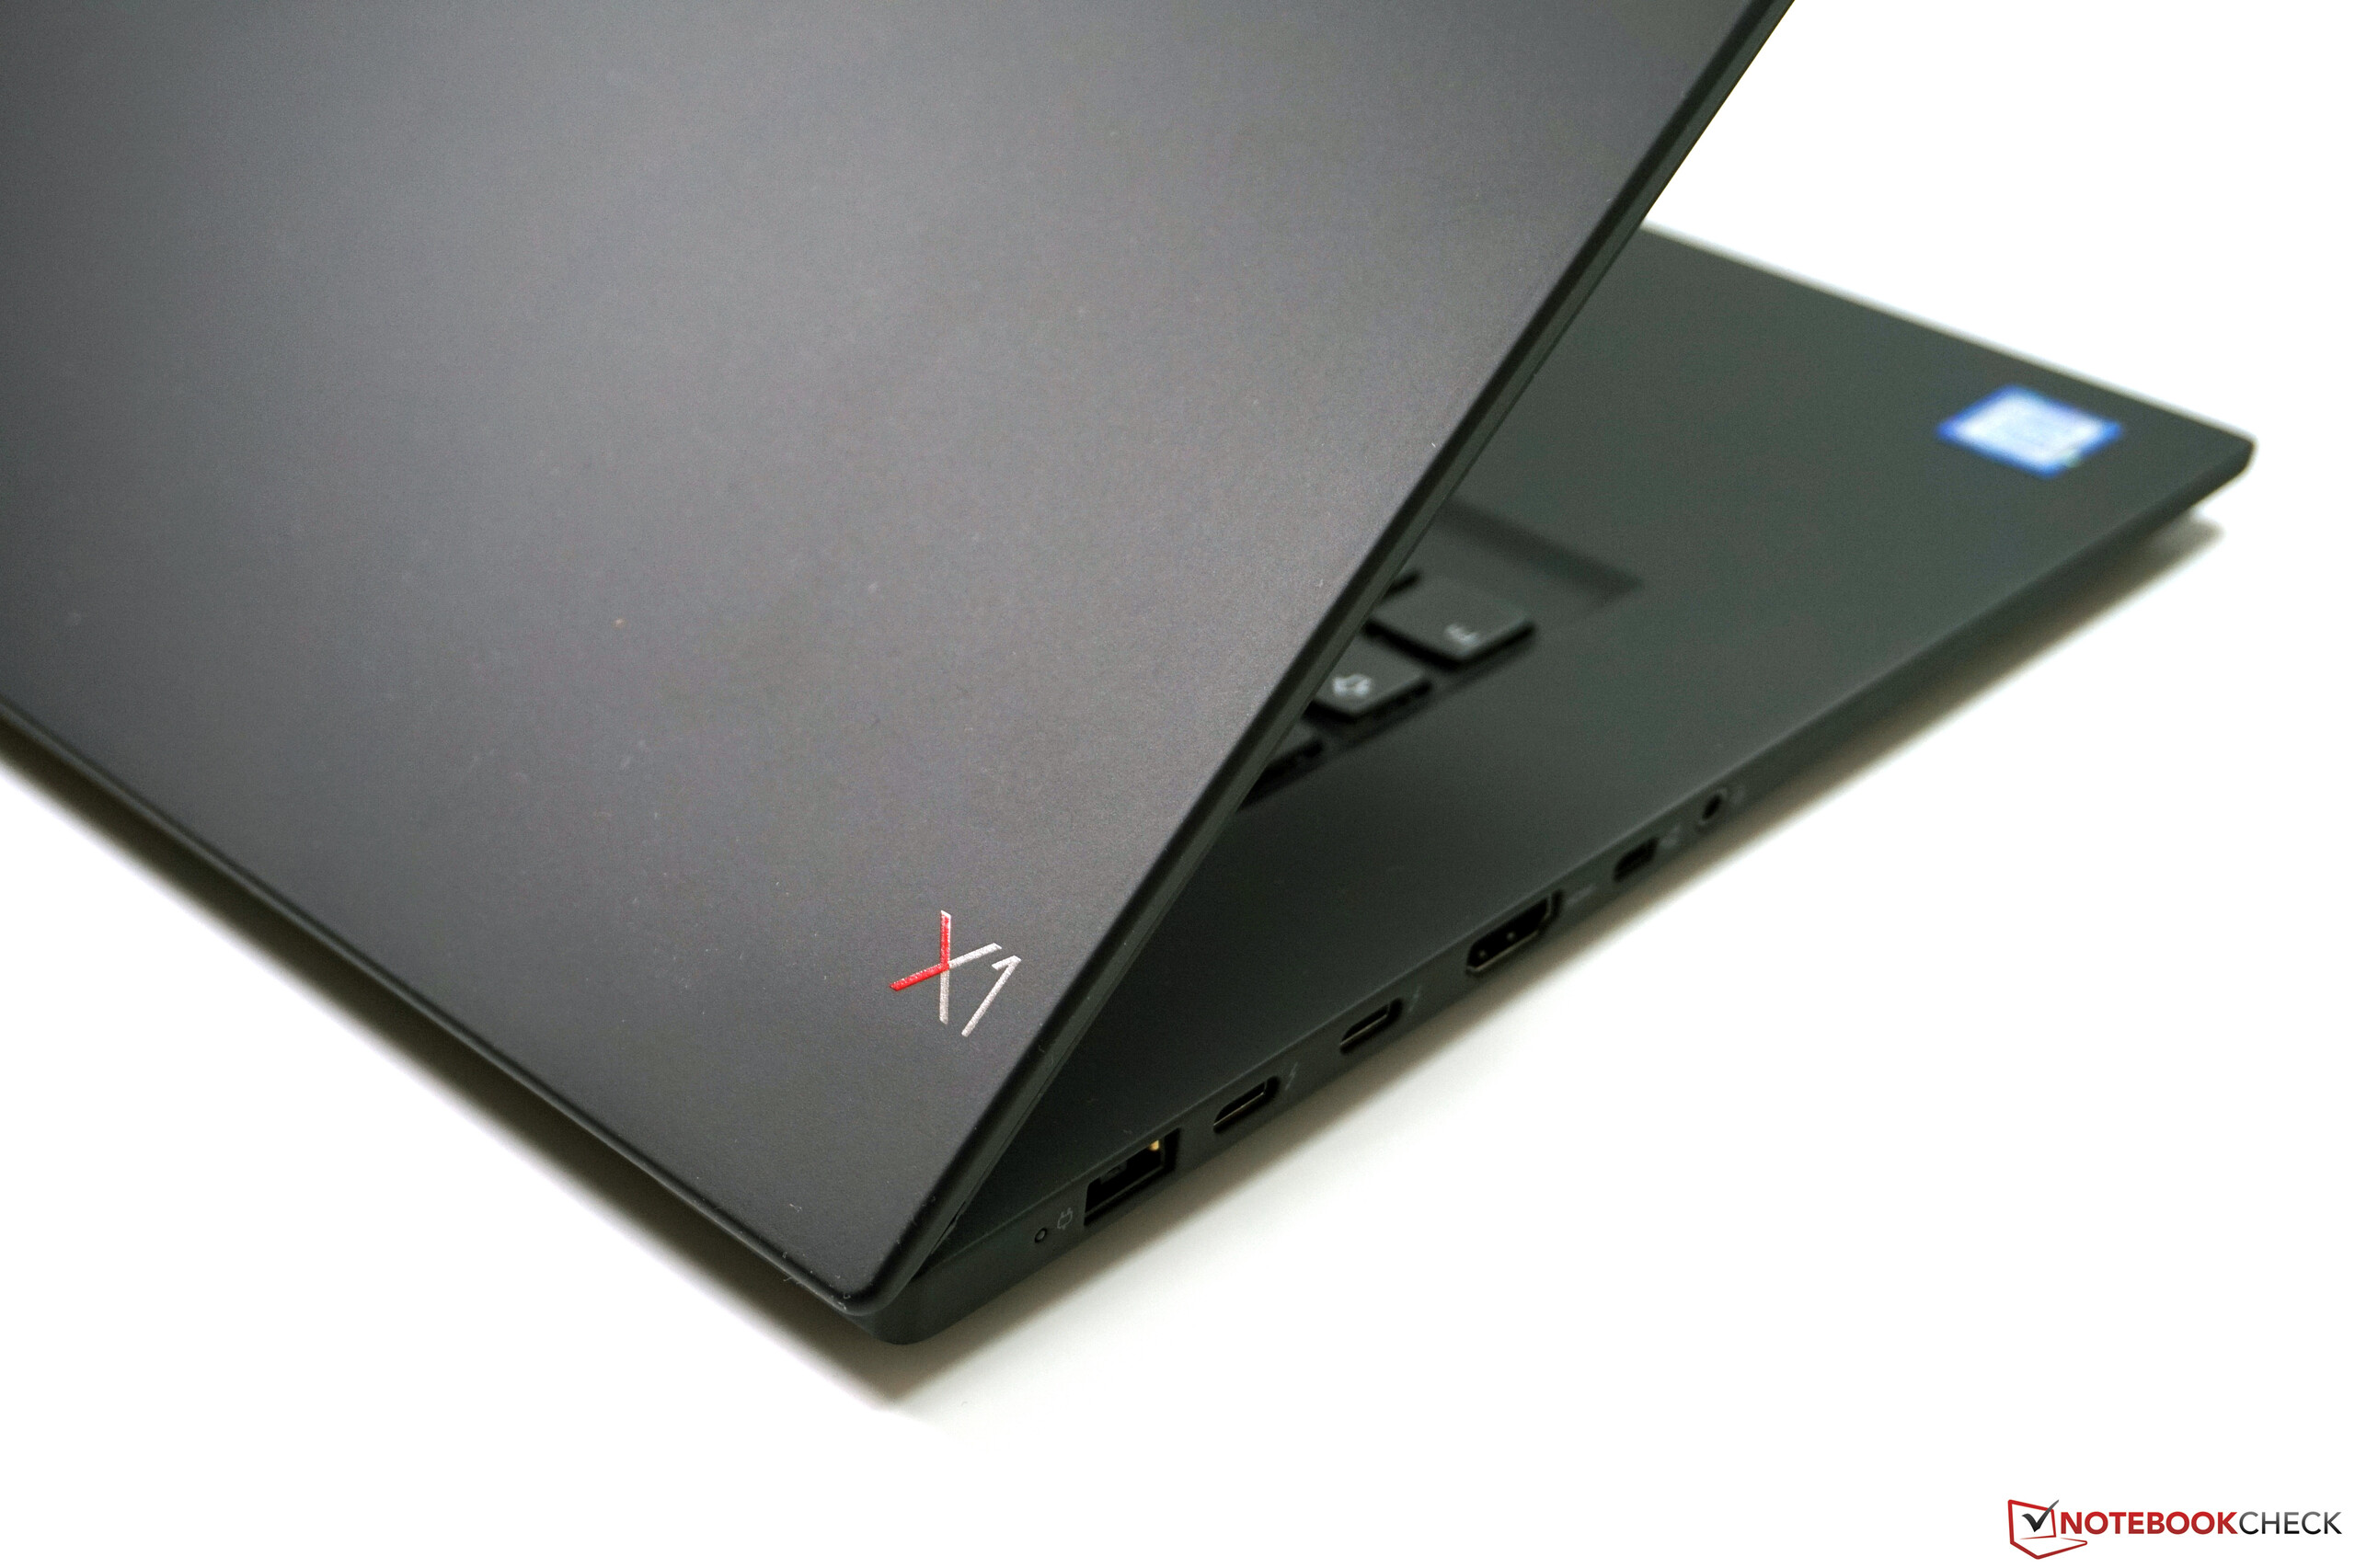
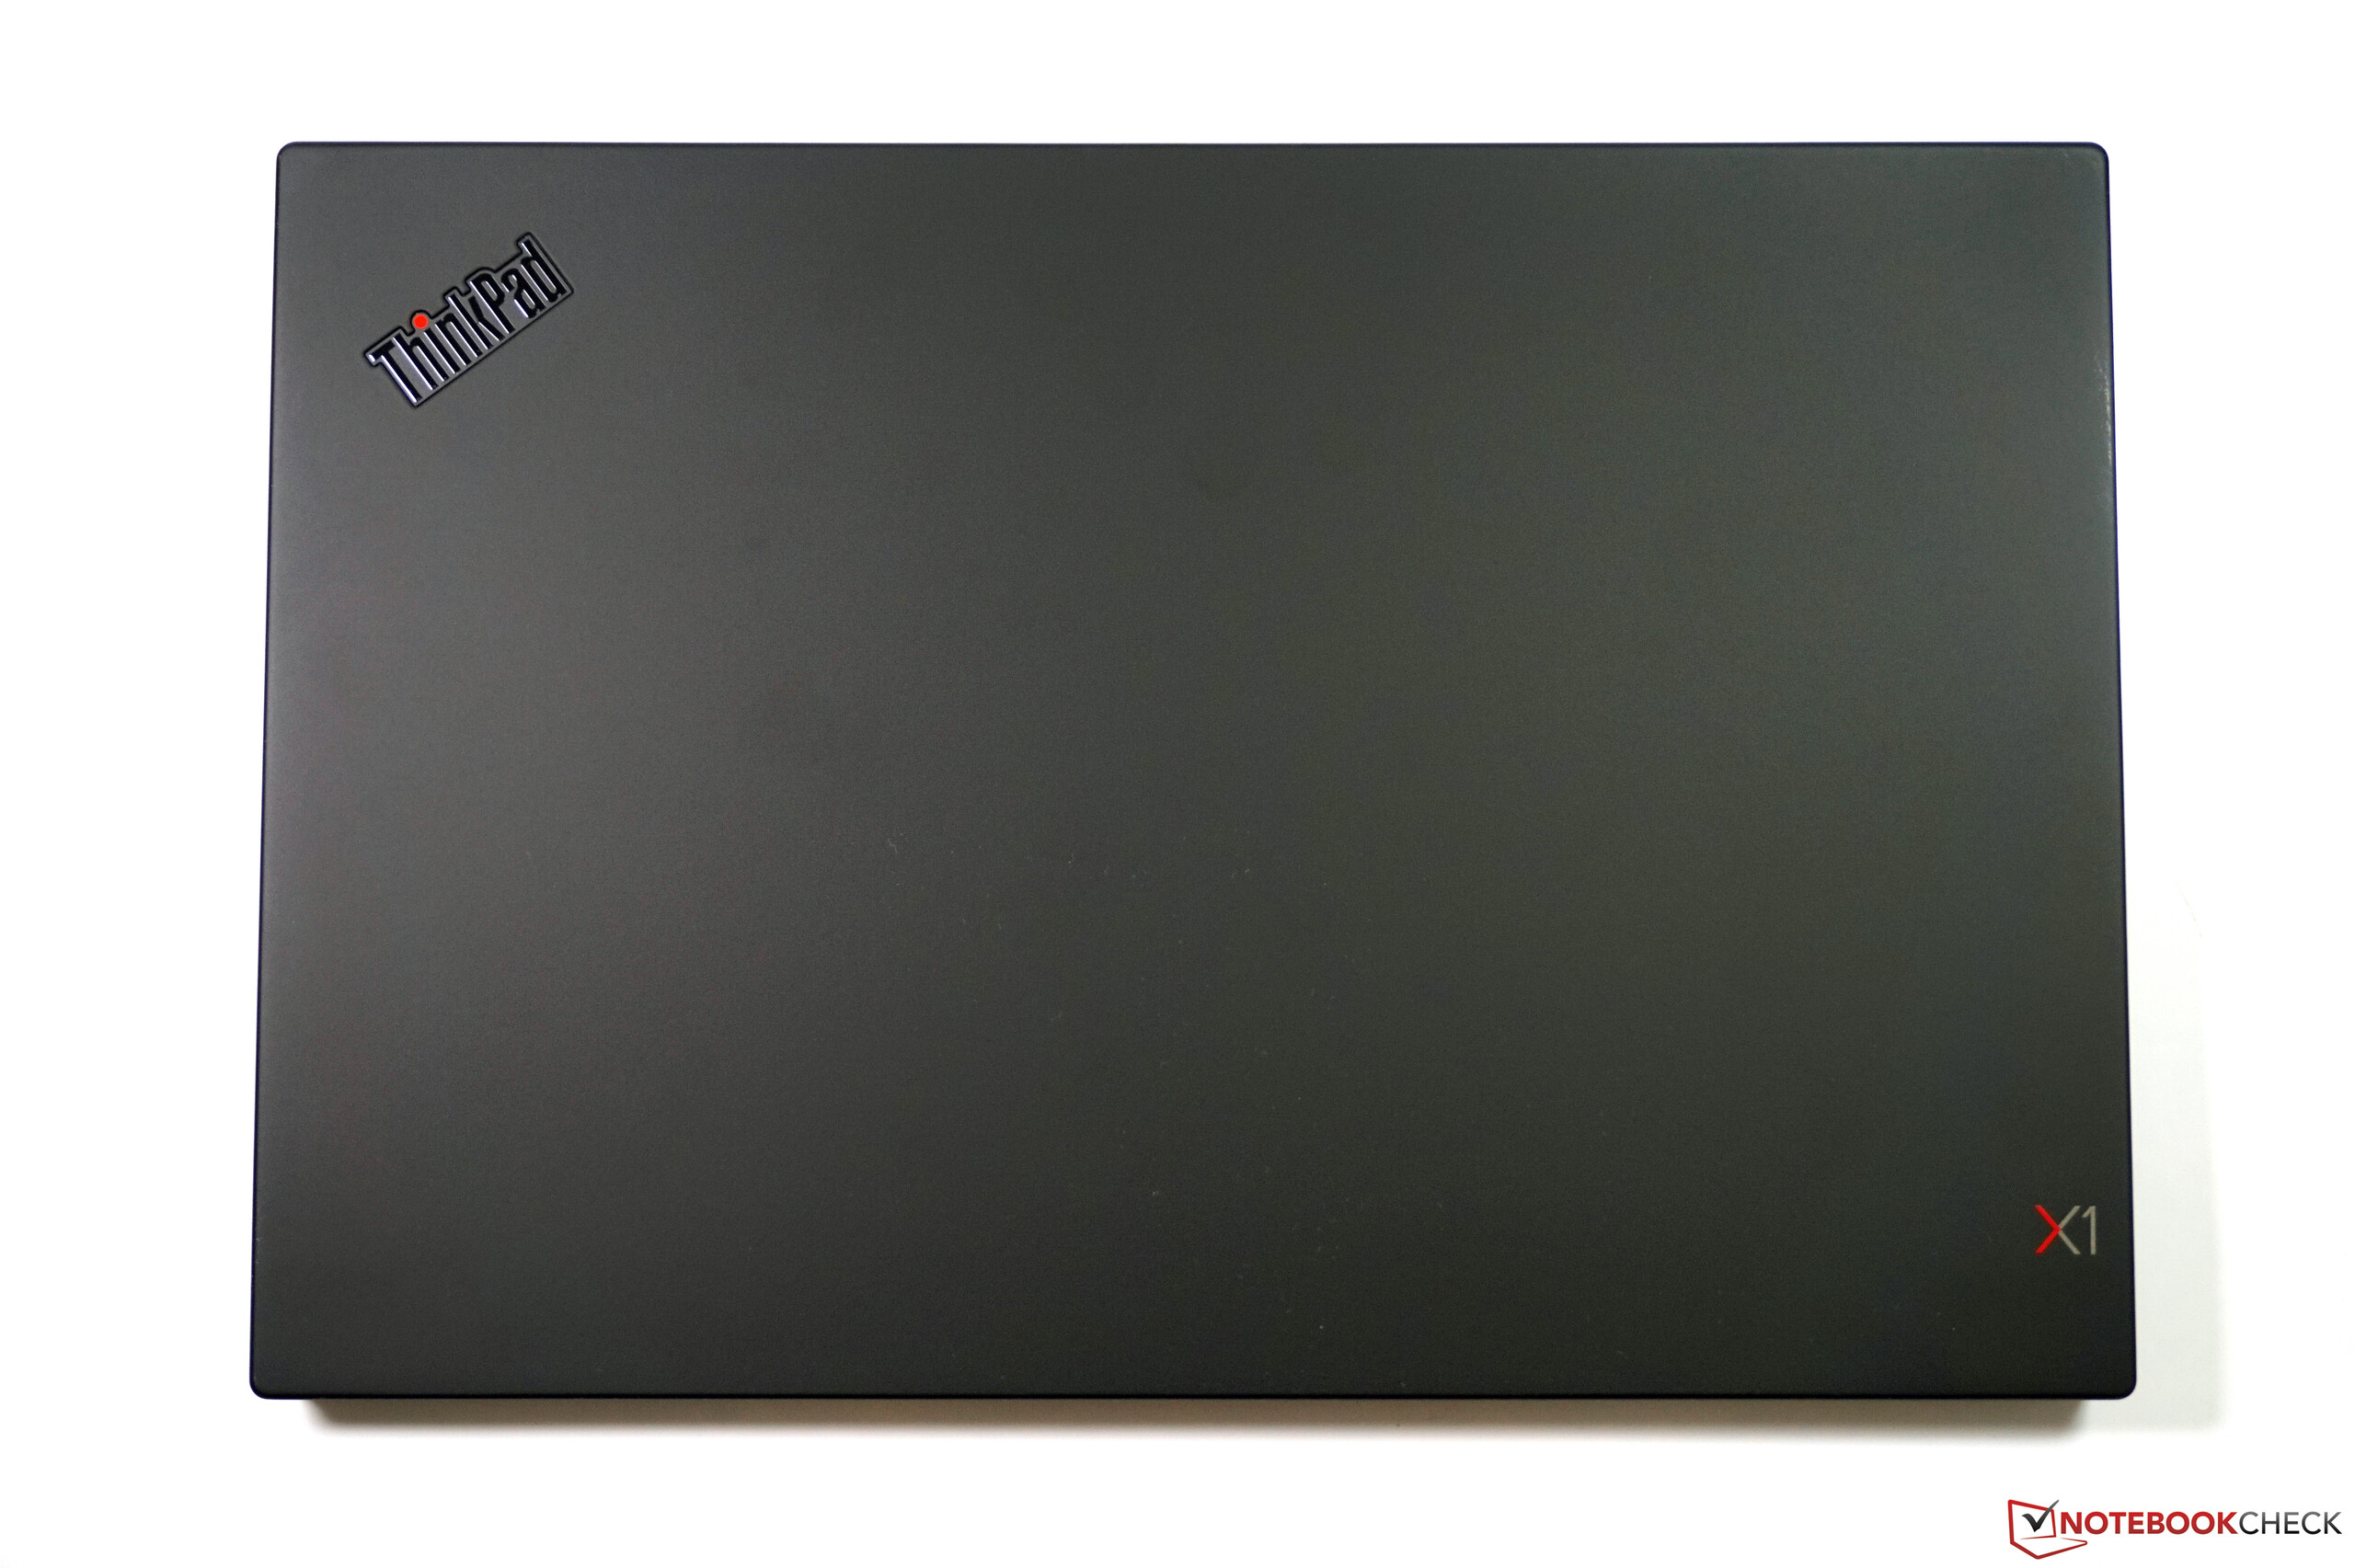
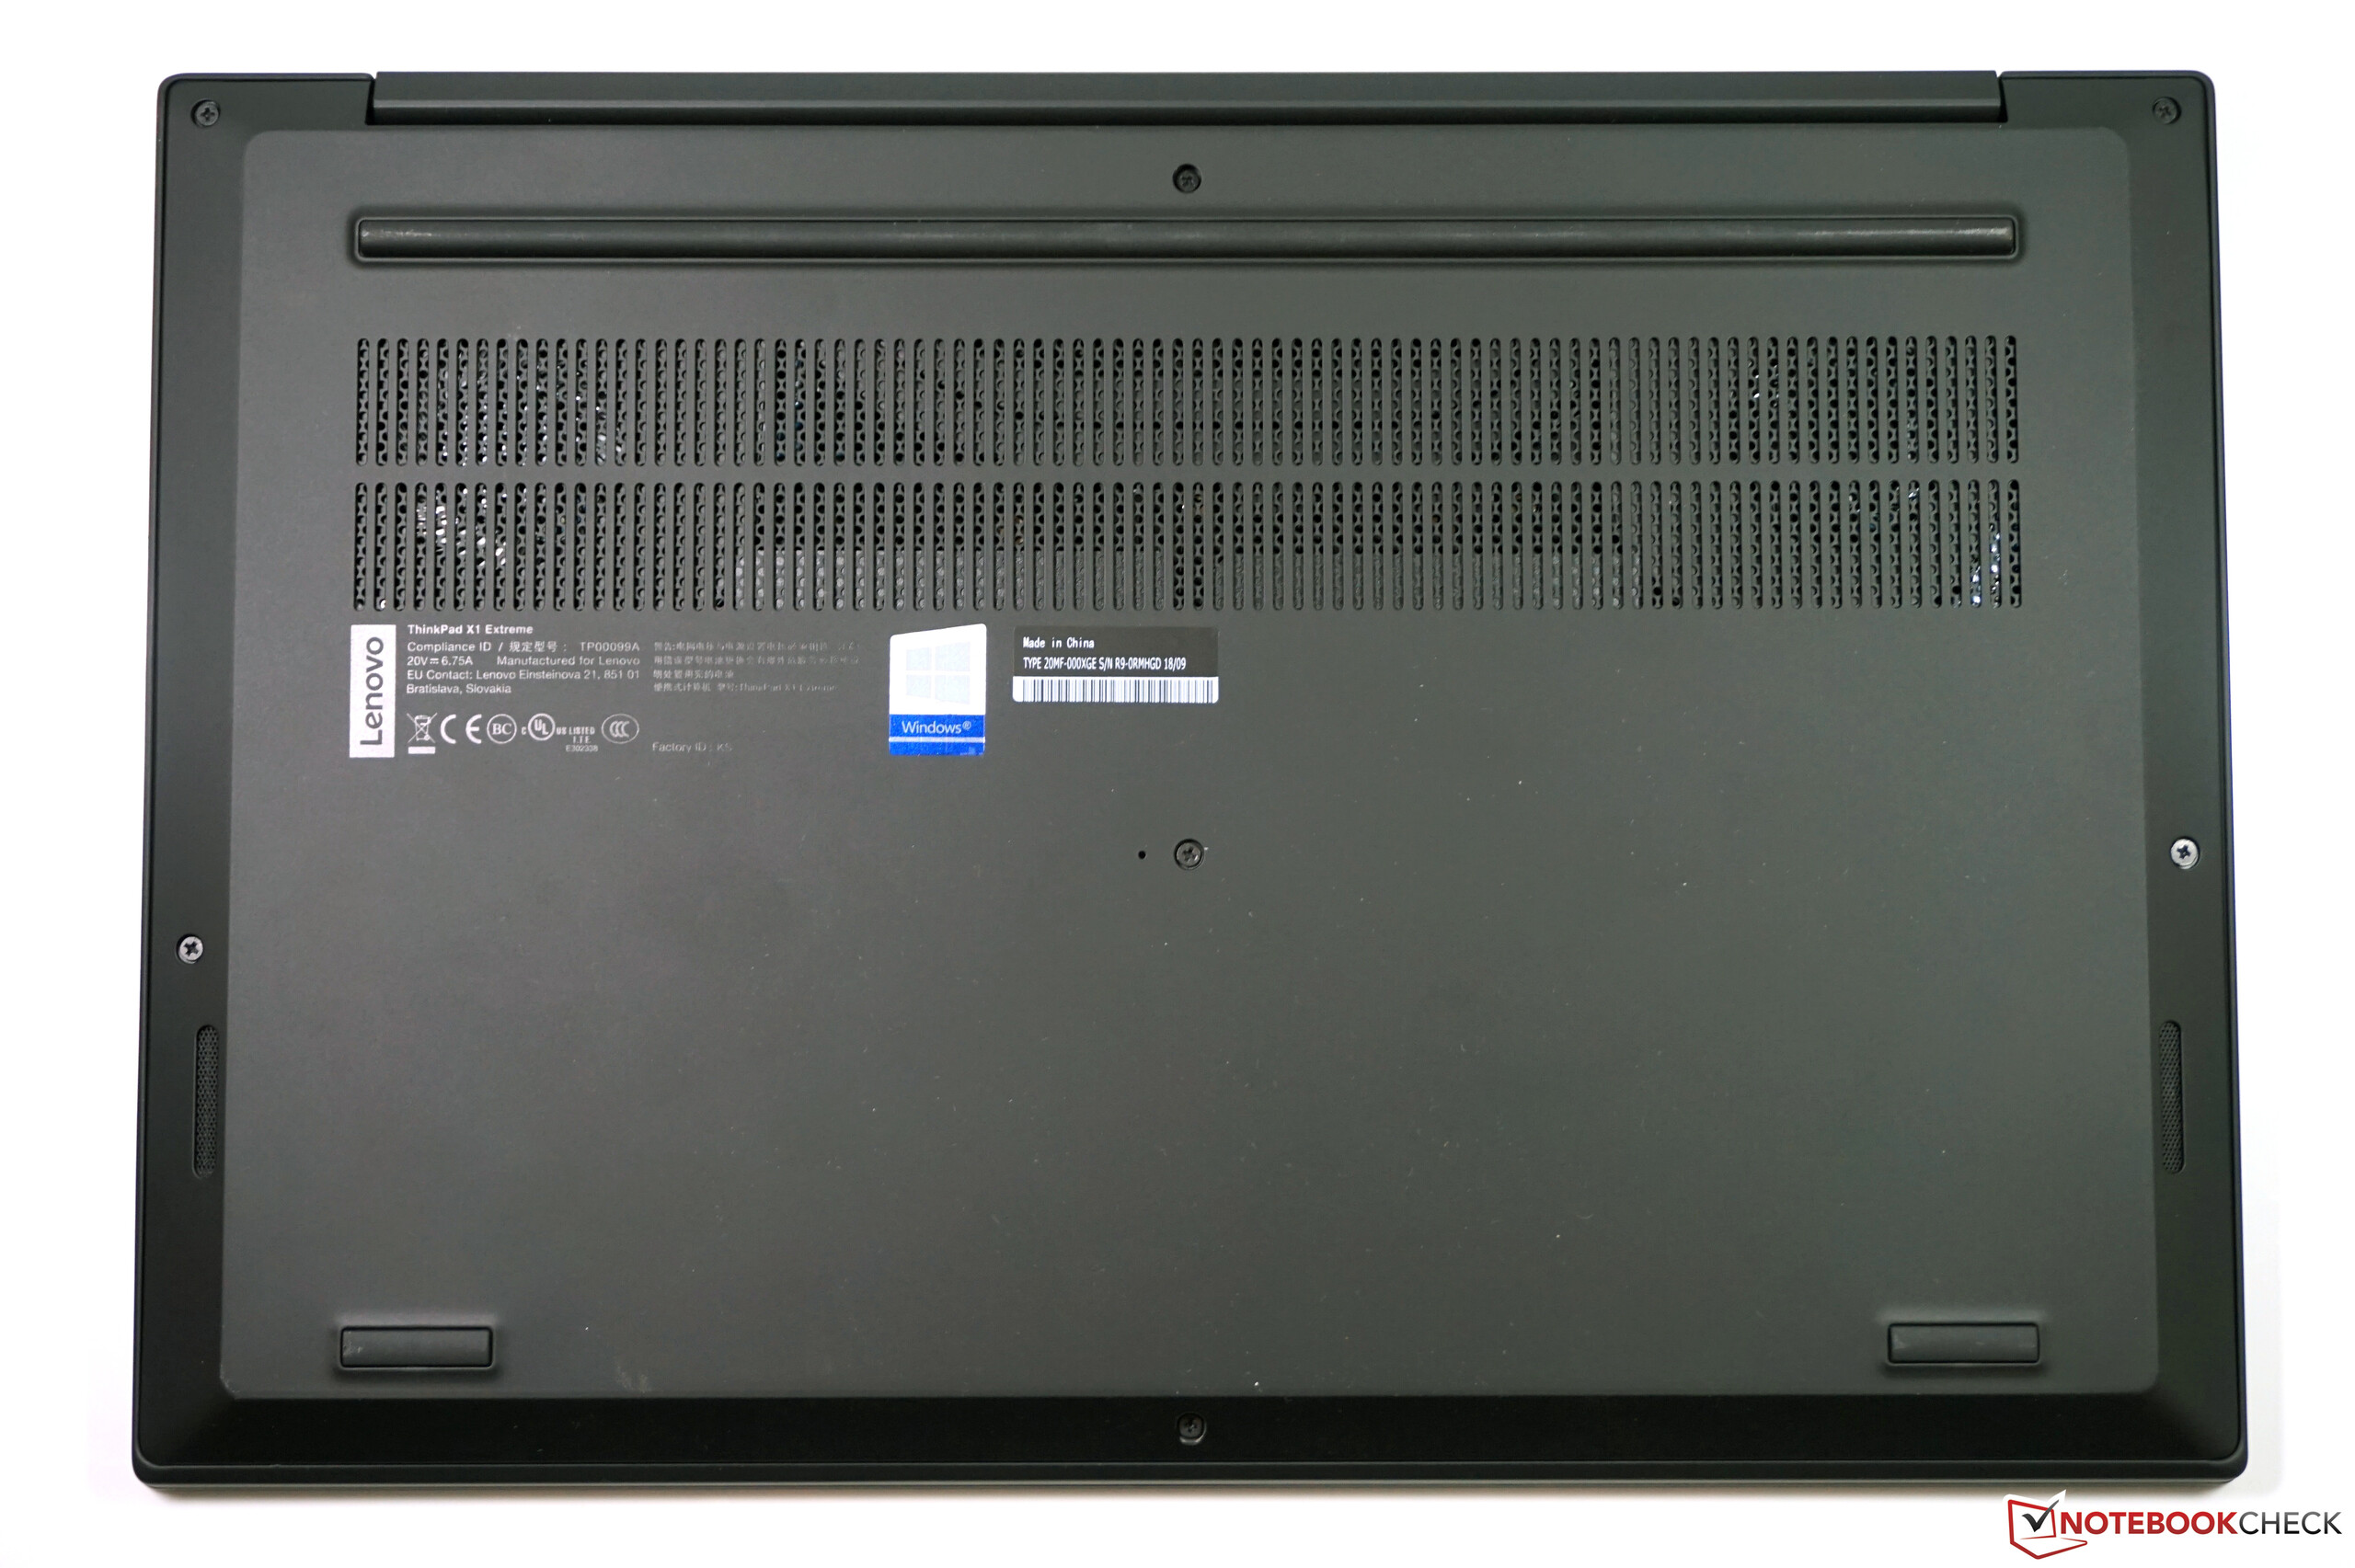
The ThinkPad X1 Extreme will feel very familiar if you already know the current ThinkPad X1 Carbon. The design of the black chassis is also similar to the other current X1-series products with the colored X1 logo on the lid. The whole base unit is made of an aluminum alloy with a fine black surface. The stability is excellent and we can just slightly depress the center of the base unit with a lot of force. However, this should not be an issue even for heavy typists. there is one long support foot in the rear of the base unit as well as two smaller ones at the front, so the case sits very stable on flat surfaces. There is one criticism though: The surfaces attract fingerprints and dirt, which is also a major disadvantage compared to the aluminum case of the Apple MacBook Pro. ThinkPads usually show greasy spots after some usage, which should be the case here as well. The build quality of the base unit, however, is perfect and there are no creaking sounds.
The connection to the display is handled by a black center hinge. It does a decent job, but cannot prevent some bouncing when you adjust the opening angle (up to 180 degrees). Light vibrations on the other hand (like on a train ride) are no problem. The hinge could be firmer at very small angles, where the display will fall down.
We can only talk about the 4K HDR SKU when we talk about the lid. It is equipped with an additional layer of glass, which also increases the weight and the height compared to the 1080p model. We cannot say whether it improves the stability at this point, but the stability of our test unit is excellent. You can even lift the device when you grab it at the corner of the display and it requires a lot of force to provoke picture distortions on the panel. However, there are clearly audible creaking sounds, which affect the good impression a bit. The bezels are slim at the two sides and there is just slightly more room at the top for the cameras. We do not really like the big black bar at the bottom of the panel though, and it looks like a 16:10 panel would have fitted nicely.
Lenovo says the ThinkPad X1 Extreme passed several MIL-STD 810G tests, but does not specify the individual scenarios. The keyboard is also spillwater resistent. All in all, the case appears very sophisticated, only the creaking sounds (under pressure) from the lid do not really fit.
The rivals are close in the size comparison, but there are differences. Both the Dell XPS 15 as well as the Apple MacBook Pro have an even smaller footprint, and the Apple is also a bit lighter. However, the weight of the X1 Extreme is still very good at little more than 1.8 kg since the other rivals are between 200-300 grams heavier. The 1080p SKU of the X1 Extreme is supposed to the a bit lighter, but we have to wait for the test unit to confirm.
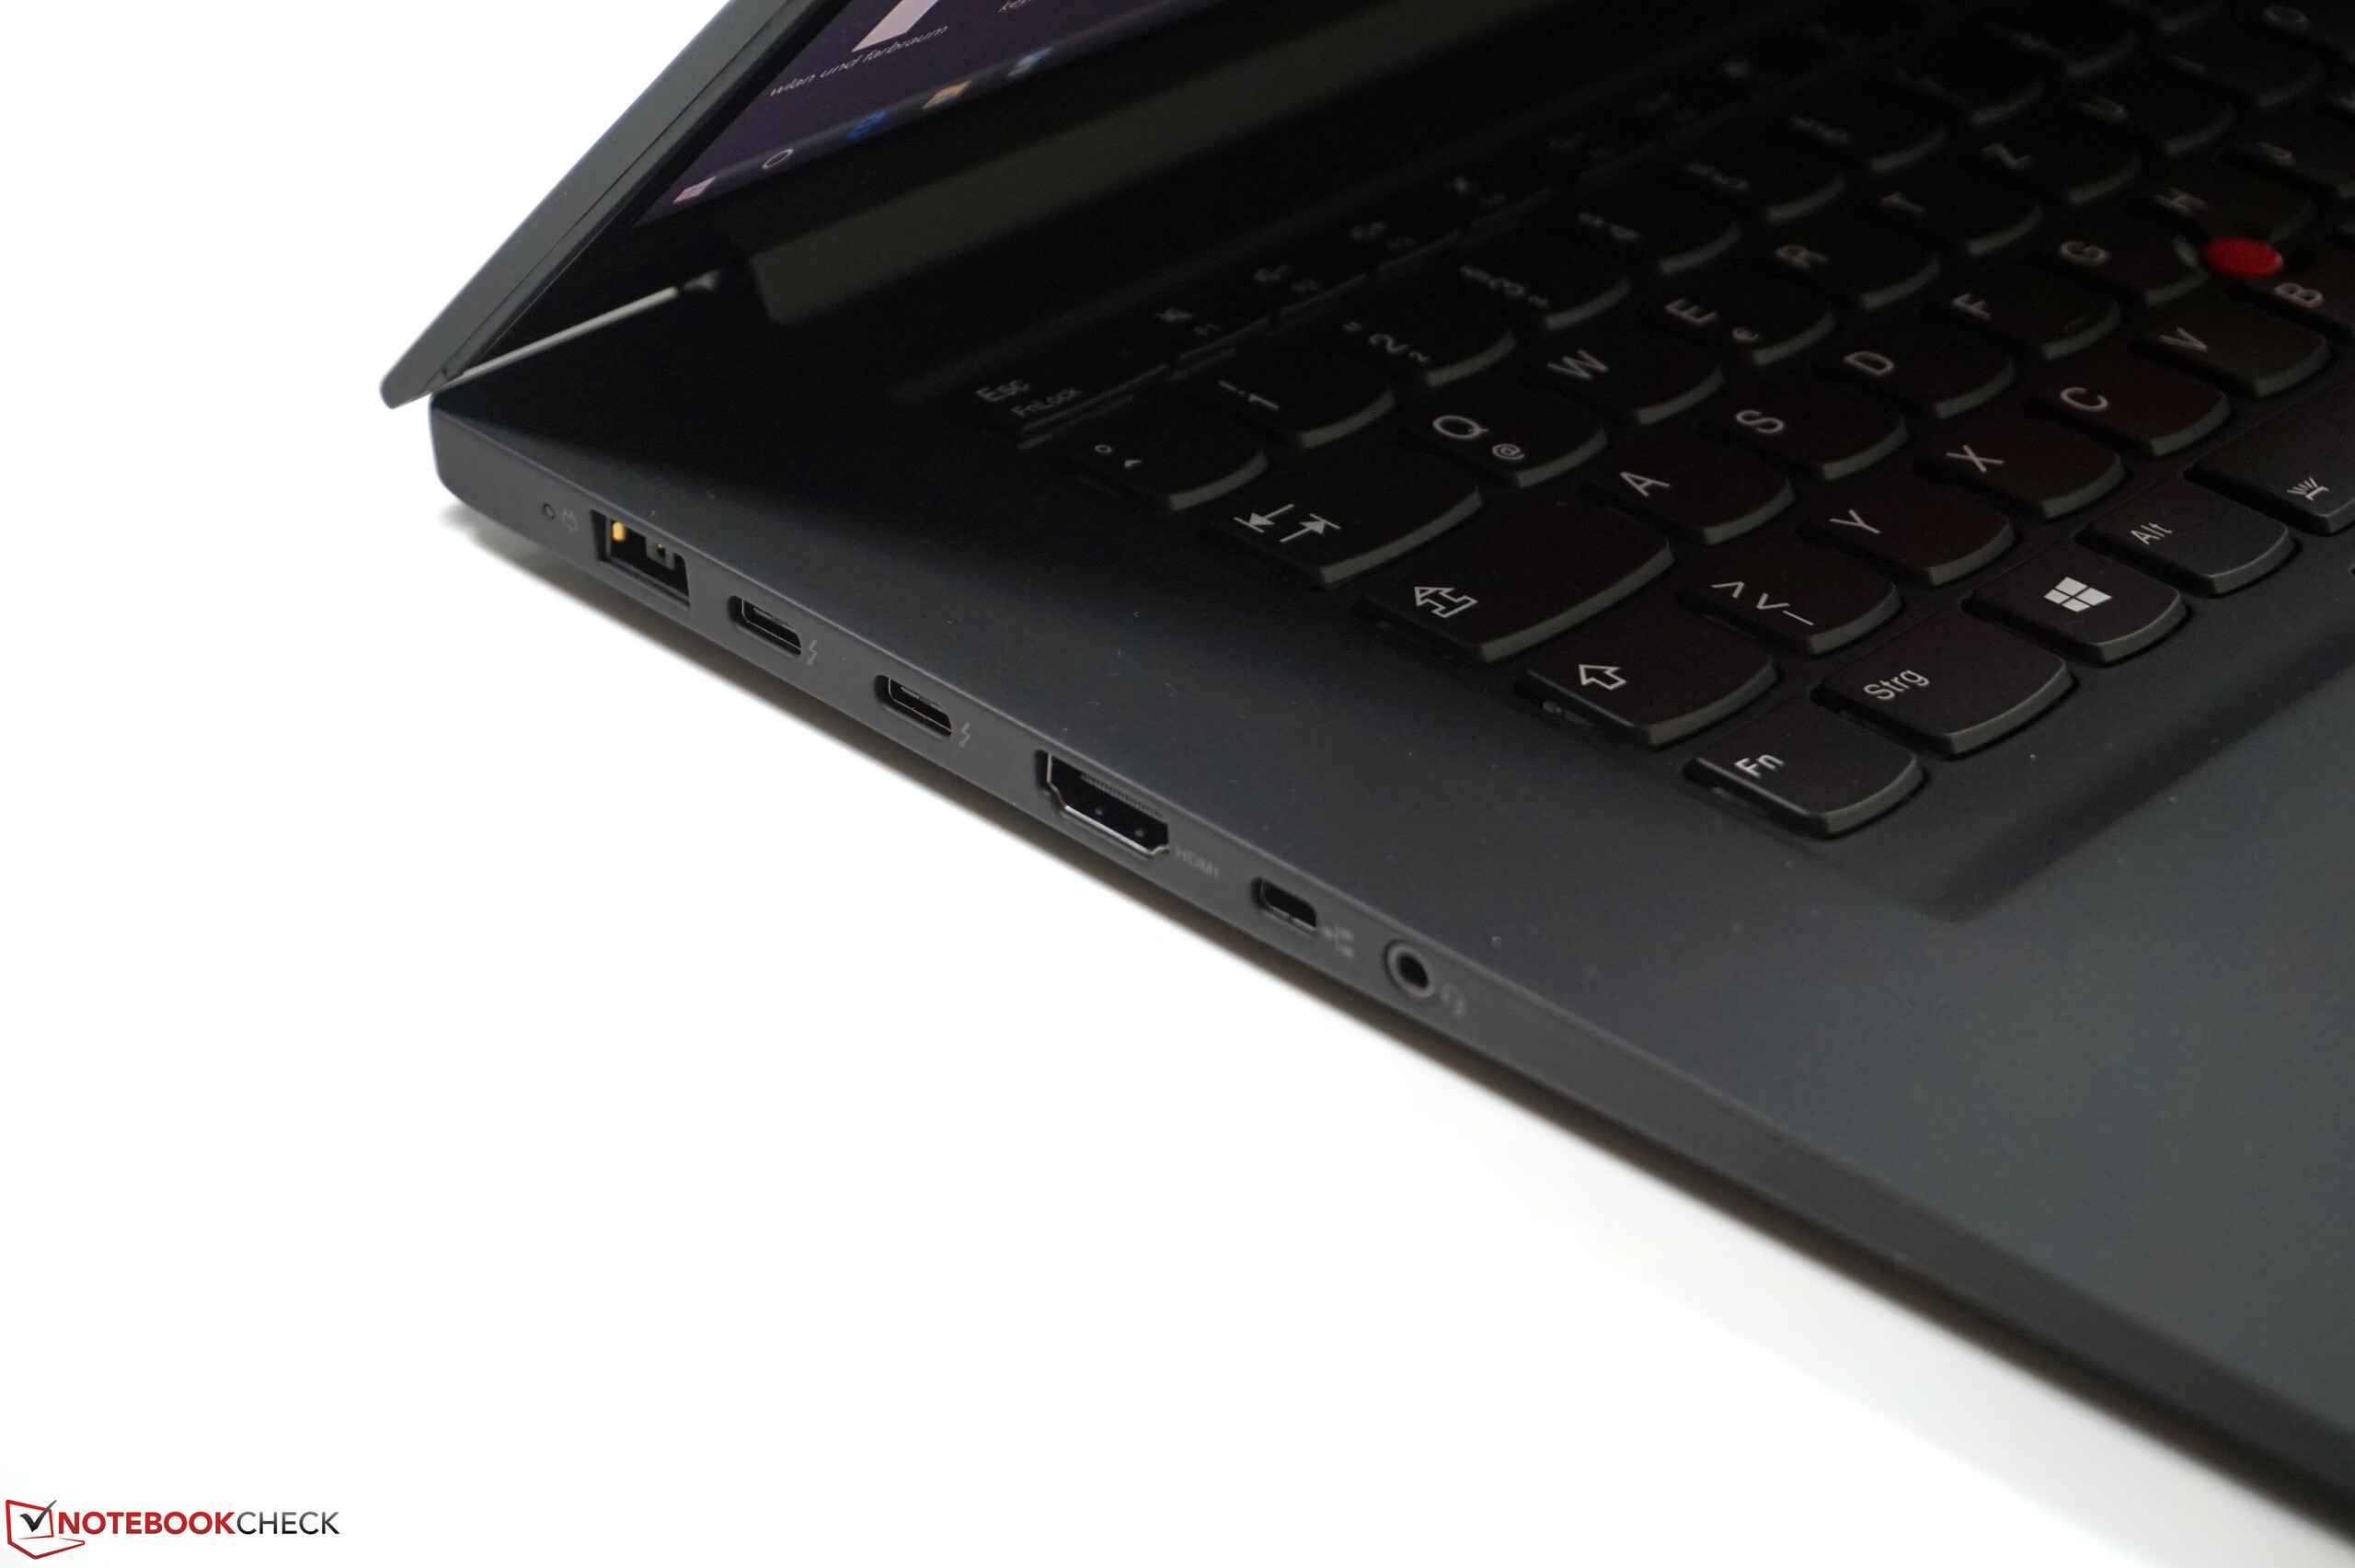
Connectivity - Thunderbolt 3 and regular USB ports
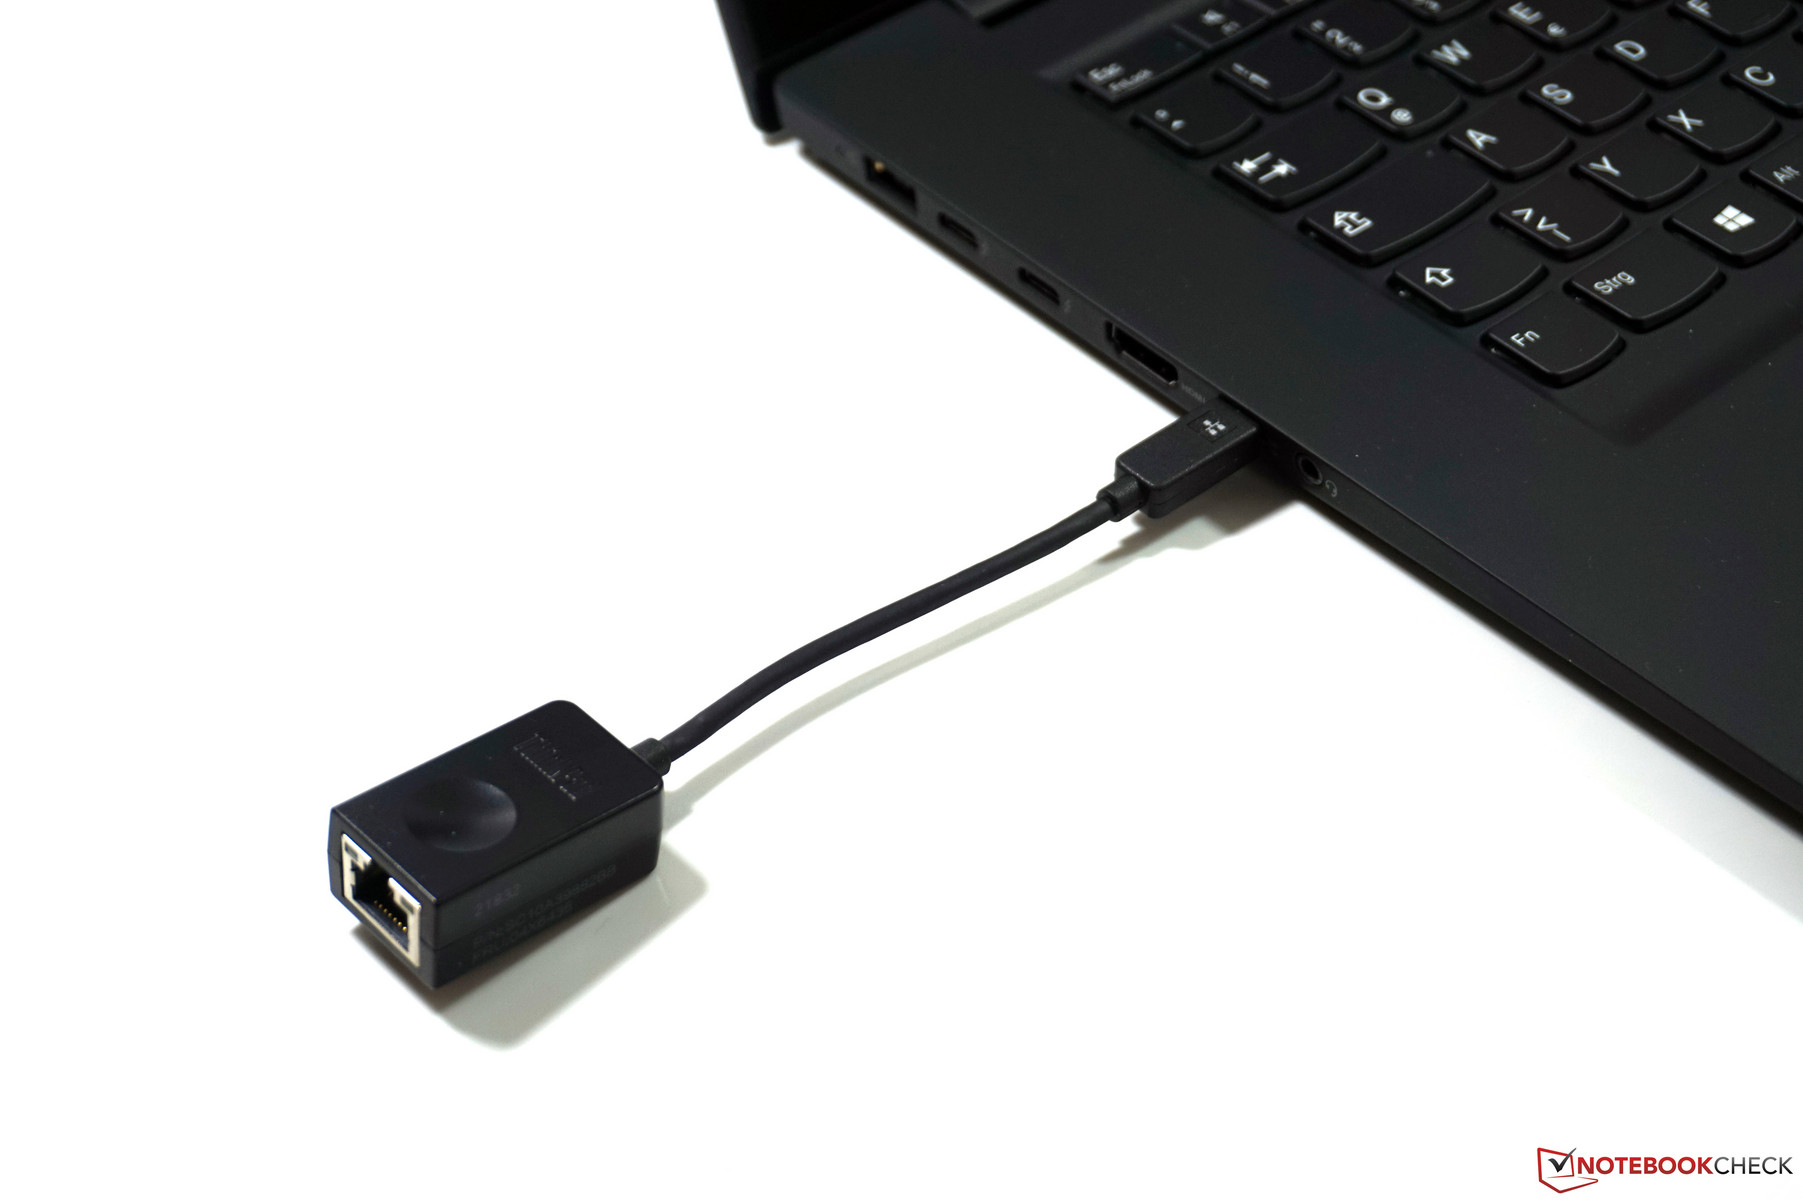
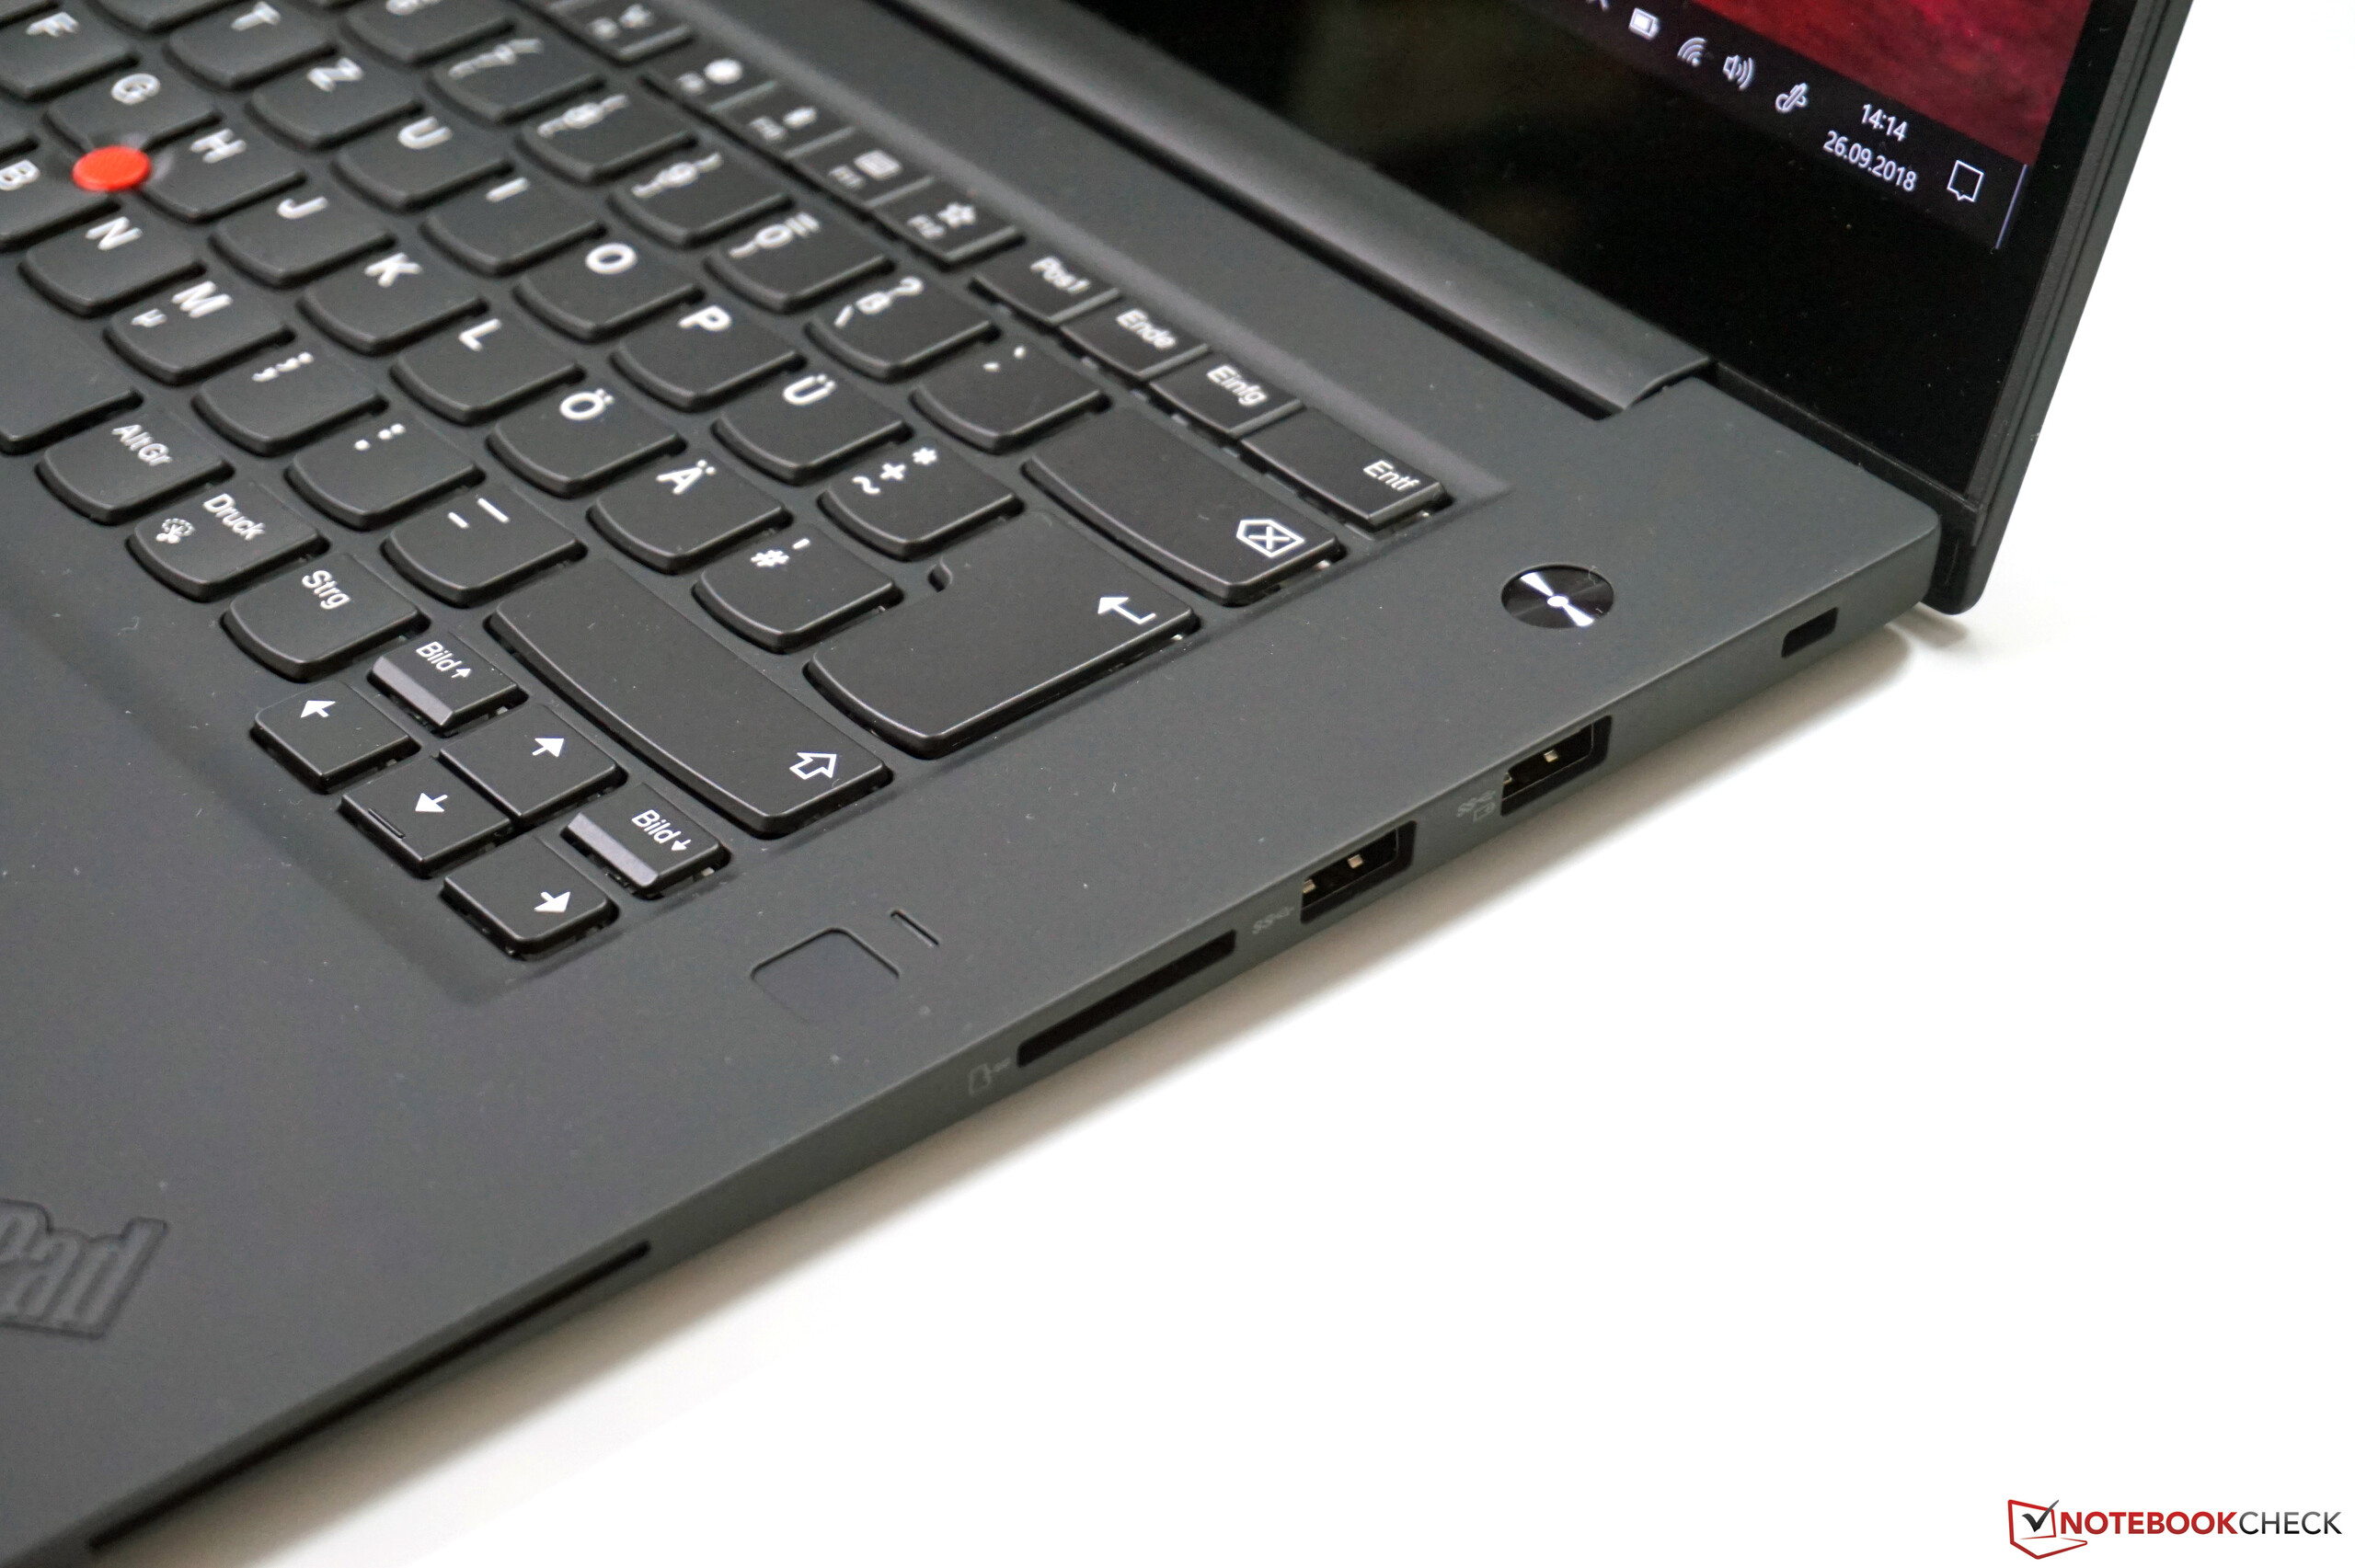
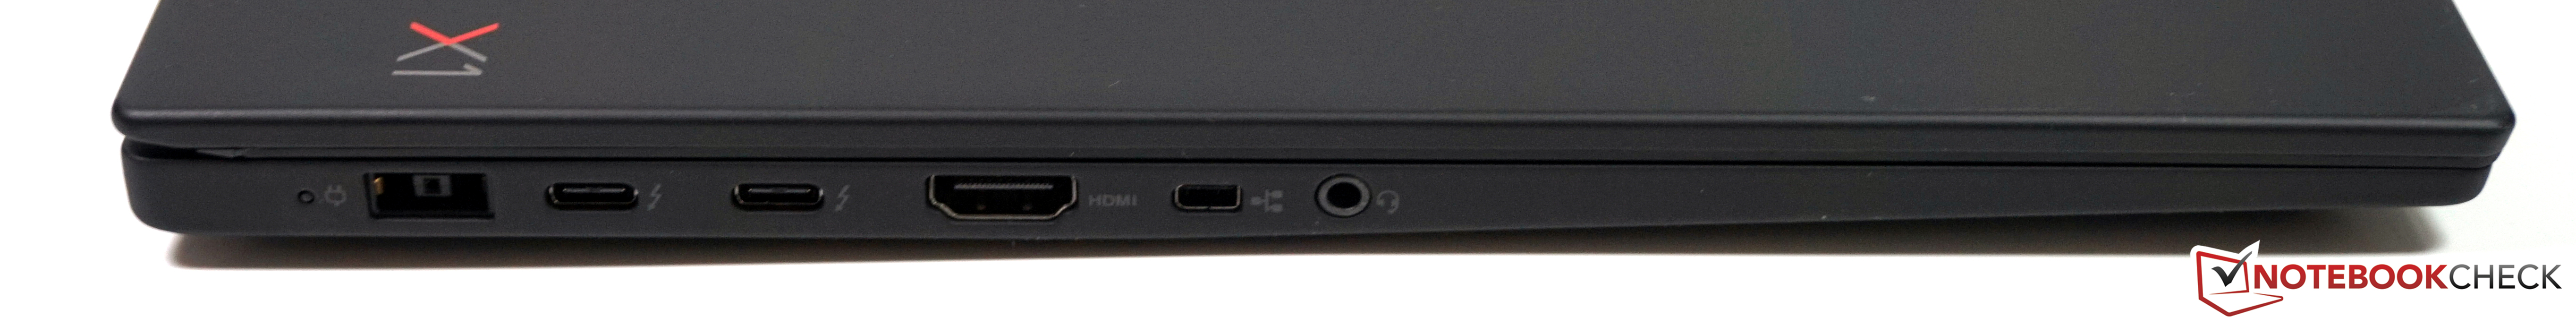
The port selection is very balanced with two full-fledged Thunderbolt 3 ports (USB-C connectors, USB 3.1 Gen.2, DisplayPort) as well as two regular USB-A ports (USB 3.1 Gen.1) and an HDMI 2.0 video output. The ThinkPad X1 Extreme can also be charged via USB-C (up to 100W). You also get a card reader and a small Mini-Ethernet connector if you prefer wired network connections. The necessary adapter (see picture) is included. All in all, the X1 Extreme can drive up to four independent displays (up to 5K@30Hz via TB3, up to 4K@60Hz via HDMI).
The lack of the new docking port is one important difference to many current ThinkPad models. The reason is simple though, because Thunderbolt 3 just cannot provide the required power. This limits the number of docking solutions for the X1 Extreme, but we will have a closer look at this in the Accessories section.
All in all, the ThinkPad X1 Extreme has a good mixture of old and modern ports, and additional adapters should not be necessary for the majority of peripherals.
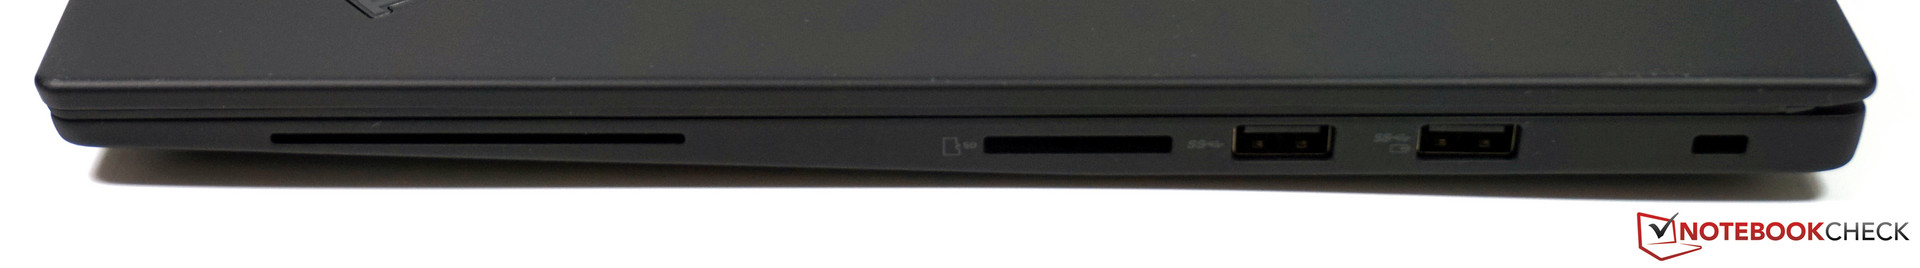
SD Card Reader
Lenovo fortunately includes an SD card reader for full-size SD cards contrary to the smaller sibling ThinkPad X1 Carbon (microSD). It is spring-loaded and takes the full card. The two X1 models are at the top of the ranking in terms of transfer speeds. We determine more than 240 MB/s in combination with our reference card from Toshiba (Exceria Pro UHS-II 64 GB). This is a great result and you won't need an external USB 3.0 card reader when you copy large amounts of data on a regular basis.
| SD Card Reader | |
| average JPG Copy Test (av. of 3 runs) | |
| Lenovo ThinkPad X1 Carbon 2018-20KGS03900 (Toshiba Exceria Pro M501) | |
| Lenovo ThinkPad X1 Extreme-20MF000XGE (Toshiba Exceria Pro SDXC 64 GB UHS-II) | |
| Dell XPS 15 9570 i7 UHD (Toshiba Exceria Pro SDXC 64 GB UHS-II) | |
| HP EliteBook 1050 G1-4QY20EA (Toshiba Exceria Pro SDXC 64 GB UHS-II) | |
| Average of class Multimedia (21.1 - 198, n=41, last 2 years) | |
| Lenovo ThinkPad T580-20LAS01H00 (Toshiba Exceria Pro SDXC 64 GB UHS-II) | |
| maximum AS SSD Seq Read Test (1GB) | |
| Lenovo ThinkPad X1 Extreme-20MF000XGE (Toshiba Exceria Pro SDXC 64 GB UHS-II) | |
| Lenovo ThinkPad X1 Carbon 2018-20KGS03900 (Toshiba Exceria Pro M501) | |
| HP EliteBook 1050 G1-4QY20EA (Toshiba Exceria Pro SDXC 64 GB UHS-II) | |
| Dell XPS 15 9570 i7 UHD (Toshiba Exceria Pro SDXC 64 GB UHS-II) | |
| Average of class Multimedia (27.4 - 262, n=41, last 2 years) | |
| Lenovo ThinkPad T580-20LAS01H00 (Toshiba Exceria Pro SDXC 64 GB UHS-II) | |
Communication
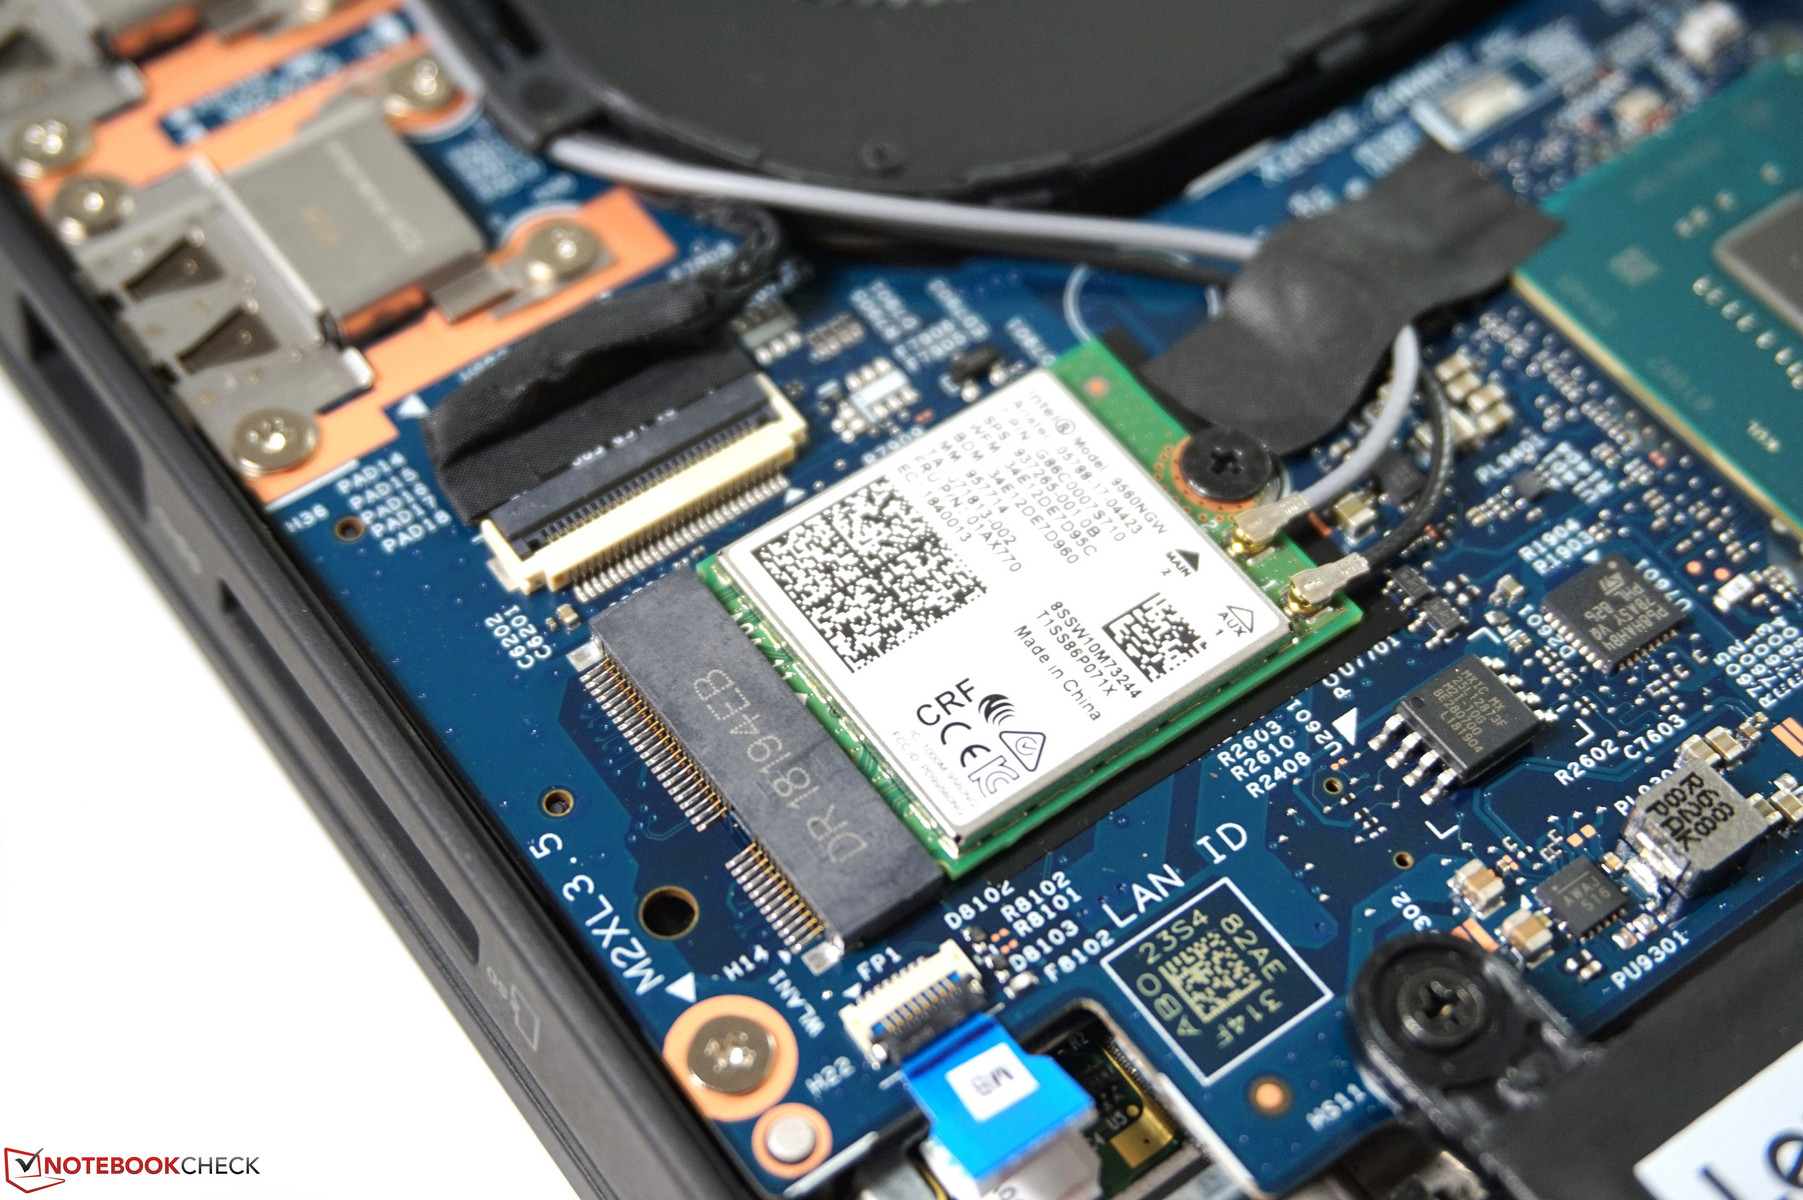
Lenovo only ships the ThinkPad x1 Extreme with the new Intel WLAN module Wireless-AC 9560. It supports all common Wi-Fi standards and finally Bluetooth 5.0. We did not have any problems with the wireless network connection and the transfer rates are also very good. The sending performance was improved compared to the previous Wireless-AC 8265. Wired networks are handled by an Intel I219-V or I219-LM module (vPro SKUs), respectively.
We cannot understand why Lenovo drops a WWAN module for the X1 Extreme. Potential buyers of the smaller X1 Carbon already had to decide pre purchase for or against an LTE modem, because it was not upgradeable. It just makes no sense to waive the option for a flagship business laptop.
Security
The ThinkPad X1 Extreme is equipped with all the security features you know from the business series. This includes TPM 2.0, fingerprint scanner (touch), Kensington Lock and several passwords (boot, BIOS, Windows). Some models have a SmartCard reader, which improves the integration into business environments. You also get an IR camera, which allows the Windows access via Windows Hello. However, SKU equipped with the IR cam do not get the mechanical ThinkShutter camera cover, which is only available in combination with the regular 720p webcam. You can choose between them with the matte 1080p screen, but the 4K option requires the IR cam.
Accessories
We already mentioned the lack of the SideDock connector on the X1 Extreme, so most of Lenovo's docking stations are not compatible with the new X1 Extreme. You will wither have to get USB port replicators or Lenovo's Thunderbolt 3 Workstation Dock. The latter has a combined connector (SlimTip + TB3), so one cable is still sufficient for the connection. However, the model is not that cheap at 350 Euros. Lenovo's ThinkPad Pen is another interesting accessory. We will have a look at it in the section Input Devices.
Maintenance
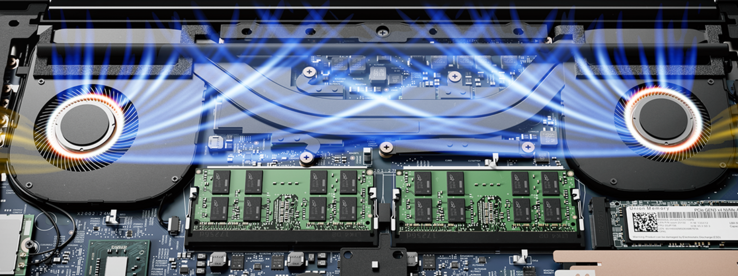
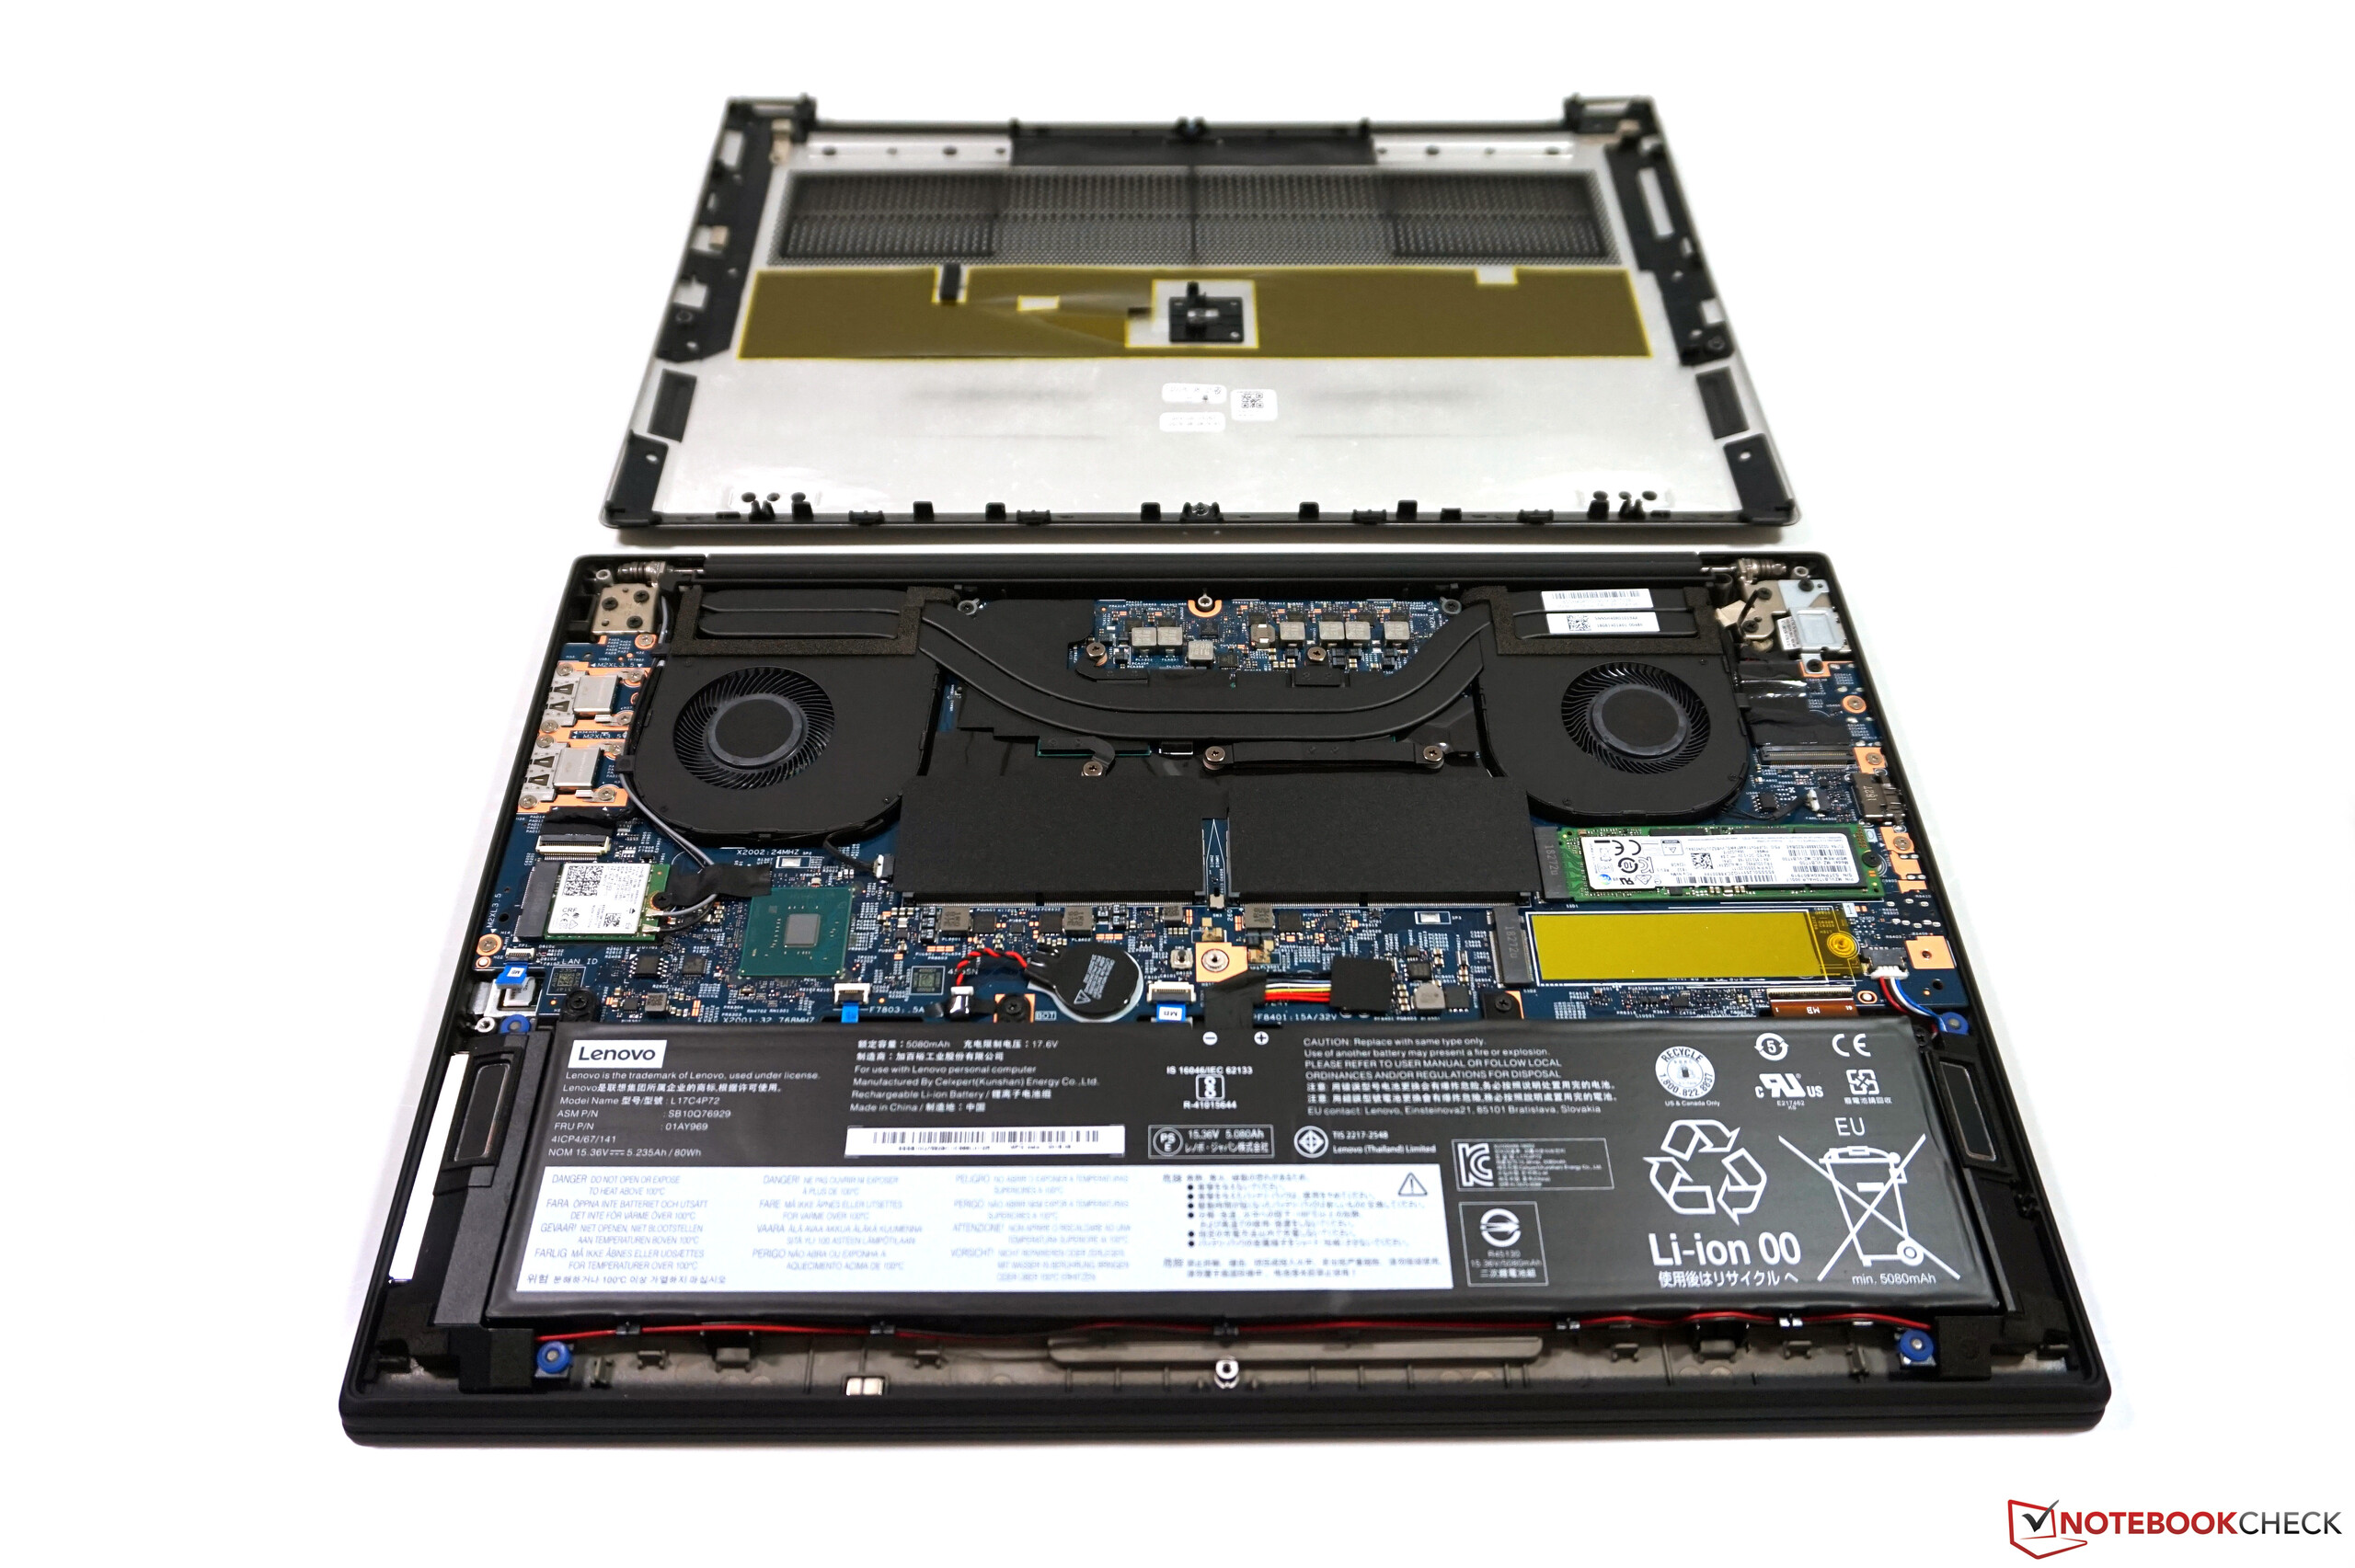
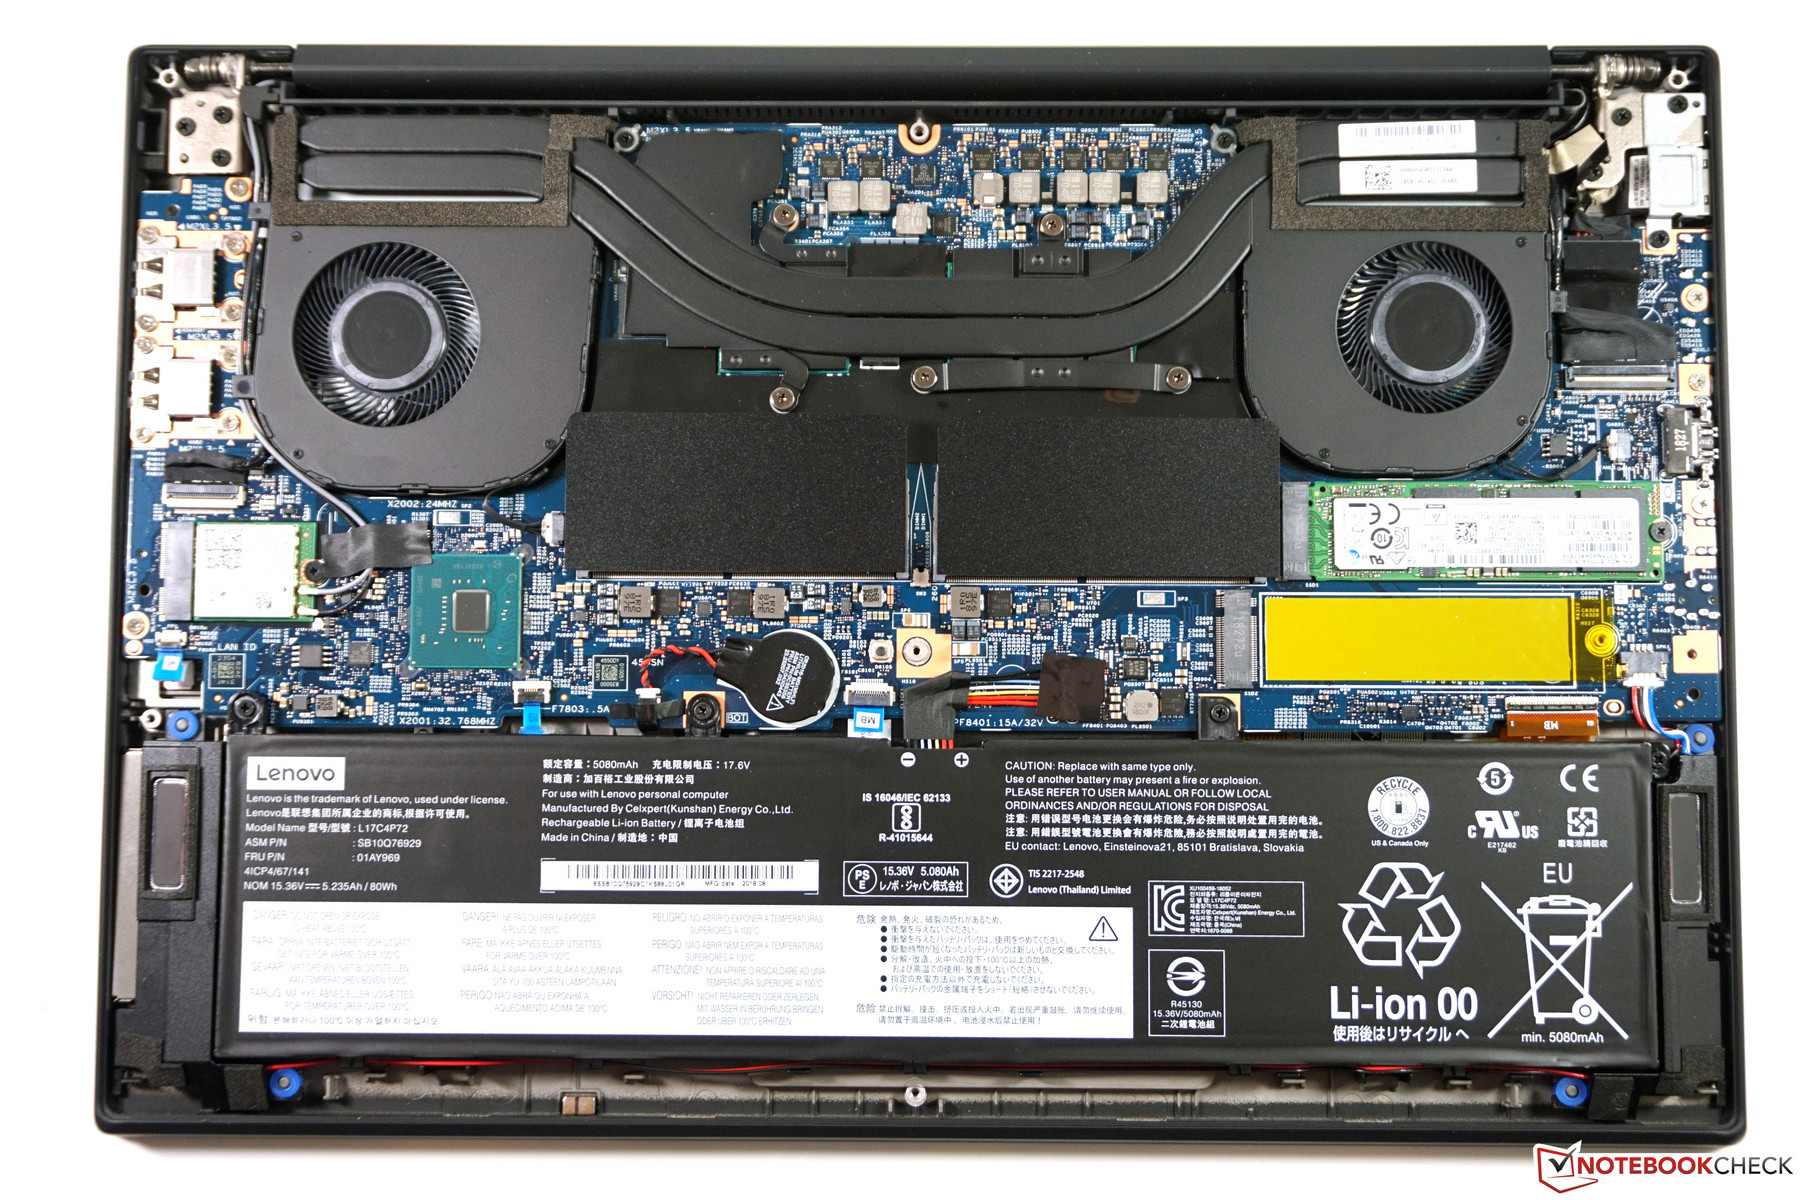
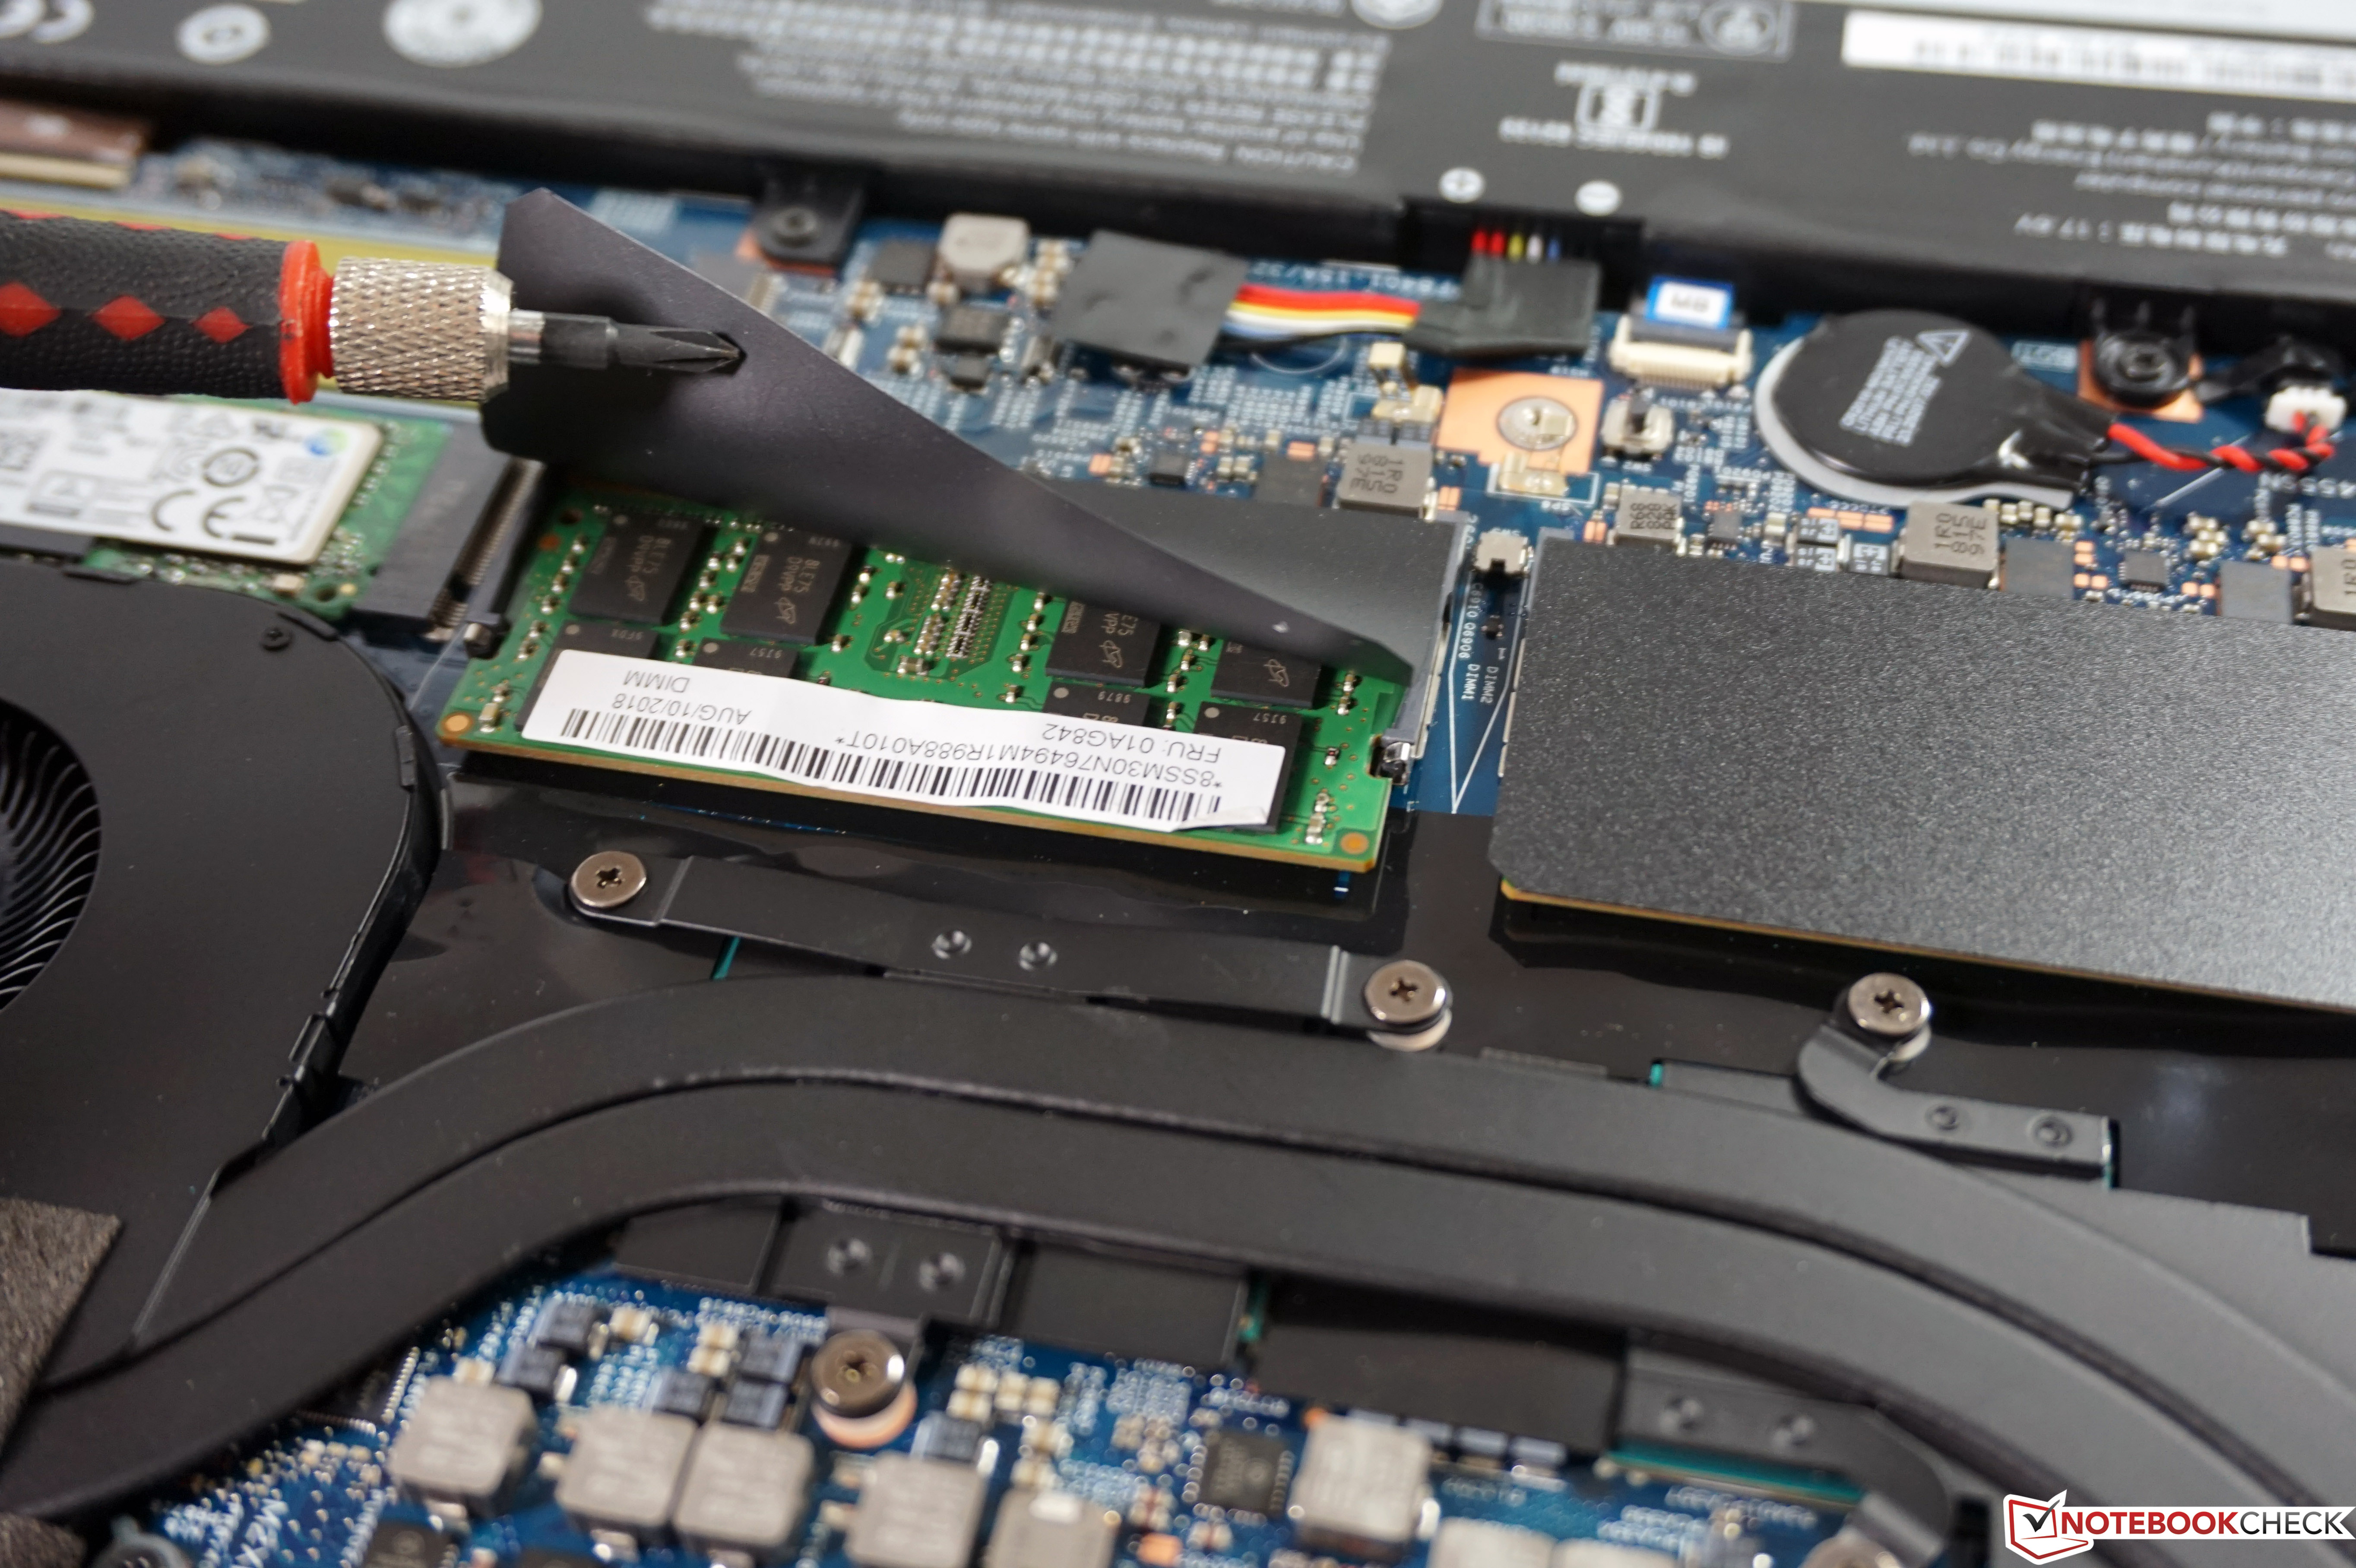
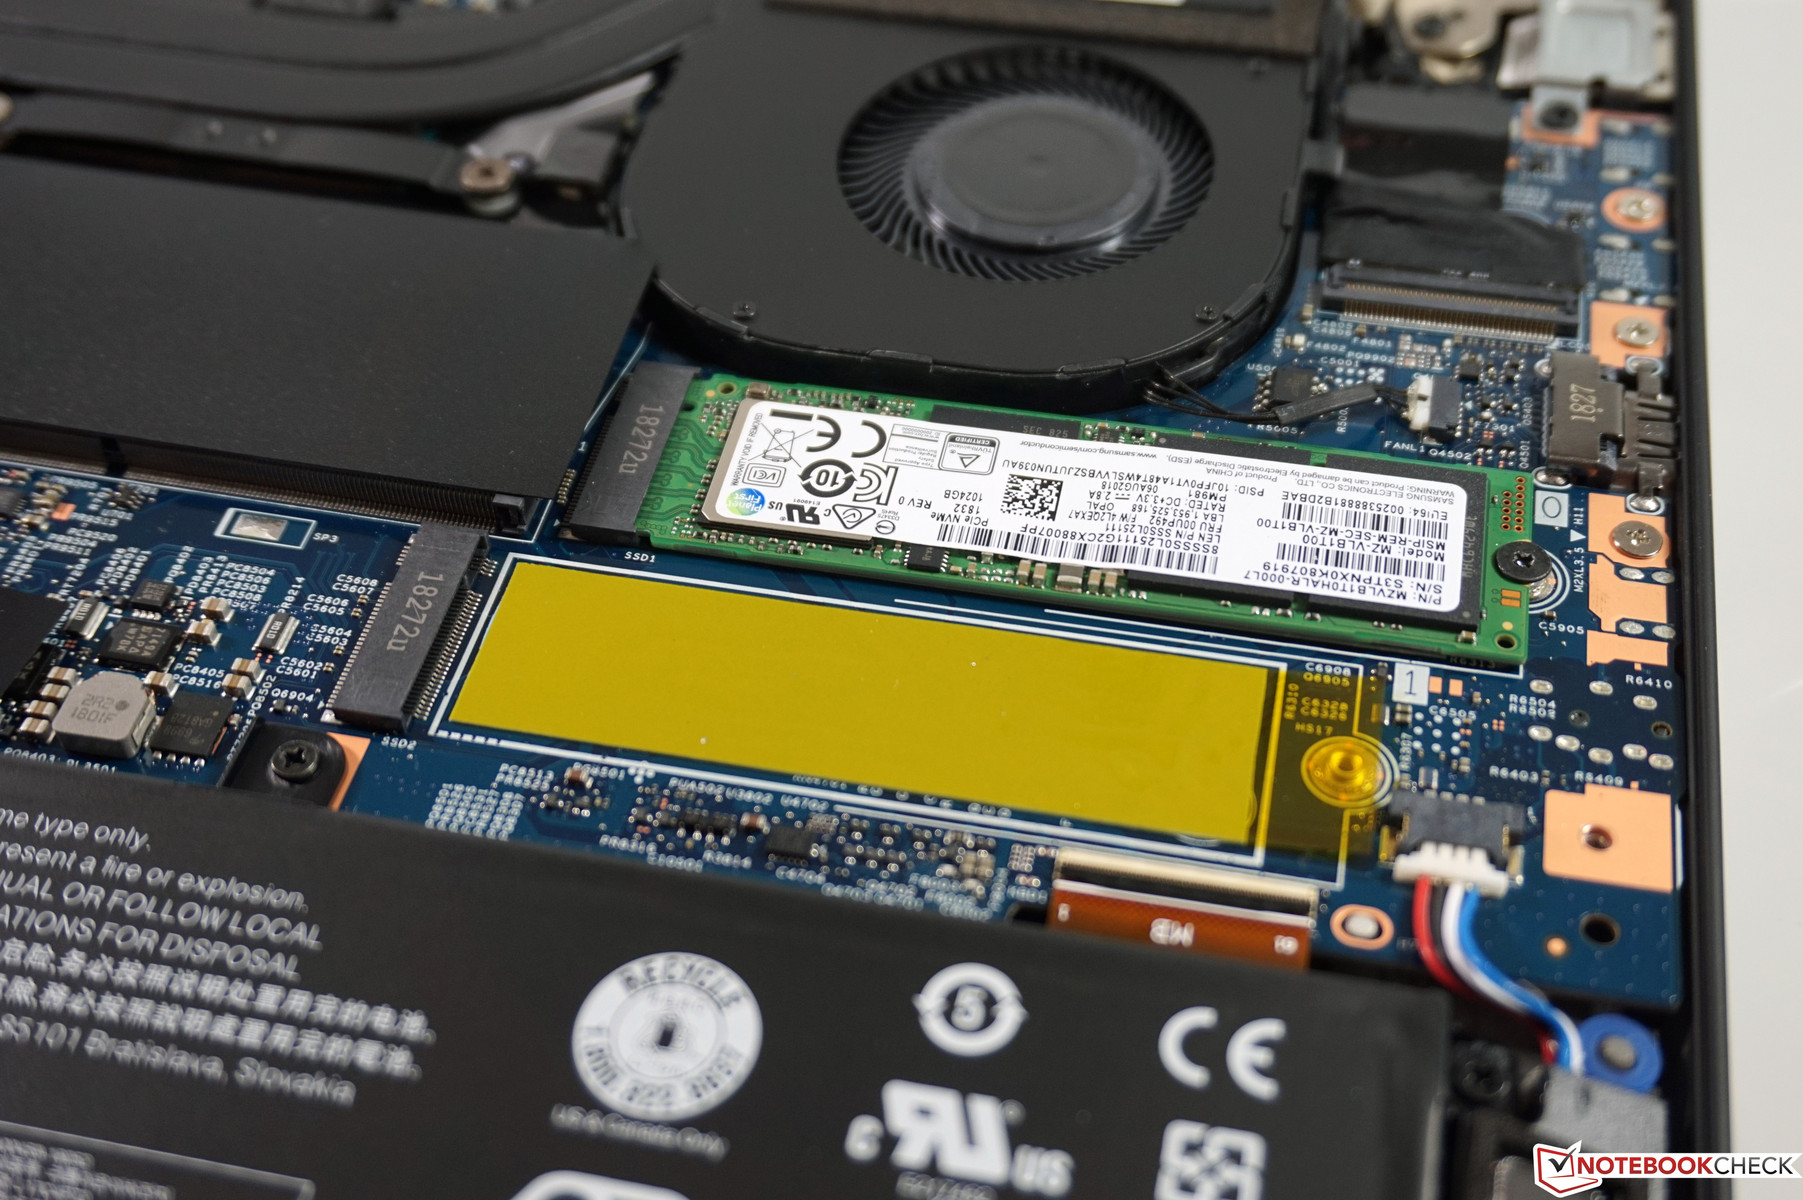
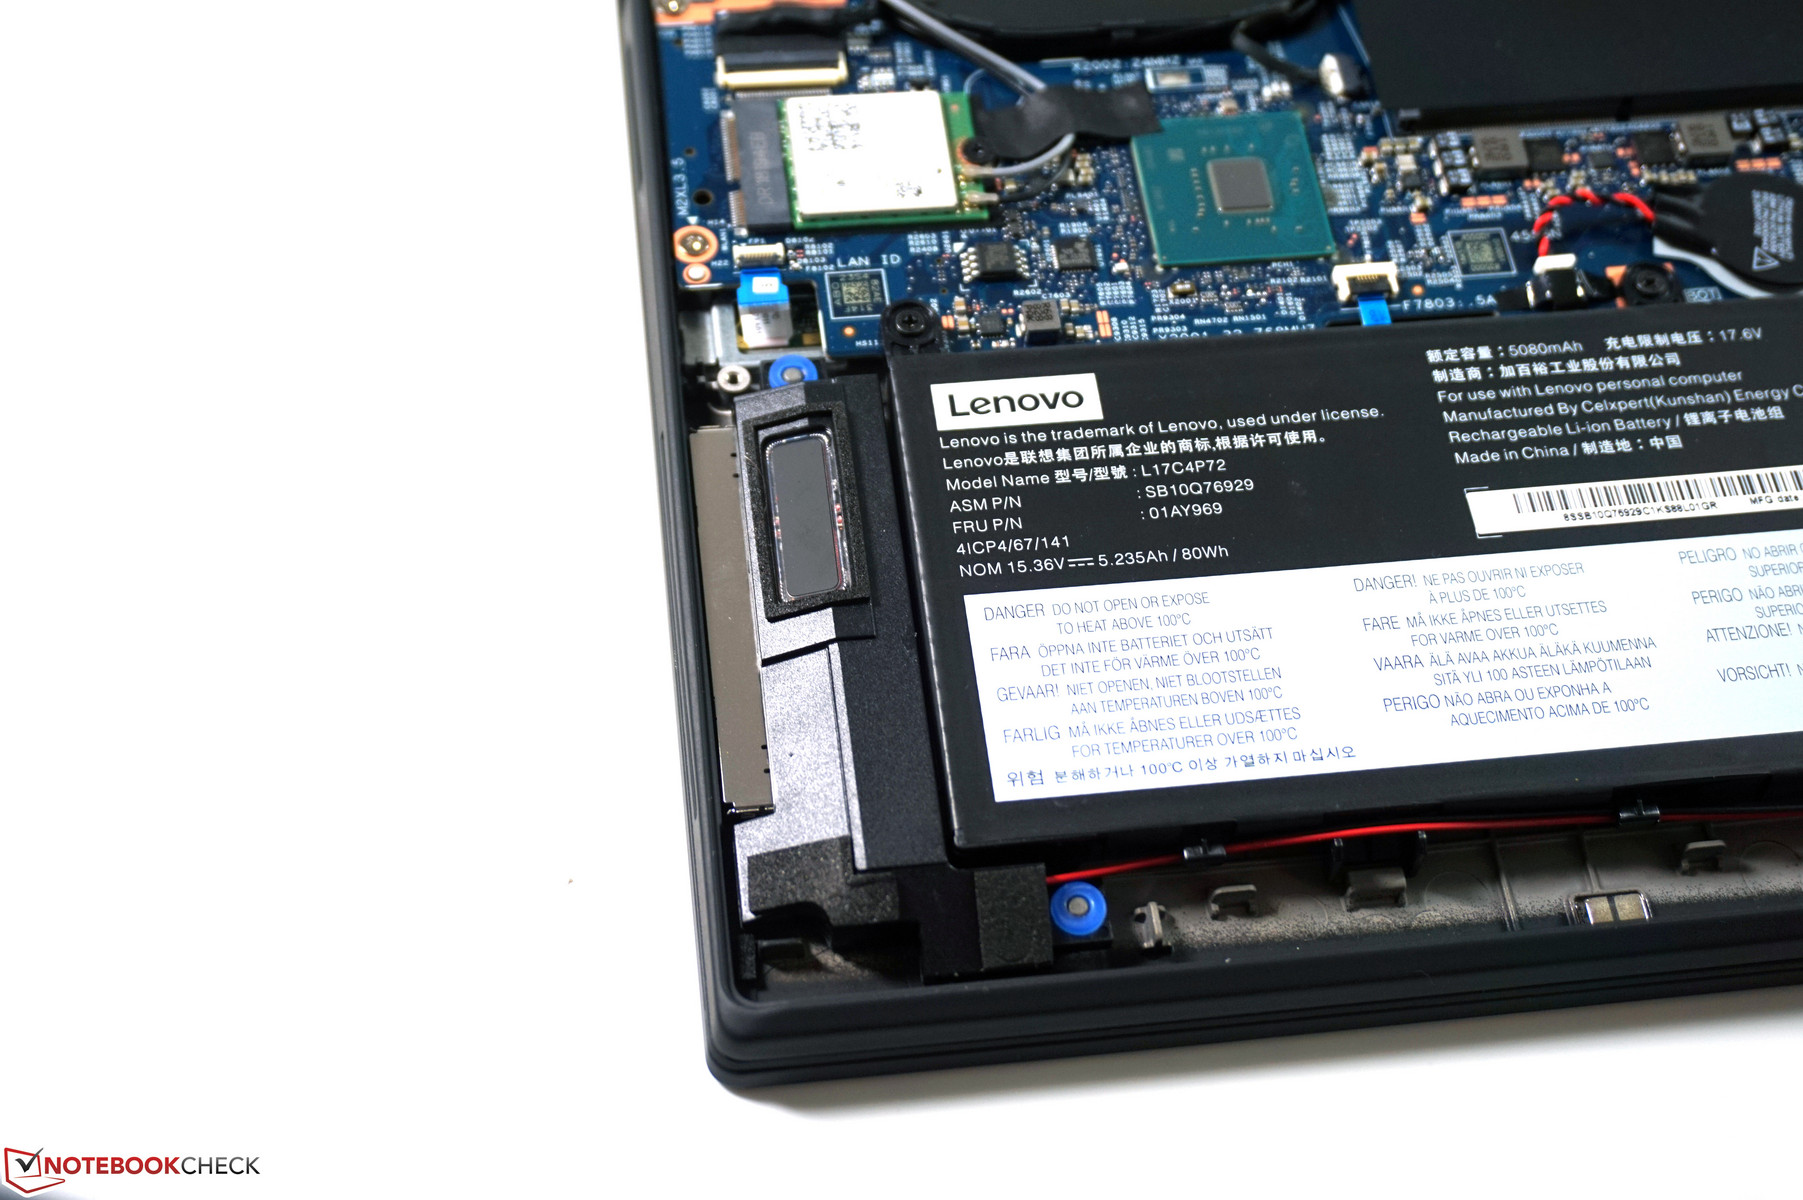
The ThinkPad X1 Extreme does not have a maintenance hatch, but you can easily remove the bottom cover. Lenovo only uses seven regular Philips screws you only have to loosen (not remove!). Then you can lift the rear end of the bottom cover and remove it. Once inside you will find two RAM slots and two slots for M.2-2280 SSDs, which makes upgrades very easy.
Warranty
Lenovo ships the ThinkPad x1 Extreme with a three-year on-site service by default in Germany. It can be extended up to five years and combined with other services like premier phone support, damage protection, battery replacement, keep your drive, and an international service. Please see our Guarantees, Return policies and Warranties FAQ for country-specific information.
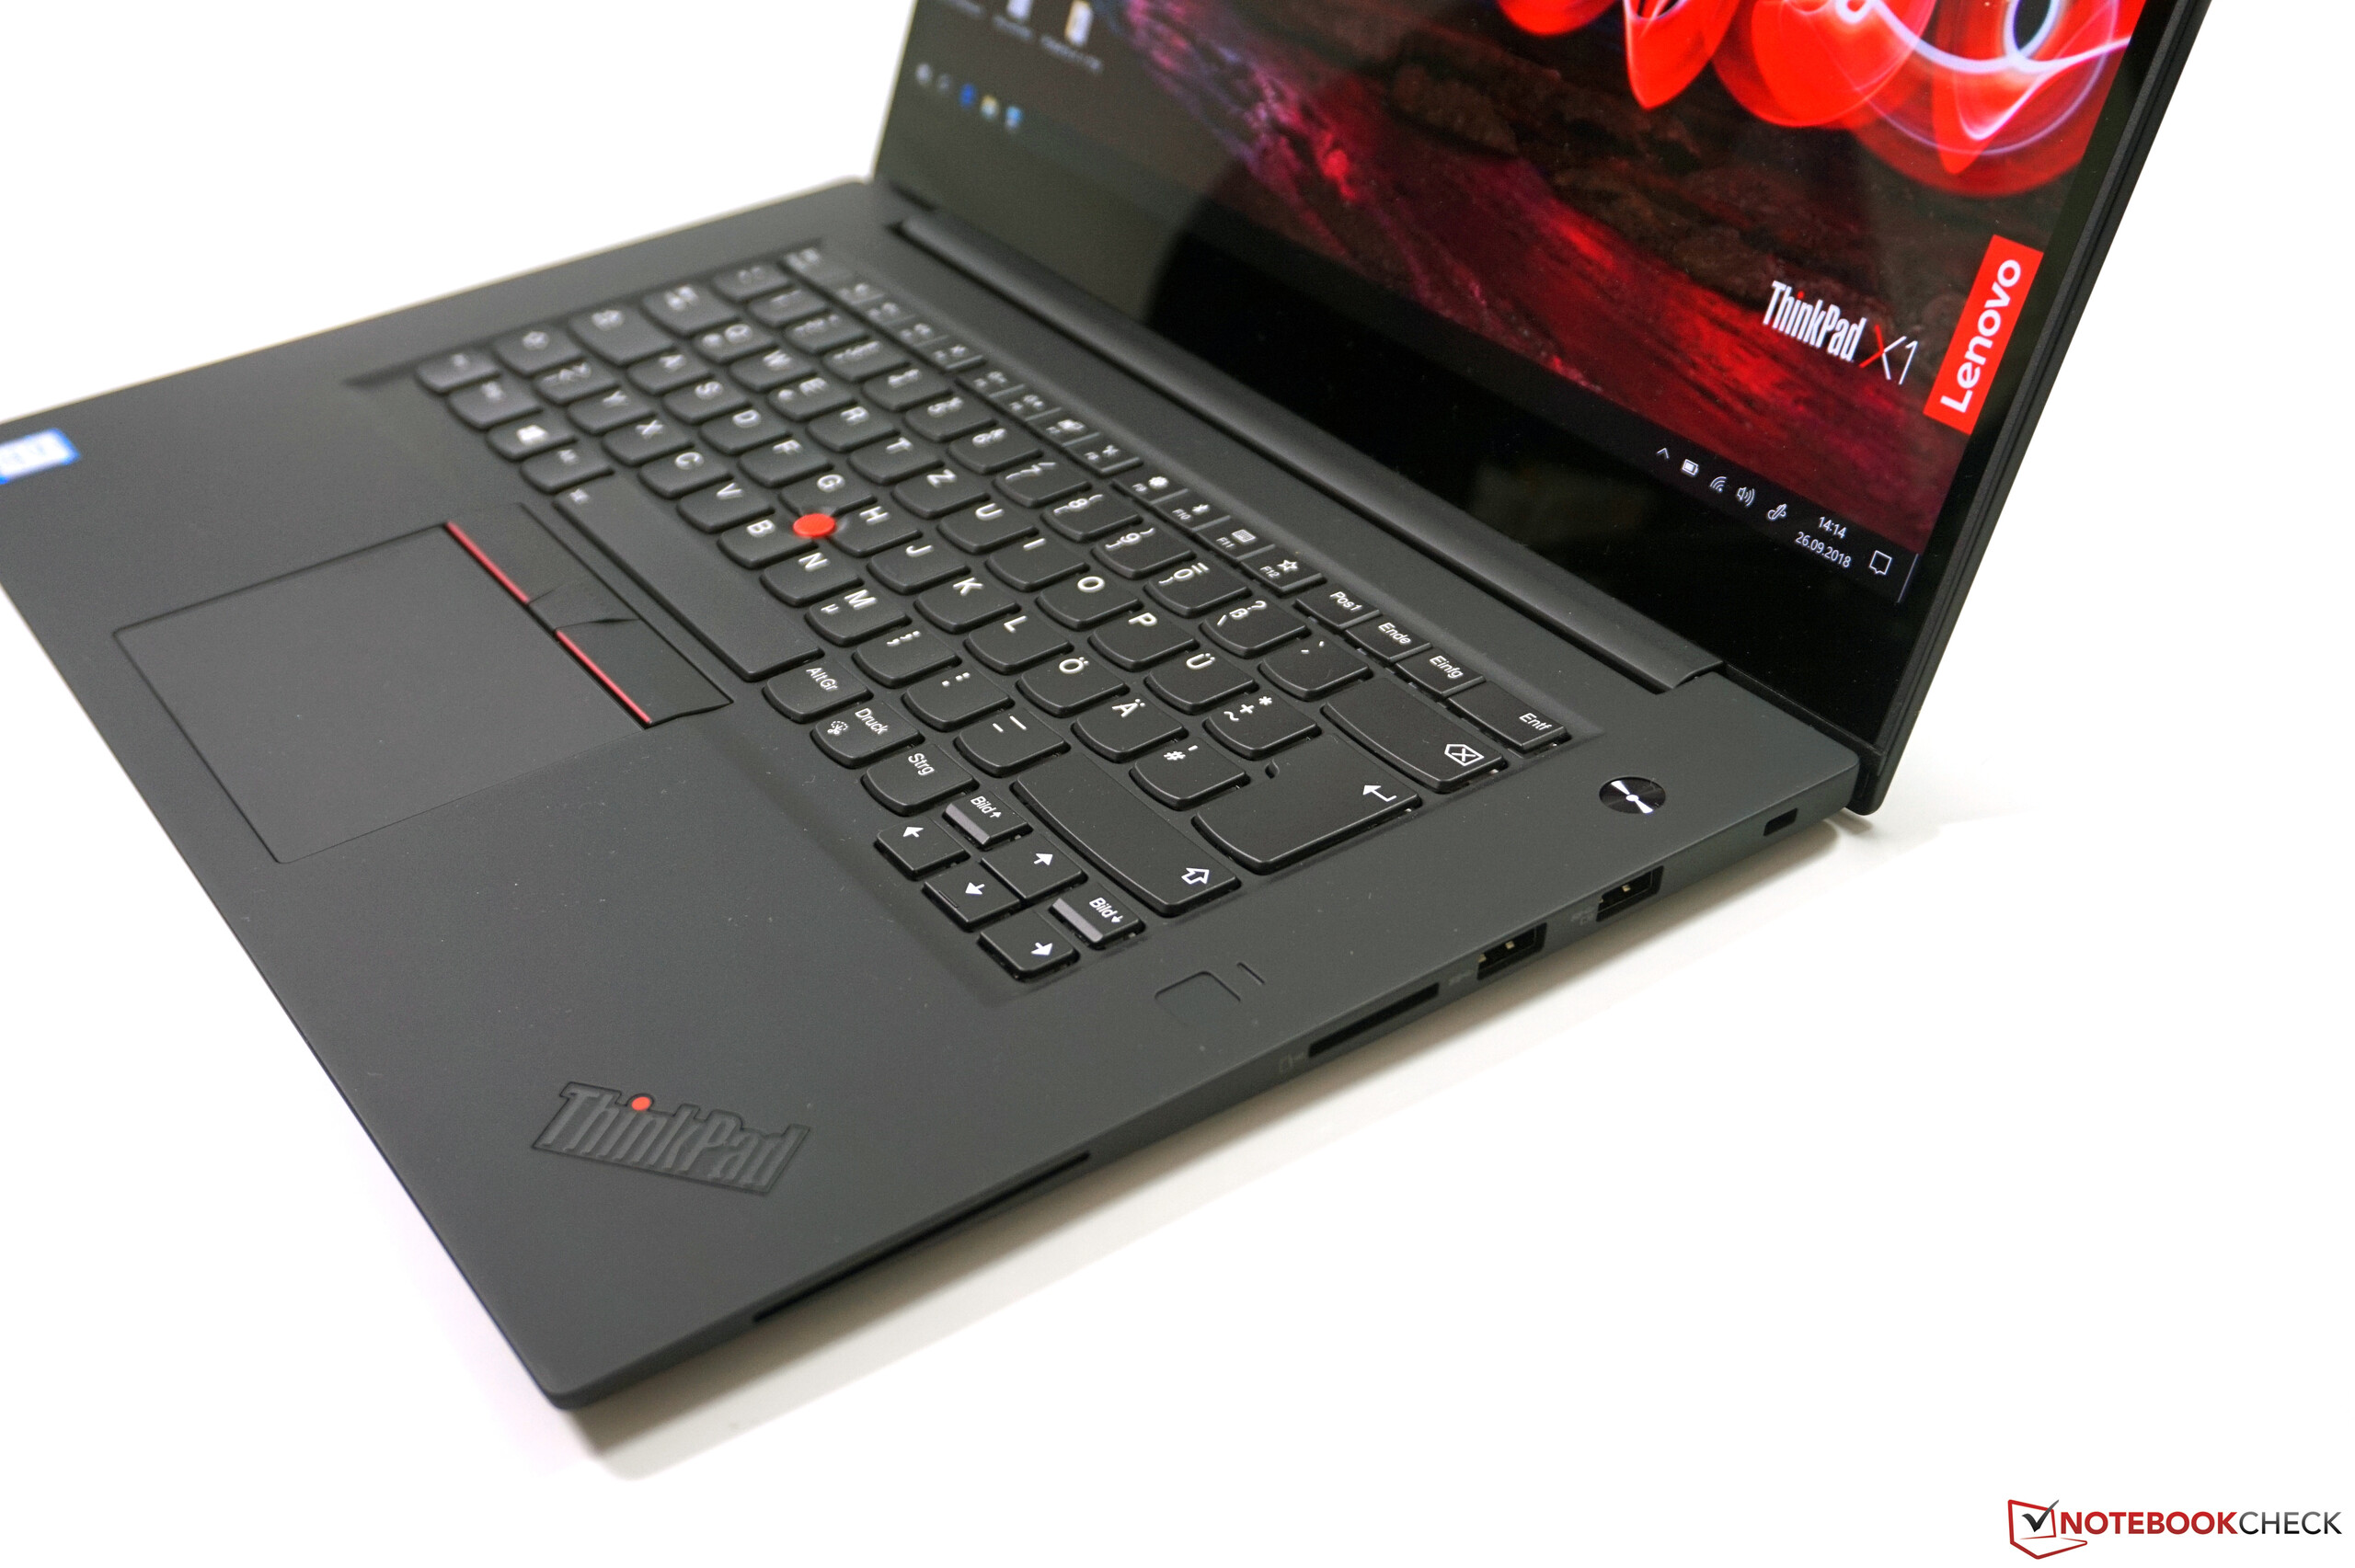
Input Devices
Keyboard
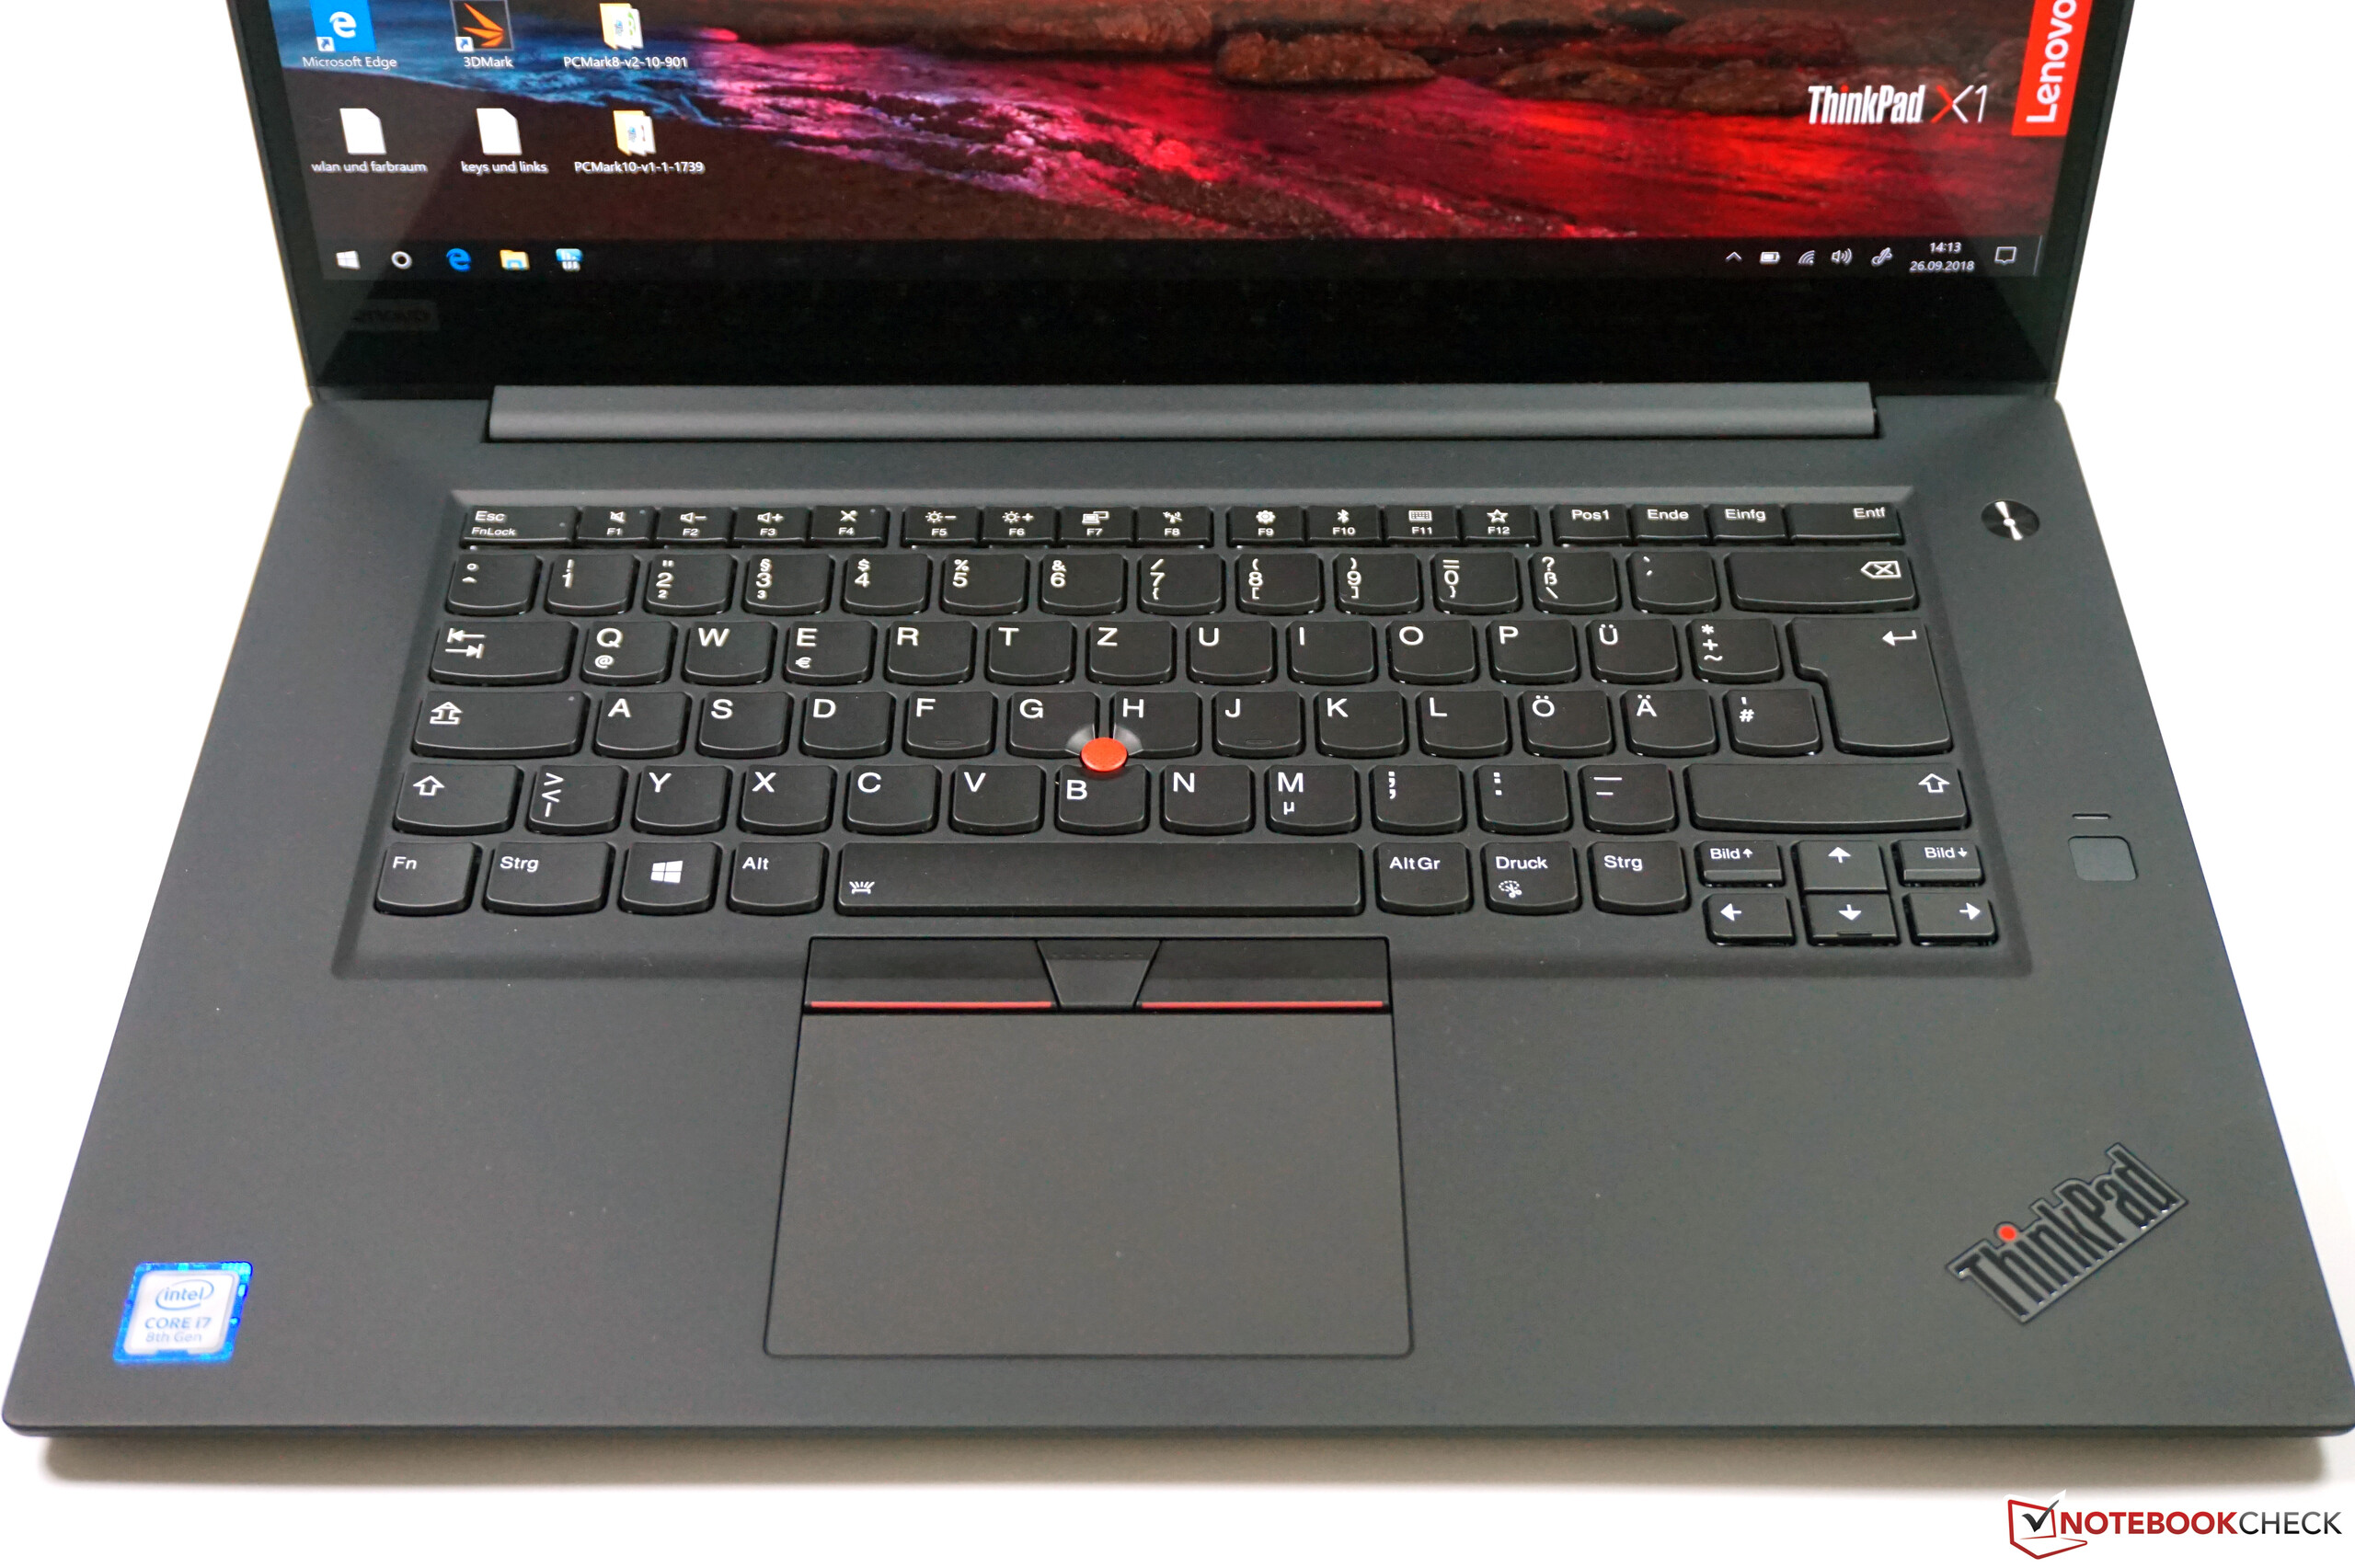
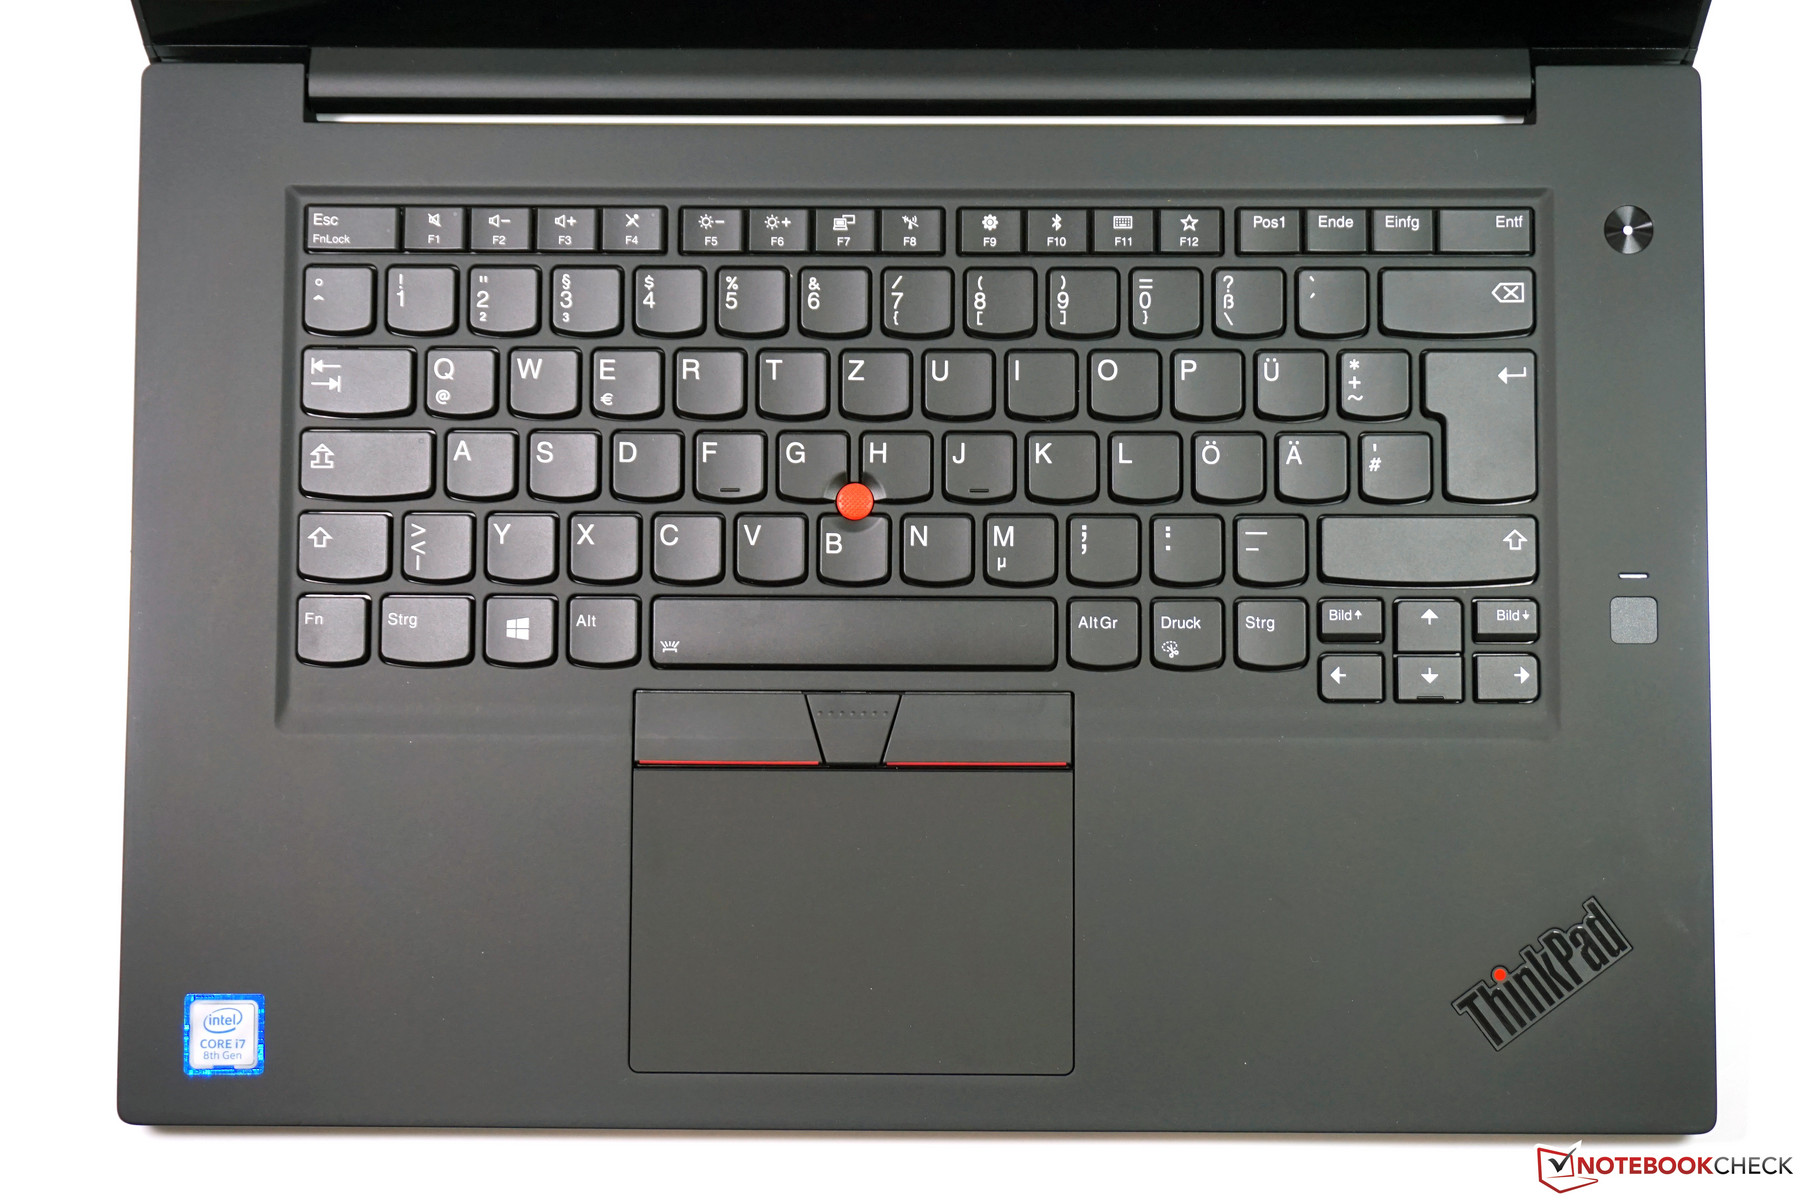
The keyboard of the ThinkPad X1 Extreme is identical to the 14-inch X1 Carbon. This means there is no numeric keypad you get on the ThinkPad T580, for example. However, the other comparison devices do not offer one, either.
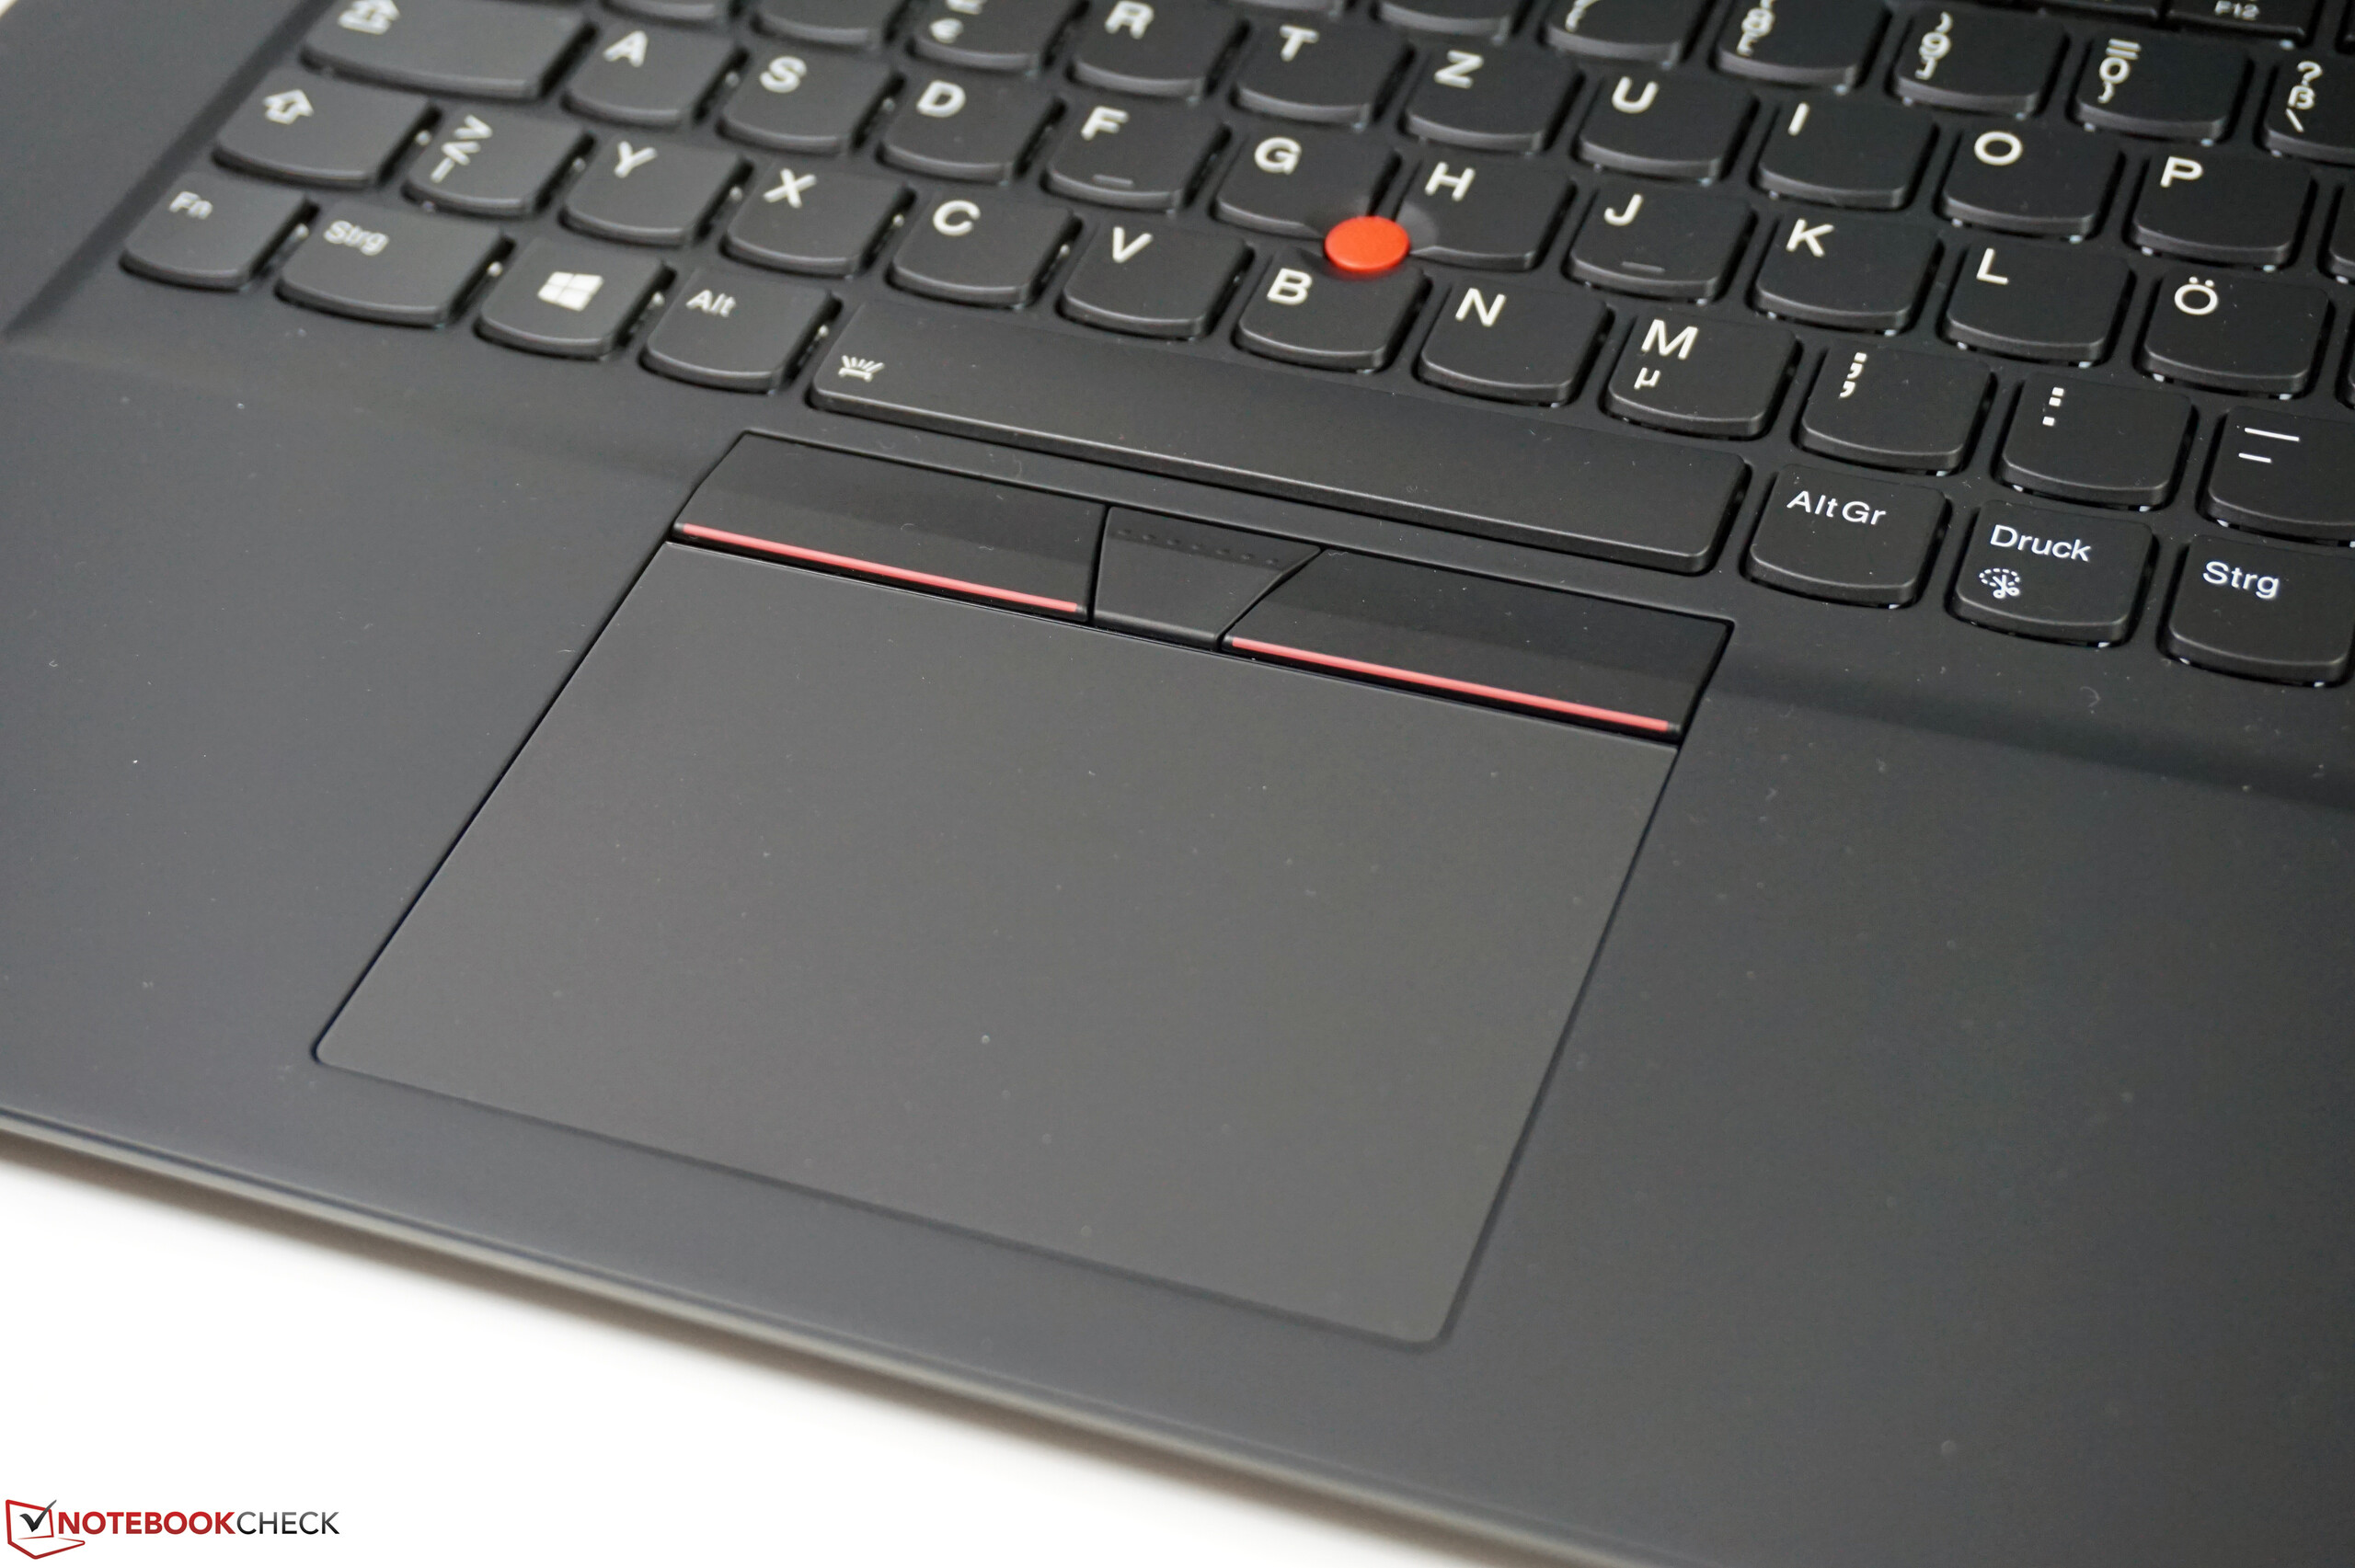
We already praised the keyboard on the ThinkPad X1 Carbon for its rich pressure point and the decent key travel. These two devices are currently equipped with the best keyboard from the current ThinkPad lineup. The typing experience is just one step above other devices like the Dell XPS 15 and the MacBook Pro 15 in particular, even though this is always a matter of taste. There are some settings for the keyboard both in Lenovo's Vantage software as well as the BIOS like switch the default allocation of the function keys or swap Fn & Ctrl.
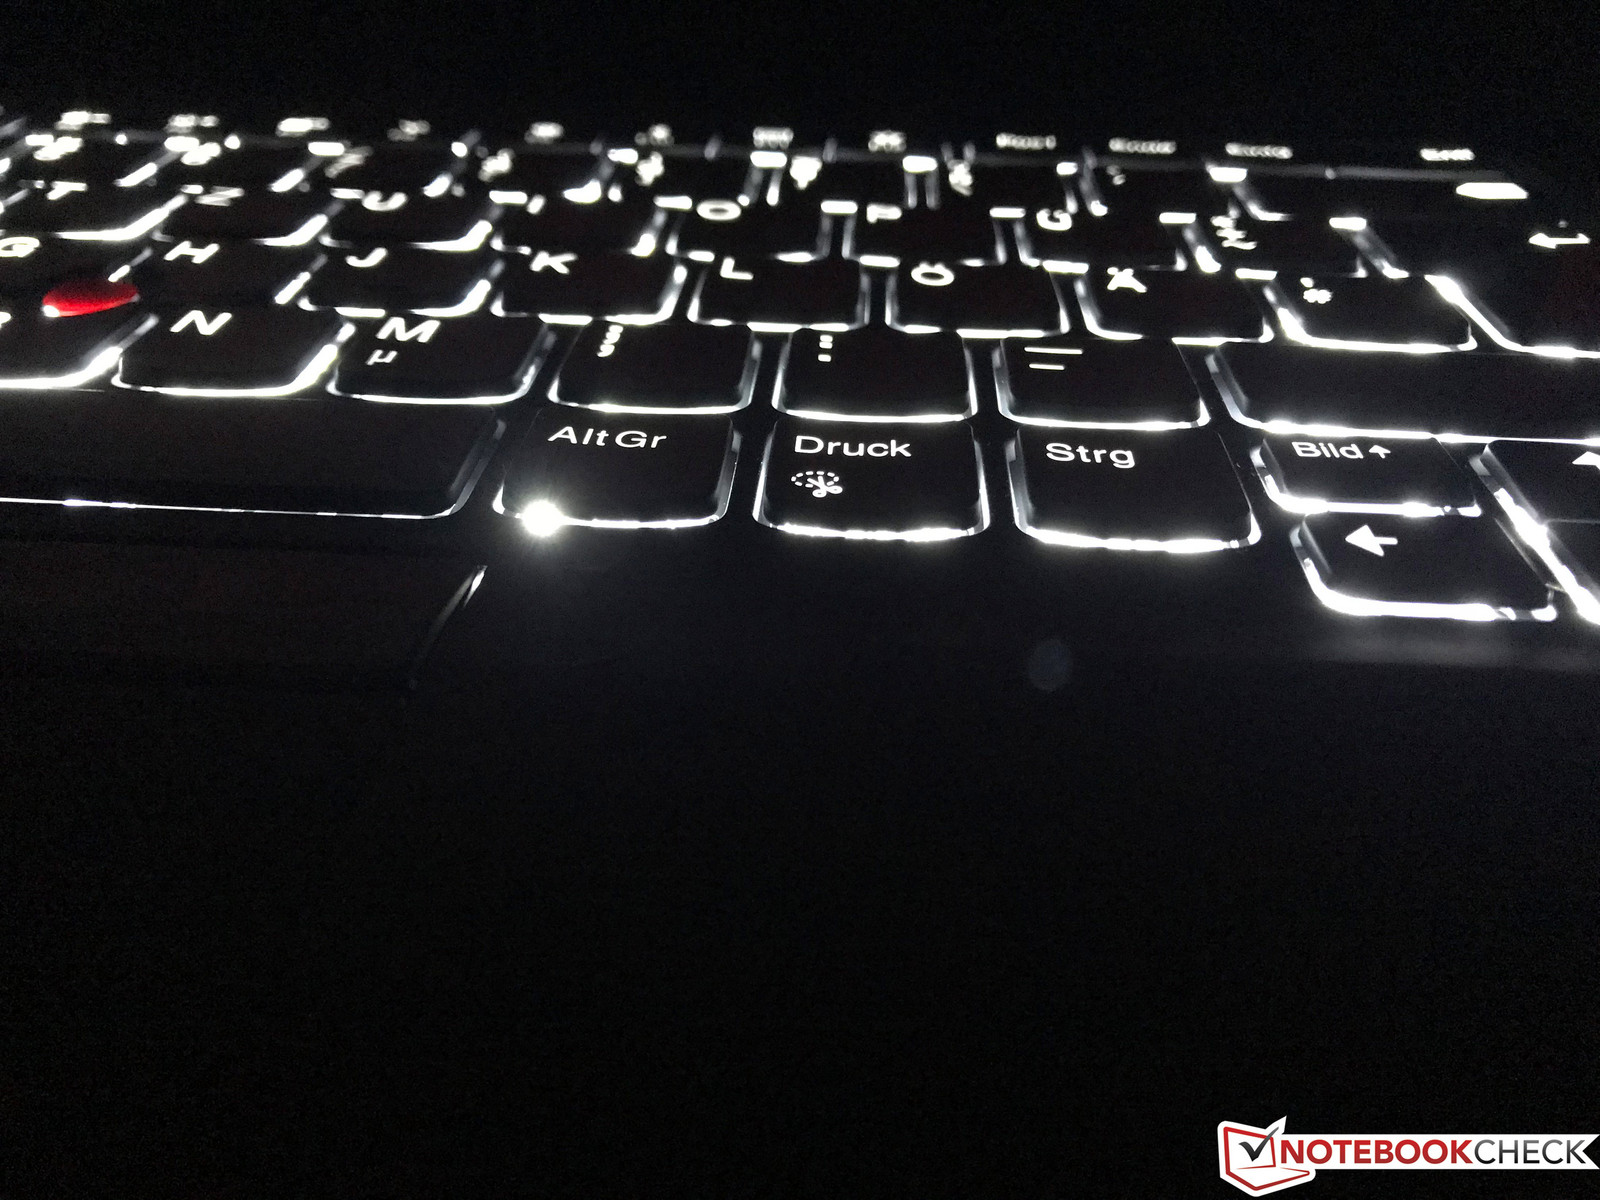
Lenovo includes the usual white LED illumination with two intensity levels, which can dazzle a bit depending on the angle. We would also like to see a brightness sensor, so the lighting is automatically adjusted in darker environments.
TouchPad & TrackPoint
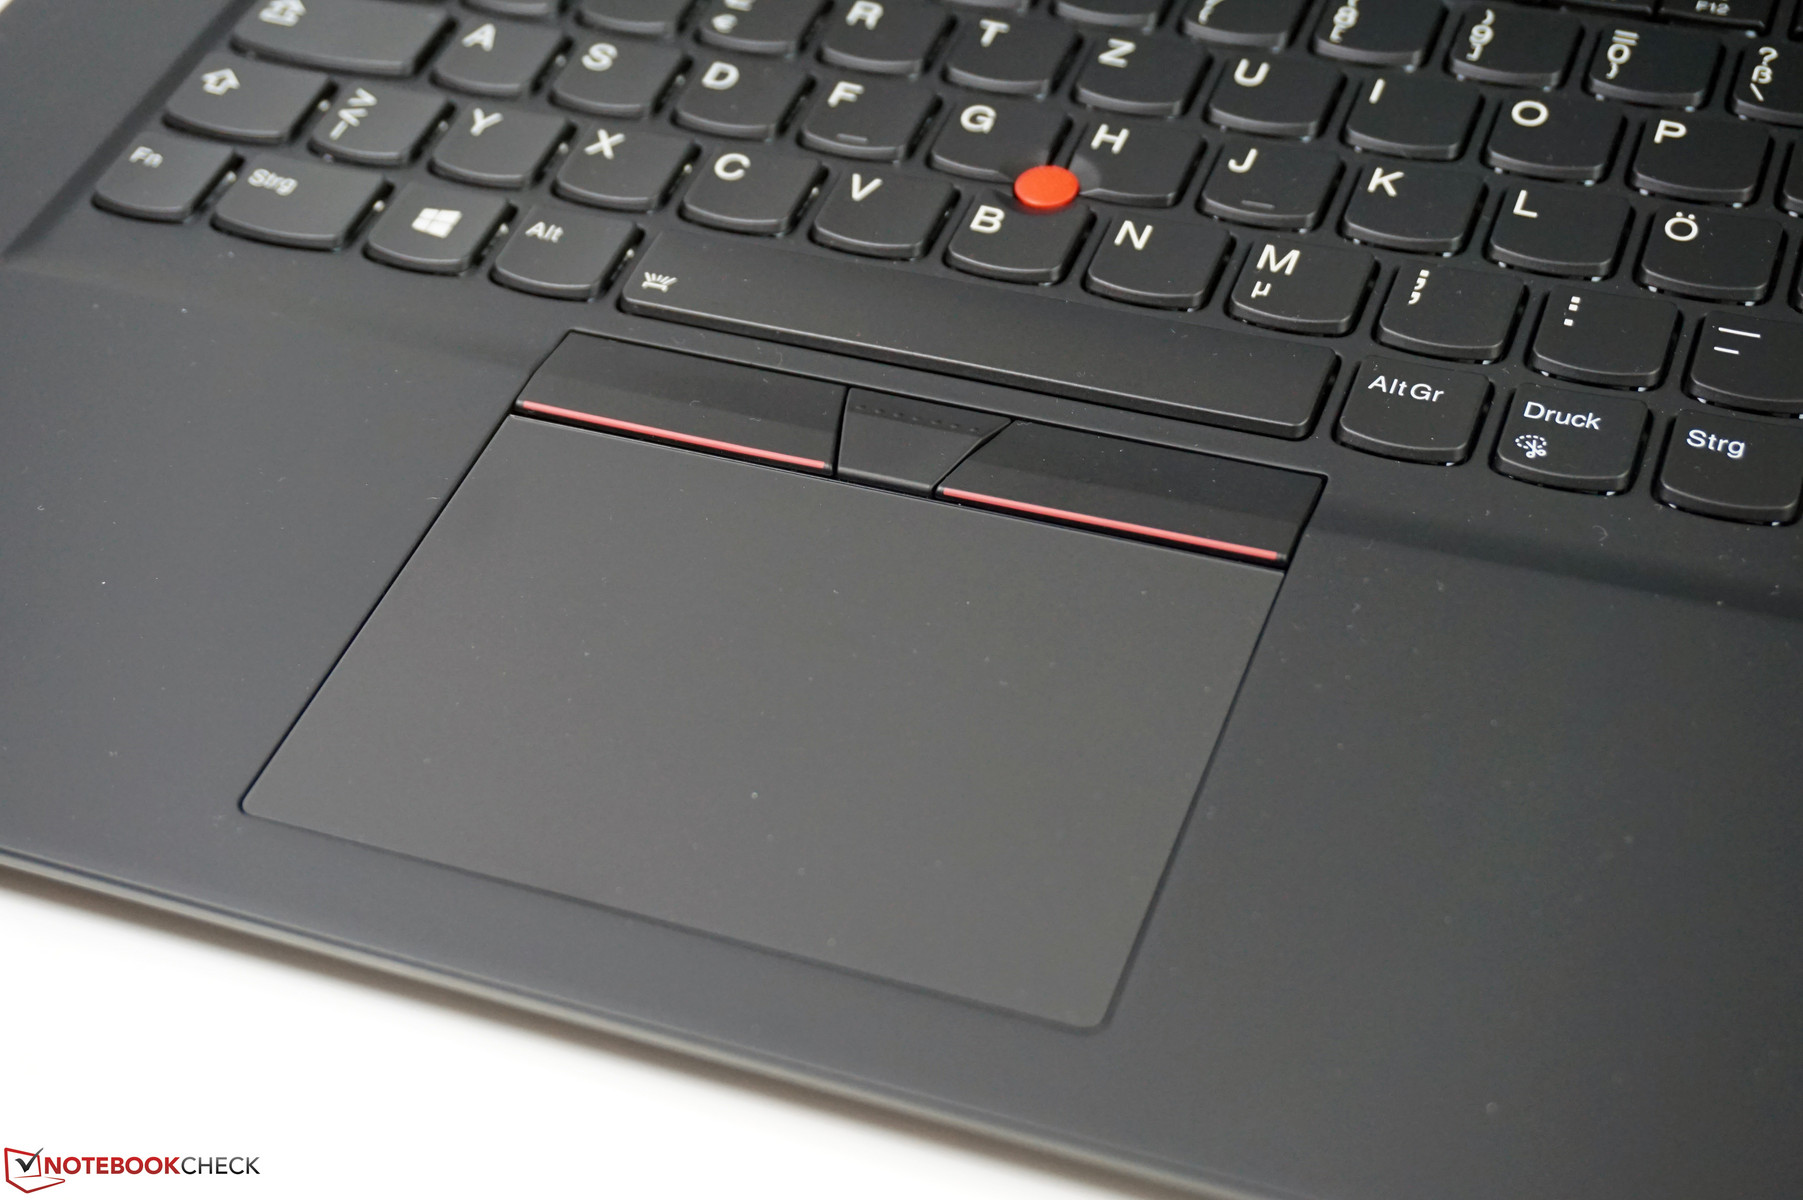
You get the touchpad (which is a clickpad) as well as the red TrackPoint in the center of the keyboard. There are three dedicated mouse buttons above the touchpad that work in combination with the TrackPoint. They offer a well-defined and even pressure point on our test model. Once you get used to the small red dot it is very easy to control the mouse and we prefer it over the touchpad. The latter is also reliable for inputs and provides decent gliding capabilities. It is a Precision touchpad and supports gestures with up to four fingers. You can click the pad down in the lower half, and the clicking sounds are similar for left and right clicks.
Touchscreen, Digitizer & Glance
The 4K panel is a touchscreen at the same time and also supports pen inputs. We tested it and it worked well (as you come to expect from a modern touchscreen), but you still have to ask whether it makes sense to have a touchscreen on a regular15.6-inch laptop. There are certainly some apps where it is useful, but it is definitely not a must-have feature.
ThinkPad X1 Extreme SKUs with the IR camera are also equipped with the Glance software, which can deactivate the screen when yo don't look. It also supports the movement of Windows, but the feature was not always reliable and there seemed to be occasional issues with glasses.
Display - 4K HDR Dolby Vision

Lenovo's display selection is very similar to Dell, because you either get a matte 1080p IPS screen rated at 300 nits or the 4K screen (+354.62 Euros) from our test unit. The latter is brighter at 400 nits and is supposed to have wider color gamut. Similar to the smaller ThinkPad X1 Carbon, the screen also supports the playback of HDR contents, which is not possible on the rivals. It is also a touchscreen with pen support, but this also means the surface is glossy.
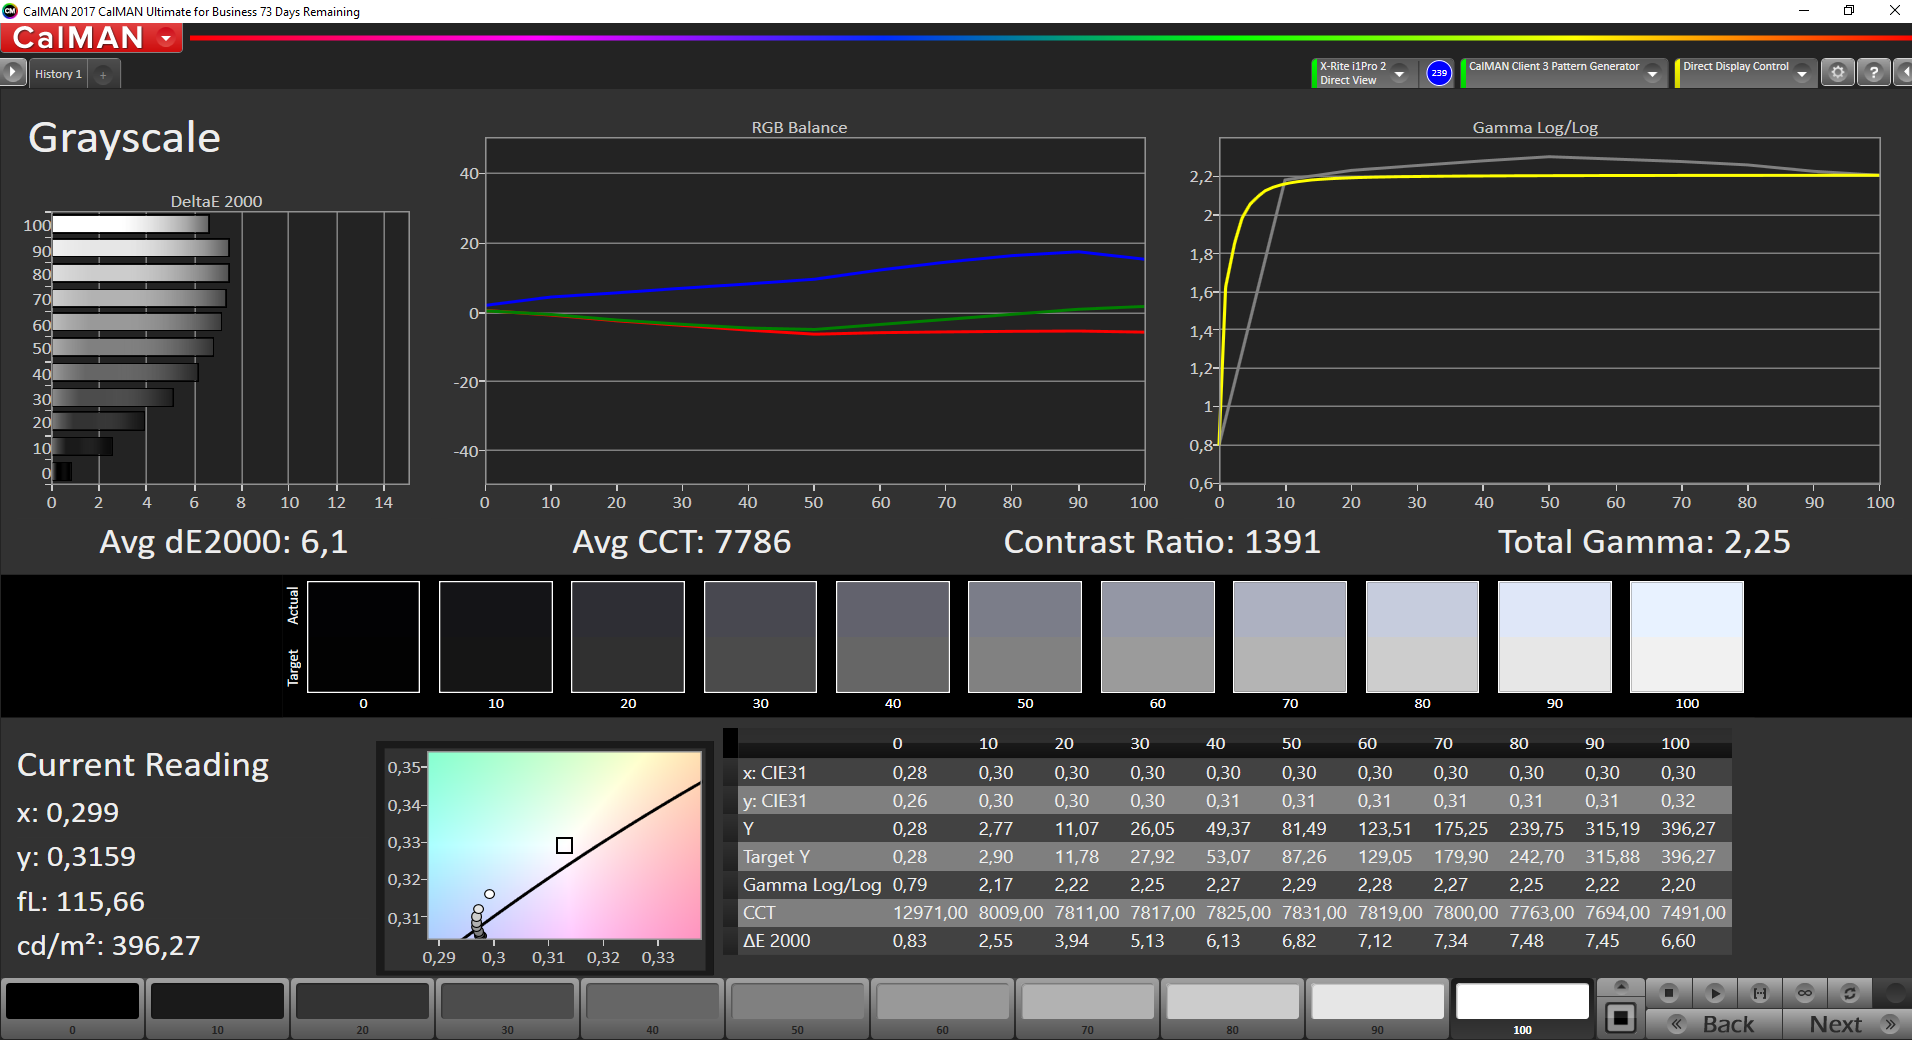
The subjective picture impression is very good and basically identical to the smaller ThinkPad X1 Carbon 2018 HDR. The 15.6-inch panel with the ID B156ZAN03.2 is provided by AU Optronics. We already mentioned the advertised brightness of 400 nits, but our test unit just misses this number. We determine an average luminance of 380 nits, which is on par with the HP EliteBook 1050 G1, while the other competitors from Dell and Apple are much brighter. The X1 Extreme gets points for the brightness distribution (90%) and the decent black value (0.28), which results in a very high contrast ratio (>1400:1). However, all the comparison devices are more or less on the same level.
You can notice some backlight bleeding around the edges on the two brightest settings, at least on dark contents. This is especially noticeable when you watch letterbox videos. We did not detect PWM on any brightness setting.
| |||||||||||||||||||||||||
Brightness Distribution: 90 %
Center on Battery: 397 cd/m²
Contrast: 1414:1 (Black: 0.28 cd/m²)
ΔE ColorChecker Calman: 4 | ∀{0.5-29.43 Ø4.78}
calibrated: 0.9
ΔE Greyscale Calman: 6.1 | ∀{0.09-98 Ø5}
100% sRGB (Argyll 1.6.3 3D)
88.5% AdobeRGB 1998 (Argyll 1.6.3 3D)
99.4% AdobeRGB 1998 (Argyll 3D)
100% sRGB (Argyll 3D)
86.3% Display P3 (Argyll 3D)
Gamma: 2.25
CCT: 7786 K
| Lenovo ThinkPad X1 Extreme-20MF000XGE B156ZAN03.2, , 3840x2160, 15.6" | Dell XPS 15 9570 i7 UHD LQ156D1, , 3840x2160, 15.6" | HP EliteBook 1050 G1-4QY20EA AUO30EB, , 3840x2160, 15.6" | Apple MacBook Pro 15 2018 (2.6 GHz, 560X) APPA040, , 2880x1800, 15.4" | Lenovo ThinkPad X1 Carbon 2018-20KGS03900 B140QAN02.0, , 2560x1440, 14" | Lenovo ThinkPad T580-20LAS01H00 NV156QUM-N44, , 3840x2160, 15.6" | |
|---|---|---|---|---|---|---|
| Display | -10% | -20% | 0% | 1% | -21% | |
| Display P3 Coverage (%) | 86.3 | 79.1 -8% | 67.8 -21% | 98.7 14% | 87.7 2% | 69.2 -20% |
| sRGB Coverage (%) | 100 | 98.8 -1% | 94.1 -6% | 99.9 0% | 100 0% | 90.7 -9% |
| AdobeRGB 1998 Coverage (%) | 99.4 | 79.2 -20% | 67.9 -32% | 86.6 -13% | 99.9 1% | 66.3 -33% |
| Response Times | 13% | 9% | 16% | -2% | 12% | |
| Response Time Grey 50% / Grey 80% * (ms) | 61.6 ? | 46.4 ? 25% | 56 ? 9% | 43.2 ? 30% | 59.2 ? 4% | 51.2 ? 17% |
| Response Time Black / White * (ms) | 32 ? | 32 ? -0% | 29 ? 9% | 31.2 ? 2% | 34.4 ? -8% | 29.6 ? 7% |
| PWM Frequency (Hz) | 980 ? | 117000 ? | 952 ? | |||
| Screen | -10% | -17% | 29% | 20% | -14% | |
| Brightness middle (cd/m²) | 396 | 494 25% | 440 11% | 520 31% | 578 46% | 310 -22% |
| Brightness (cd/m²) | 380 | 457 20% | 389 2% | 492 29% | 533 40% | 283 -26% |
| Brightness Distribution (%) | 90 | 88 -2% | 83 -8% | 88 -2% | 84 -7% | 87 -3% |
| Black Level * (cd/m²) | 0.28 | 0.34 -21% | 0.34 -21% | 0.39 -39% | 0.38 -36% | 0.24 14% |
| Contrast (:1) | 1414 | 1453 3% | 1294 -8% | 1333 -6% | 1521 8% | 1292 -9% |
| Colorchecker dE 2000 * | 4 | 5.2 -30% | 5.04 -26% | 1.2 70% | 1.9 52% | 3.1 22% |
| Colorchecker dE 2000 max. * | 7.6 | 17.5 -130% | 6.99 8% | 2.3 70% | 3.8 50% | 7.6 -0% |
| Colorchecker dE 2000 calibrated * | 0.9 | 2.04 -127% | 0.8 11% | 2.2 -144% | ||
| Greyscale dE 2000 * | 6.1 | 2.7 56% | 4.98 18% | 1.3 79% | 3 51% | 2.3 62% |
| Gamma | 2.25 98% | 2.1 105% | 2.48 89% | 2.18 101% | 2.14 103% | 2.21 100% |
| CCT | 7786 83% | 7038 92% | 7777 84% | 6738 96% | 6377 102% | 6876 95% |
| Color Space (Percent of AdobeRGB 1998) (%) | 88.5 | 71.2 -20% | 61 -31% | 88.8 0% | 59.1 -33% | |
| Color Space (Percent of sRGB) (%) | 100 | 98.8 -1% | 94 -6% | 100 0% | 90.1 -10% | |
| Total Average (Program / Settings) | -2% /
-7% | -9% /
-14% | 15% /
20% | 6% /
13% | -8% /
-12% |
* ... smaller is better
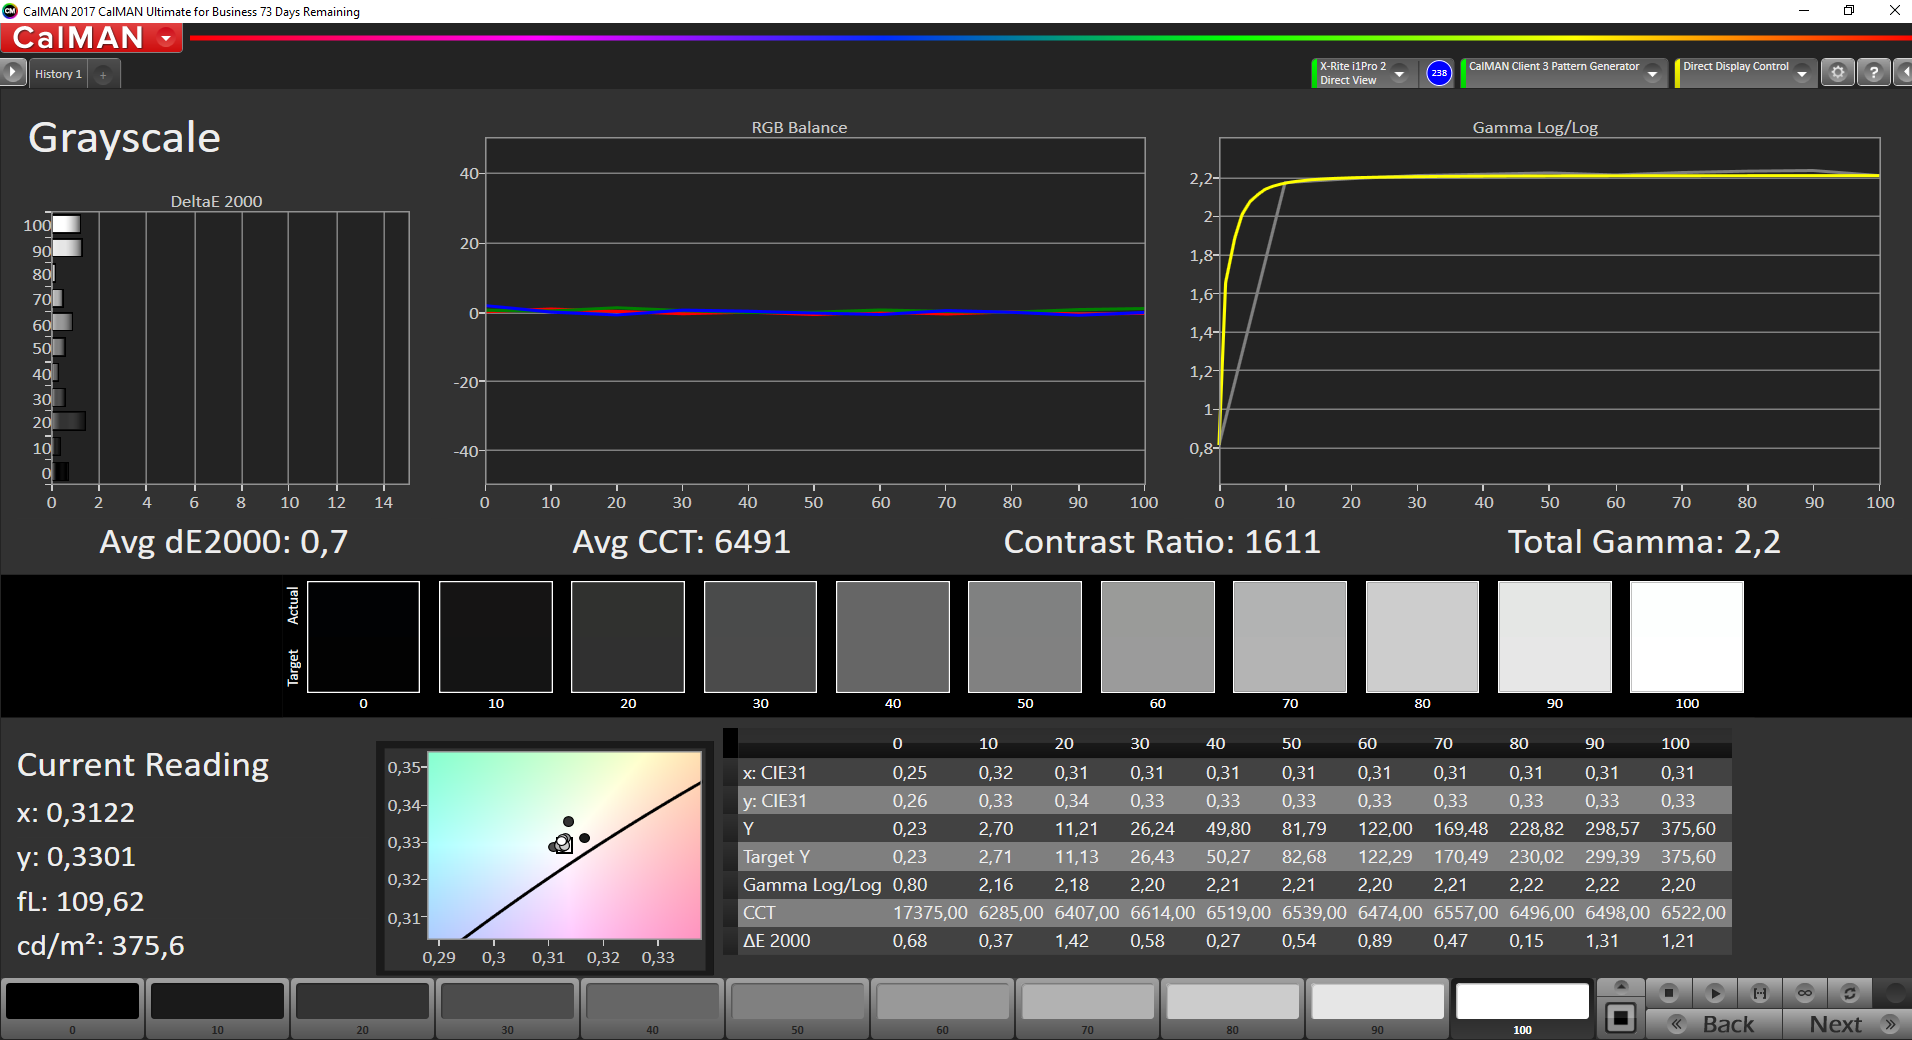
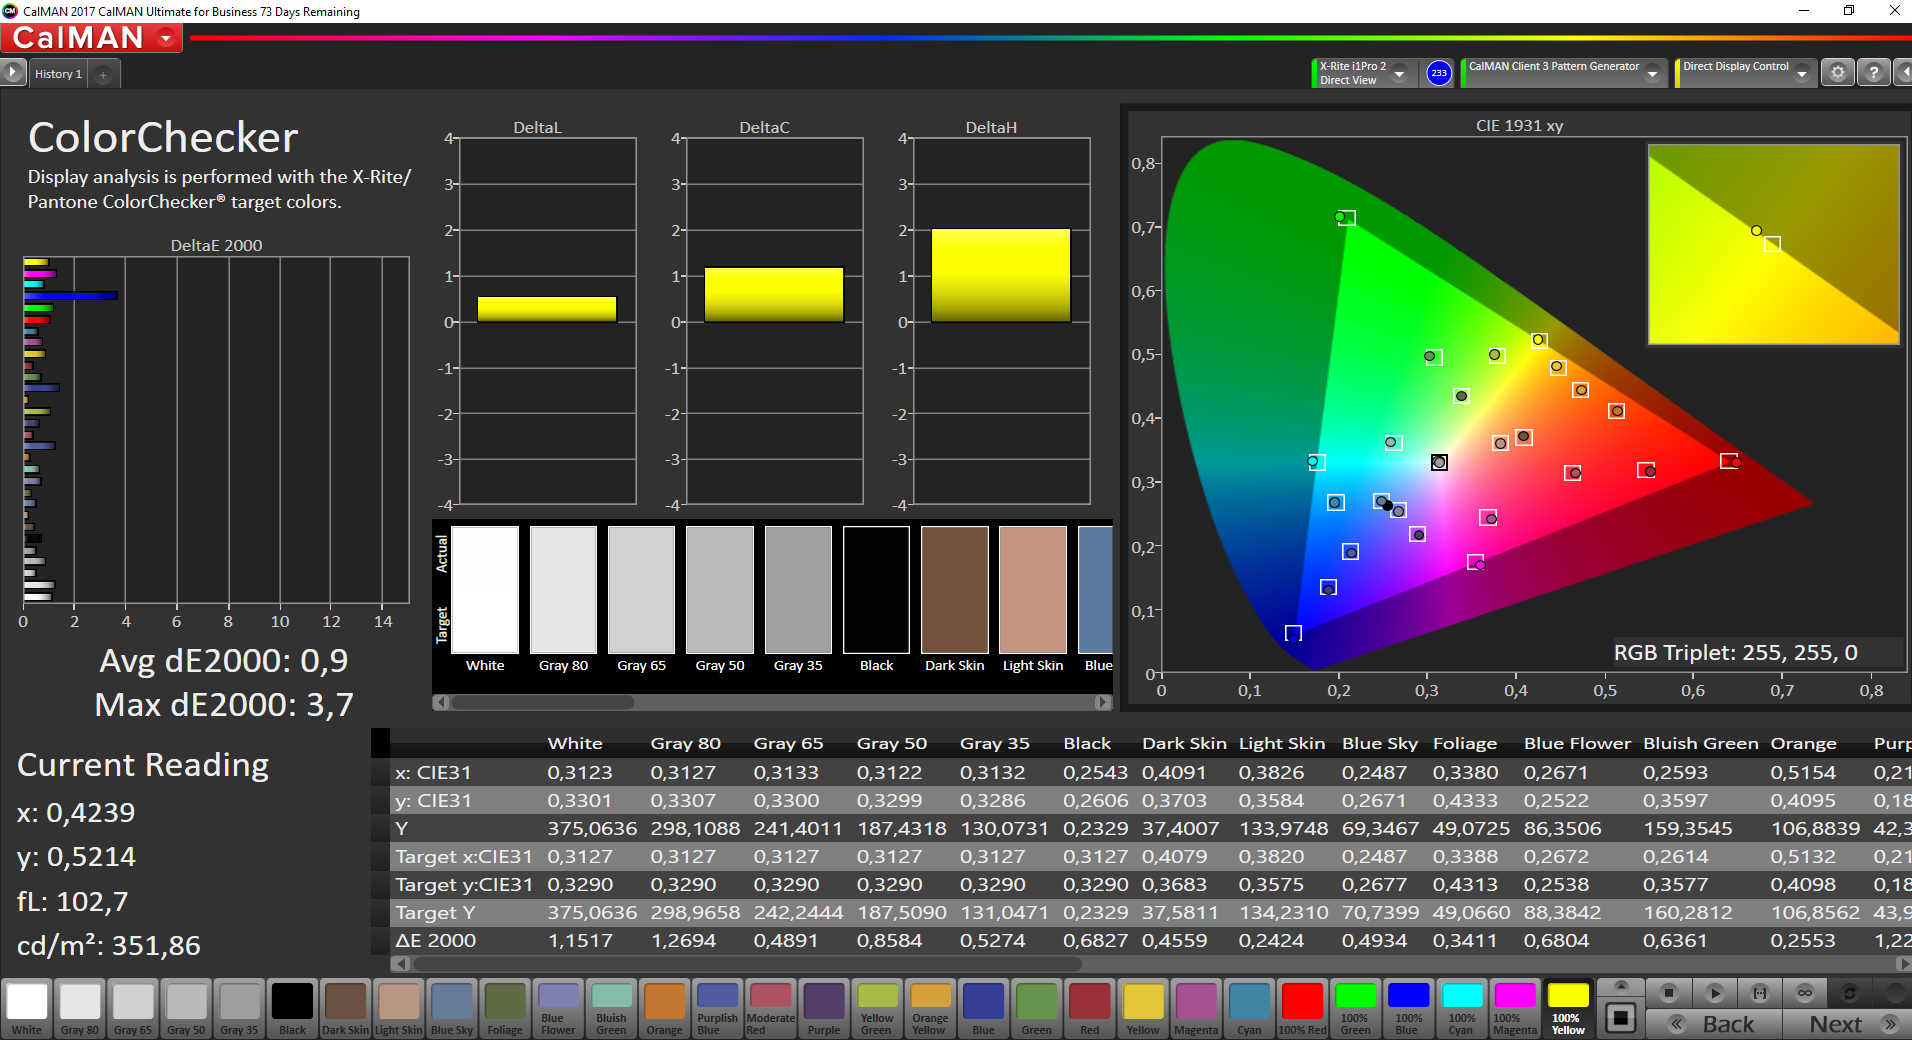
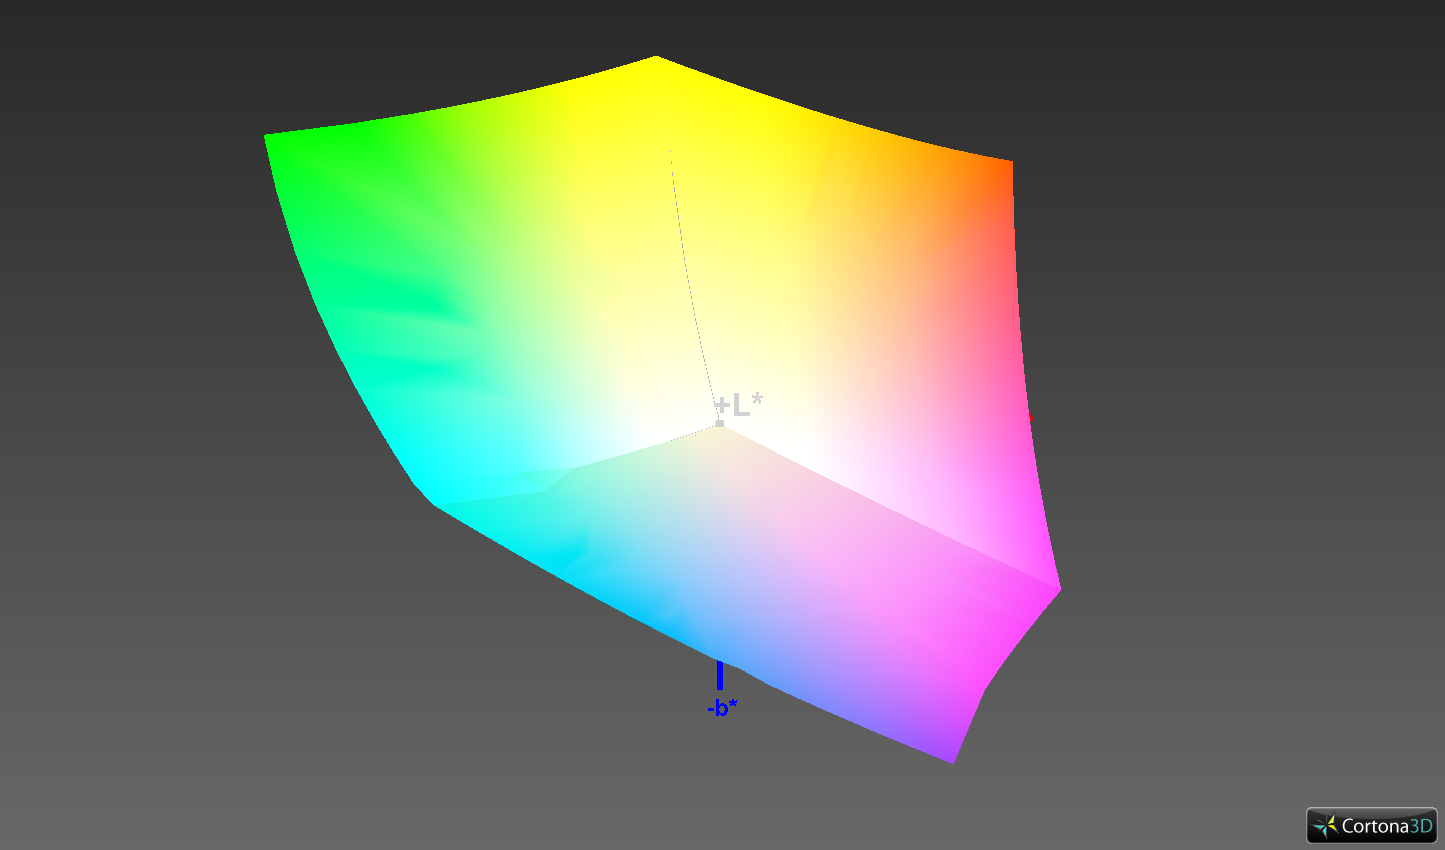
Lenovo only installs one color profile (extended color gamut) and there is no setting to switch between the color spaces. We tested the panel against the AdobeRGB reference and were surprised by the bad results. The grayscale shows a major blue cast and high deviations from the target value (<3). The color temperature is also too cool and the situations is just marginally better for the colors. We would have expected a better factory profile not unlike the one on the smaller X1 Carbon. Apple's MacBook Pro 15 is much better out of the box within the comparison group.
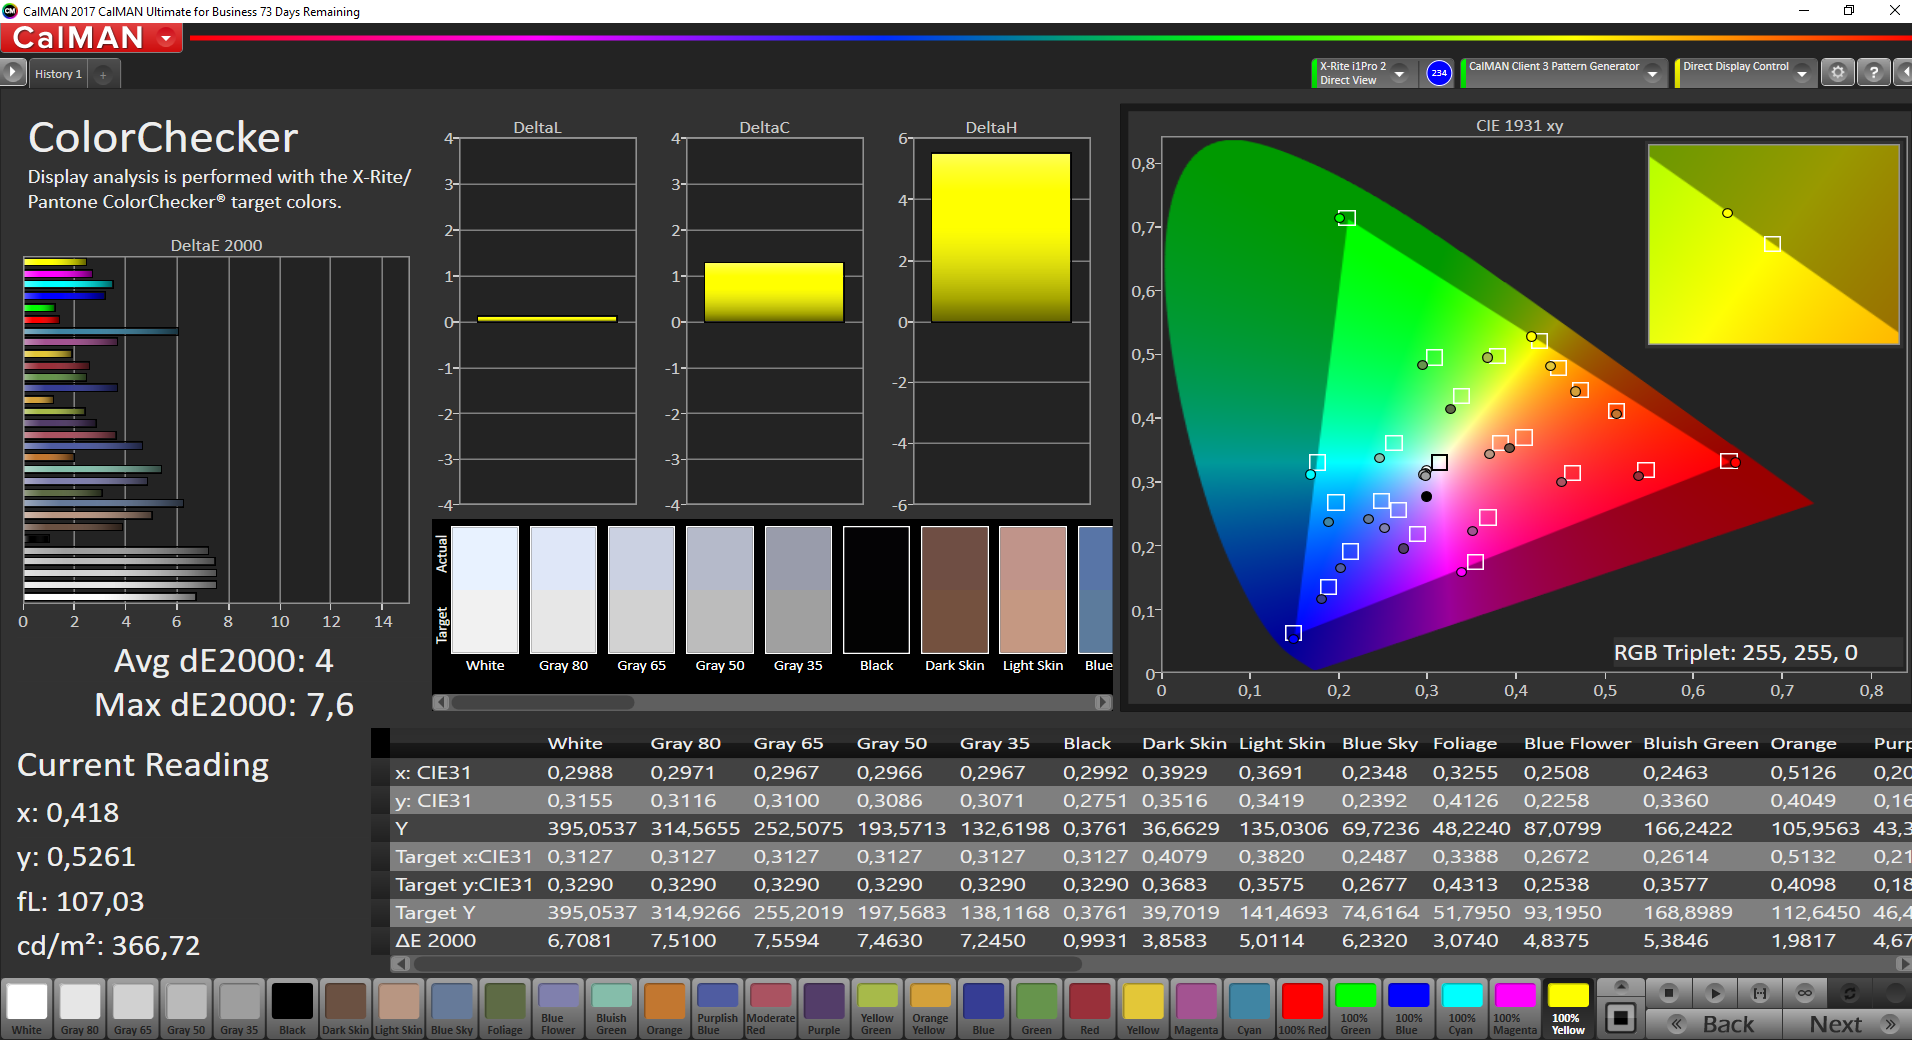
Our calibration with the X-Rite i1 Pro 2 spectrophotometer improves the performance significantly. Thanks to an almost perfect color temperature, you can enjoy a warmer picture without any blue cast. The average DeltaE-2000 deviation drops to just 0.9, which is a great results. The color deviation dropped as well (average DeltaE: 0.9), only 100 % blue cannot be displayed more accurate. Overall, still a very good performance.
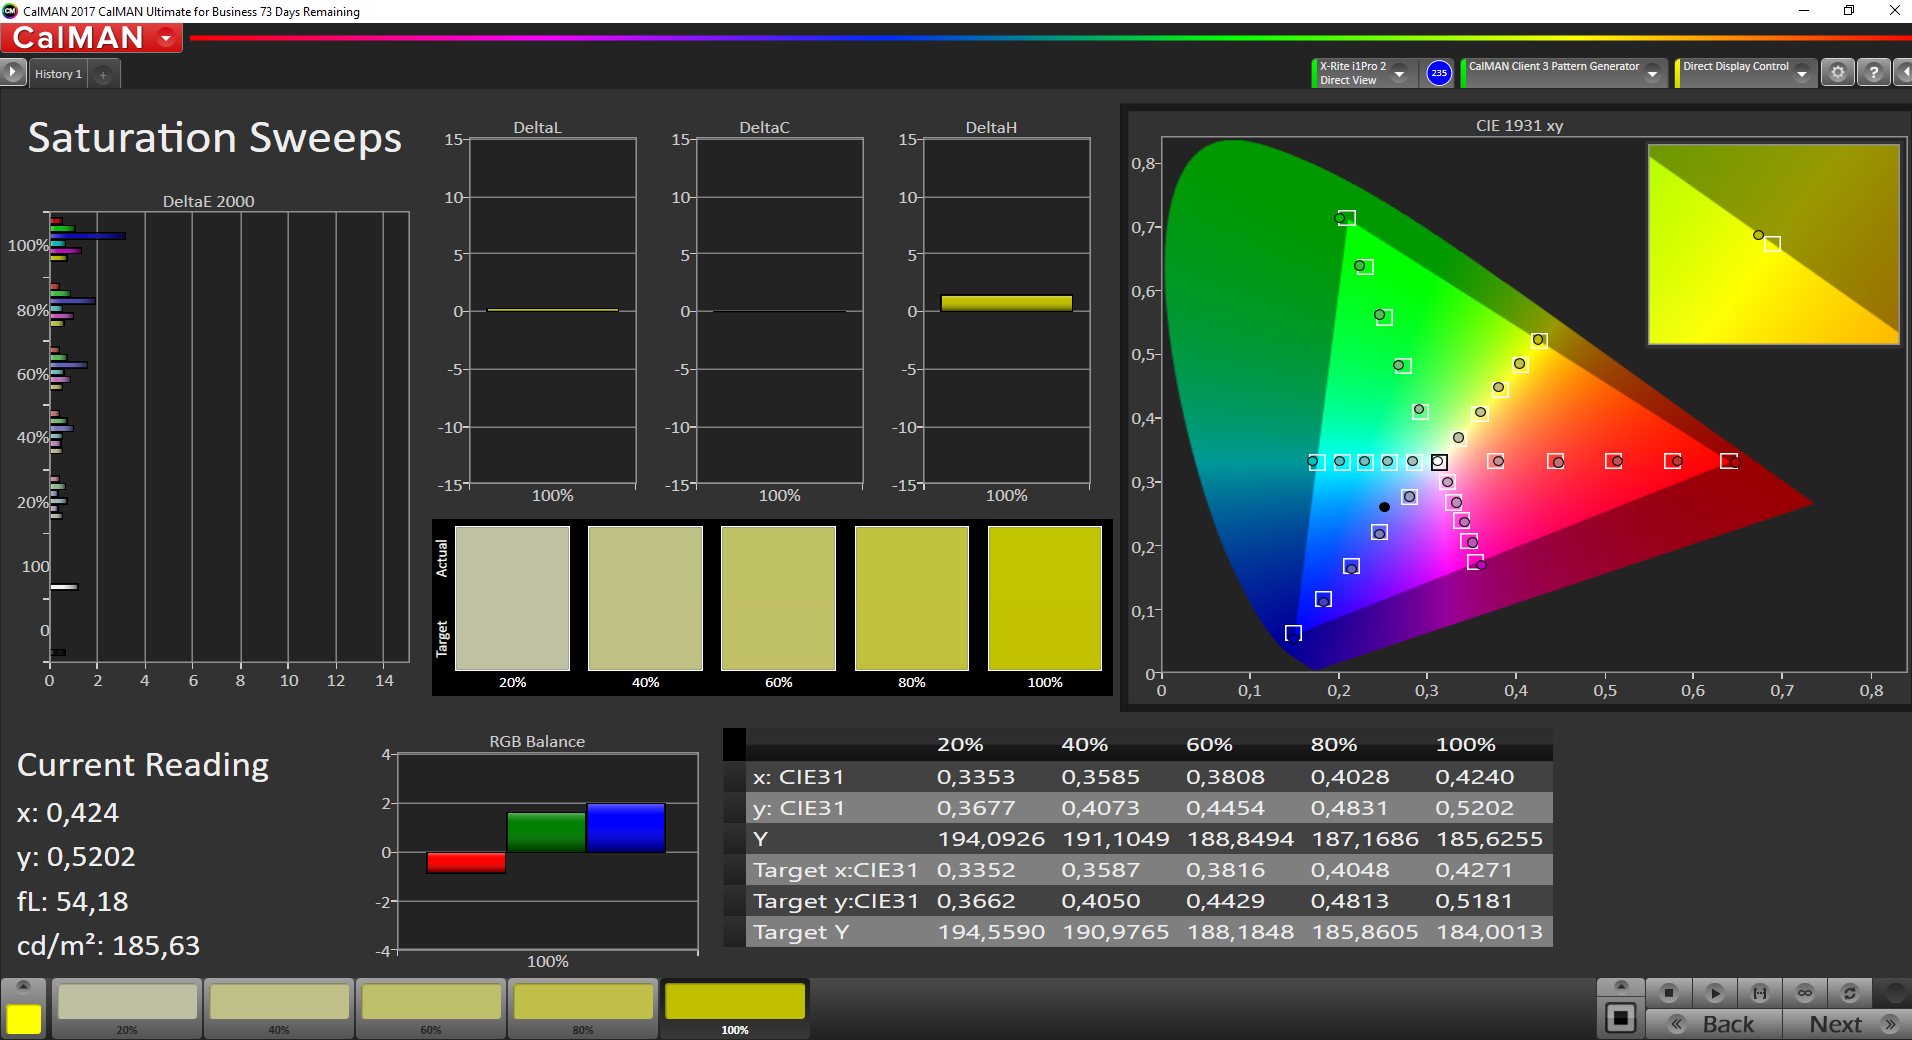
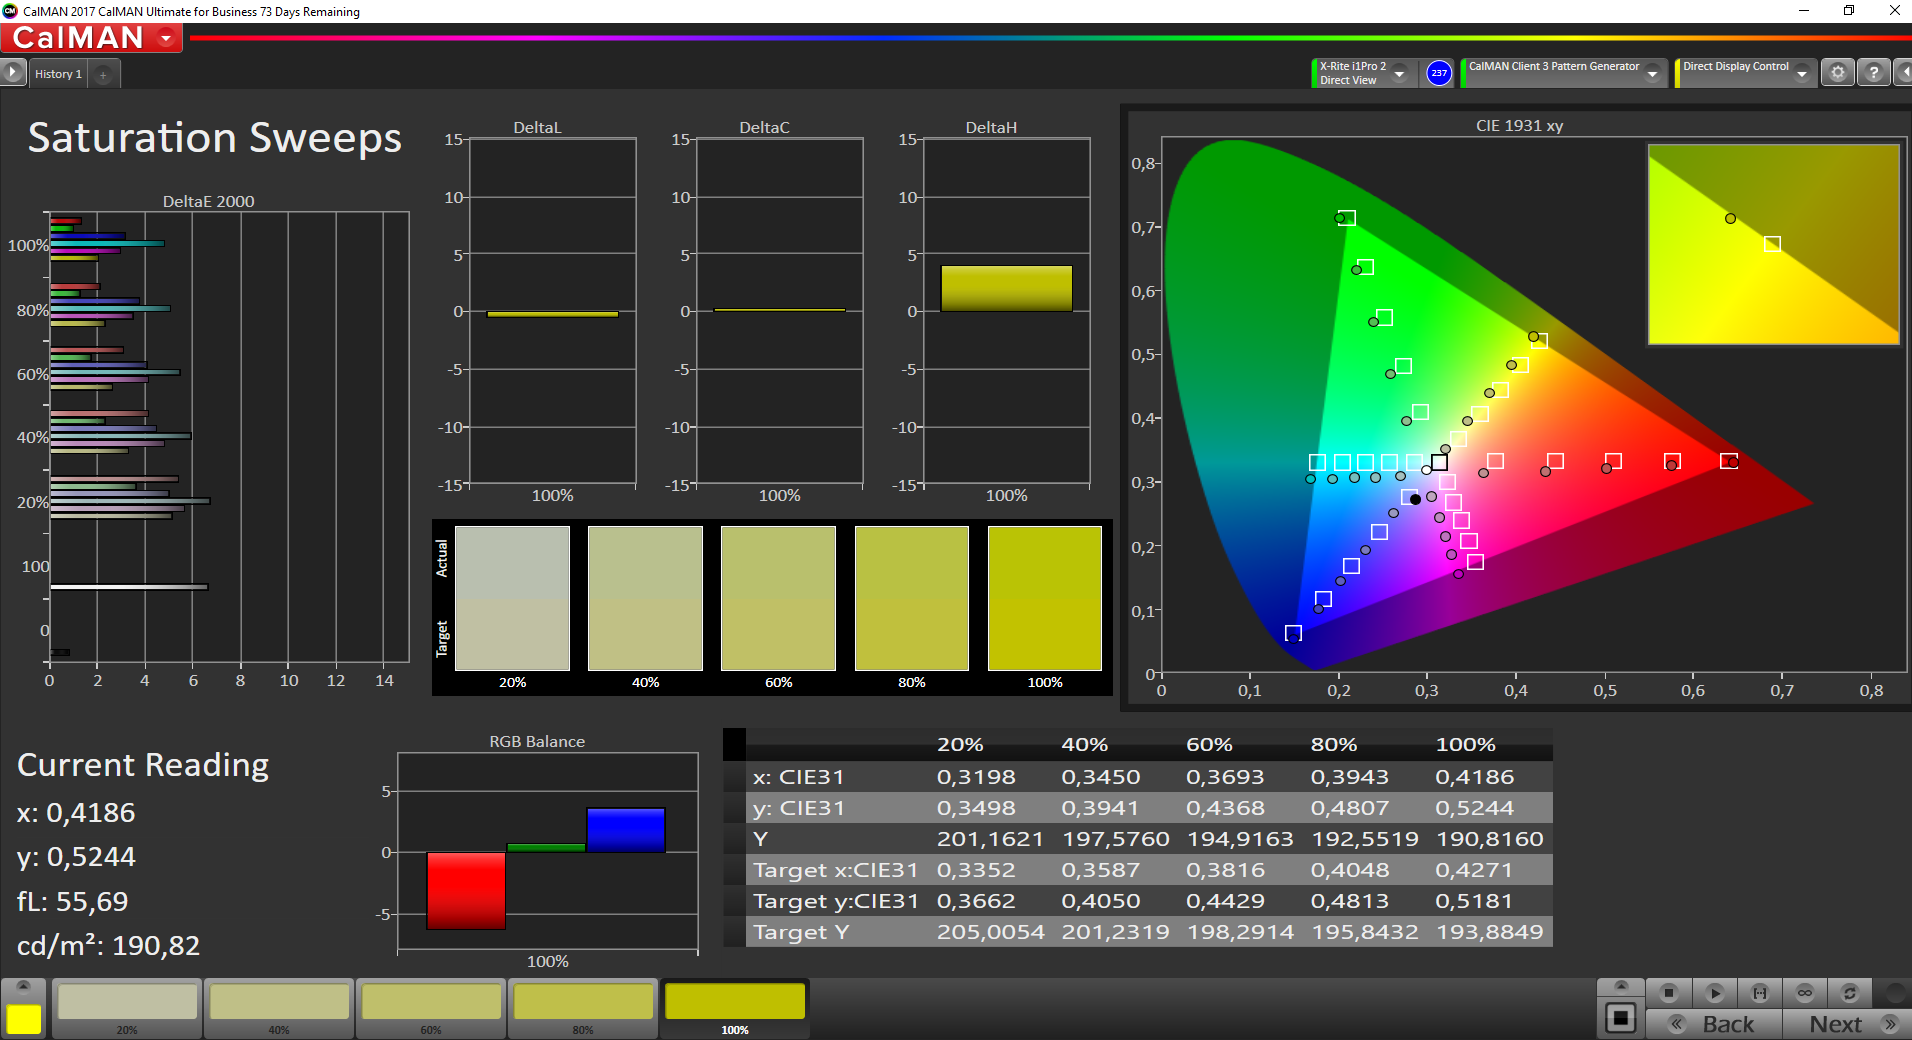
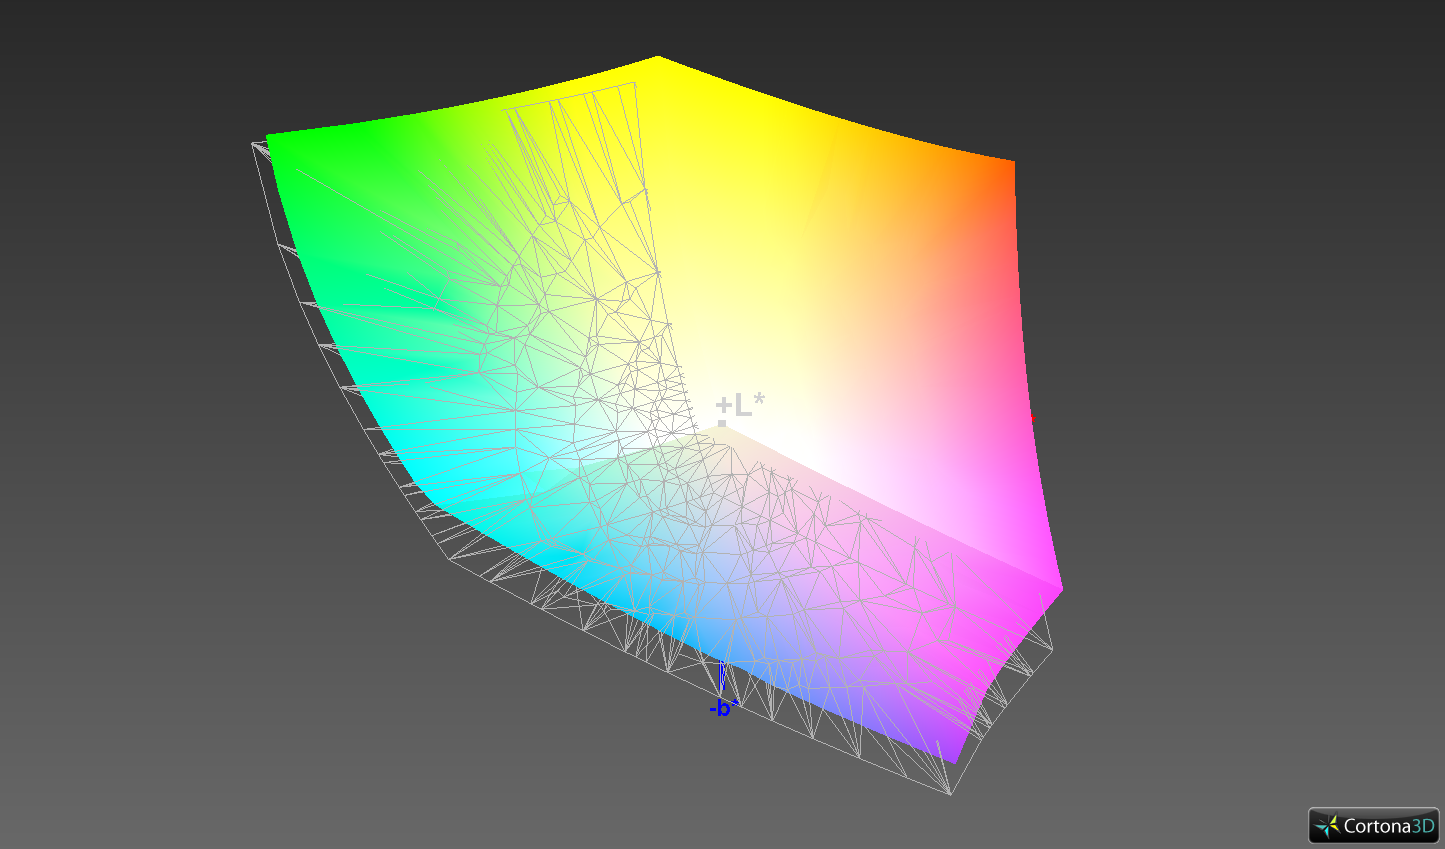
The next item on our list is the color gamut, which is advertised with 100% AdobeRGB by Lenovo. We check the color space coverage with Argyll, which calculates the overlap in 3D. This results in a more accurate value. The result is very good at 88.5% and on par with the 14-inch sibling. CalMAN uses a simpler 2D diagram for the calculation and determines complete AdobeRGB gamut. Both X1 models are ahead of the competition in this respect.
Similar to the HDR panel of the smaller ThinkPad X1 Carbon we detect very high response times. This is noticeable in practice, especially when you move the cursor on dark backgrounds and scroll through websites there is visible ghosting. From our experiences with the smaller X1 Carbon we can say that you will get used to it and it was no issue for us. You cannot notice it when you watch videos, but you should avoid the HDR panel if you plan to play fast first-person shooters on the X1 Extreme.
Display Response Times
| ↔ Response Time Black to White | ||
|---|---|---|
| 32 ms ... rise ↗ and fall ↘ combined | ↗ 15.6 ms rise | 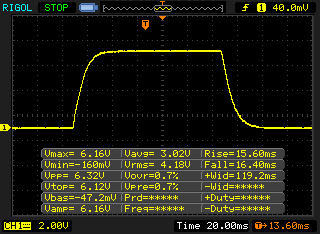 |
| ↘ 16.4 ms fall | ||
| The screen shows slow response rates in our tests and will be unsatisfactory for gamers. In comparison, all tested devices range from 0.1 (minimum) to 240 (maximum) ms. » 85 % of all devices are better. This means that the measured response time is worse than the average of all tested devices (20.2 ms). | ||
| ↔ Response Time 50% Grey to 80% Grey | ||
| 61.6 ms ... rise ↗ and fall ↘ combined | ↗ 30.8 ms rise |  |
| ↘ 30.8 ms fall | ||
| The screen shows slow response rates in our tests and will be unsatisfactory for gamers. In comparison, all tested devices range from 0.165 (minimum) to 636 (maximum) ms. » 96 % of all devices are better. This means that the measured response time is worse than the average of all tested devices (31.6 ms). | ||
Screen Flickering / PWM (Pulse-Width Modulation)
| Screen flickering / PWM not detected | 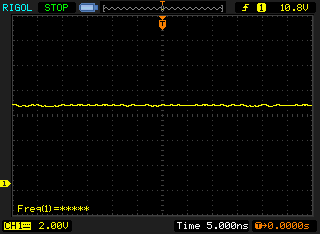 | ||
In comparison: 53 % of all tested devices do not use PWM to dim the display. If PWM was detected, an average of 8098 (minimum: 5 - maximum: 343500) Hz was measured. | |||
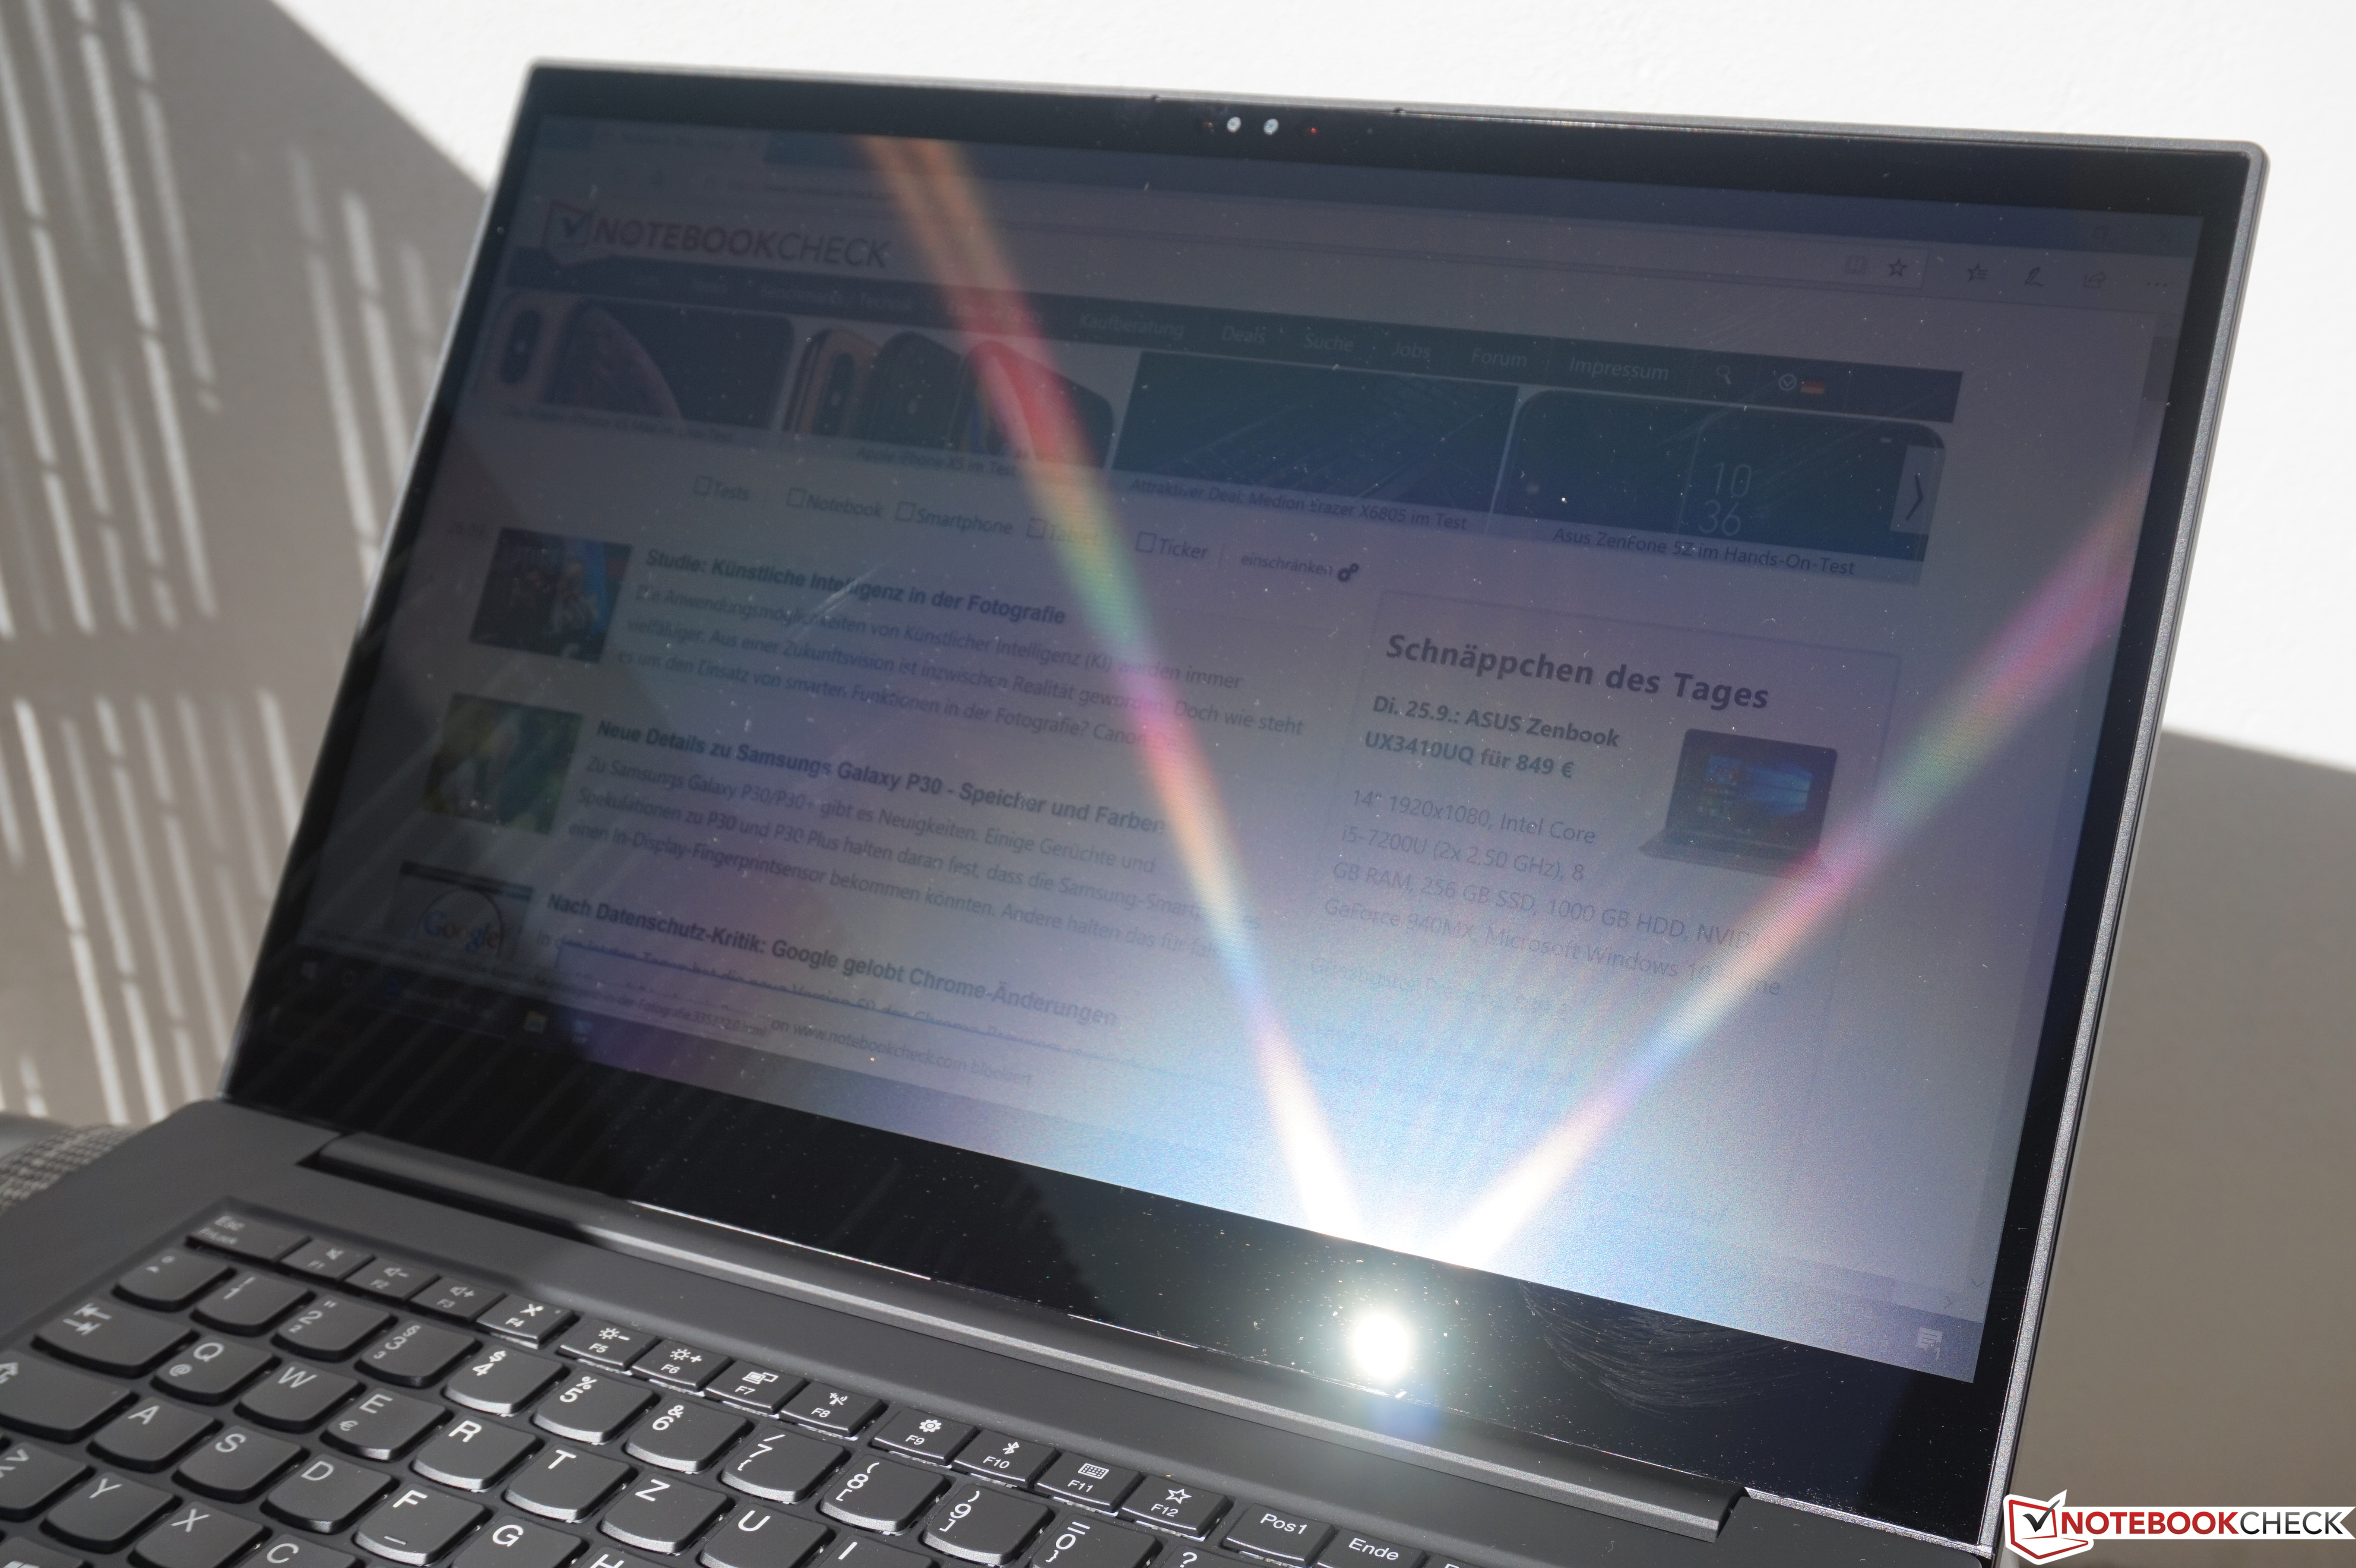
We already mentioned Lenovo offers a matte 1080p display as well as the glossy 4K touchscreen on our test model. If you are often on the road or cannot always influence the position of light sources, you should prefer the matte screen. We will take some comparison pictures once the X1 Extreme with the matte display has arrived.
The screen is not as reflective as the 14-inch screen of the smaller X1 Carbon, but you can still use it as a mirror depending on the position and the light source. It is hard to see anything on the panel when there are reflections. However, the competitors have the same issues and all devices are very similar subjectively, even though Apple and Dell have the advantage of a brighter screen. The viewing angle stability is inconspicuous and very good.

HDR Dolby Vision - only on paper?
Similar to the smaller X1 Carbon, Windows recognizes the screen of the X1 Extreme as HDR display and can show corresponding video. Apps like Netflix and Amazon also show HDR contents. Windows automatically sets the brightness to the maximum level in fullscreen mode, but this is where the issues start. The panel of the X1 Extreme (around 400 nits) is much darker compared to the X1 Carbon and not nearly bright enough for decent HDR playback. It is also just an 8-bit panel, which can only display 256 shades of gray instead of 1024 on a 10-bit panel. The quality of decent HDR TVs cannot be expected. All in all, high-resolution videos look great, but this is also the case for the competitors.

Performance
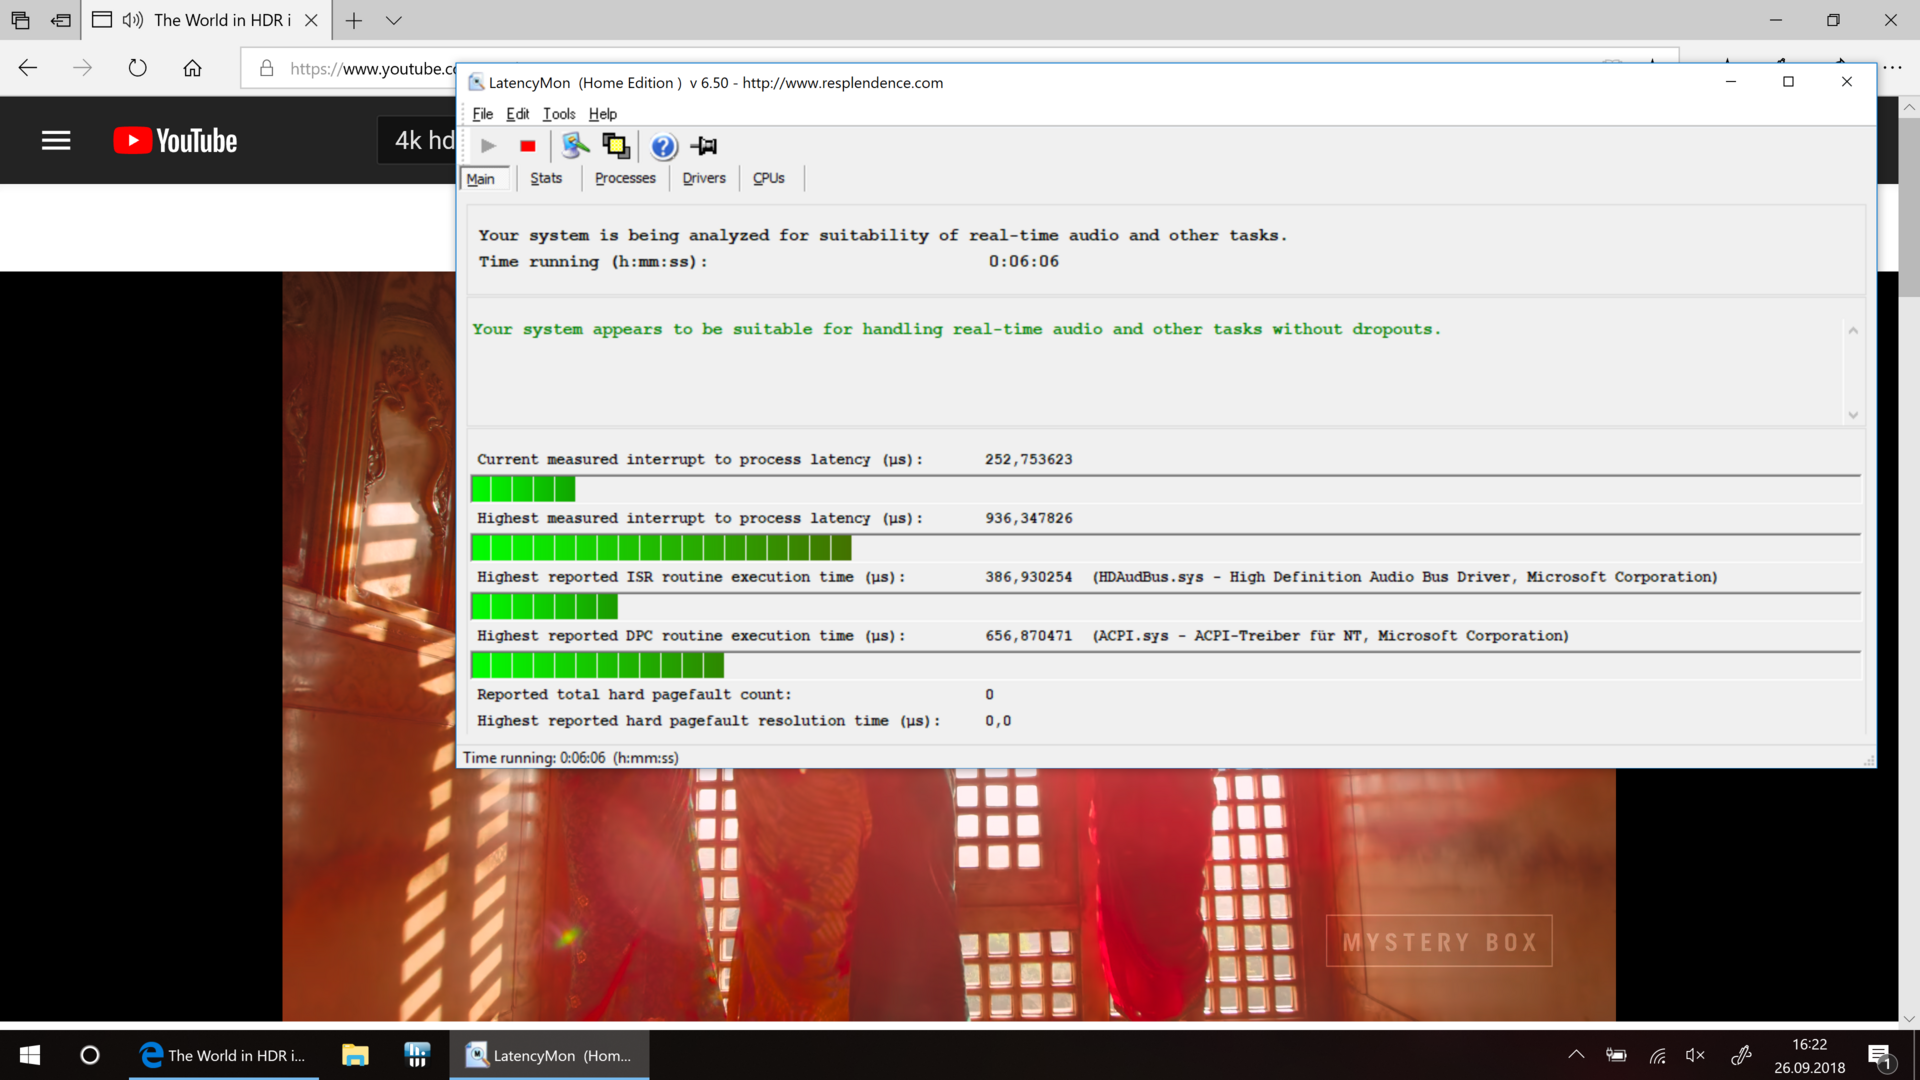
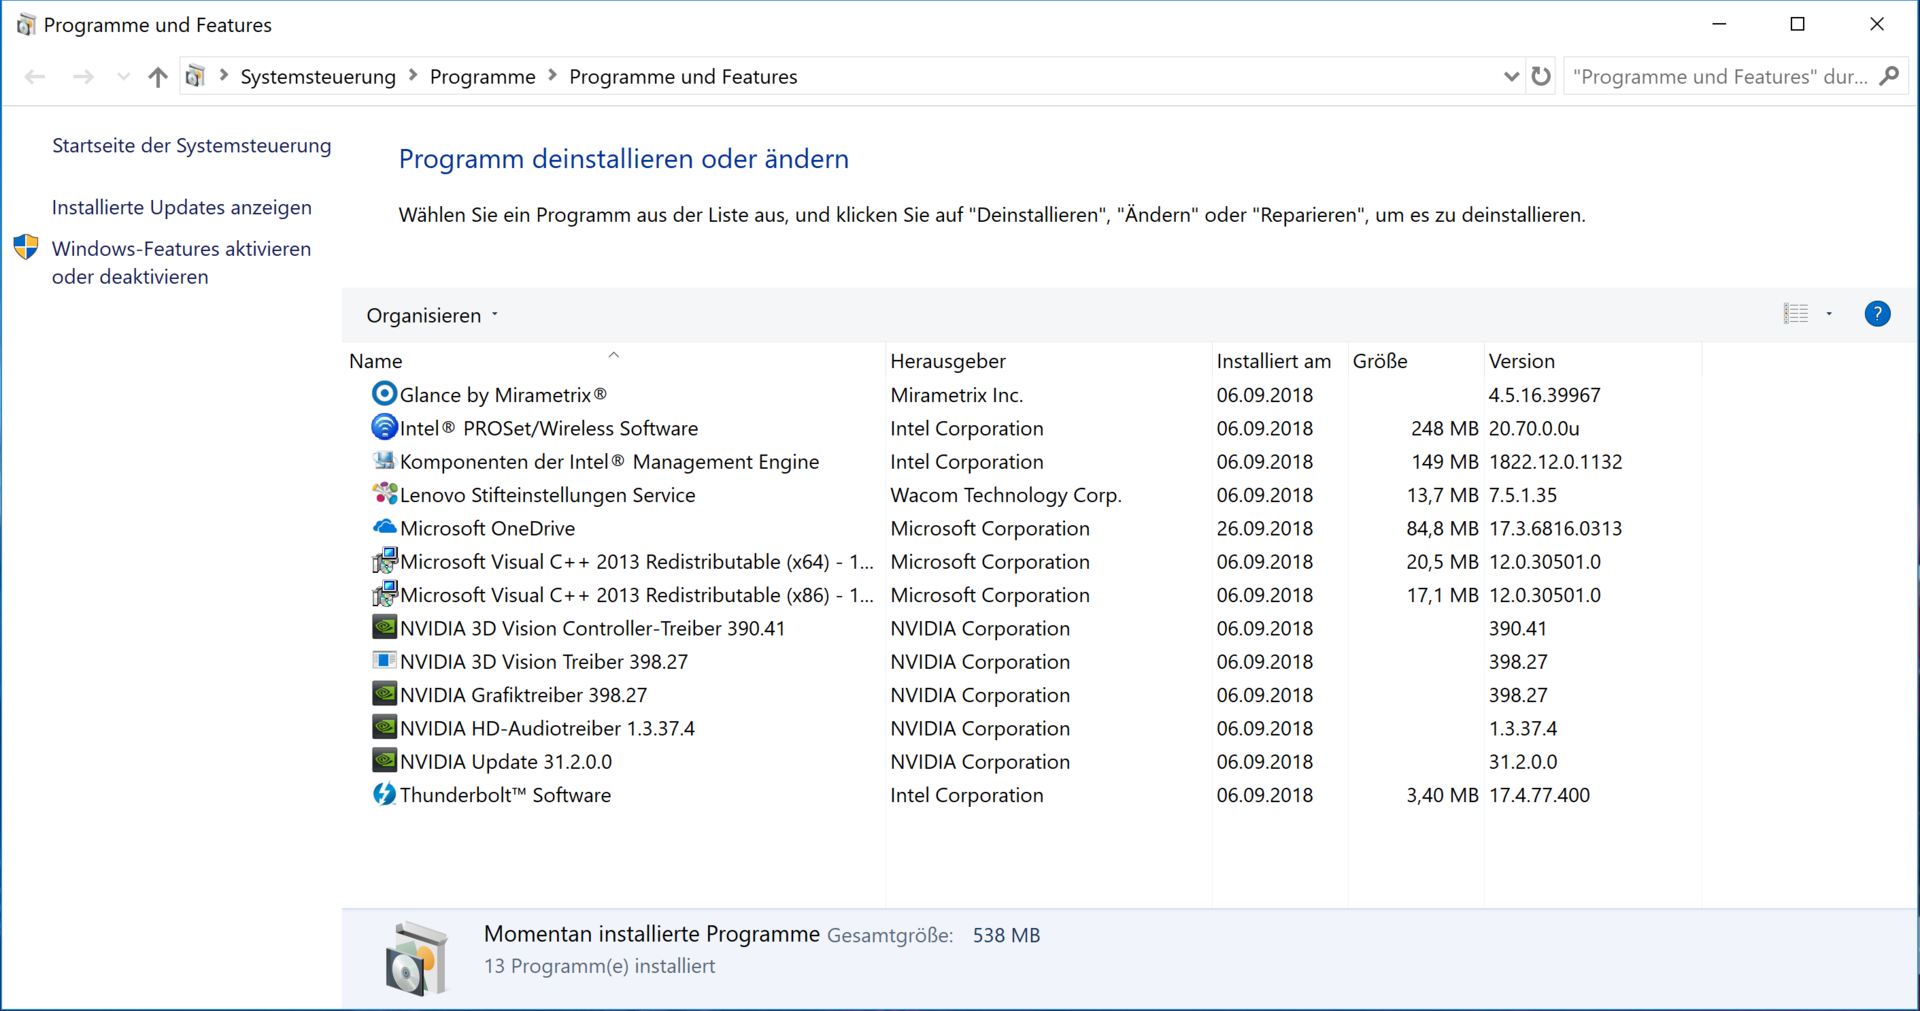
The Lenovo ThinkPad X1 Extreme is a powerful notebook, but the choice of components is limited compared to other ThinkPad models. You can choose between two quad-core (i5-8300H & i5-8400H) and two hexa-core CPUs (i7-8750H & i7-8850H) from Intel's Coffee lake generation. The two more expensive models (i5-8400H & i7-8850H) support Intel's vPro technology and are particularly important for larger companies. There is no Core i9 option, but this is not necessarily a bad thing with a slim chassis. The workstation sibling ThinkPad P1 is also available with Xeon processors (optional). You cannot change the GPU, which is always the Nvidia GeForce GTX 1050 Ti we already know from the Dell XPS 15. It is the more efficient Max-Q version with (supposedly) lower clocks. However, we already saw performance figures similar to a regular GTX 1050 Ti depending on the cooling solution. The X1 Extreme is only available with M.2-NVMe-SSDs, so the subjective performance impression is very good. We did not experience any latency issues with our test model.
Processor - Coffee Lake i7
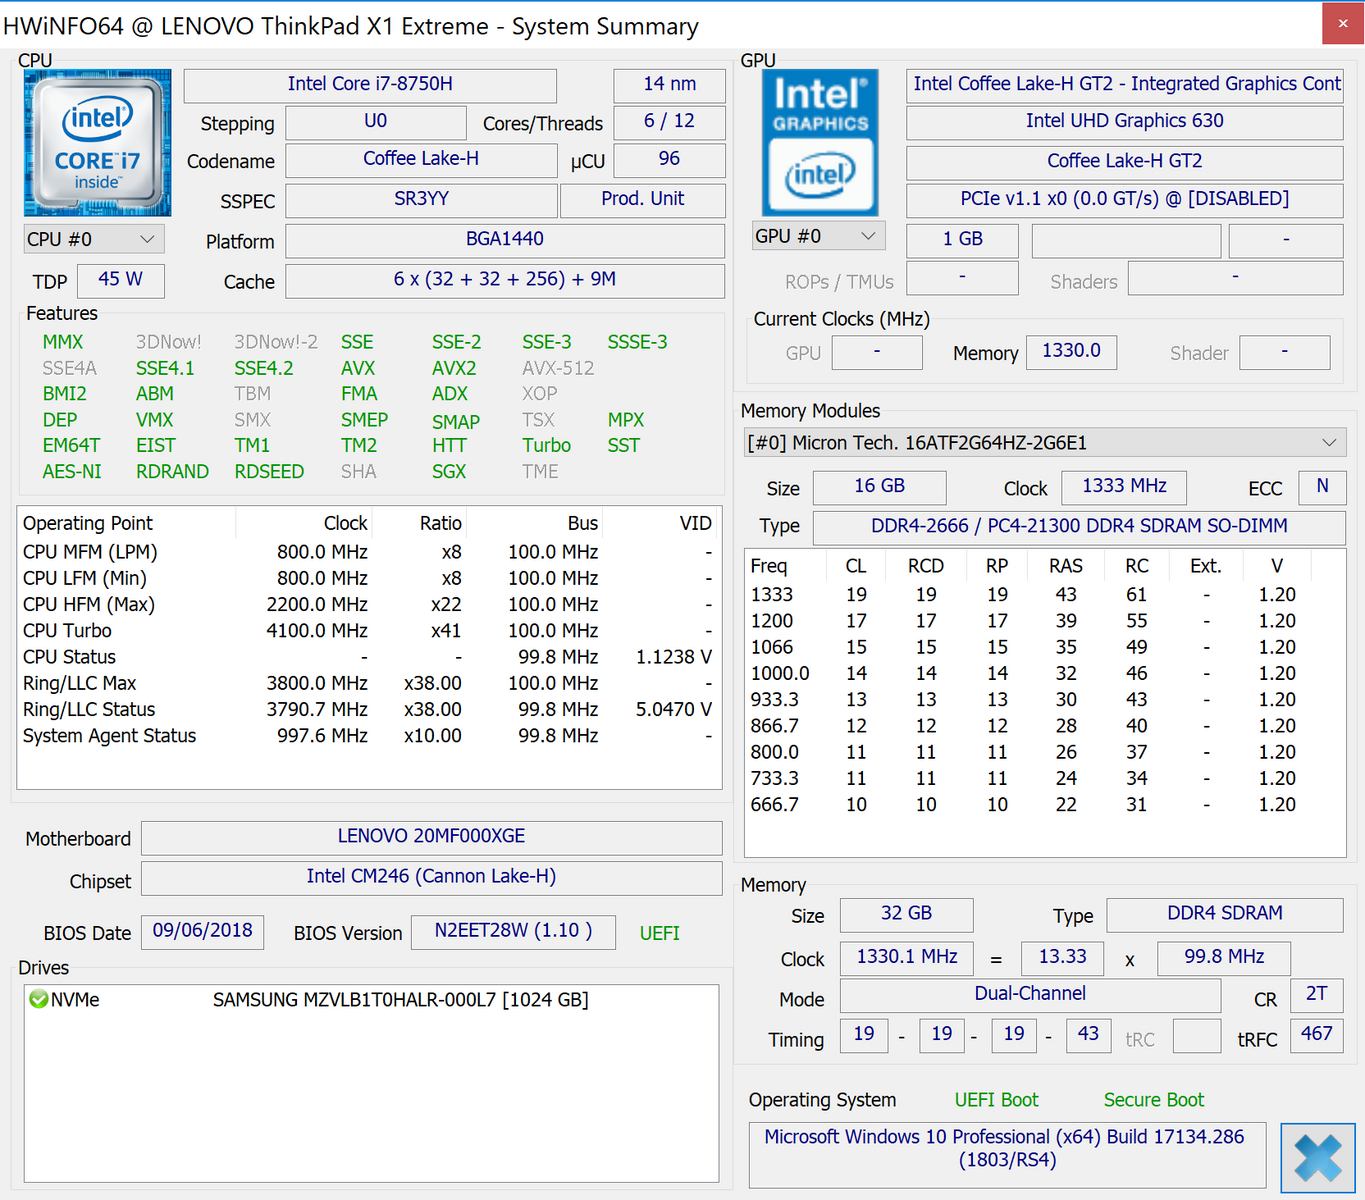
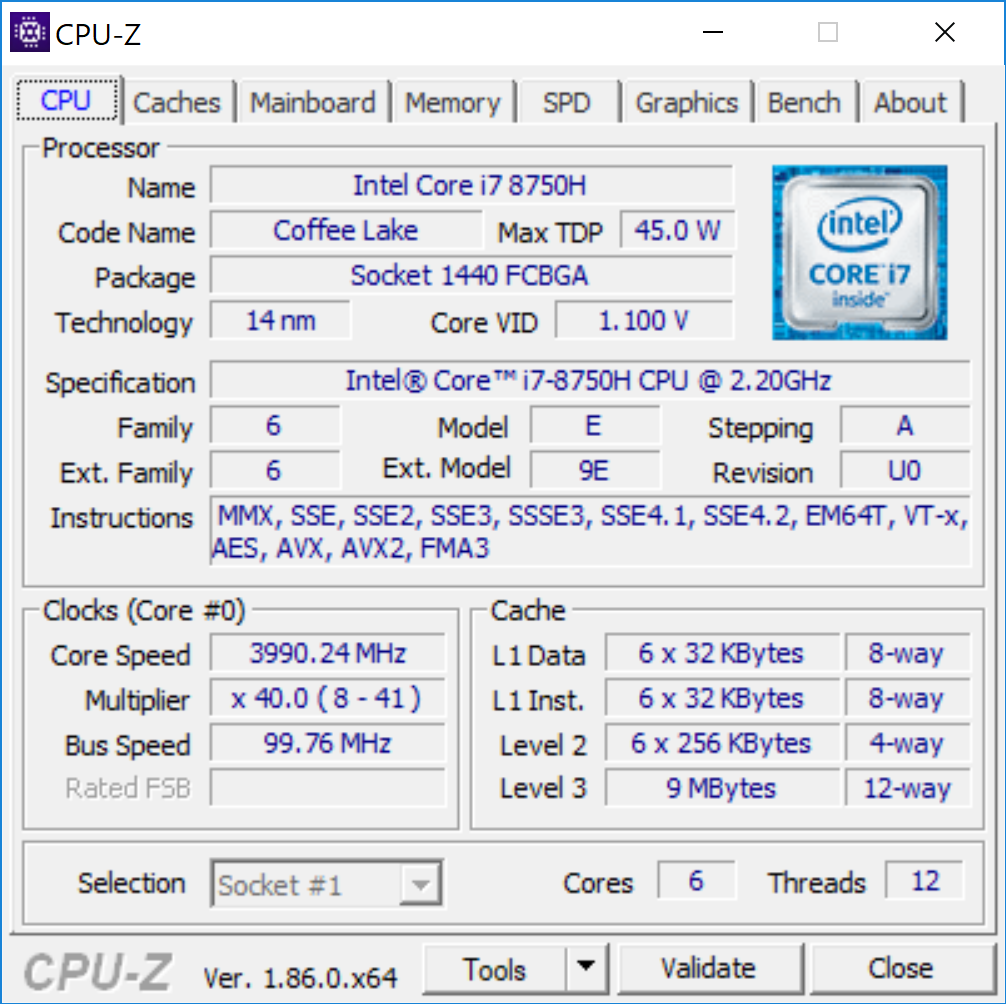
Our test model is equipped with the Intel Core i7-8750H and its six native CPU cores run at a nominal clock of 2.2 GHz. The Turbo frequencies, however, can be much higher: 4.1 for one or two cores, and up to 3.9 GHz for six active cores, at least with sufficient cooling. The processor supports all common features like Hyper Threading and also comes with an integrated GPU, which takes care of the video output during light workloads.
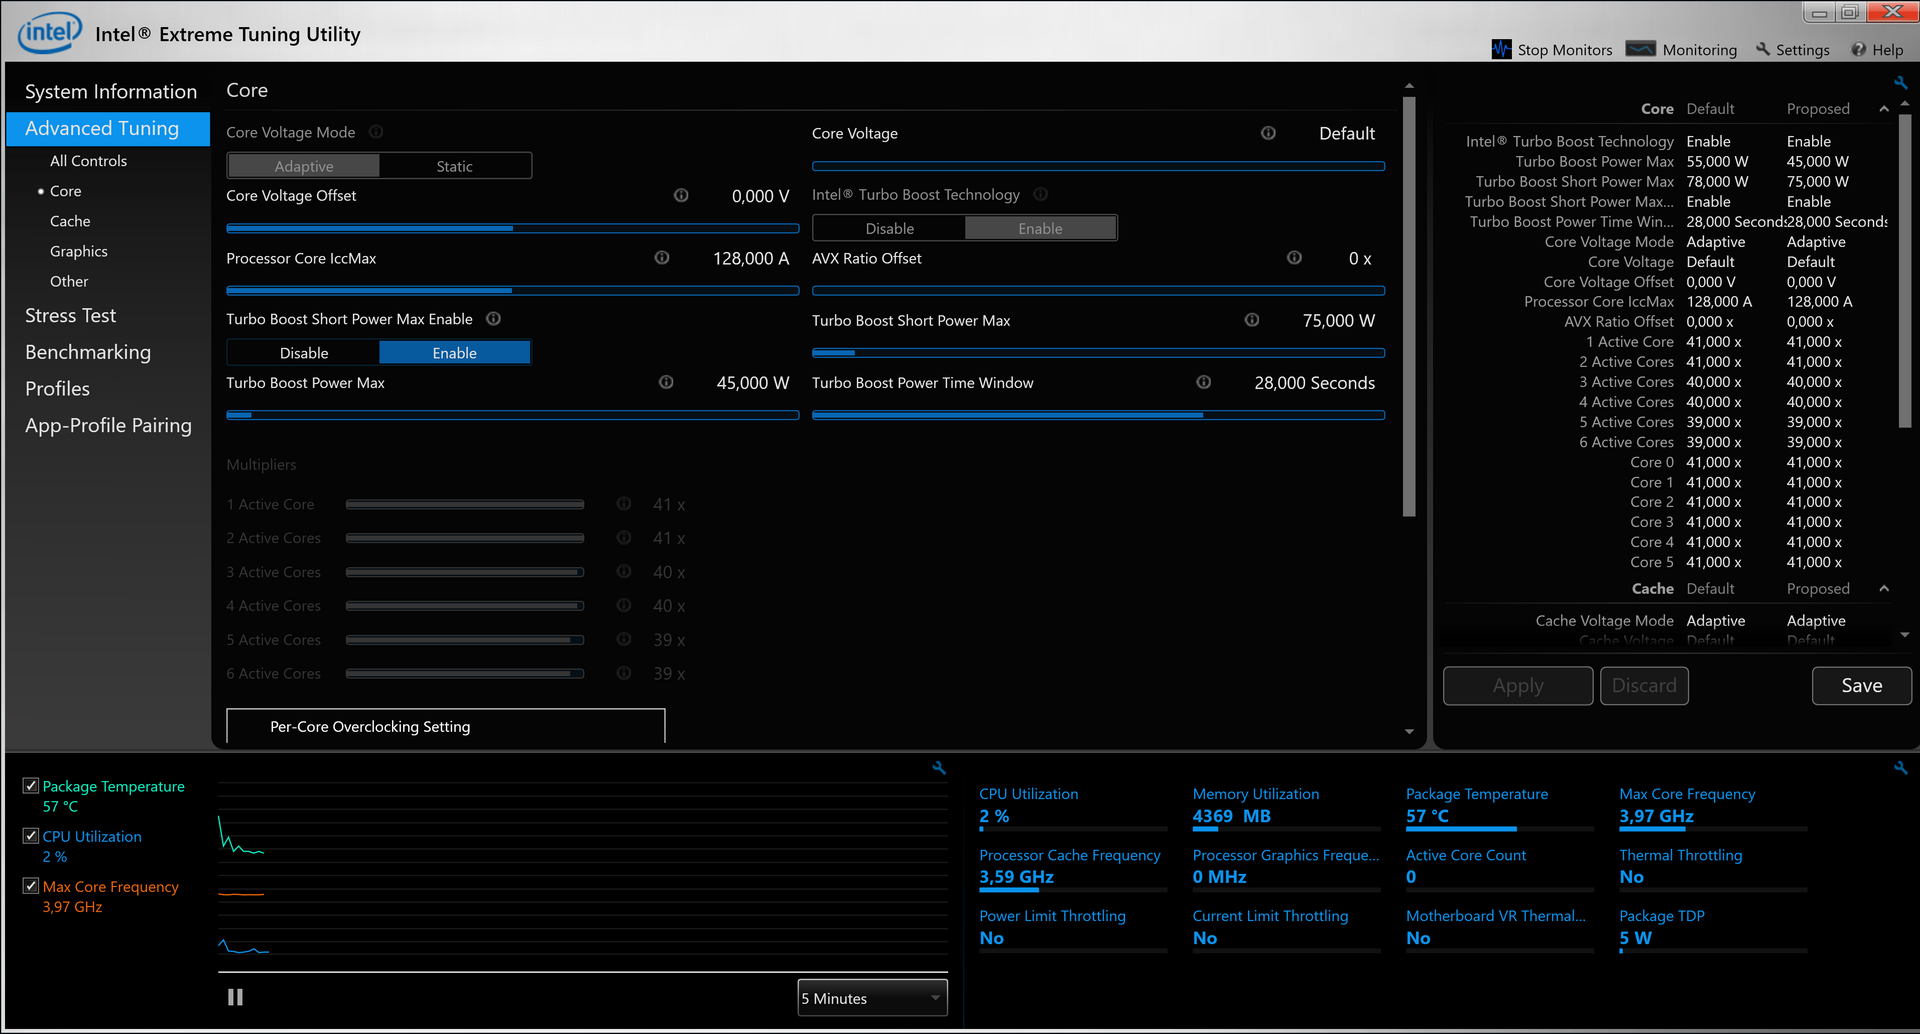
The actual processor clock depends on the cooling capabilities as well as the TDP configuration, which can be adjusted by the OEMs. Lenovo selected rather conservative TDP limits below Intel's recommendation (55/78W). The CPU can consume up to 75W for short periods, but only 45W under sustained workloads. We performed our benchmarks with the default values, but we will also test with other TDP limits and reduce the core voltage as well (undervolting). For now, we start with the regular Cinebench scores.
The new ThinkPad X1 Extreme performs very well in the Cinebench R15 Multi test and is only beaten by the Dell XPS 15 9570 with the identical Core i7 processor but slightly higher TDP limits. Apple's MacBook Pro 15 2018 with the slightly faster Core i7-8850H on the other hand is a bit slower (even after Apple's major software updates). HP's EliteBook 1050 G1 is similar to the ThinkPad. Our test also shows the big gap compared to the ULV chips in the smaller ThinkPad X1 Carbon as well as the 15.6-inch ThinkPad T580, which fall behind by more than 40%.
There are, however, limitations on battery power. We set all the BIOS options to maximum performance, but the CPU cannot utilize its Turbo Boost and only runs at 2.0 GHz during the Cinebench R15 Multi test, which results in just 648 points.
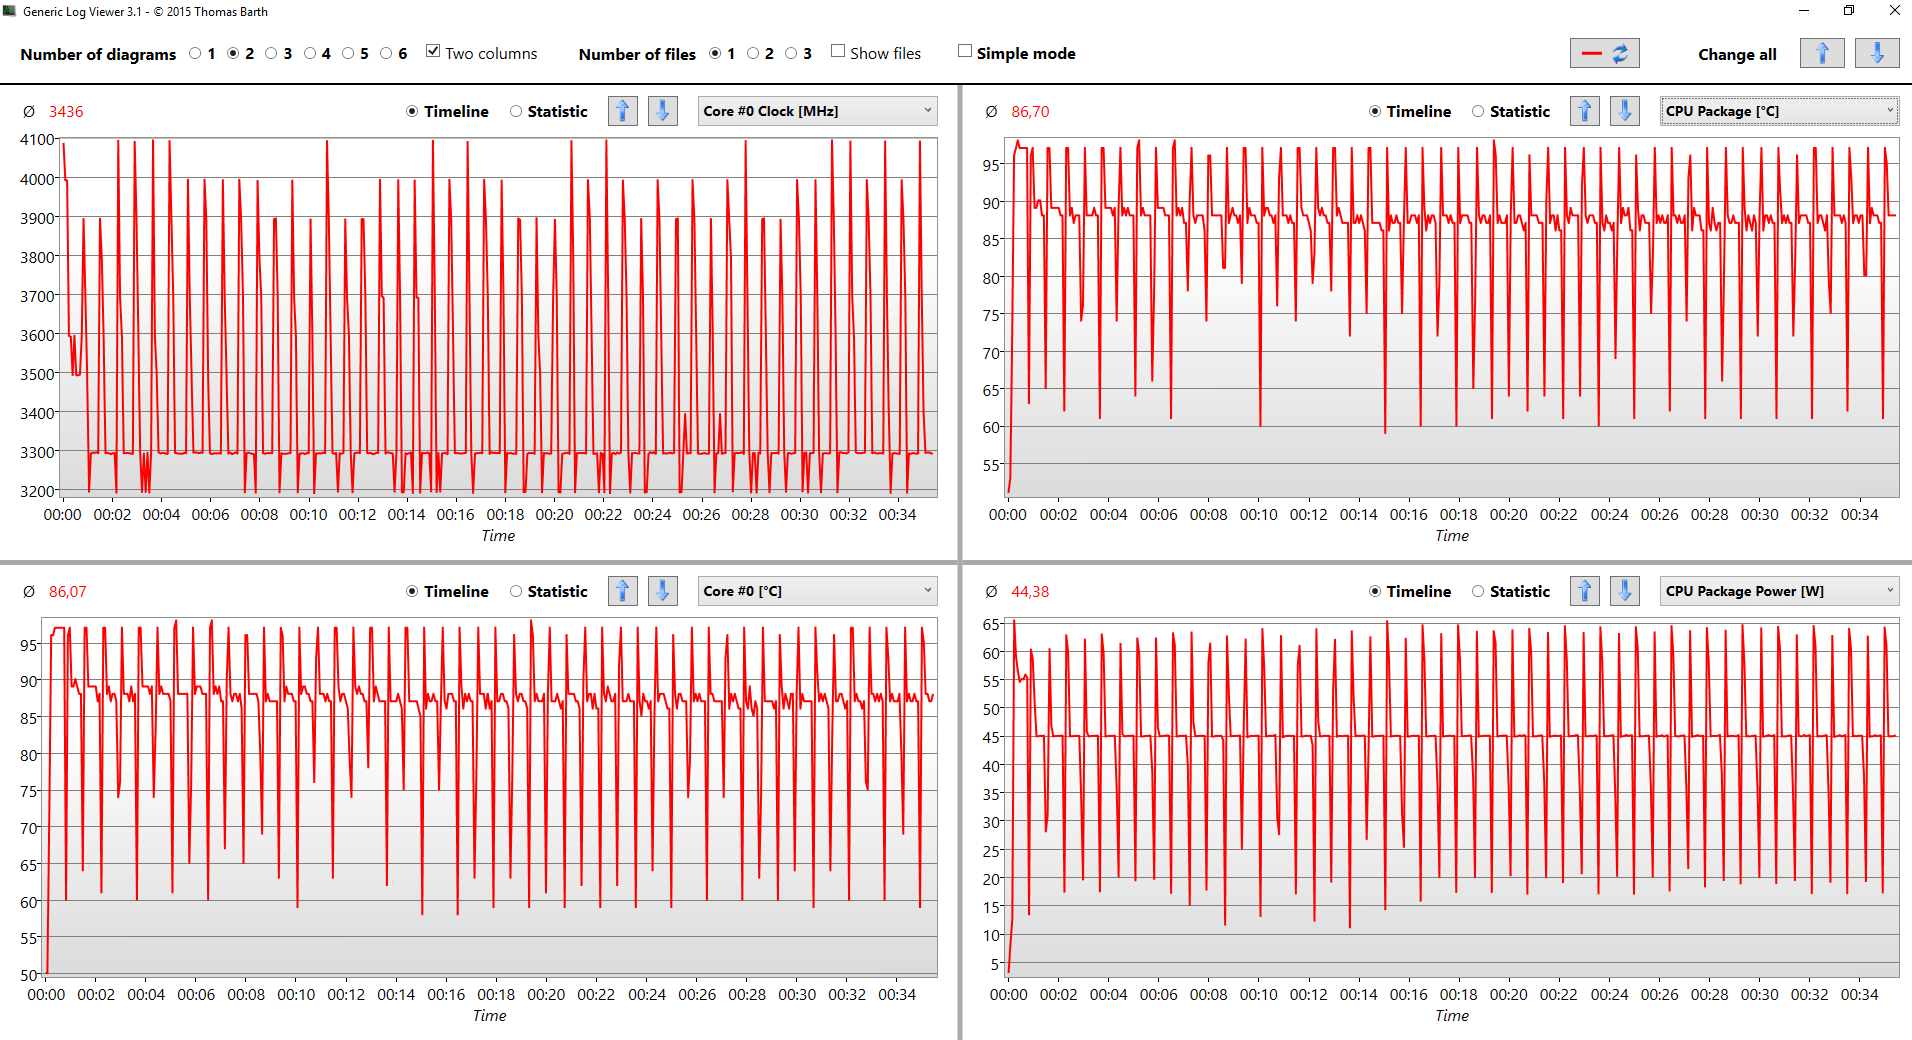
It is always interesting to see how slim devices handle sustained workloads and not just short benchmarks with runtimes between 30-45 seconds. Our Cinebench Multi loop with 50 runs only shows a small drop of the score to ~1060 points, despite the conservative 45W limit. A more detailed analysis shows an average clock of 3.4 GHz for all six cores in combination with a core temperature of around 87 °C, so there is still some headroom. We ignore the undervolted results of the Dell XPS 15 for now (we will try this with the X1 Extreme as well) and see that the test model is ahead of the competition including the Apple MacBook Pro 15 with the supposedly faster i7-8850H.
CPU Tuning
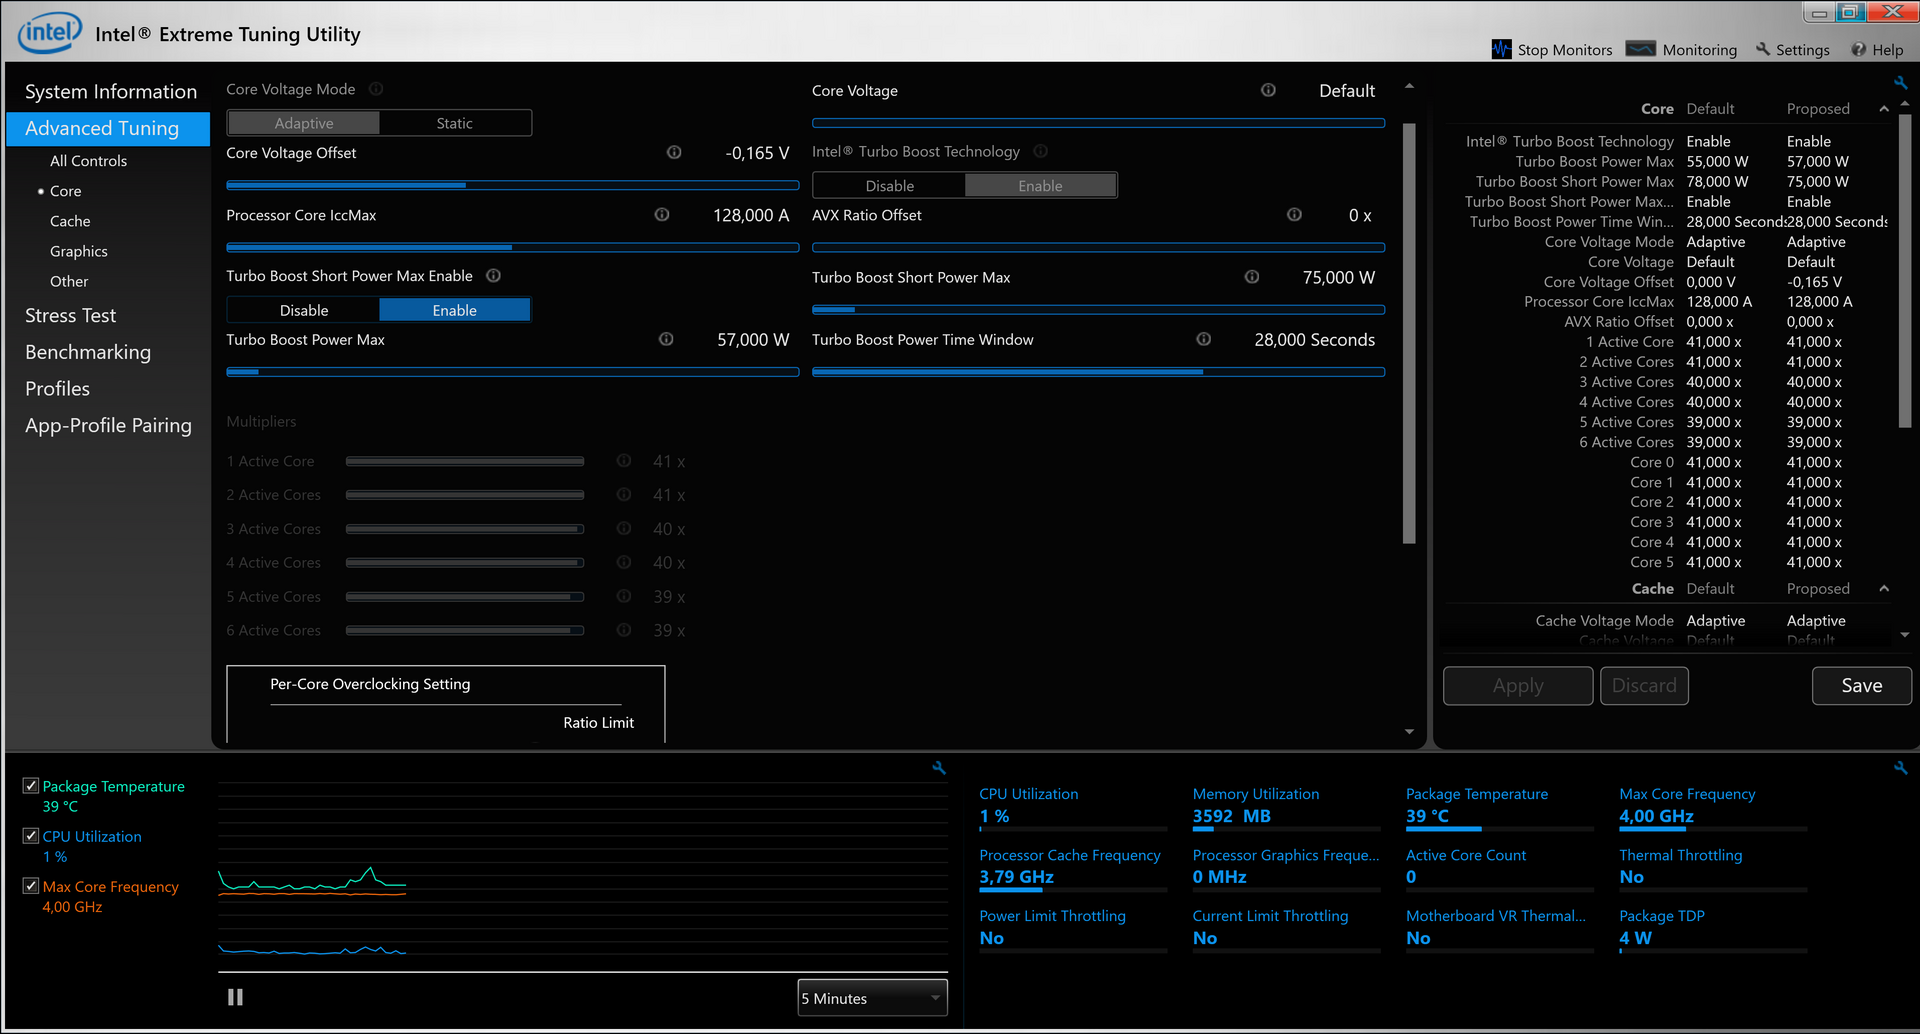
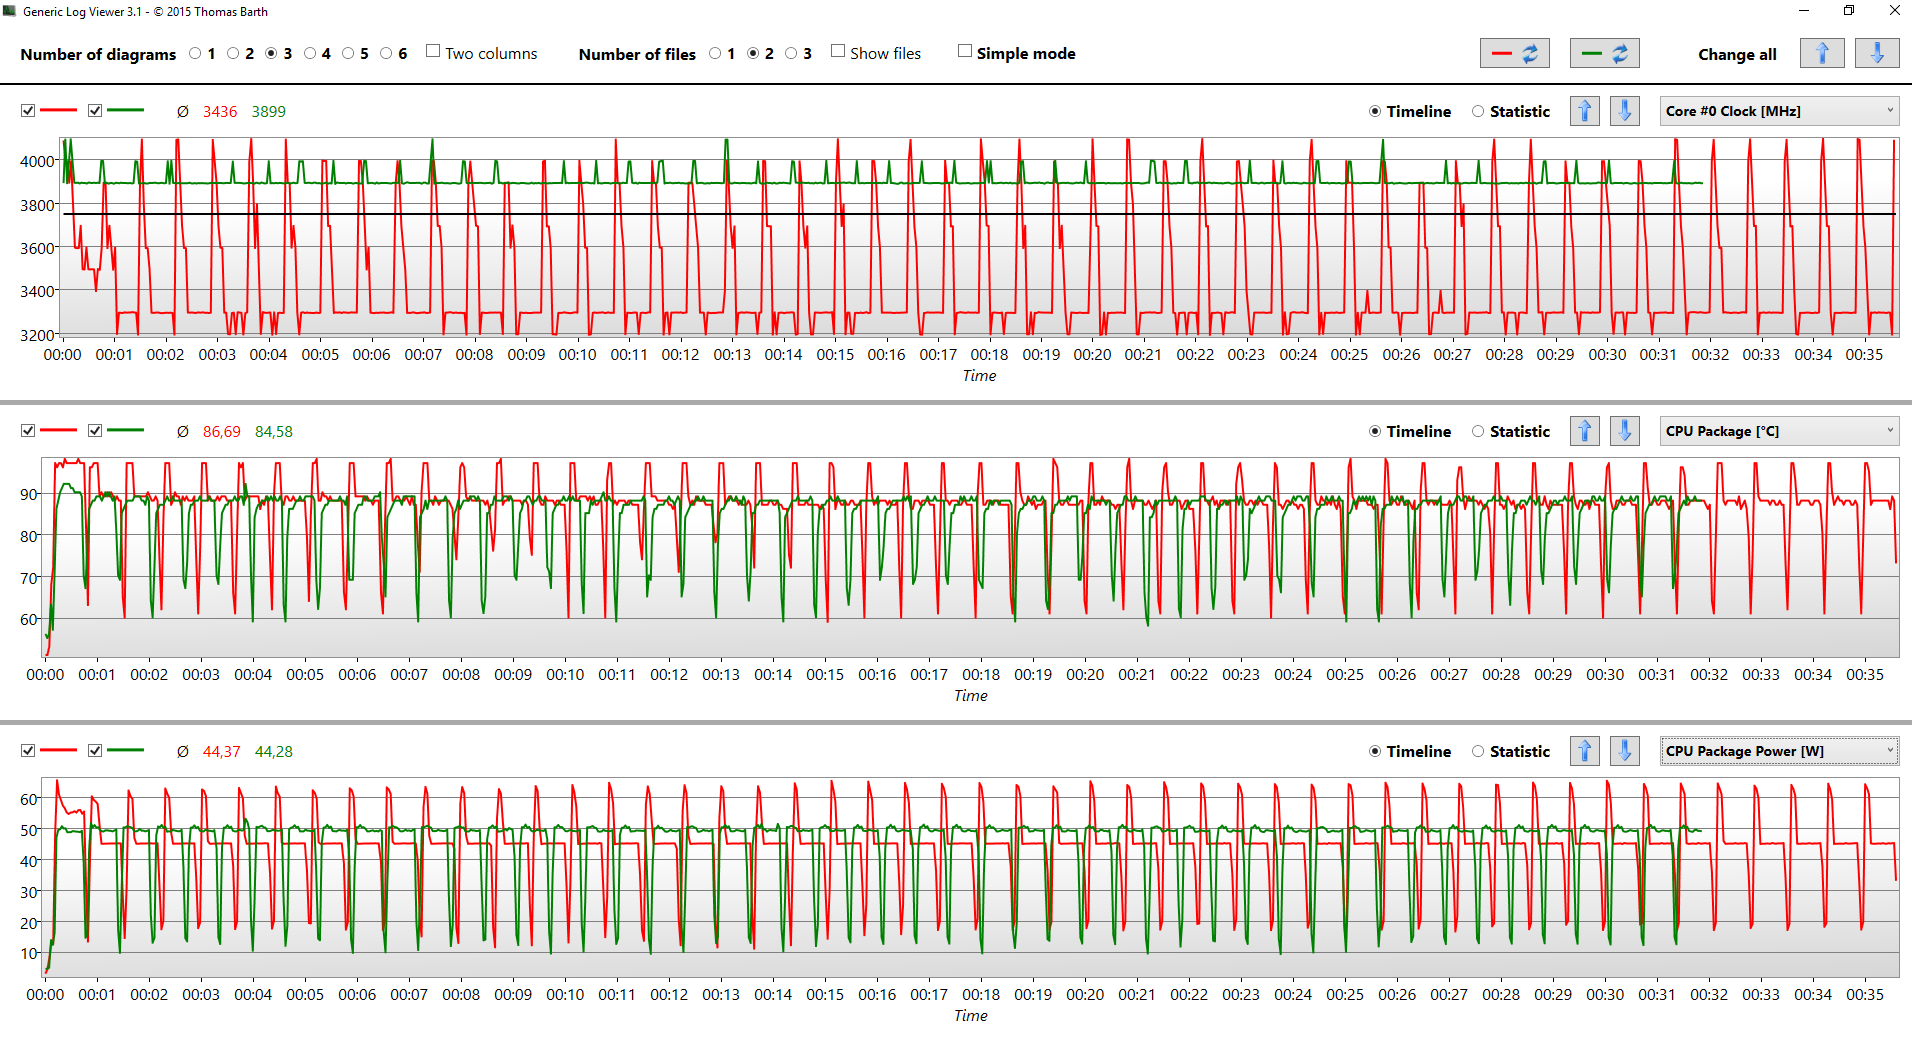
There are two ways to improve the processor performance: Increase the TDP limits and reduce the core voltage (undervolting). Especially slim devices often have problems with increased TDP limits or are often already struggling with the original settings under sustained workloads. However, the 45W limit on the test unit of the X1 Extreme is rather conservative, so we set it to 57W for sustained workloads. We also reduced the core voltage at the same time with the tool Intel XTU. Please see our dedicated guide for detailed instructions on the undervolting process. Every processor is different and the results can vary. We managed to operate the Core i7-8750H at -0.165 mV, which has a massive effect on the power consumption and therefore the performance.
The processor now only needs about 50W for 6x 3.9 GHz during the Cinebench Multi test, and the system can maintain this level of performance. This results in excellent scores during our Cinebench loop, because all the results are north of 1200 points with two minor exceptions. The average results after 50 runs is 1.218 points. The CPU temperature is still 2 degrees lower. The ThinkPad X1 Extreme is therefore even better than the undervolted XPS 15, which was already very fast. The other rivals are clearly beaten. Our extreme torture test with Prime95 is even more stressful for the CPU and the full 6x 3.9 GHz require around 61W, but we still see strong 3.65 GHz once the 57W limit sets in. All in all a very good performance for a slim device.
System Performance
The subjective performance impression of the ThinkPad X1 Extreme is very good with short boot times, responsive handling, and minor waiting times when you launch applications. The base SKU of the X1 Extreme is also equipped with an NVMe-SSD, so the system performance of this model should be similar. There are differences between the individual devices in the synthetic benchmarks and the test unit is often just average within the comparison, but you cannot notice these differences in practice.
| PCMark 8 Home Score Accelerated v2 | 3611 points | |
| PCMark 8 Creative Score Accelerated v2 | 4725 points | |
| PCMark 8 Work Score Accelerated v2 | 4381 points | |
| PCMark 10 Score | 4785 points | |
Help | ||
Storage Devices - Samsung PM981 NVMe-SSD
The ThinkPad X1 Extreme can accommodate two M.2-2280 NVMe-SSDs (attached via PCIe-x4 each). Our test unit is equipped with Samsung's PM981 in the 1 TB configuration and you can use around 914 GB after the initial set-up. The performance of the storage drive is excellent and the write performance in particular is ahead of the competition. However, all models here have fast storage drives and you won't notice a subjective difference in practice. Lenovo uses different suppliers, so your X1 Extreme might be equipped with another drive. See our comprehensive HDD/SSD list for more benchmarks and comparisons.
| Lenovo ThinkPad X1 Extreme-20MF000XGE Samsung SSD PM981 MZVLB1T0HALR | Dell XPS 15 9570 i7 UHD Toshiba XG5 KXG50ZNV512G | HP EliteBook 1050 G1-4QY20EA Toshiba XG5-P KXG50PNV2T04 | Lenovo ThinkPad X1 Carbon 2018-20KGS03900 Samsung SSD PM981 MZVLB512HAJQ | Lenovo ThinkPad T580-20LAS01H00 Samsung SSD PM981 MZVLB512HAJQ | Average Samsung SSD PM981 MZVLB1T0HALR | |
|---|---|---|---|---|---|---|
| CrystalDiskMark 5.2 / 6 | -24% | -30% | -3% | -31% | 6% | |
| Write 4K (MB/s) | 123.7 | 79.1 -36% | 94.8 -23% | 131.9 7% | 131.4 6% | 165.7 ? 34% |
| Read 4K (MB/s) | 44.07 | 37.89 -14% | 26.45 -40% | 44.6 1% | 29.47 -33% | 44.6 ? 1% |
| Write Seq (MB/s) | 2215 | 1119 -49% | 1037 -53% | 1824 -18% | 878 -60% | 1982 ? -11% |
| Read Seq (MB/s) | 2242 | 1852 -17% | 1280 -43% | 2163 -4% | 883 -61% | 1764 ? -21% |
| Write 4K Q32T1 (MB/s) | 313.9 | 361.1 15% | 277.6 -12% | 338.1 8% | 256 -18% | 395 ? 26% |
| Read 4K Q32T1 (MB/s) | 359.8 | 257.9 -28% | 333.9 -7% | 351.9 -2% | 337.7 -6% | 434 ? 21% |
| Write Seq Q32T1 (MB/s) | 2404 | 1131 -53% | 1037 -57% | 1972 -18% | 1723 -28% | 2351 ? -2% |
| Read Seq Q32T1 (MB/s) | 3333 | 3096 -7% | 3135 -6% | 3387 2% | 1778 -47% | 3234 ? -3% |
| Write 4K Q8T8 (MB/s) | 1044 | 1408 ? | ||||
| Read 4K Q8T8 (MB/s) | 914 | 1449 ? |

GPU Performance - GeForce GTX 1050 Ti Max-Q
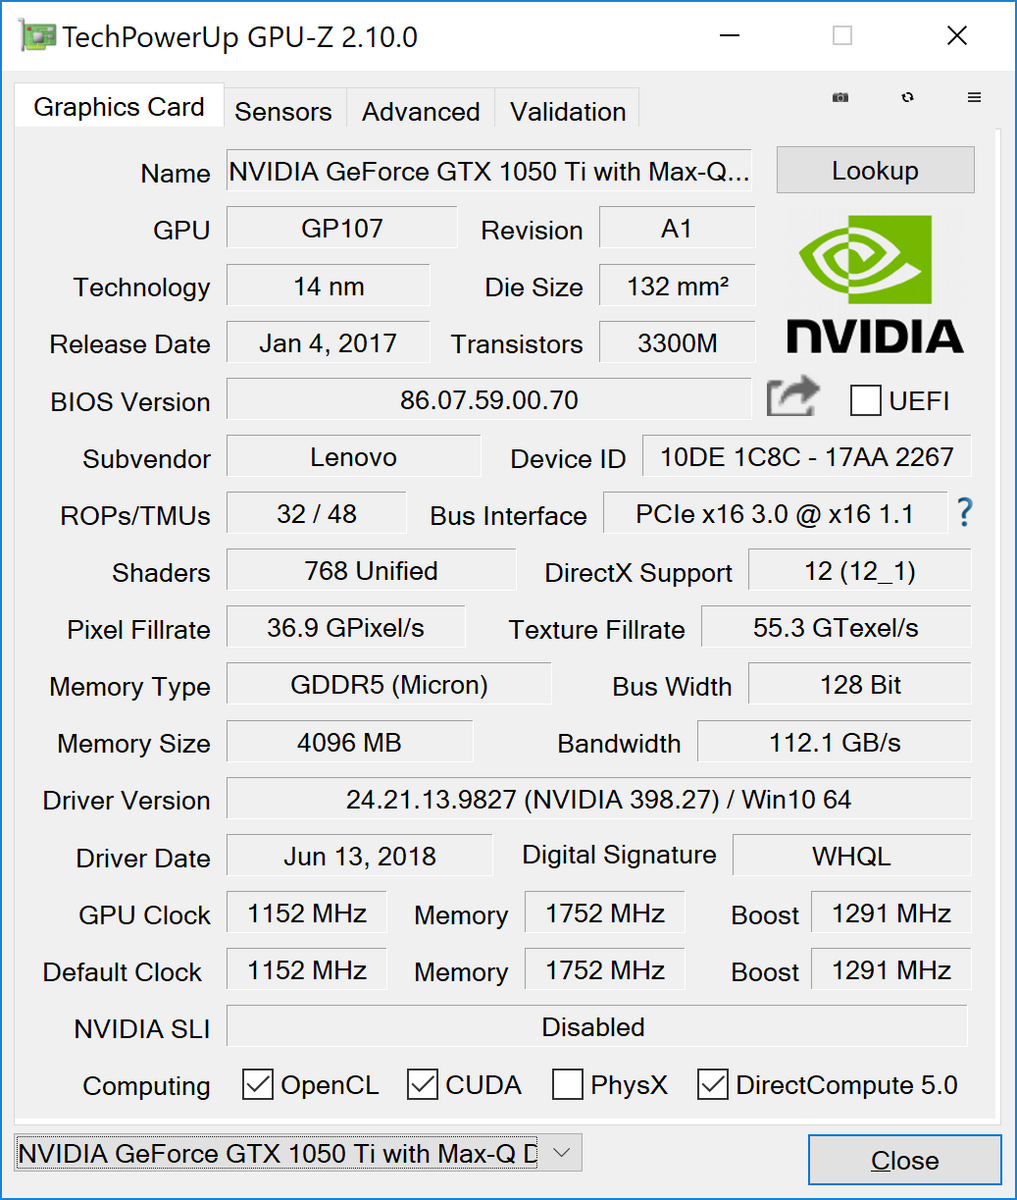
There are more and more devices with the Max-Q version of the GeForce GTX 1050 Ti. We recently reviewed the efficient (and supposedly slower) version of the GTX 1050 Ti in the Dell XPS 15 9570. Nvidia has special requirements for Max-Q models (power consumption, fan noise during gaming), which are usually realized with lower clocks. However, the GTX 1050 Ti Max-Q in the XPS 15 was just as fast as a regular GTX 1050 Ti thanks to sufficient cooling capabilities. This is also the case for the ThinkPad X1 Extreme, because the official Boost frequency of 1291 MHz is clearly surpassed with up to 1695 MHz (Witcher 3).
Our test model is just behind the Dell XPS 15 with the same GTX 1050 Ti Max-Q in the synthetic 3DMark tests, but faster than the Radeon Pro 560X in the MacBook as well as the GTX 1050 Max-Q in the EliteBook 1050 G1; the X1 Extreme is between 14 - 38% faster depending on the benchmark. The smaller GeForce MX150 in the ThinkPad T580 is even slower. The X1 Extreme also passed the demanding Time Spy stress test without any problems (99.8%).
We already mentioned the integrated UHD Graphics 630 of the processor. Nvidia's Optimus technology automatically selects the graphics adapter based on the workload. The iGPU is much more efficient if you don't need the additional performance, and the powerful video decoder is also perfect for the playback of high-resolution videos/movies.
The GPU performance is slightly reduced on battery power with a graphics score of 6311 points compared to 7199 points on mains (3DMark Fire Strike).
| 3DMark 11 Performance | 8886 points | |
| 3DMark Fire Strike Score | 6424 points | |
| 3DMark Time Spy Score | 2361 points | |
Help | ||
Gaming Performance
We encountered some issues during our gaming benchmarks, because some titles refused to start with the preloaded driver version 398.27. We then tried to download the latest drivers from Nvidia, but the installation failed because the installation routine did not find compatible hardware. We found an update for the Intel & Nvidia GPU from September 26th on Lenovo's website, which updates the Nvidia drives to version 399.11. Most games worked, only Assassin's Creed crashed repeatedly and the drivers from Nvidia still refused to install. This could be a problem when you ant to play the latest games, because drivers from the manufacturer are usually released with some delay.
The good news first: The gaming performance is steady, which is also shown by our Witcher 3. Contrary to the stress test (see Temperature section), the CPU load during gaming is much lower and not all the cores are fully utilized all the time. The average results during the Witcher 3 test are 1392 MHz/73 °C for the GPU and 3,7 GHz/69 °C for the CPU. The performance is slightly reduced on battery power; instead of 24.9 fps (Witcher 3 Ultra) we only determine 23 fps.
The gaming performance is very good for this CPU/GPU combination and the ThinkPad X1 Extreme changes the top spot of the ranking with the Dell XPS 15 depending on the title. Both the HP EliteBook 1050 G1 as well as the Apple MacBook Pro 15 are slower. The X1 Extreme can handle many modern games in high details and 1080p, but the performance is usually not sufficient for the native 4K resolution.
| The Witcher 3 | |
| 1920x1080 Ultra Graphics & Postprocessing (HBAO+) | |
| Average of class Multimedia (11 - 121, n=28, last 2 years) | |
| Average NVIDIA GeForce GTX 1050 Ti Max-Q (23.5 - 43, n=7) | |
| Dell XPS 15 9570 i7 UHD | |
| Lenovo ThinkPad X1 Extreme-20MF000XGE | |
| Apple MacBook Pro 15 2018 (2.6 GHz, 560X) | |
| HP EliteBook 1050 G1-4QY20EA | |
| Lenovo ThinkPad T580-20LAS01H00 | |
| 1920x1080 High Graphics & Postprocessing (Nvidia HairWorks Off) | |
| Average of class Multimedia (22 - 242, n=27, last 2 years) | |
| Dell XPS 15 9570 i7 UHD | |
| Average NVIDIA GeForce GTX 1050 Ti Max-Q (42.6 - 60, n=6) | |
| Lenovo ThinkPad X1 Extreme-20MF000XGE | |
| Apple MacBook Pro 15 2018 (2.6 GHz, 560X) | |
| HP EliteBook 1050 G1-4QY20EA | |
| Lenovo ThinkPad T580-20LAS01H00 | |
| BioShock Infinite - 1920x1080 Ultra Preset, DX11 (DDOF) | |
| Dell XPS 15 9570 i7 UHD | |
| Lenovo ThinkPad X1 Extreme-20MF000XGE | |
| Average NVIDIA GeForce GTX 1050 Ti Max-Q (71.3 - 74.6, n=5) | |
| HP EliteBook 1050 G1-4QY20EA | |
| Apple MacBook Pro 15 2018 (2.6 GHz, 560X) | |
| Lenovo ThinkPad T580-20LAS01H00 | |
| low | med. | high | ultra | 4K | |
|---|---|---|---|---|---|
| BioShock Infinite (2013) | 262 | 204 | 183.3 | 73 | |
| The Witcher 3 (2015) | 138.6 | 82.6 | 46 | 24.9 | 16.4 |
| Rainbow Six Siege (2015) | 236.6 | 154.6 | 90.2 | 67.5 | 27.7 |
| Rise of the Tomb Raider (2016) | 141.7 | 85.7 | 47.4 | 40.5 | 17.1 |
| The Division (2016) | 137.2 | 89.5 | 41.9 | 32.2 | 14.6 |
| Battlefield 1 (2016) | 154.8 | 120 | 58.1 | 53.1 | 20.7 |
| For Honor (2017) | 179.3 | 68.2 | 64.9 | 50.4 | 19.2 |
| Ghost Recon Wildlands (2017) | 96.7 | 45.9 | 41.9 | 22.4 | 13.9 |
| Far Cry 5 (2018) | 91 | 48 | 44 | 41 | 13 |
| F1 2018 (2018) | 134 | 80 | 62 | 38 | 17 |
| Shadow of the Tomb Raider (2018) | 97 | 39 | 35 | 29 | 11 |
Emissions
System Noise
The two fans are basically very quiet and you can enjoy a silent device while idling and during light workloads most of the time. Most of the time since the fans will occasionally spin up for no apparent reason, similar to the smaller ThinkPad X1 Extreme. It is not annoying at 31.1 dB(A), but you notice it because it is otherwise silent.
The passive cooling capabilities do not seem to be very good, because the fans start spinning even after short peak load. We can detect three different fan levels: 33.7 dB(A), 36.4 dB(A), and 39.2 dB(A). This means the X1 Extreme is comparatively quiet under load, especially considering the powerful components. We saw that there is CPU throttling during the stress test (see next section), so the fans do not stay at the highest level and will level out at 36.4 dB(A). The noise usually fluctuates between 33.7 and 36.4 dB(A) during gaming, depending on the CPU workload. Less noise is obviously better, but we would have preferred a steady noise level in practice. This can probably be fixed via update.
We did not hear any electronic noises or coil whine so far, which is a good thing.
Noise level
| Idle |
| 28.8 / 28.8 / 31.3 dB(A) |
| Load |
| 36.4 / 39.2 dB(A) |
 | ||
30 dB silent 40 dB(A) audible 50 dB(A) loud |
||
min: | ||
| Lenovo ThinkPad X1 Extreme-20MF000XGE GeForce GTX 1050 Ti Max-Q, i7-8750H, Samsung SSD PM981 MZVLB1T0HALR | Dell XPS 15 9570 i7 UHD GeForce GTX 1050 Ti Max-Q, i7-8750H, Toshiba XG5 KXG50ZNV512G | HP EliteBook 1050 G1-4QY20EA GeForce GTX 1050 Max-Q, i7-8750H, Toshiba XG5-P KXG50PNV2T04 | Lenovo ThinkPad X1 Carbon 2018-20KGS03900 UHD Graphics 620, i5-8550U, Samsung SSD PM981 MZVLB512HAJQ | Lenovo ThinkPad T580-20LAS01H00 GeForce MX150, i5-8550U, Samsung SSD PM981 MZVLB512HAJQ | Apple MacBook Pro 15 2018 (2.6 GHz, 560X) Radeon Pro 560X, i7-8850H, Apple SSD AP0512 | |
|---|---|---|---|---|---|---|
| Noise | -3% | -8% | 2% | -0% | -8% | |
| off / environment * (dB) | 28.8 | 29.9 -4% | 30.25 -5% | 28.9 -0% | 29.3 -2% | 29.6 -3% |
| Idle Minimum * (dB) | 28.8 | 29.9 -4% | 30.25 -5% | 28.9 -0% | 29.3 -2% | 30.1 -5% |
| Idle Average * (dB) | 28.8 | 29.9 -4% | 30.25 -5% | 28.9 -0% | 29.3 -2% | 30.1 -5% |
| Idle Maximum * (dB) | 31.3 | 30.3 3% | 31.8 -2% | 32.5 -4% | 31.8 -2% | 30.1 4% |
| Load Average * (dB) | 36.4 | 36.5 -0% | 44.7 -23% | 35.1 4% | 35.8 2% | 46.8 -29% |
| Witcher 3 ultra * (dB) | 36.4 | 40.4 -11% | 35.8 2% | 36 1% | ||
| Load Maximum * (dB) | 39.2 | 40.4 -3% | 42 -7% | 35.1 10% | 38 3% | 46.8 -19% |
* ... smaller is better
Temperature
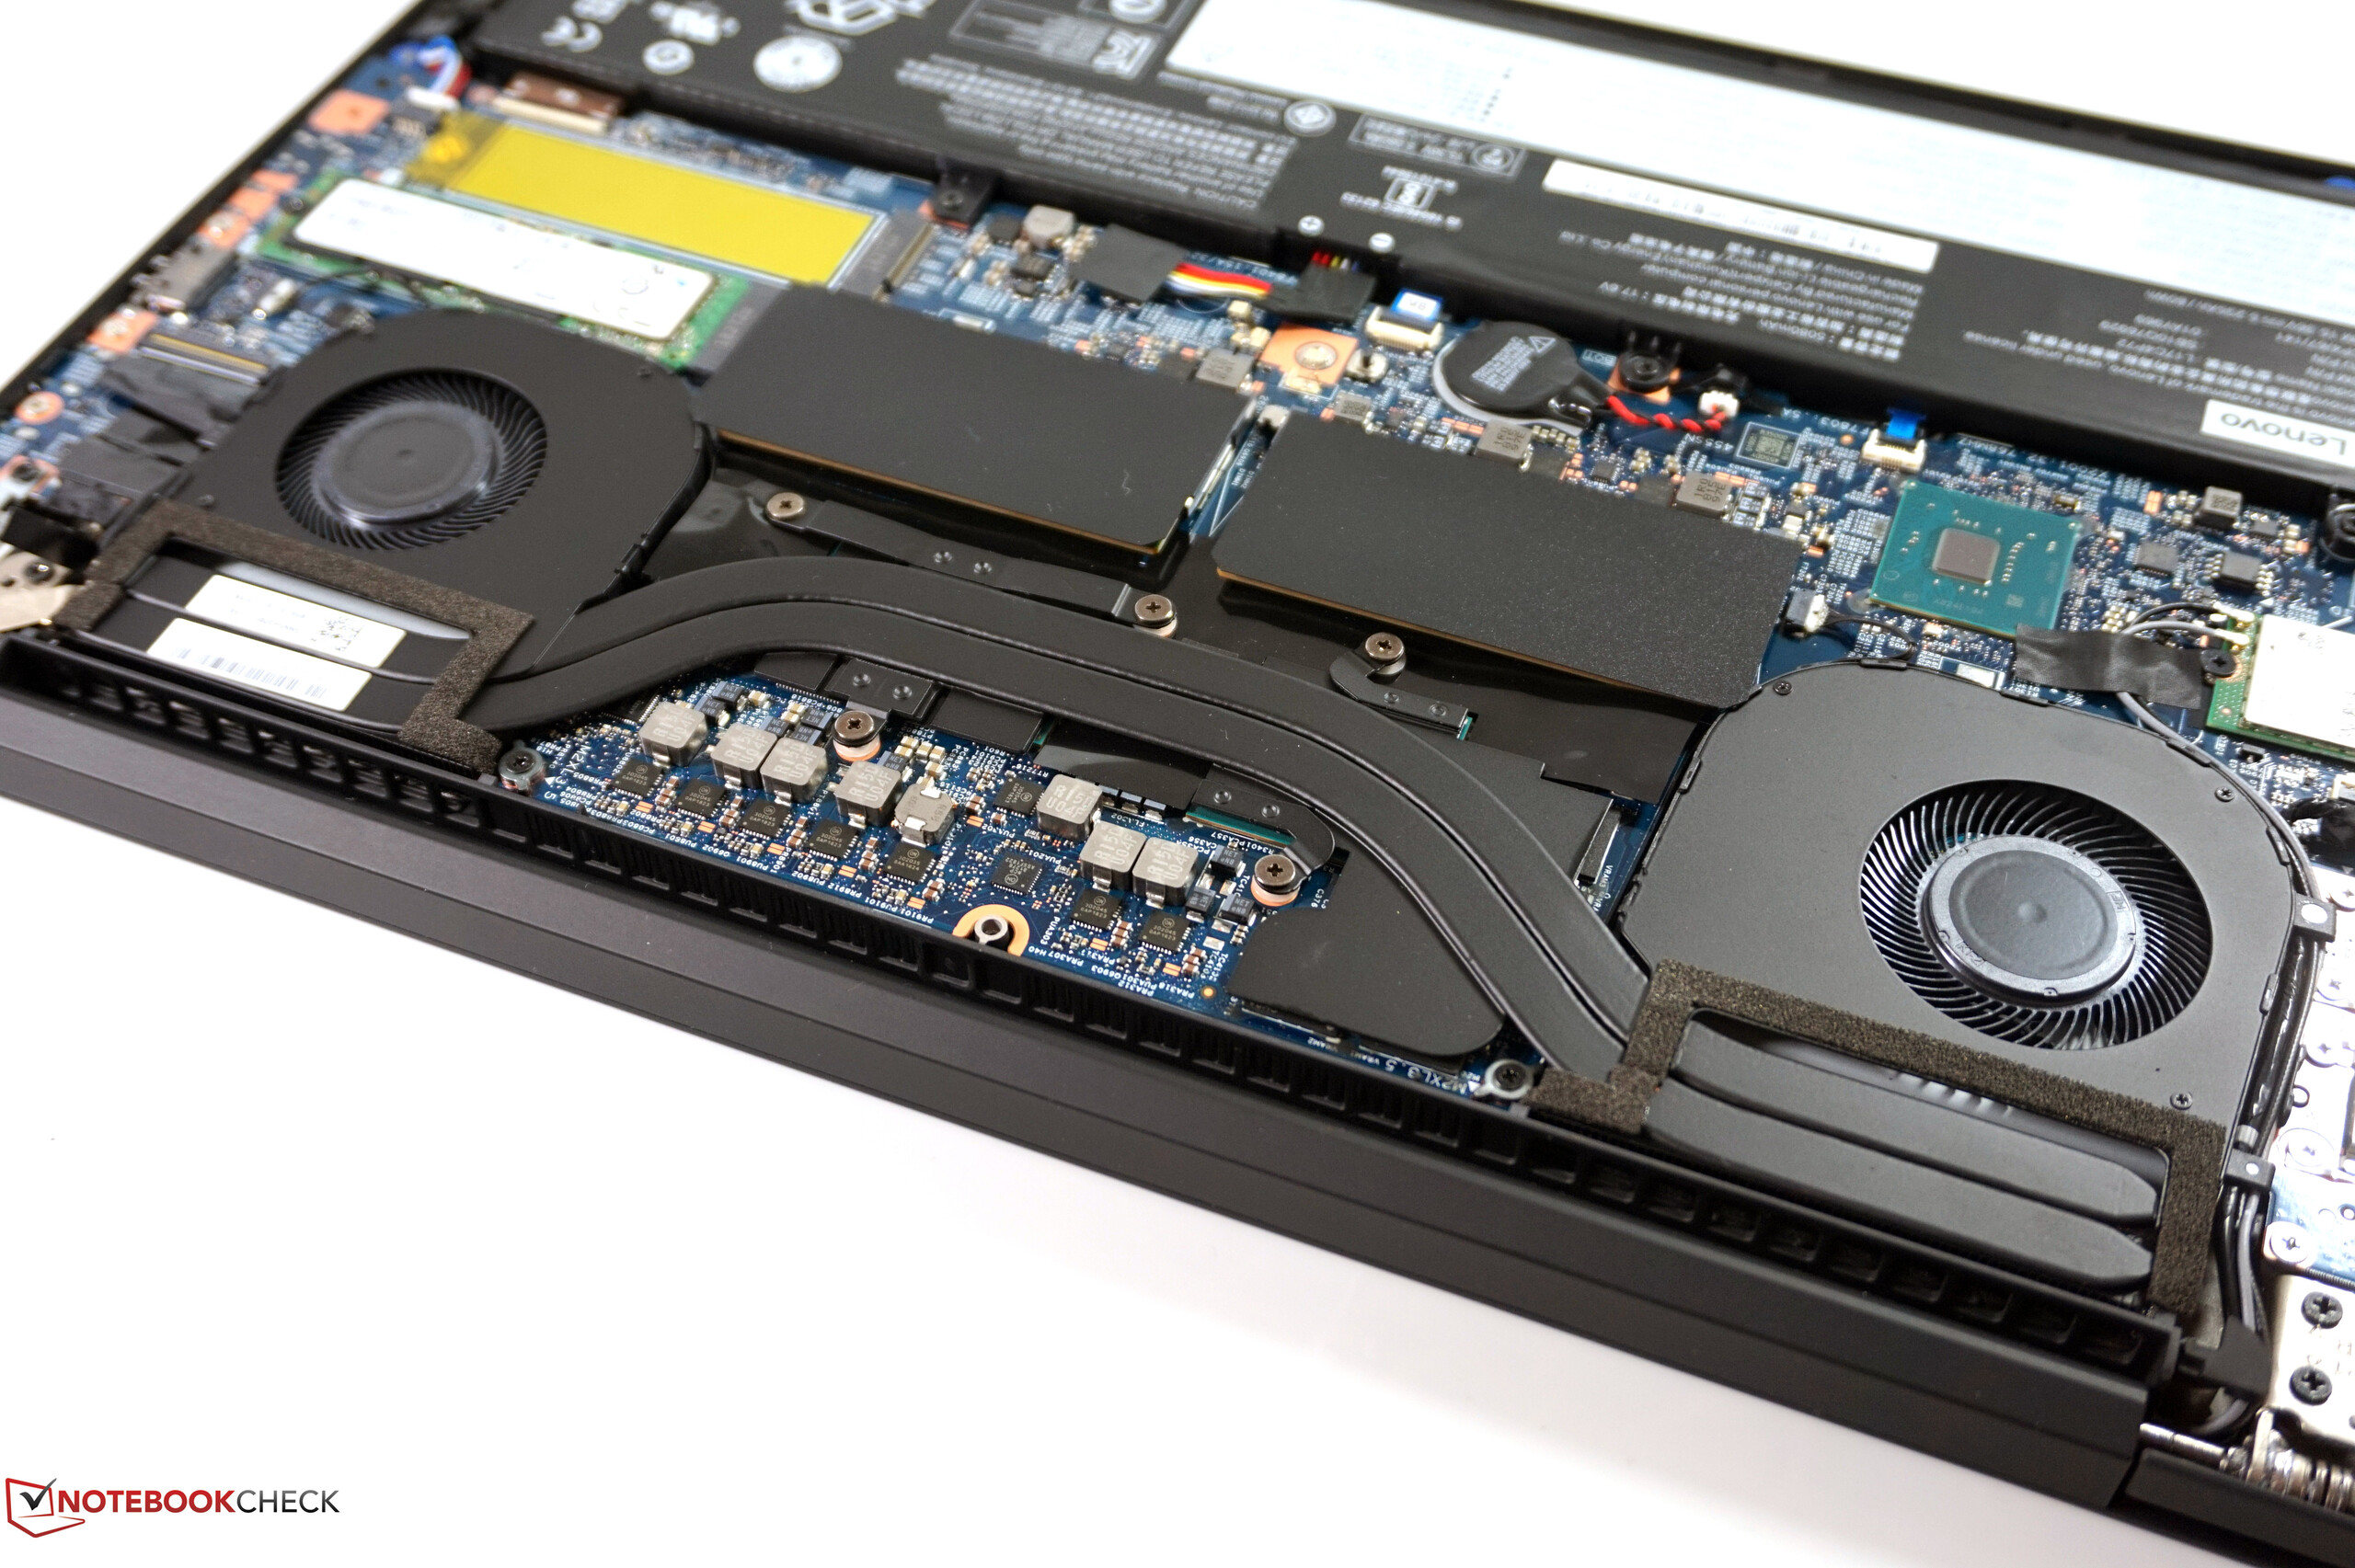
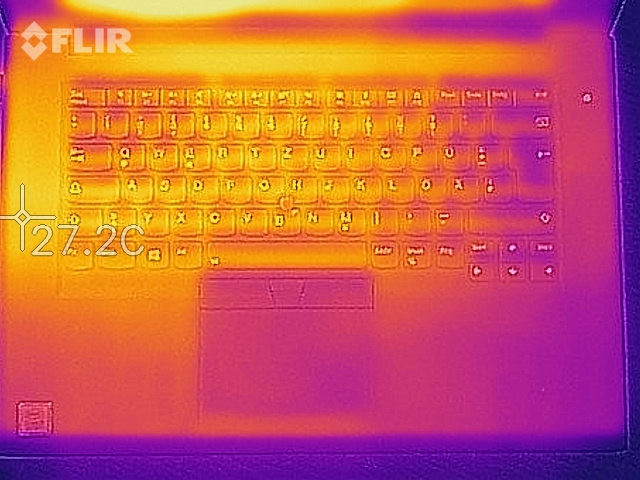
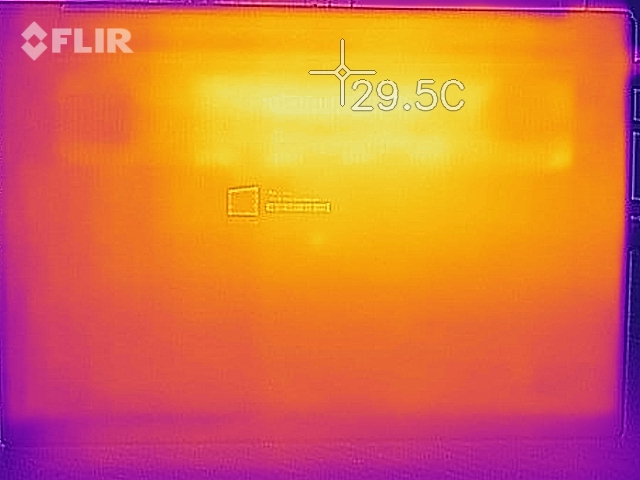
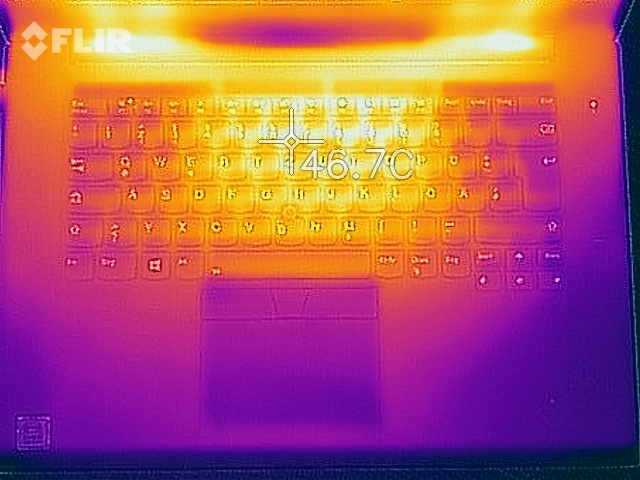
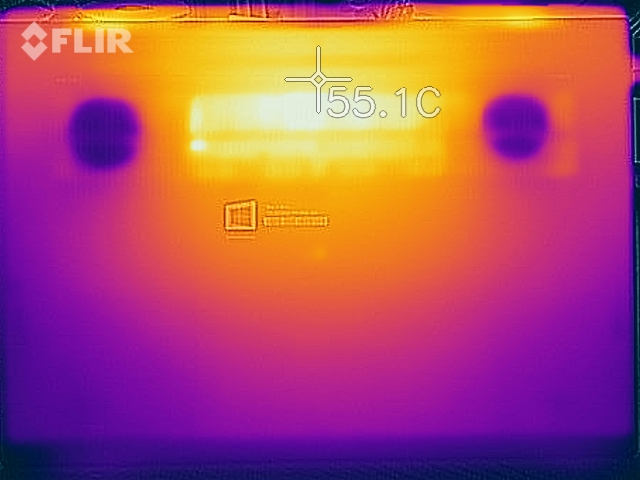
The internal shots already showed the position of the two processors in the rear center area of the base unit. The fans are deactivated while idling, but the case still stays cool without any hot spots. Our thermal images under load illustrate the position of the CPU/GPU, the two fans next to them as well as the fan exhaust at the rear of the laptop.
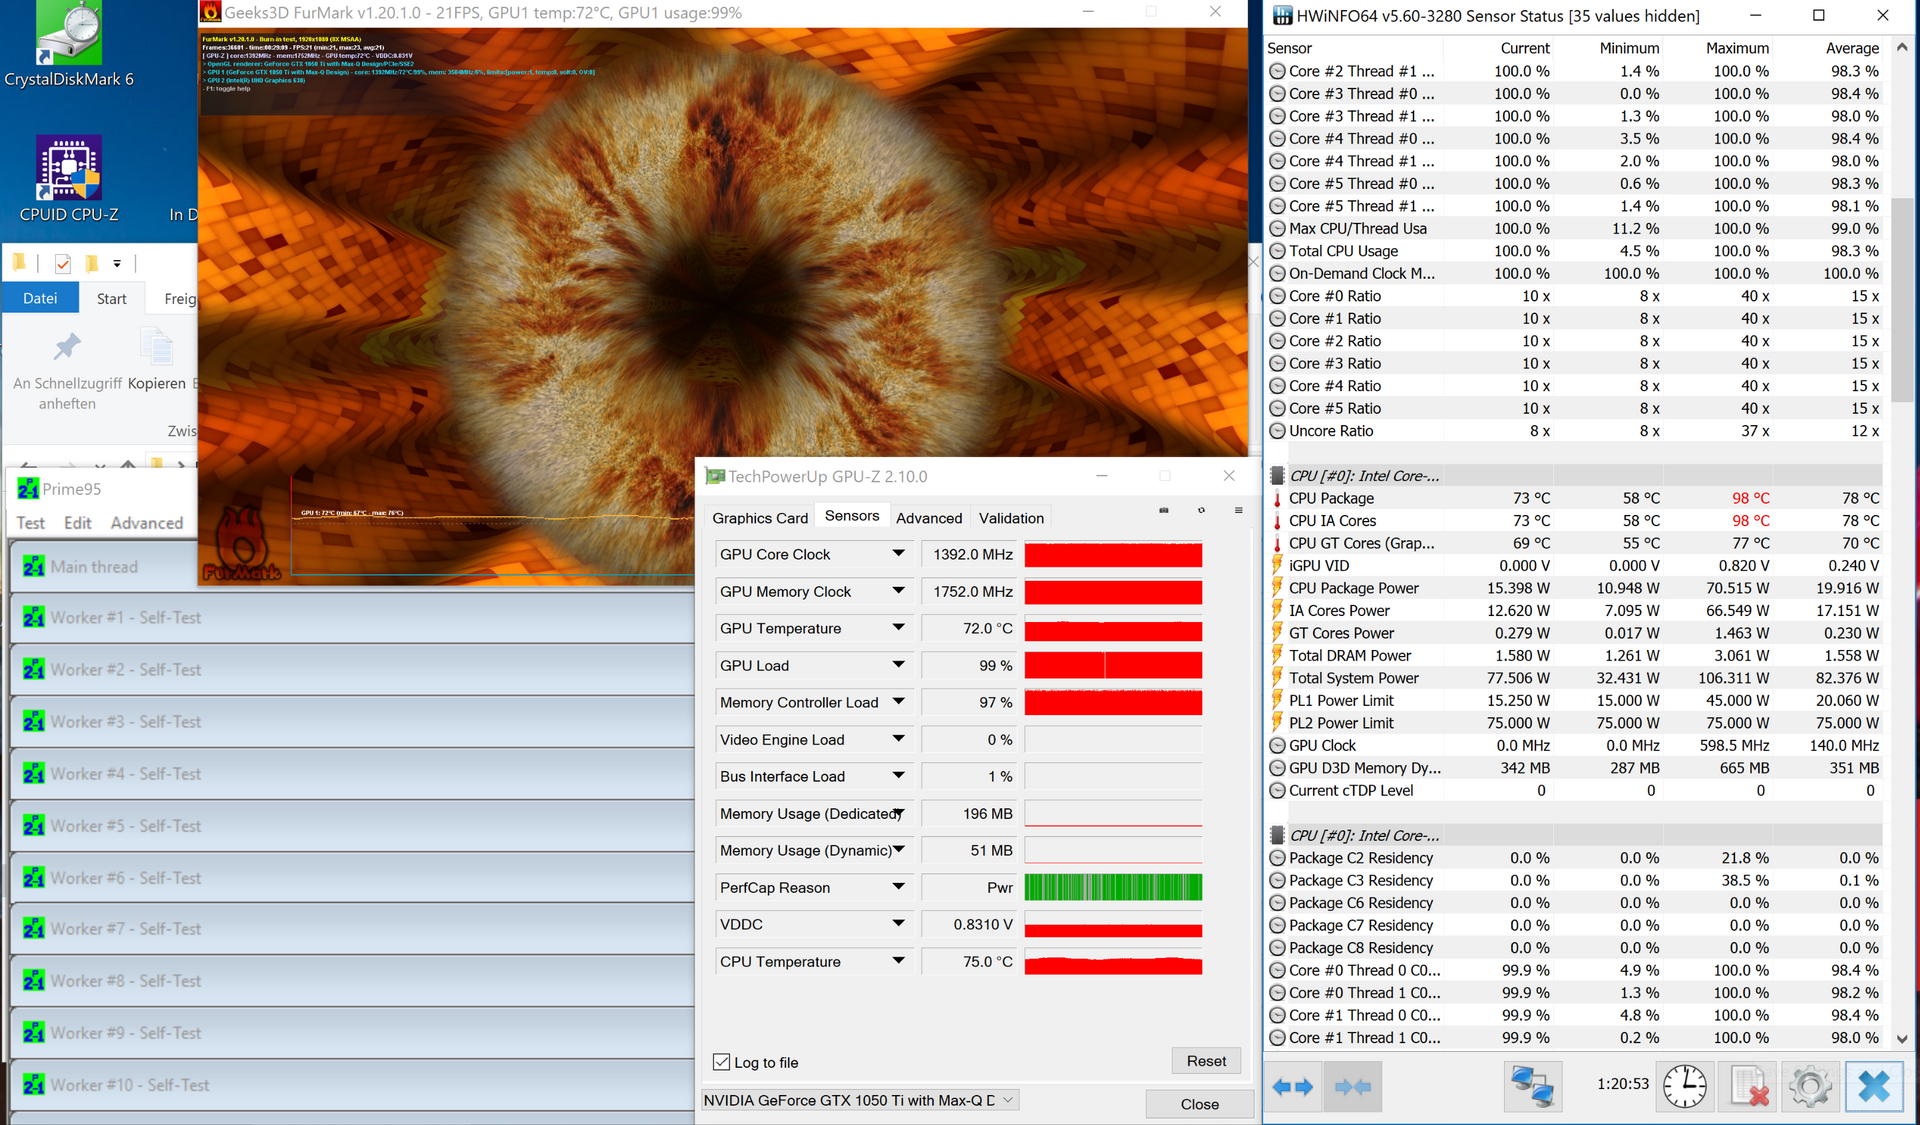
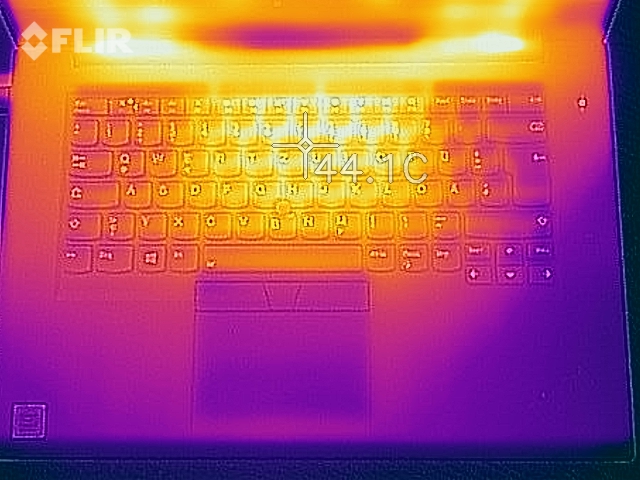
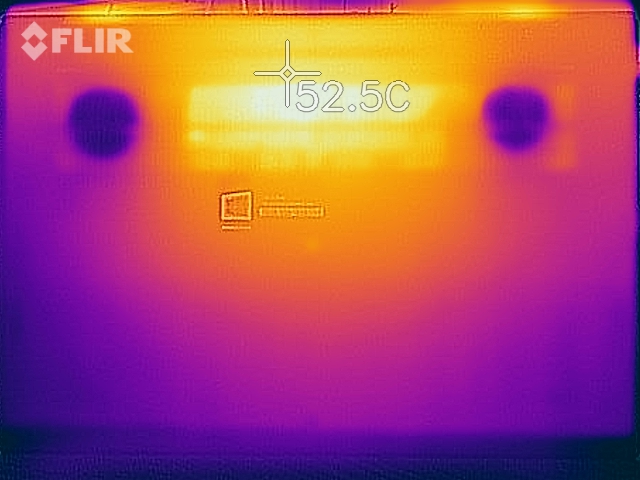
These two spots are also the hot spots under load on the top or the bottom, respectively, and you should avoid direct skin contact with more than 50 °C at the bottom. However, the energy management does not seem to be perfectly optimized based on our test results. It seems Lenovo made a compromise to limit the fan noise. The stress test shows that the CPU has to reduce its clock very quickly, even though both the core temperature as well as the fan speed still have some headroom. The CPU only consumes about 15 Watts at the end of the stress test (which is only sufficient for 6x 1.0 GHz), while the GPU runs at the full speed for the whole test. If you stop the CPU load for a short while and then continue it, the clock will once again start at a higher level and then slowly drop back to 1.0 GHz (15W). This priority for the GPU performance benefits the gaming performance in particular. The processor is not stressed that much during gaming, so the performance is steady. This is also confirmed by our Witcher 3 longterm test. A 3DMark 11 run immediately after the stress test did not detect a performance deficit, either. This means there should not be any limitations in practice unless you fully stress both components simultaneously.
All in all, the performance under combined workloads is still a bit disappointing, but we hope Lenovo will offer an update. You could easily improve the CPU performance in this scenario with the maximum fan speed, which is not too loud at less than 40 dB(A).
(-) The maximum temperature on the upper side is 45.4 °C / 114 F, compared to the average of 36.9 °C / 98 F, ranging from 21.1 to 71 °C for the class Multimedia.
(-) The bottom heats up to a maximum of 53.4 °C / 128 F, compared to the average of 39.2 °C / 103 F
(+) In idle usage, the average temperature for the upper side is 25.5 °C / 78 F, compared to the device average of 31.3 °C / 88 F.
(±) Playing The Witcher 3, the average temperature for the upper side is 36 °C / 97 F, compared to the device average of 31.3 °C / 88 F.
(+) The palmrests and touchpad are cooler than skin temperature with a maximum of 30.7 °C / 87.3 F and are therefore cool to the touch.
(±) The average temperature of the palmrest area of similar devices was 28.7 °C / 83.7 F (-2 °C / -3.6 F).
Speakers
The two speakers are located at the front sides of the bottom panel where the surface is slightly angled, so the sound is reflected towards the user on solid surfaces. Subjectively, the performance is decent and sufficient for some music and video playback. However, the performance could have been much better considering the empty space in the chassis. Both the XPS 15 as well as the Apple MacBook Pro 15 are superior in this respect.
The 3.5 mm stereo jack creates a noise-free signal and speakers or headphones can also be connected via Bluetooth, which worked well during our test.
Lenovo ThinkPad X1 Extreme-20MF000XGE audio analysis
(±) | speaker loudness is average but good (73.1 dB)
Bass 100 - 315 Hz
(±) | reduced bass - on average 14% lower than median
(±) | linearity of bass is average (11.6% delta to prev. frequency)
Mids 400 - 2000 Hz
(±) | higher mids - on average 5.9% higher than median
(±) | linearity of mids is average (13.1% delta to prev. frequency)
Highs 2 - 16 kHz
(+) | balanced highs - only 1.7% away from median
(+) | highs are linear (5.2% delta to prev. frequency)
Overall 100 - 16.000 Hz
(±) | linearity of overall sound is average (21% difference to median)
Compared to same class
» 71% of all tested devices in this class were better, 8% similar, 22% worse
» The best had a delta of 5%, average was 17%, worst was 45%
Compared to all devices tested
» 57% of all tested devices were better, 7% similar, 36% worse
» The best had a delta of 4%, average was 24%, worst was 134%
Dell XPS 15 2018 i5 FHD 97Wh audio analysis
(±) | speaker loudness is average but good (73 dB)
Bass 100 - 315 Hz
(±) | reduced bass - on average 10.9% lower than median
(+) | bass is linear (4.9% delta to prev. frequency)
Mids 400 - 2000 Hz
(±) | higher mids - on average 6.8% higher than median
(+) | mids are linear (6.8% delta to prev. frequency)
Highs 2 - 16 kHz
(+) | balanced highs - only 3.7% away from median
(+) | highs are linear (6.9% delta to prev. frequency)
Overall 100 - 16.000 Hz
(±) | linearity of overall sound is average (16.6% difference to median)
Compared to same class
» 42% of all tested devices in this class were better, 7% similar, 52% worse
» The best had a delta of 5%, average was 17%, worst was 45%
Compared to all devices tested
» 28% of all tested devices were better, 6% similar, 66% worse
» The best had a delta of 4%, average was 24%, worst was 134%
Apple MacBook Pro 15 2018 (2.6 GHz, 560X) audio analysis
(+) | speakers can play relatively loud (85 dB)
Bass 100 - 315 Hz
(+) | good bass - only 4.7% away from median
(±) | linearity of bass is average (8.3% delta to prev. frequency)
Mids 400 - 2000 Hz
(+) | balanced mids - only 1.8% away from median
(+) | mids are linear (3.5% delta to prev. frequency)
Highs 2 - 16 kHz
(+) | balanced highs - only 2.6% away from median
(+) | highs are linear (5.7% delta to prev. frequency)
Overall 100 - 16.000 Hz
(+) | overall sound is linear (6.4% difference to median)
Compared to same class
» 3% of all tested devices in this class were better, 1% similar, 96% worse
» The best had a delta of 5%, average was 17%, worst was 45%
Compared to all devices tested
» 0% of all tested devices were better, 0% similar, 99% worse
» The best had a delta of 4%, average was 24%, worst was 134%
Energy Management
Power Consumption
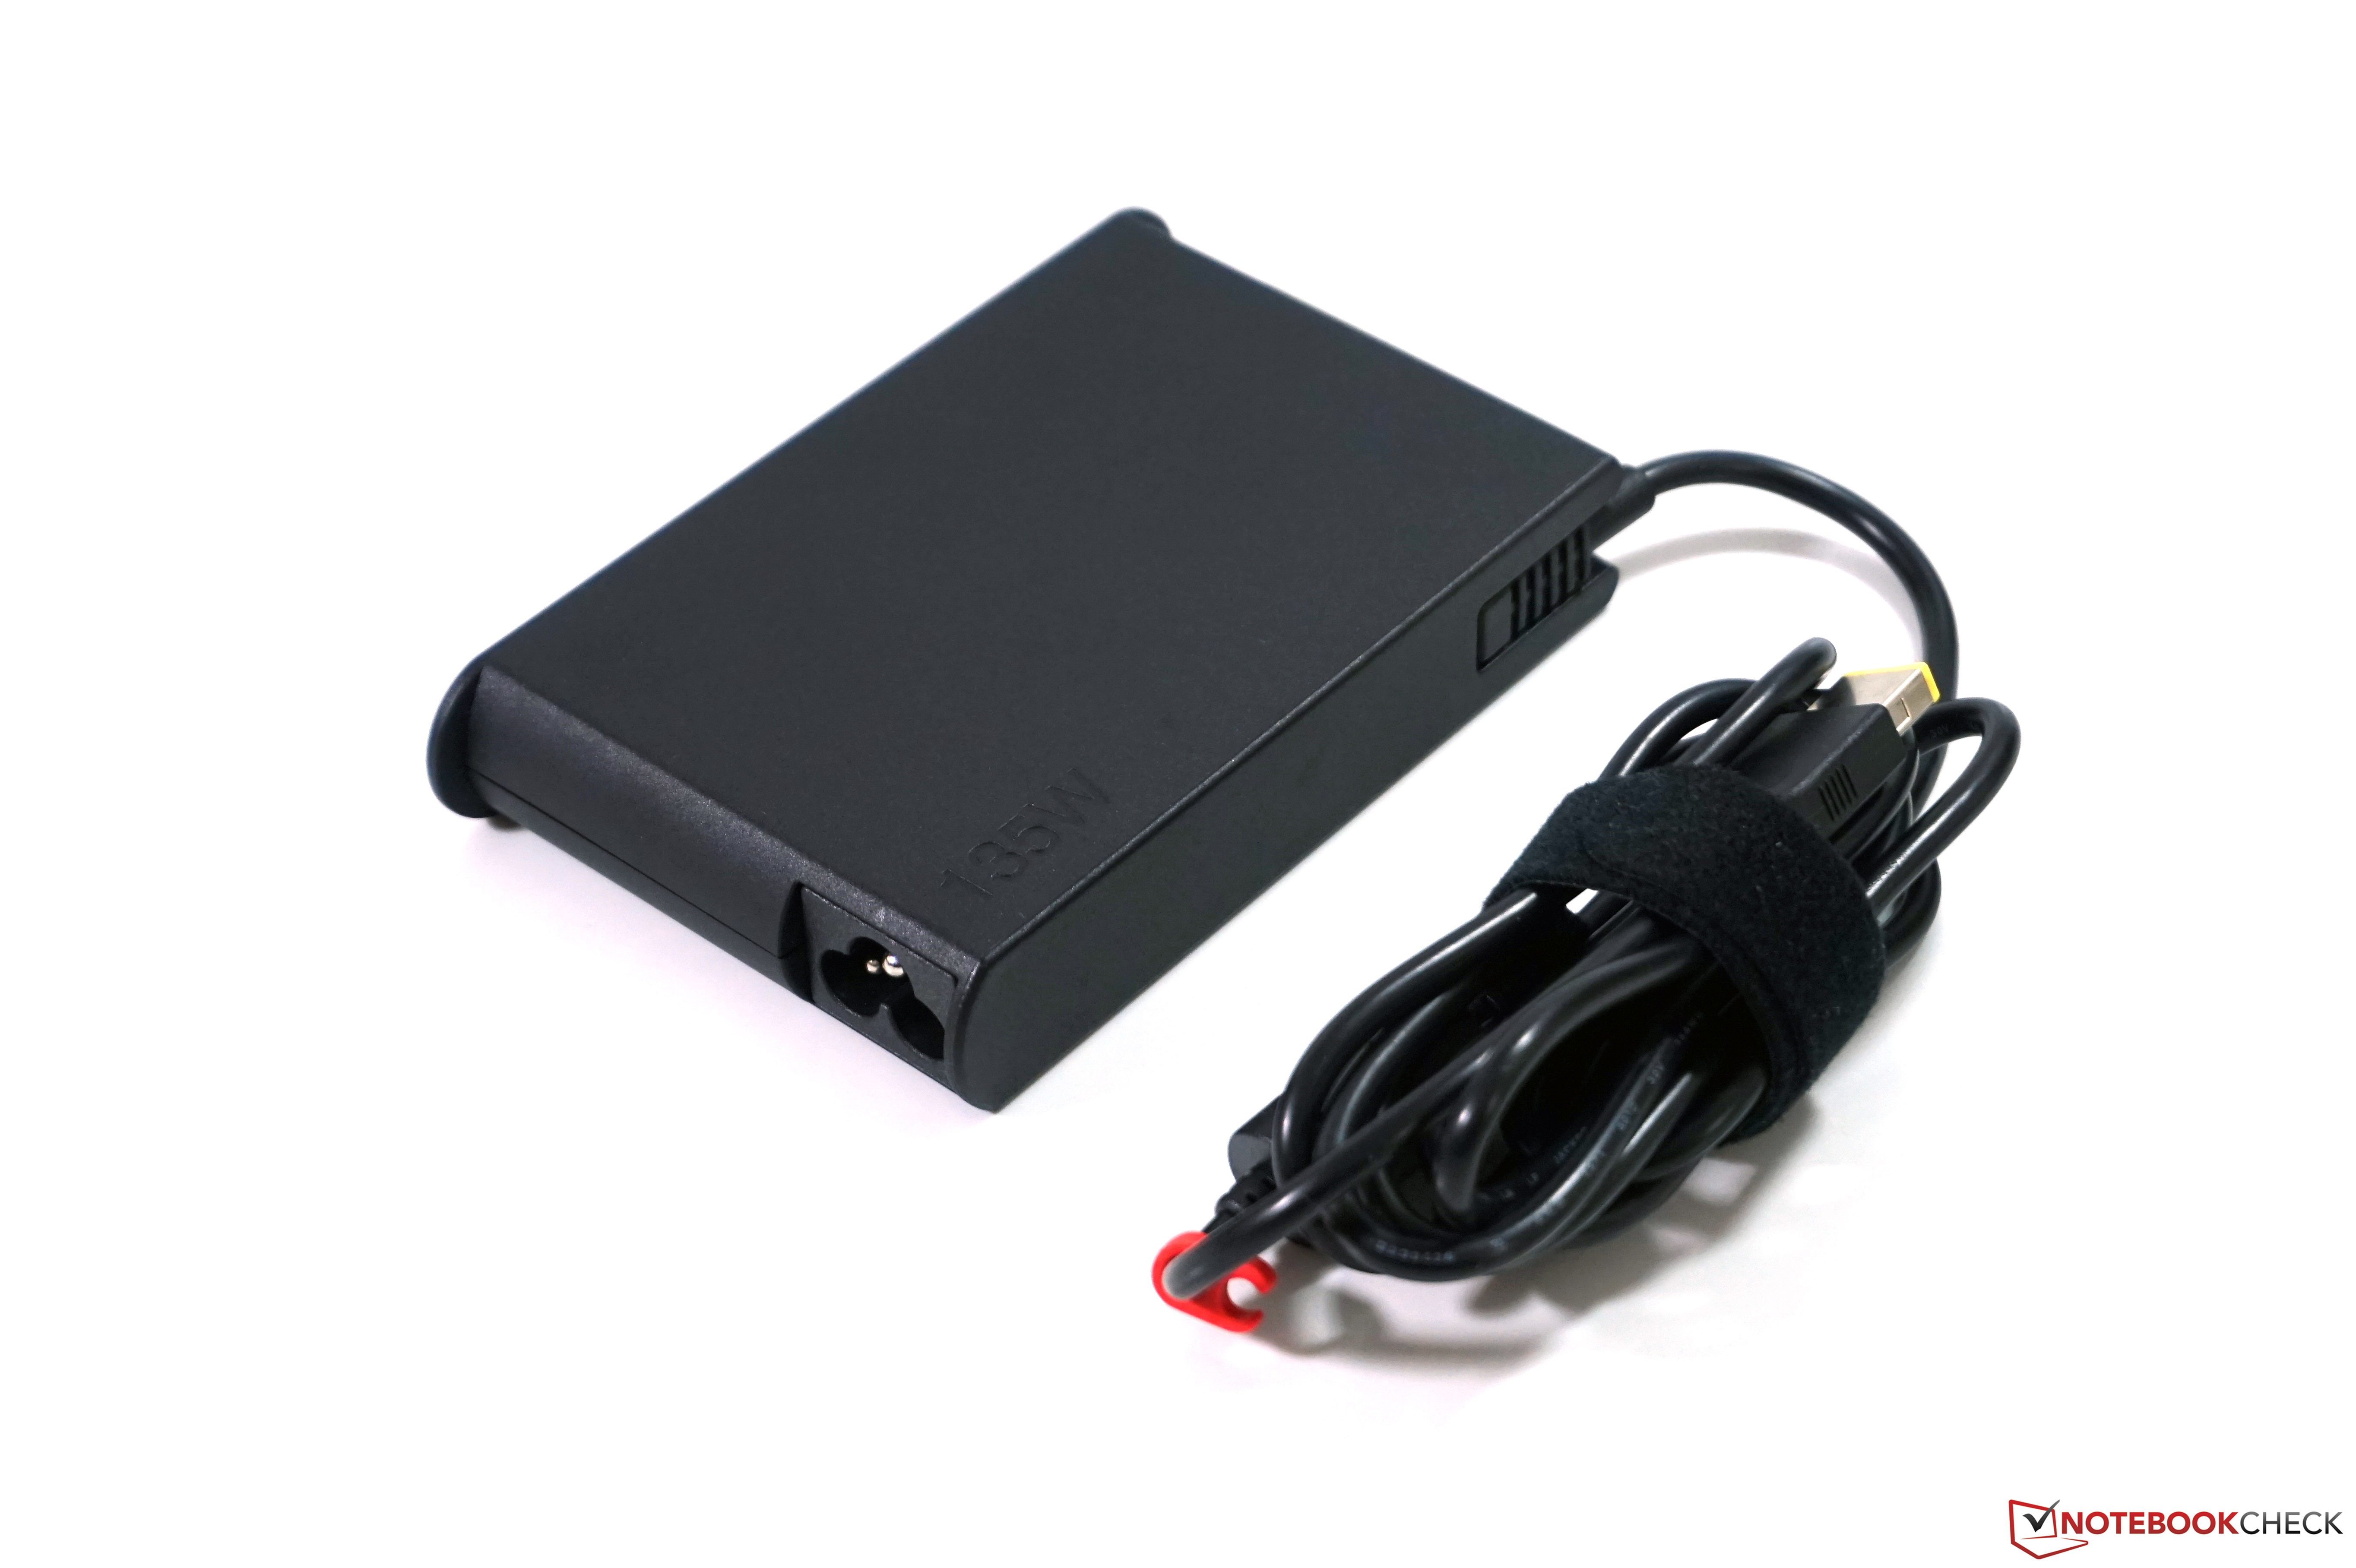
We are not surprised that the large 4K panel consumes a lot of power and the idle values are on par with the Dell XPS 15 4K (which is brighter though), while both the HP EliteBook 1050 G1 and the MacBook Pro 15 are more efficient. There are no big surprises under load and the maximum consumption is about 120W, which drops to just 100W at the end of the stress test. The 130W PSU is therefore sufficient. It is a new model, which is slimmer than before at 12.6 x 7.6 x 2.2 cm (449g).
| Off / Standby | |
| Idle | |
| Load |
|
Key:
min: | |
| Lenovo ThinkPad X1 Extreme-20MF000XGE i7-8750H, GeForce GTX 1050 Ti Max-Q, Samsung SSD PM981 MZVLB1T0HALR, IPS, 3840x2160, 15.6" | Dell XPS 15 9570 i7 UHD i7-8750H, GeForce GTX 1050 Ti Max-Q, Toshiba XG5 KXG50ZNV512G, IPS, 3840x2160, 15.6" | HP EliteBook 1050 G1-4QY20EA i7-8750H, GeForce GTX 1050 Max-Q, Toshiba XG5-P KXG50PNV2T04, IPS LED, 3840x2160, 15.6" | Lenovo ThinkPad X1 Carbon 2018-20KGS03900 i5-8550U, UHD Graphics 620, Samsung SSD PM981 MZVLB512HAJQ, IPS, 2560x1440, 14" | Lenovo ThinkPad T580-20LAS01H00 i5-8550U, GeForce MX150, Samsung SSD PM981 MZVLB512HAJQ, IPS LED, 3840x2160, 15.6" | Apple MacBook Pro 15 2018 (2.6 GHz, 560X) i7-8850H, Radeon Pro 560X, Apple SSD AP0512, IPS, 2880x1800, 15.4" | Average NVIDIA GeForce GTX 1050 Ti Max-Q | Average of class Multimedia | |
|---|---|---|---|---|---|---|---|---|
| Power Consumption | -10% | 15% | 45% | 34% | 25% | 13% | 20% | |
| Idle Minimum * (Watt) | 7.6 | 9.48 -25% | 6.1 20% | 3.8 50% | 5.3 30% | 3.4 55% | 5.8 ? 24% | 6 ? 21% |
| Idle Average * (Watt) | 14.8 | 16.1 -9% | 10.2 31% | 8.9 40% | 10.2 31% | 11 26% | 11.2 ? 24% | 10.5 ? 29% |
| Idle Maximum * (Watt) | 17.6 | 16.9 4% | 13.4 24% | 11.9 32% | 13.6 23% | 14.9 15% | 13.5 ? 23% | 12.6 ? 28% |
| Load Average * (Watt) | 86 | 90.8 -6% | 82 5% | 47.5 45% | 58.3 32% | 78.9 8% | 86.9 ? -1% | 69.3 ? 19% |
| Witcher 3 ultra * (Watt) | 85 | 47.8 44% | ||||||
| Load Maximum * (Watt) | 118.9 | 134.4 -13% | 122 -3% | 52.5 56% | 65.3 45% | 91.2 23% | 122.4 ? -3% | 115.2 ? 3% |
* ... smaller is better
Battery Runtime
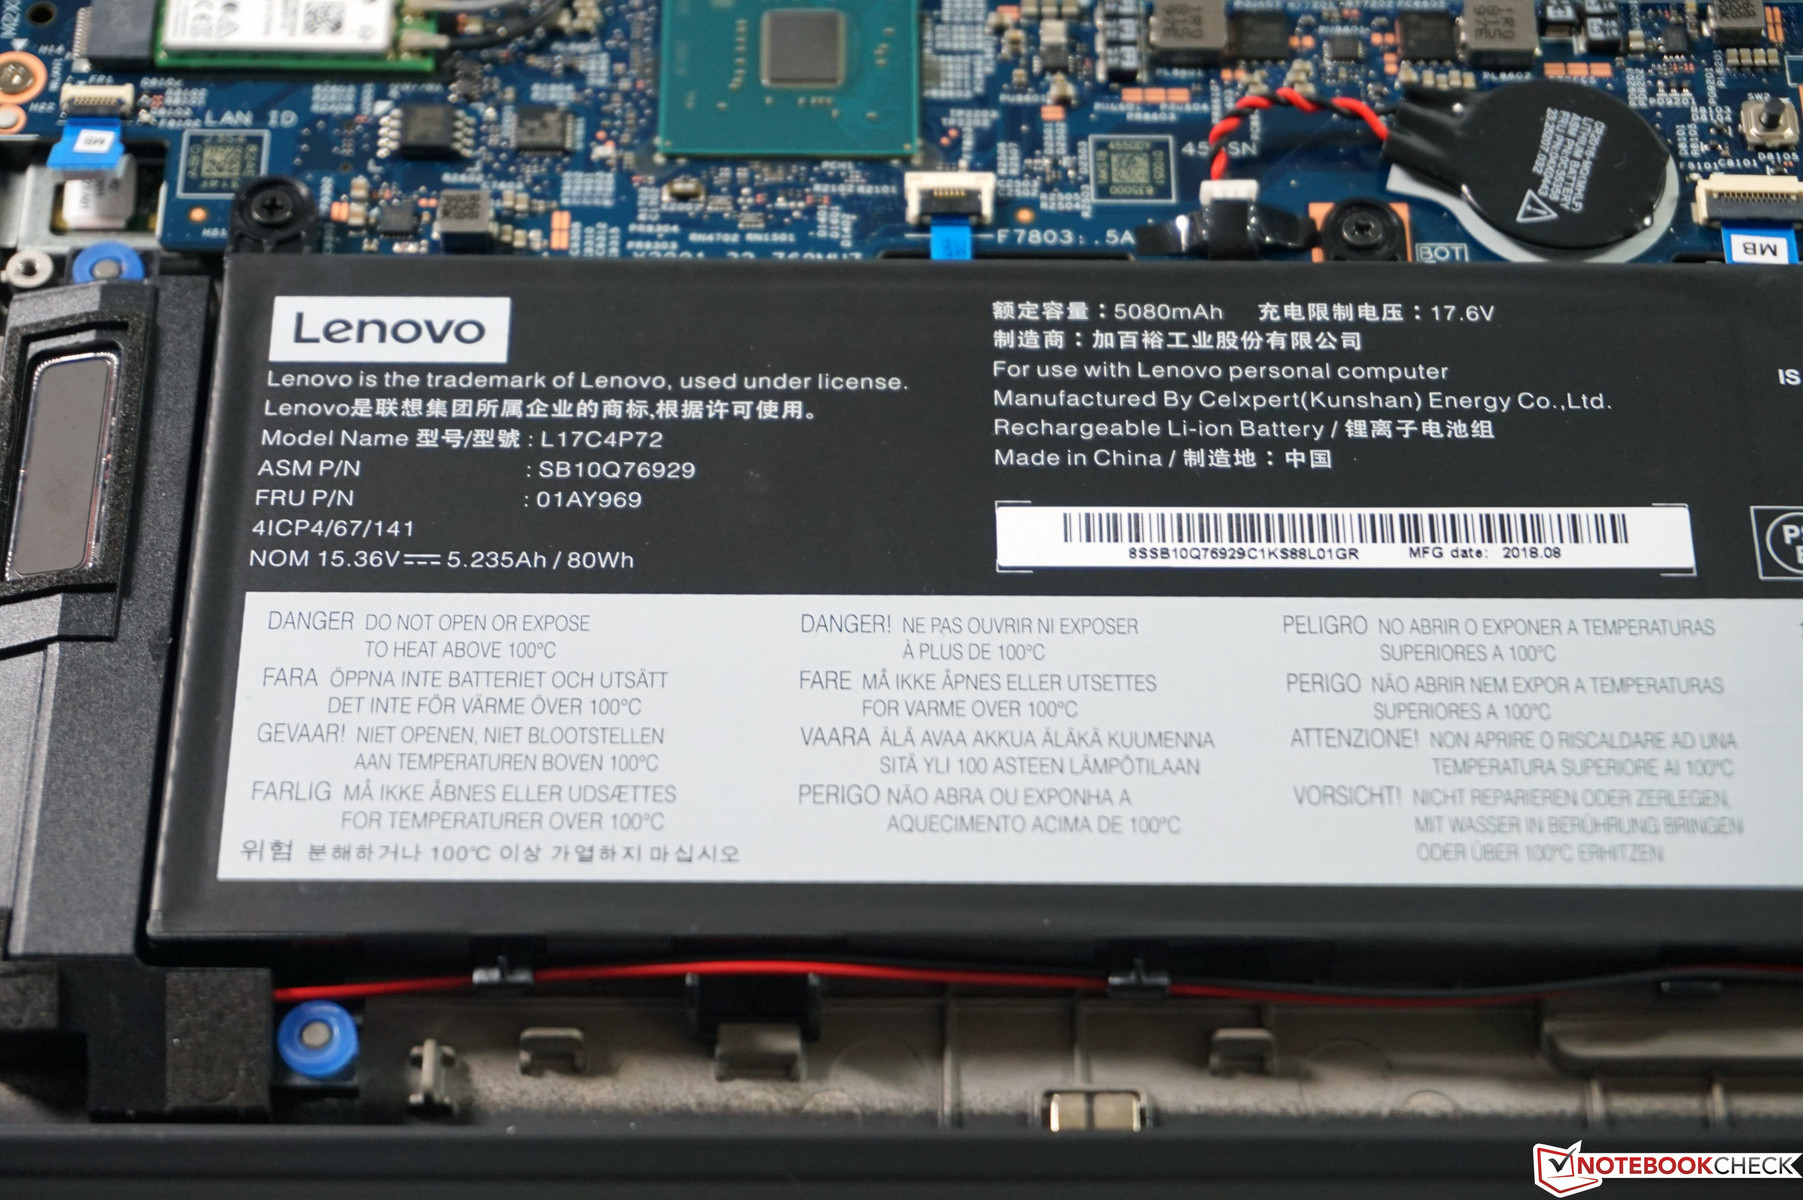
Lenovo implements a lithium-ion battery with 80 Wh, which is the lowest capacity among the competition. The MacBook Pro 15 has a 83 Wh module, while the other two systems from Dell and HP are close to 100 Wh. We started with the runtime under load, which is surprisingly long at almost two hours. We will have to check whether the ThinkPad reduces the performance on battery power.
And how about the WLAN runtime? Our test uses a script to open a new website every 30 seconds with an adjusted luminance of 150 nits (71% on our test unit). A results of just ~6.5 hours is sobering, because the competition manages more than 9 hours or more than 10 hours in the case of the MacBook. We will repeat the test to rule out any problems.
We repeated our WLAN test but the results is similar down to a few minutes. Our video test (again at 150 nits) also stops after little more than six hours and the longest runtime we determined with the Battery Eater Reader's Test at the minimum brightness setting was ~11.5 hours. The competition lasts much longer.
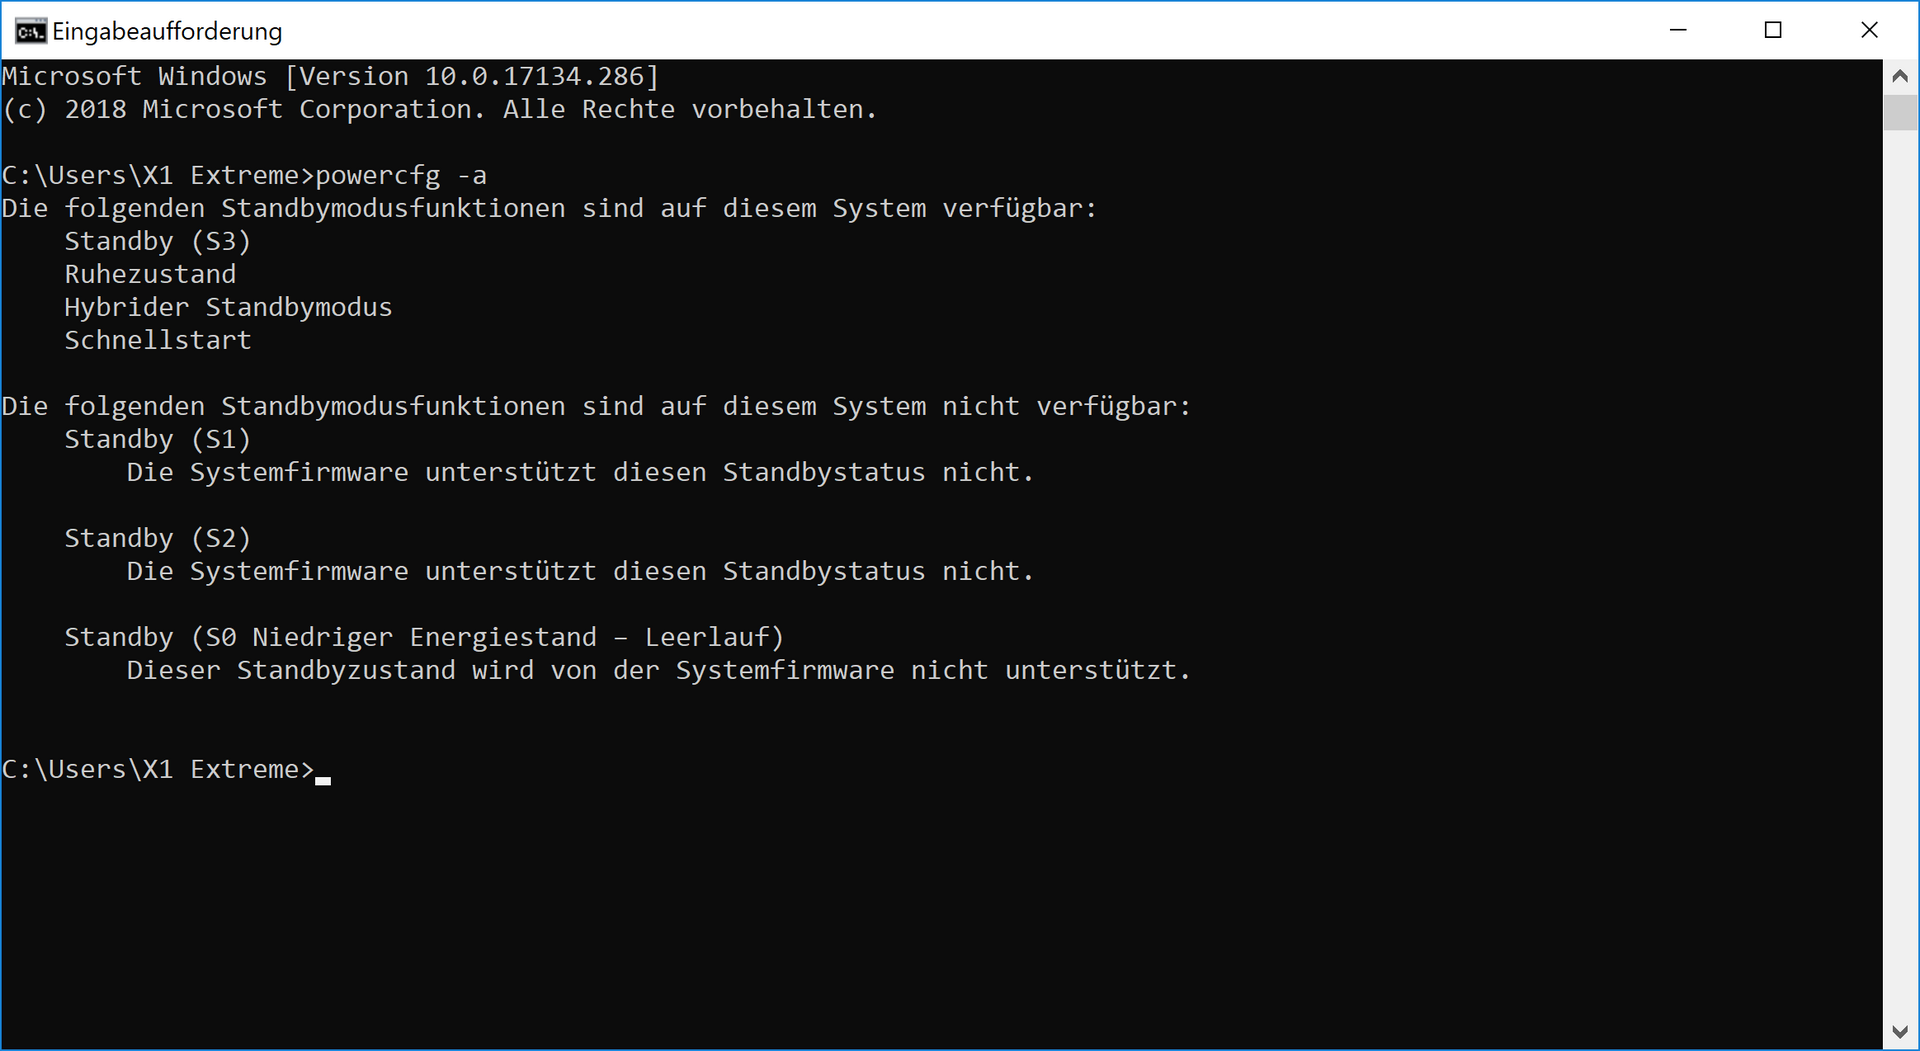
Gaming on the road is possible for about an hour (63 minutes @ Witcher 3). High-resolution video playback at maximum brightness is also limited, because a 4K HDR Netflix video only ran for 3.5 hours. We also checked the battery with multiple tools and our test unit only had a capacity of 72 Wh instead of the advertised 80 Wh.
Lenovo advertises a battery charge of 80% in just 60 minutes, but we cannot confirm that. It took 71 minutes before the device, which was turned on, reached 80% (starting from 5% remaining). A complete charge takes 129 minutes. You can also charge the ThinkPad via Thunderbolt 3 port if the SlimTip PSU is not available.
| Lenovo ThinkPad X1 Extreme-20MF000XGE i7-8750H, GeForce GTX 1050 Ti Max-Q, 80 Wh | Dell XPS 15 9570 i7 UHD i7-8750H, GeForce GTX 1050 Ti Max-Q, 97 Wh | HP EliteBook 1050 G1-4QY20EA i7-8750H, GeForce GTX 1050 Max-Q, 96 Wh | Lenovo ThinkPad X1 Carbon 2018-20KGS03900 i5-8550U, UHD Graphics 620, 57 Wh | Lenovo ThinkPad T580-20LAS01H00 i5-8550U, GeForce MX150, 105 Wh | Apple MacBook Pro 15 2018 (2.6 GHz, 560X) i7-8850H, Radeon Pro 560X, 83 Wh | Average of class Multimedia | |
|---|---|---|---|---|---|---|---|
| Battery runtime | 26% | 37% | 43% | 47% | 61% | 80% | |
| Reader / Idle (h) | 11.5 | 17.1 49% | 22.1 92% | 19.7 71% | 23.4 ? 103% | ||
| H.264 (h) | 6.2 | 12.3 98% | 9.7 56% | 9.4 52% | 9.4 52% | 11.7 89% | 15.8 ? 155% |
| WiFi v1.3 (h) | 6.4 | 9.6 50% | 8.7 36% | 8.7 36% | 8.7 36% | 10.2 59% | 11.3 ? 77% |
| Witcher 3 ultra (h) | 1.1 | 1 -9% | 1.5 36% | ||||
| Load (h) | 2 | 1.3 -35% | 2.1 5% | 1.8 -10% | 2.6 30% | 1.653 ? -17% |
Verdict
Pros
Cons
So what is the new ThinkPad X1 Extreme, a business laptop or a multimedia notebook for customers with deep pockets? Our SKU is definitely a combination of both worlds, which can make sense for some users. There are more and more users that only use one device for business and personal usage. Attached to the docking station in the office and then some movies or games after hours? No problem for the X1 Extreme, but this is also the case for the rivals. The two models from Lenovo HP still have some advantages in business environments.
The chassis is definitely a ThinkPad and it is basically a larger ThinkPad X1 Carbon. The stability of the base unit and the lid is very good, but the latter produces unpleasant creaking sounds when you apply pressure. This does not really fit the otherwise excellent quality impression. The input devices are another big advantage; especially the keyboard is a step ahead of the competition. Whether a regular 15.6-inch laptop requires a touchscreen with pen support or not comes down to your personal preferences.
This brings us to the screen, which has some advantages but also some problems. First of all, it is a very good 4K screen compared to other ThinkPad models. However, we would have liked to see a better factory calibration and the glossy surface makes it harder to use outdoors. The response times are also very long, which is noticeable in everyday situations. Otherwise, the panel is very bright (even though the competition is even brighter) and the best color gamut. HDR is a problematic topic; corresponding contest are displayed, but the brightness is too low and it is just an 8-bit panel.
Lenovo's first attempt is a success: The ThinkPad X1 Extreme is a very good 15.6-inch laptop with excellent CPU performance and the best keyboard you get on a mobile device. The 4K panel is not bad, either, but the battery runtimes in particular fall short.
Let's get to the performance and the cooling solution. Lenovo can certainly optimize some settings, because simultaneous load for the CPU/GPU results in significant CPU throttling, even though the fans still have a lot of headroom. Still, this does not affect the benchmarks and both the gaming as well as the CPU performance of the new X1 Extreme is excellent and ahead of the competition. The CPU performance can even be further tweaked. The emissions are not too high, and especially the fans are not too loud under stress. They occasionally spin up while idling, which should be fixed by Lenovo. There are at least no problems with coil whine or electronic sounds.
The short battery runtimes are a big deficit compared to the rivals. Maybe Lenovo can improve the situation with an update, but this is questionable considering the small battery capacity and the high power consumption of the 4K panel. So which device should you choose? It is definitely a difficult choice, because all the devices are very good and it comes down to small things or personal preferences, respectively. We will also review the entry-level SKU of the X1 Extreme soon, which should manage much longer battery runtimes. There is certainly still room for improvements, but Lenovo's first attempt is already a very good laptop. We classified the X1 Extreme as multimedia device, because the weighted rating is the highest in this class. It would have been a final score of 91% as an office device as well.
Lenovo ThinkPad X1 Extreme-20MF000XGE
- 10/25/2019 v7 (old)
Andreas Osthoff
Price comparison
