AMD Radeon Pro 560X
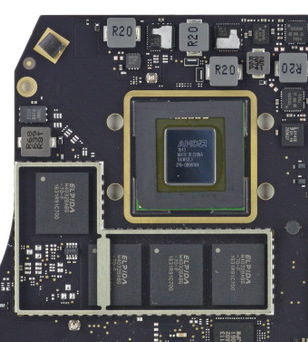
The AMD Radeon Pro 560X is a mobile graphics card based on the small Polaris 21 chip from AMD. It is an option for the 15-inch Apple MacBook Pro 2018 and is very similar to the Radeon Pro 460 . Compared to the Radeon Pro 560 from the 2017 MBP15, the 560X is slightly higher clocked. The Radeon Pro 555X from the entry level model offers less cores.
The mobile Radeon Pro 560X should support all features of the desktop RX 460/560 like DisplayPort 1.2 (Polaris actually supports up to 1.4), HDMI 2.0 (via USB-C adapter), new H.265 video de- and encoder as well as architectural improvements. More information about the Polaris architecture is available in our dedicated review .
The Polaris 21 chip is manufactured in a slightly improved 14nm FinFET process according to AMD. The power consumption of the Radeon Pro 460 is 35 Watts according to AMD , so this should also be the case for the Pro 560X.
Codename Polaris 21 Architecture Polaris Pipelines 1024 - unified Core Speed 907 MHz Memory Speed 5080 MHz Memory Bus Width 128 Bit Memory Type GDDR5 Max. Amount of Memory 4 GB Shared Memory no API DirectX 12, OpenGL Vulkan Power Consumption 35 Watt Transistor Count 3 Billion technology 14 nm Features DisplayPort 1.3 HBR / 1.4 HDR Ready, HDMI 2.0, AMD FreeSync Notebook Size large Date of Announcement 05.06.2017
Benchmarks 3DMark - 3DMark Time Spy Score
1775 Points (5%)
...
unknown
...
max:
3DMark - 3DMark Time Spy Graphics
1614 Points (4%)
...
unknown
...
max:
3DMark - 3DMark Ice Storm Unlimited Graphics
255217 Points (29%)
...
unknown
...
max:
3DMark - 3DMark Cloud Gate Score
18251 Points (20%)
...
unknown
...
max:
3DMark - 3DMark Cloud Gate Graphics
32449 Points (9%)
...
...
max:
3DMark - 3DMark Fire Strike Standard Score
4961 Points (9%)
...
...
max:
3DMark - 3DMark Fire Strike Standard Graphics
5699 Points (6%)
...
...
max:
3DMark 11 - 3DM11 Performance Score
7910 Points (11%)
...
...
max:
3DMark 11 - 3DM11 Performance GPU
7590 Points (7%)
...
...
max:
Cinebench R15 + Cinebench R15 - Cinebench R15 OpenGL 64 Bit
98.4 fps (6%)
...
...
Cinebench R15 OpenGL Ref. Match 64 Bit + Cinebench R15 - Cinebench R15 OpenGL Ref. Match 64 Bit
99.5 % (100%)
...
...
Basemark GPU 1.2 - Basemark GPU 1.2 Vulkan Official Medium Offscreen 1080
min: 177.5 avg: 179.8 median: 179.8 (1%) max: 182 fps
...
...
max:
Basemark GPU 1.2 - Basemark GPU 1.2 Vulkan Official High Offscreen 2160
min: 17.14 avg: 17.3 median: 17.3 (4%) max: 17.5 fps
...
Emissions Witcher 3 Fan Noise + Emissions - Witcher 3 Fan Noise
36 dB(A) (58%)
...
...
Clock Speed - GPU Clock Witcher 3 ultra
1004 MHz (39%)
...
...
- Range of benchmark values for this graphics card
- Average benchmark values for this graphics card
* Smaller numbers mean a higher performance
Game Benchmarks The following benchmarks stem from our benchmarks of review laptops. The performance depends on the used graphics memory, clock rate, processor, system settings, drivers, and operating systems. So the results don't have to be representative for all laptops with this GPU. For detailed information on the benchmark results, click on the fps number.
...
...
max:
...
...
max:
...
...
max:
...
max:
...
max:
» With all tested laptops playable in detail settings med..
...
...
...
...
...
...
» With all tested laptops playable in detail settings low.
...
...
...
...
max:
...
...
max:
...
» With all tested laptops playable in detail settings med..
...
...
max:
...
...
max:
...
...
max:
...
max:
» With all tested laptops playable in detail settings low.
...
...
max:
...
...
max:
...
...
max:
...
max:
» With all tested laptops playable in detail settings med..
...
...
max:
...
...
max:
...
...
max:
...
max:
...
max:
» With all tested laptops playable in detail settings low.
...
...
max:
...
...
max:
...
...
max:
...
max:
» With all tested laptops playable in detail settings med..
...
...
...
...
max:
...
...
max:
...
max:
» With all tested laptops playable in detail settings med..
...
...
...
...
max:
...
...
max:
...
max:
» With all tested laptops playable in detail settings low.
...
...
max:
...
...
max:
» With all tested laptops playable in detail settings ultra.
...
...
max:
...
...
max:
...
...
max:
...
...
max:
...
max:
...
max:
» With all tested laptops playable in detail settings low.
...
...
max:
...
...
max:
...
...
max:
» With all tested laptops playable in detail settings low.
...
...
max:
...
...
...
...
...
...
...
» With all tested laptops playable in detail settings high.
...
max:
...
max:
...
max:
...
max:
max:
» With all tested laptops playable in detail settings ultra.
...
...
max:
...
...
max:
...
...
max:
...
...
max:
» With all tested laptops playable in detail settings low.
...
...
max:
...
...
max:
» With all tested laptops playable in detail settings low.
...
max:
Intel Arc A580
...
...
max:
...
...
max:
...
max:
» With all tested laptops playable in detail settings med..
...
...
max:
...
...
max:
...
...
max:
» With all tested laptops playable in detail settings med..
...
...
max:
...
...
max:
...
...
...
...
max:
» With all tested laptops playable in detail settings high.
...
...
max:
...
...
...
...
max:
...
max:
» With all tested laptops playable in detail settings low.
...
...
max:
...
...
max:
...
...
max:
...
...
max:
...
max:
» With all tested laptops playable in detail settings med..
...
...
max:
...
...
max:
...
...
max:
...
...
max:
...
max:
...
max:
» With all tested laptops playable in detail settings low.
...
...
...
...
...
...
...
...
» With all tested laptops playable in detail settings med..
...
...
max:
...
...
max:
...
max:
» With all tested laptops playable in detail settings med..
...
max:
...
...
...
...
...
...
max:
...
max:
» With all tested laptops playable in detail settings med..
...
...
max:
...
...
max:
...
...
max:
...
...
max:
» With all tested laptops playable in detail settings high.
...
...
max:
...
...
max:
» With all tested laptops playable in detail settings high.
...
max:
...
max:
» The benchmarks indicate that the game is not playable in the tested settings.
...
...
max:
...
...
max:
...
max:
» The benchmarks indicate that the game is not playable in the tested settings.
...
...
max:
...
max:
...
max:
» With all tested laptops playable in detail settings ultra.
...
...
max:
...
...
max:
...
...
max:
...
...
max:
» With all tested laptops playable in detail settings low.
...
...
max:
...
...
max:
...
...
max:
...
...
max:
» With all tested laptops playable in detail settings ultra.
...
...
max:
...
max:
» With all tested laptops playable in detail settings ultra.
...
...
max:
...
...
max:
...
...
max:
...
...
max:
...
max:
» With all tested laptops playable in detail settings low.
...
...
max:
...
...
max:
...
...
max:
...
...
max:
...
max:
» With all tested laptops playable in detail settings high.
...
...
max:
...
...
max:
...
...
max:
...
...
max:
» With all tested laptops playable in detail settings low.
...
...
...
...
...
...
max:
...
...
max:
...
max:
» With all tested laptops playable in detail settings high.
...
...
max:
...
...
max:
...
...
max:
...
...
max:
...
max:
» With all tested laptops playable in detail settings med..
...
...
...
...
...
max:
max:
max:
» With all tested laptops playable in detail settings ultra.
...
...
max:
...
...
max:
...
...
max:
...
...
max:
» With all tested laptops playable in detail settings high.
...
...
max:
...
...
max:
...
...
max:
...
...
max:
» With all tested laptops playable in detail settings low.
...
...
max:
...
...
max:
...
...
max:
...
max:
» With all tested laptops playable in detail settings low.
...
...
max:
...
...
max:
...
...
max:
...
...
max:
» With all tested laptops playable in detail settings high.
...
...
max:
...
...
max:
...
...
max:
...
...
max:
...
max:
» With all tested laptops playable in detail settings high.
...
...
» With all tested laptops playable in detail settings high.
...
...
...
...
max:
...
...
max:
...
...
max:
...
max:
» With all tested laptops playable in detail settings med..
...
...
» With all tested laptops playable in detail settings high.
...
...
...
...
max:
max:
» With all tested laptops playable in detail settings ultra.
...
...
max:
...
max:
» With all tested laptops playable in detail settings high.
...
...
max:
...
...
max:
...
...
max:
...
...
max:
» With all tested laptops playable in detail settings low.
...
...
max:
...
...
max:
...
...
max:
...
...
max:
» With all tested laptops playable in detail settings high.
...
max:
» With all tested laptops playable in detail settings ultra.
...
max:
...
...
max:
...
...
max:
...
...
max:
...
max:
» With all tested laptops playable in detail settings ultra.
Additional Benchmarks
Medium Preset FXAA 1920x1080
...
...
...
...
» With all tested laptops playable in detail settings high.
...
...
max:
...
...
max:
...
...
» With all tested laptops playable in detail settings low.
...
...
...
...
...
...
...
...
max:
» With all tested laptops playable in detail settings ultra.
Additional Benchmarks
Epic (Render Scale 100 %) 16xAF SMAA 3820x2160
Epic (Render Scale 100 %) 16xAF SMAA 2560x1440
...
...
max:
» The benchmarks indicate that the game is not playable in the tested settings.
...
...
max:
...
...
max:
» The benchmarks indicate that the game is not playable in the tested settings.
...
...
max:
...
...
max:
...
...
max:
...
max:
» With all tested laptops playable in detail settings ultra.
...
...
max:
...
max:
» With all tested laptops playable in detail settings ultra.
...
...
max:
...
...
max:
...
...
max:
...
...
max:
» With all tested laptops playable in detail settings ultra.
...
...
max:
...
...
max:
...
...
max:
0 Tooltip MacBook Pro 15 2018 (2.6 GHz, 560X): Ø22.3 (20-23)
...
...
max:
» With all tested laptops playable in detail settings med..
...
...
max:
...
...
max:
...
...
max:
...
max:
» With all tested laptops playable in detail settings high.
Additional Benchmarks
Normal/Off 4xAF 1920x1080
Lowest Settings possible 1920x1080
...
...
max:
» With all tested laptops playable in detail settings ultra.
...
...
max:
» With all tested laptops playable in detail settings ultra.
For more games that might be playable and a list of all games and graphics cards visit our Gaming List
v1.26
log 18. 04:17:03
#0 no ids found in url (should be separated by "_") +0s ... 0s
#1 not redirecting to Ajax server +0s ... 0s
#2 did not recreate cache, as it is less than 5 days old! Created at Tue, 16 Apr 2024 05:39:00 +0200 +0.001s ... 0.001s
#3 composed specs +0.061s ... 0.062s
#4 did output specs +0s ... 0.062s
#5 start showIntegratedCPUs +0s ... 0.062s
#6 getting avg benchmarks for device 8838 +0.016s ... 0.078s
#7 got single benchmarks 8838 +0.012s ... 0.09s
#8 got avg benchmarks for devices +0s ... 0.09s
#9 min, max, avg, median took s +0.429s ... 0.519s
#10 before gaming benchmark output +0s ... 0.519s
#11 Got 250 rows for game benchmarks. +0.045s ... 0.565s
#12 composed SQL query for gamebenchmarks +0s ... 0.565s
#13 got data and put it in $dataArray +0.048s ... 0.613s
#14 benchmarks composed for output. +2.493s ... 3.106s
#15 return log +0.064s ... 3.17s
Please share our article, every link counts!
» Comparison of GPUs
» Benchmark List
» Notebook Gaming List
Class 1
Class 2 Radeon PRO W6600M *
Class 3 UHD Graphics 32EUs
UHD Graphics 750
Class 4
Class 5 * Approximate position of the graphics adapter
Working For Notebookcheck
Are you a techie who knows how to translate? Then join our Team!
Details here
Top 10 Laptops Multimedia , Budget Multimedia , Gaming , Budget Gaming , Lightweight Gaming , Business , Budget Office , Workstation , Subnotebooks , Ultrabooks , Chromebooks
under 300 USD/Euros , under 500 USD/Euros , 1,000 USD/Euros , for University Students , Best Displays
Top 10 Smartphones Smartphones , Phablets , ≤6-inch , Camera Smartphones
Klaus Hinum (Update: 2018-07-27)
 Deutsch
 English
 Español
 Français
 Italiano
 Nederlands
 Polski
 Português
 Русский
 Türkçe
 Svenska
 Chinese
 Magyar