

HP Dragonfly Folio 13.5 G3 convertible review: No more Snapdragon or Windows on ARM
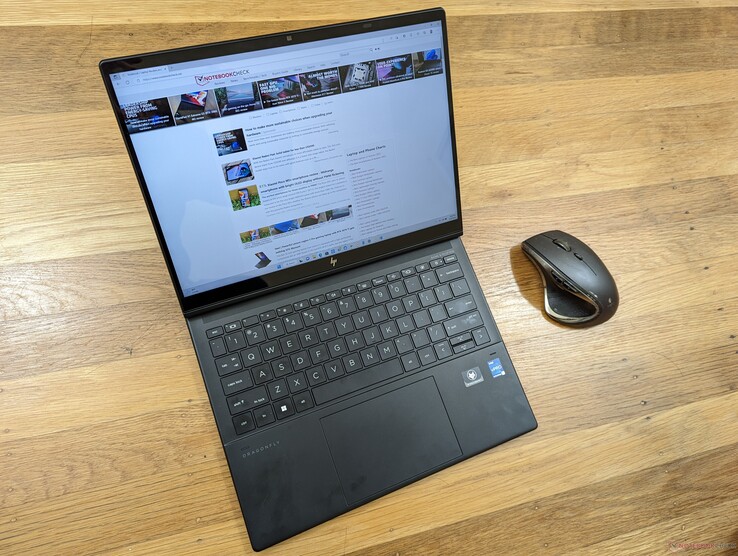
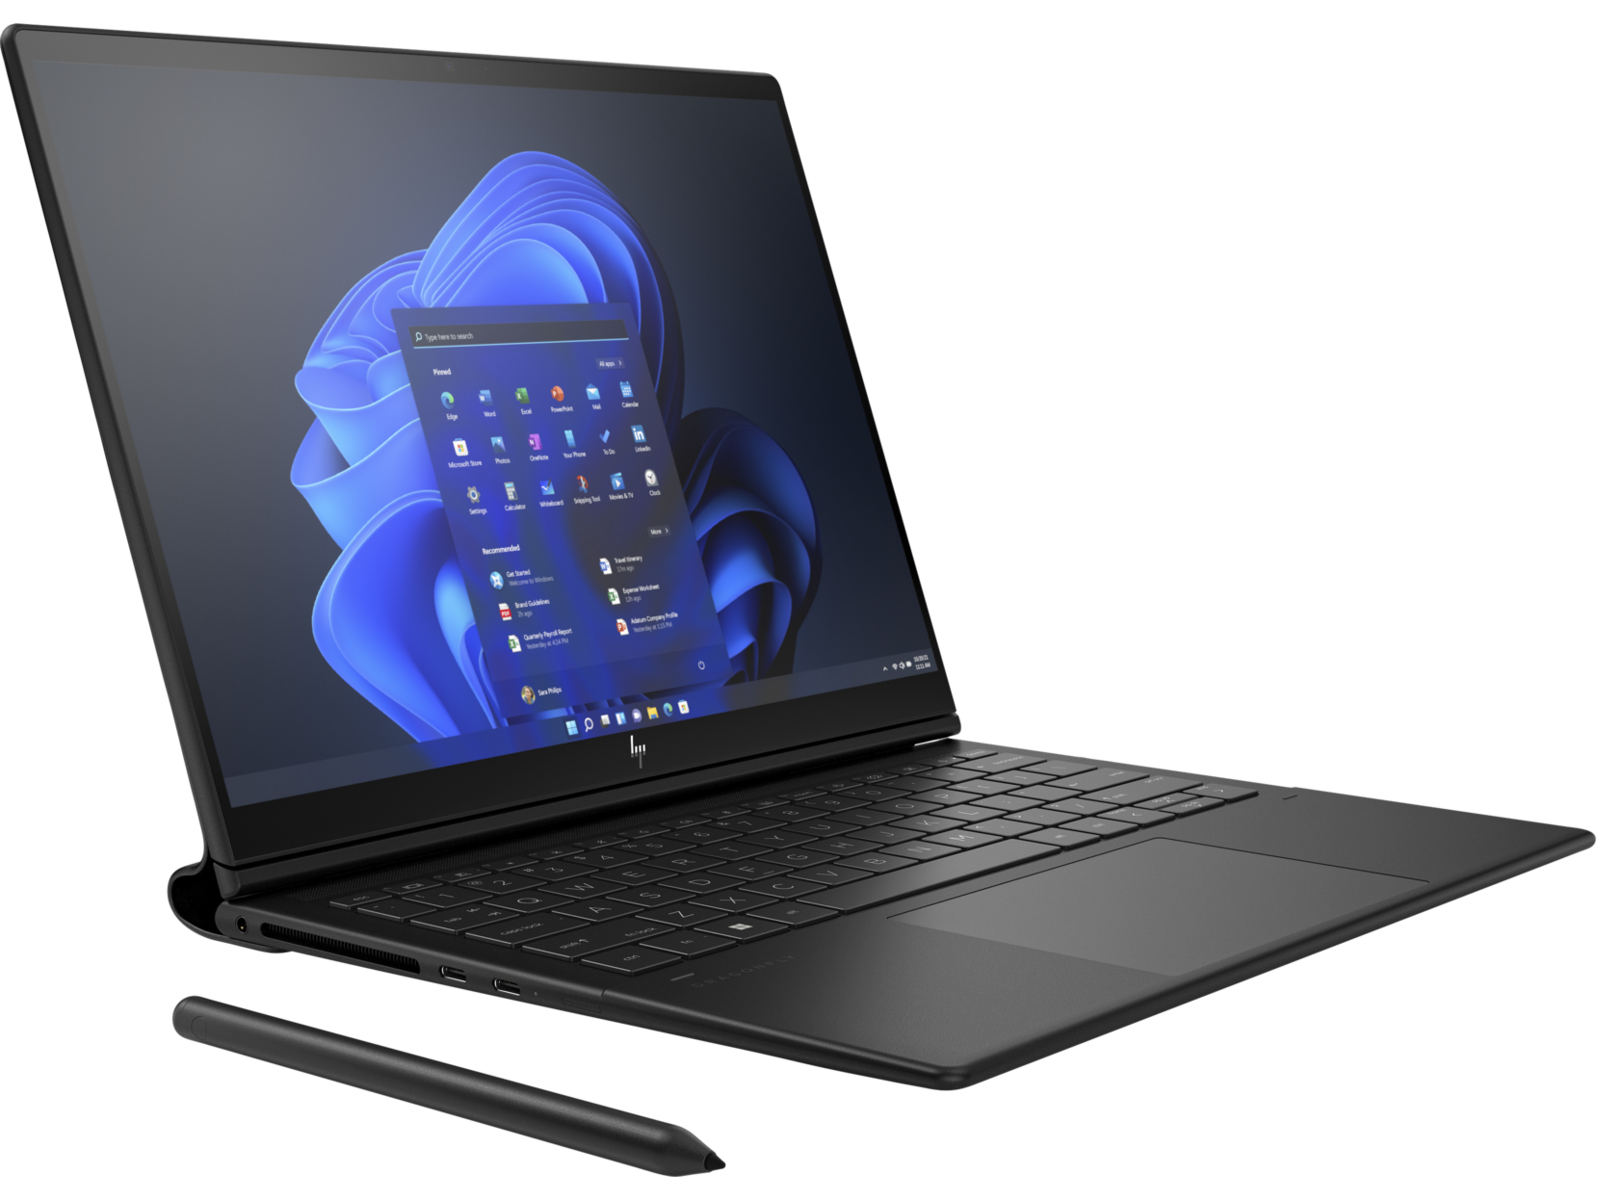
Not to be confused with the clamshell Dragonfly G3, the Dragonfly Folio G3 is the 2-in-1 version with its own unique design and features. It's a very different subnotebook in many respects, but it targets the same market of office and executive business users. The Dragonfly Folio G3 directly replaces last year's EliteBook Folio G2.
Our review unit is a middle SKU with the 12th gen Core i7-1265U CPU and 400-nit glossy touchscreen for approximately $3900 USD. Other options exist with WAN, various RAM/SSD sizes, and the lesser Core i5-1235U, i5-1245U, or i7-1255U CPU, but the 3:2 1920 x 1280 native resolution remains constant across the lineup.
Competitors in this space include other 13-inch business-centric solutions like the MSI Summit E13 Flip, Dell Latitude 7330 2-in-1, Lenovo ThinkPad L13 Yoga Gen 2, or the Microsoft Surface Pro series.
More HP reviews:
Potential Competitors in Comparison
Rating | Date | Model | Weight | Height | Size | Resolution | Price |
|---|---|---|---|---|---|---|---|
| 90.3 % v7 (old) | 12 / 2022 | HP Elite Dragonfly Folio 13.5 G3 i7-1265U, Iris Xe G7 96EUs | 1.4 kg | 17.8 mm | 13.50" | 1920x1280 | |
| 91 % v7 (old) | 08 / 2022 | HP Elite Dragonfly G3 i7-1265U, Iris Xe G7 96EUs | 1.2 kg | 16.3 mm | 13.50" | 1920x1280 | |
| 89 % v7 (old) | 07 / 2022 | Dell Latitude 13 7330 i7-1265U, Iris Xe G7 96EUs | 1 kg | 16.96 mm | 13.30" | 1920x1080 | |
| 85.1 % v7 (old) | 07 / 2022 | Framework Laptop 13.5 12th Gen Intel i7-1260P, Iris Xe G7 96EUs | 1.3 kg | 15.85 mm | 13.50" | 2256x1504 | |
| 86.6 % v7 (old) | 12 / 2020 | Razer Book 13 FHD i7-1165G7, Iris Xe G7 96EUs | 1.4 kg | 15.15 mm | 13.40" | 1920x1200 | |
| 86.1 % v7 (old) | 01 / 2021 | Lenovo ThinkPad L13 Gen2-20VH0017GE i5-1135G7, Iris Xe G7 80EUs | 1.4 kg | 17.6 mm | 13.30" | 1920x1080 |
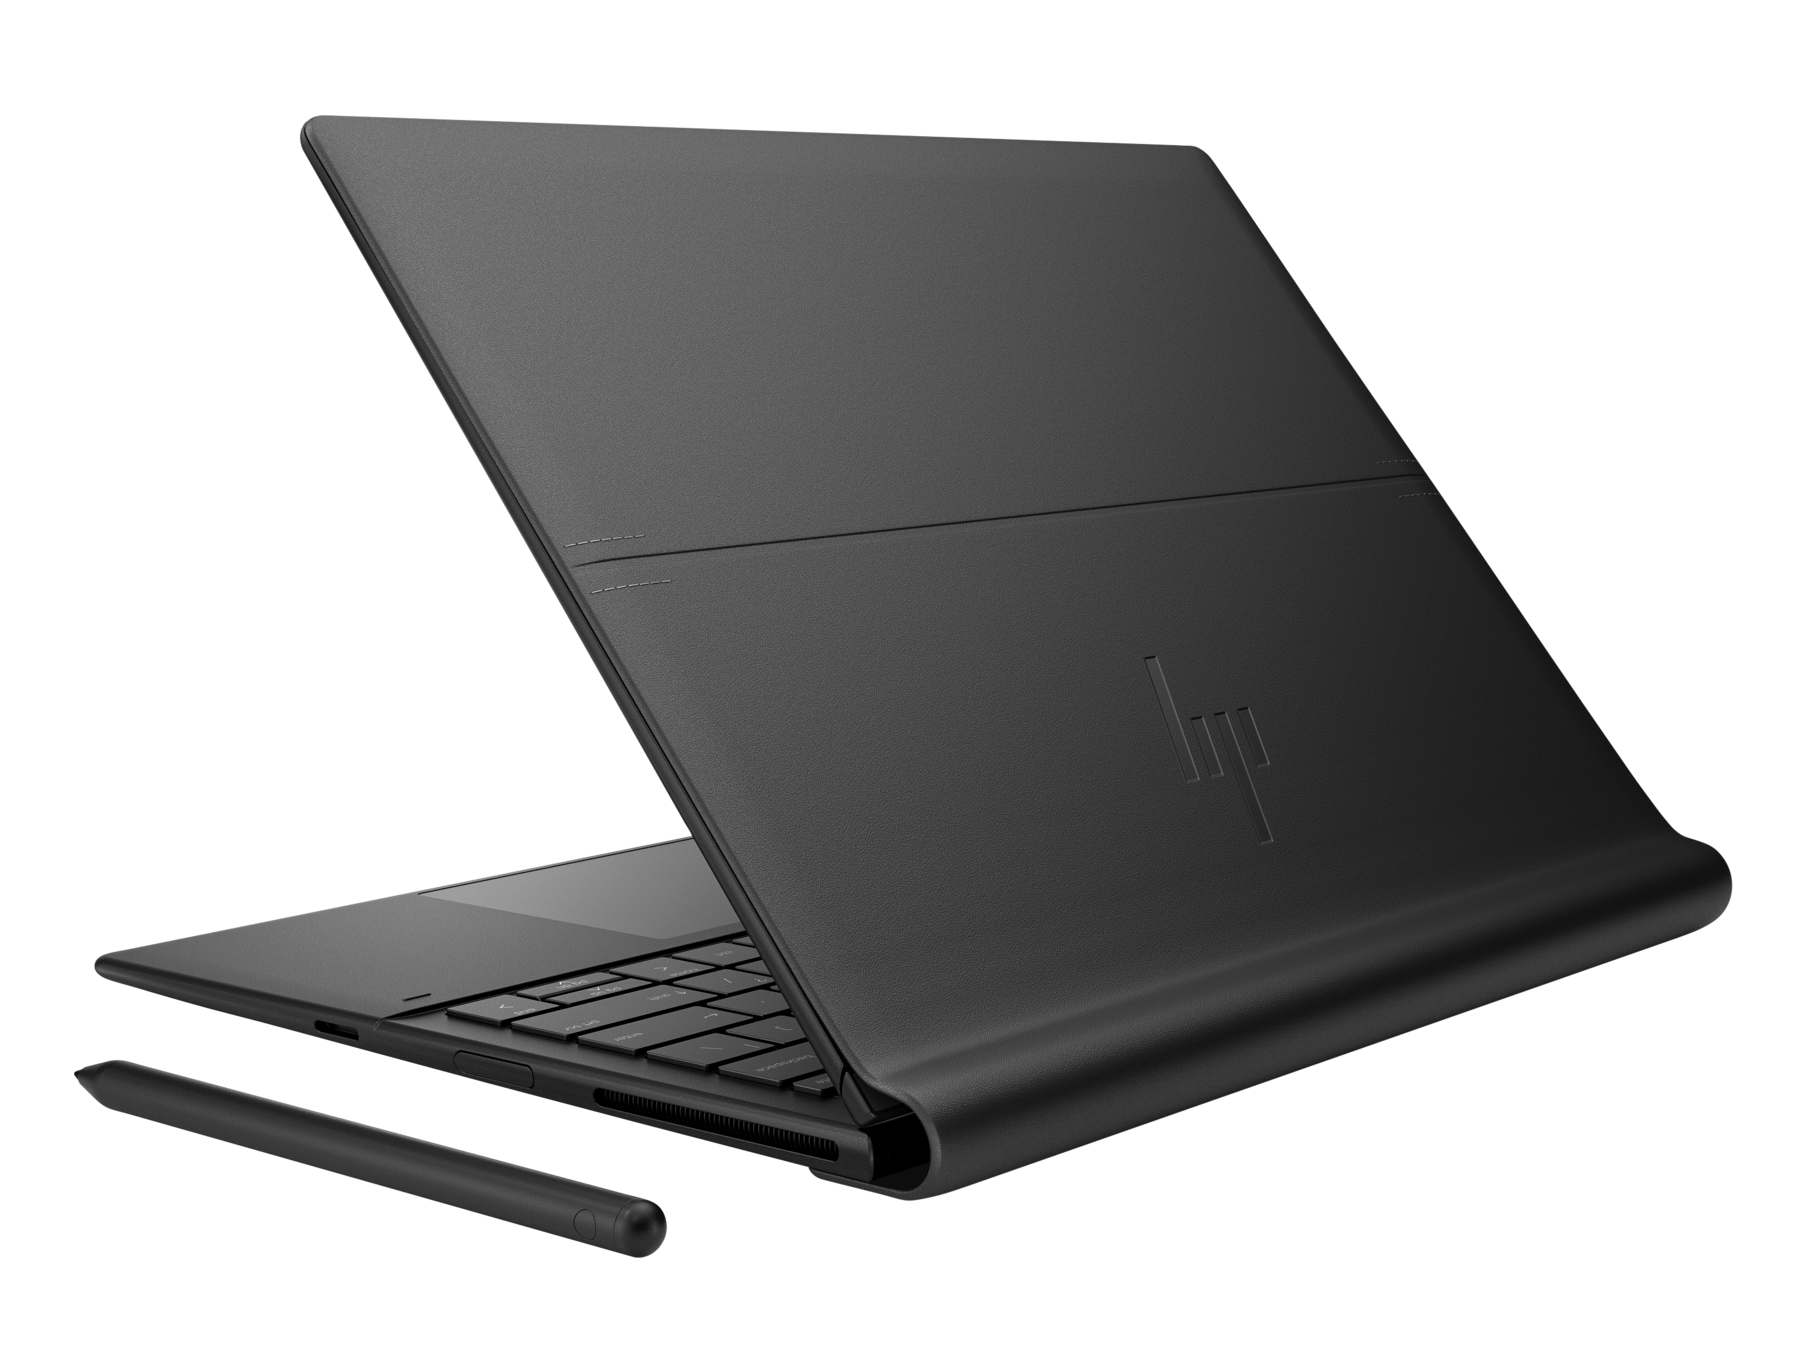
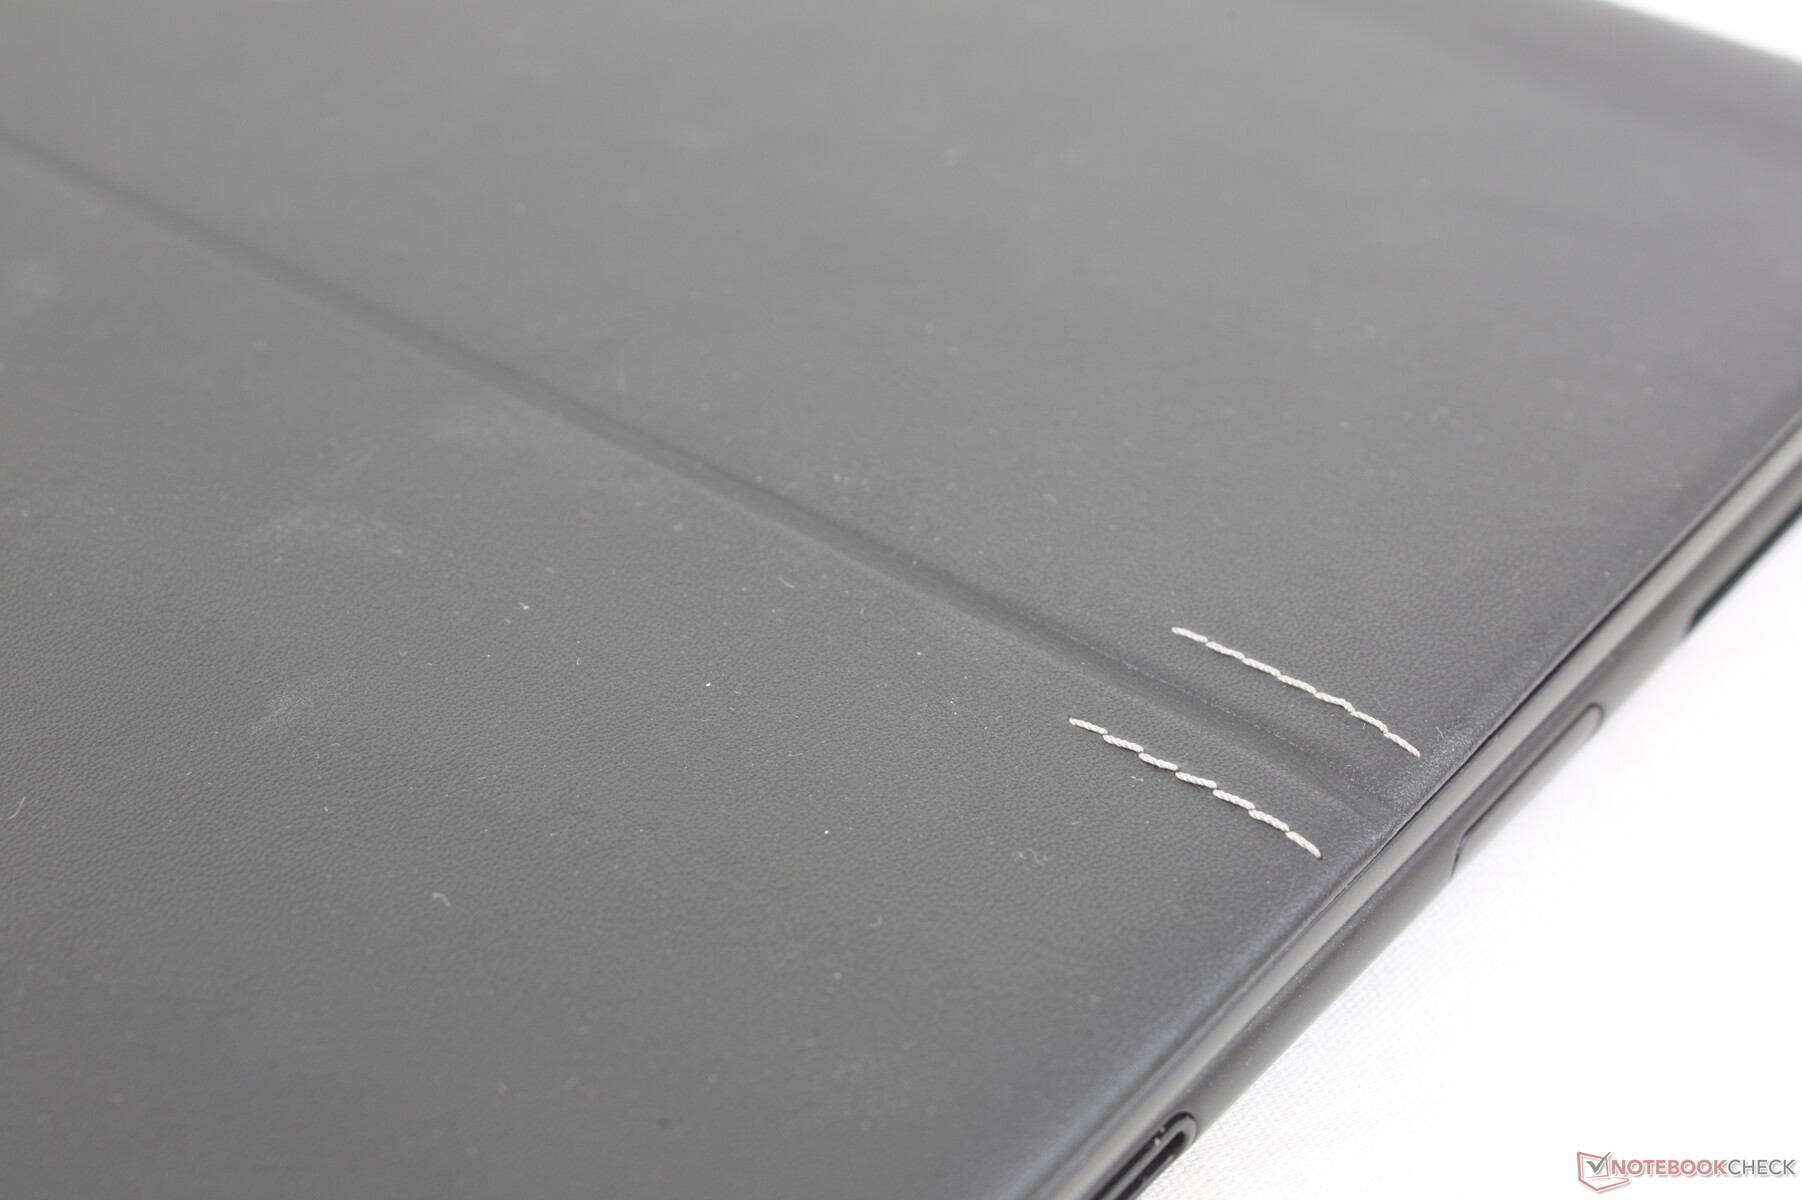
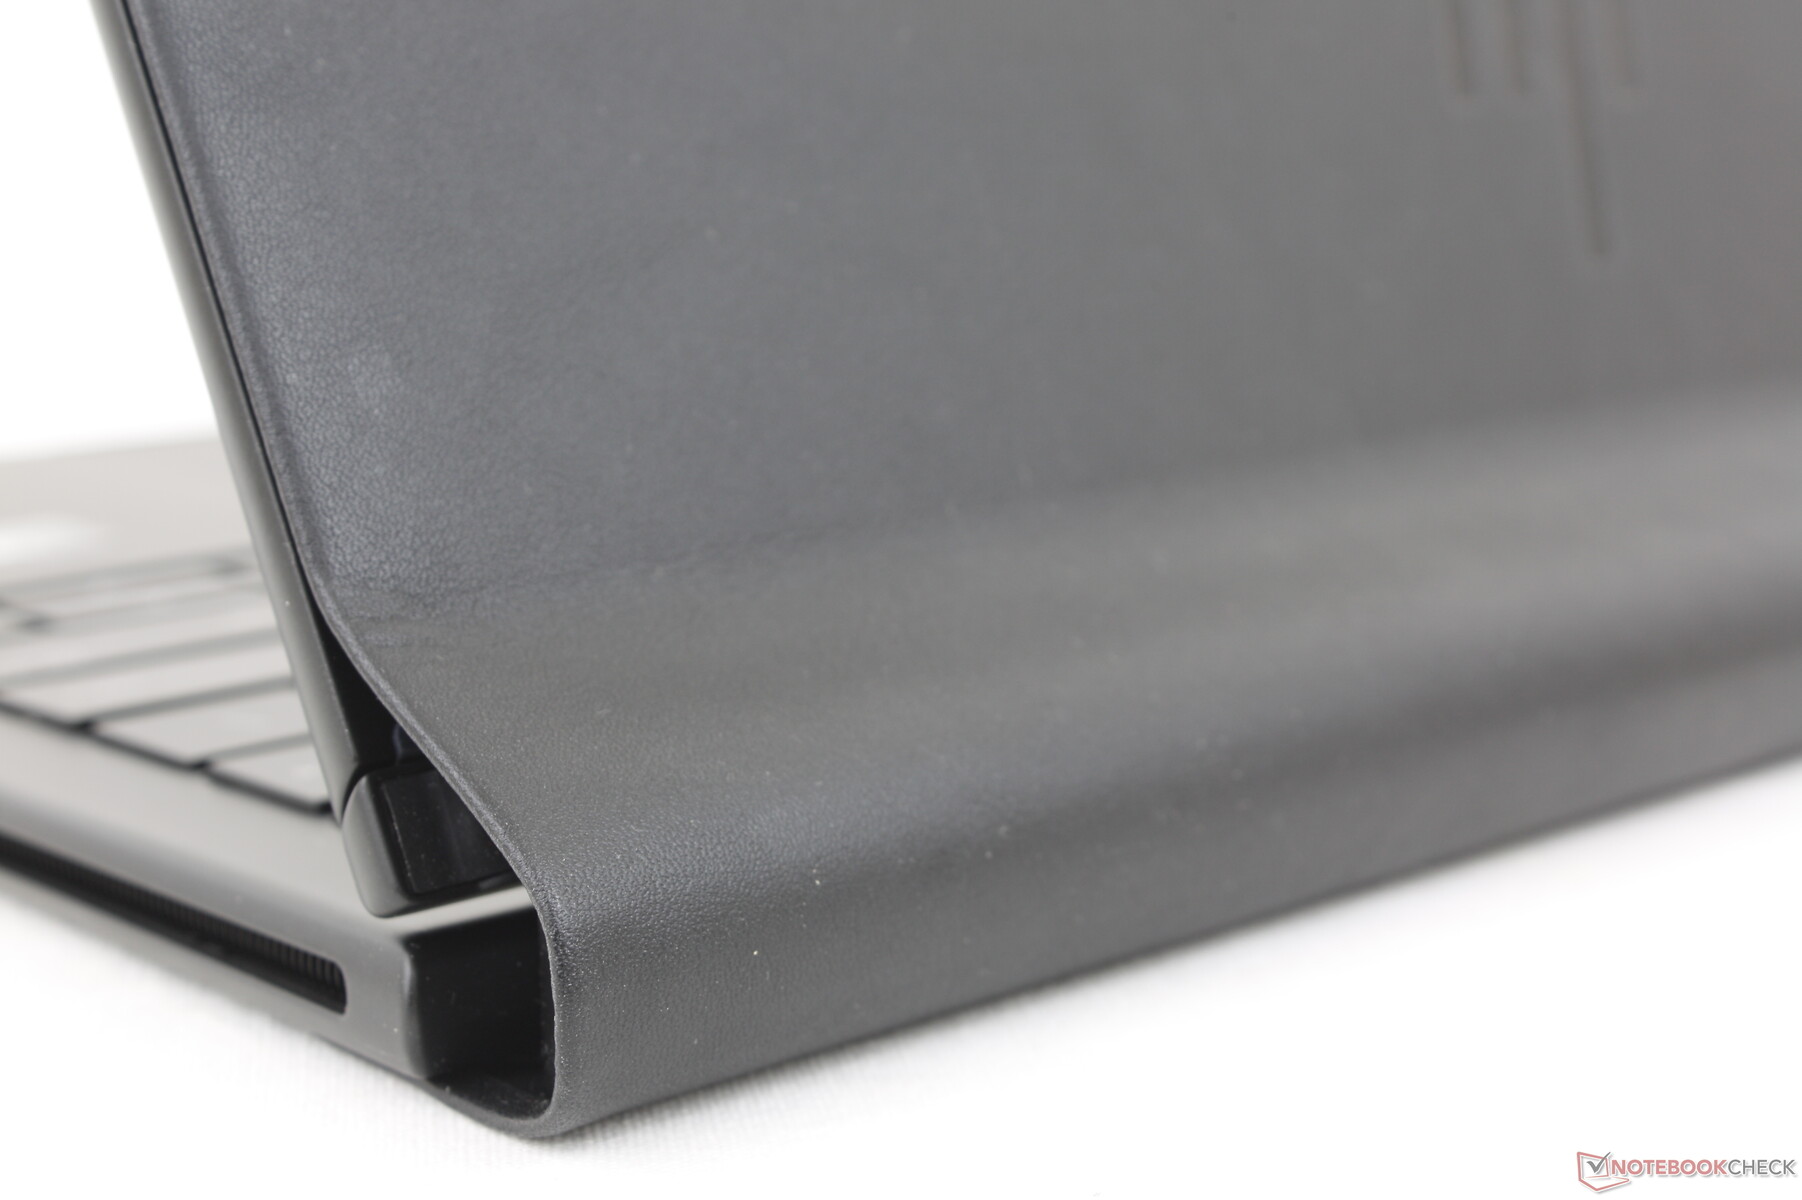
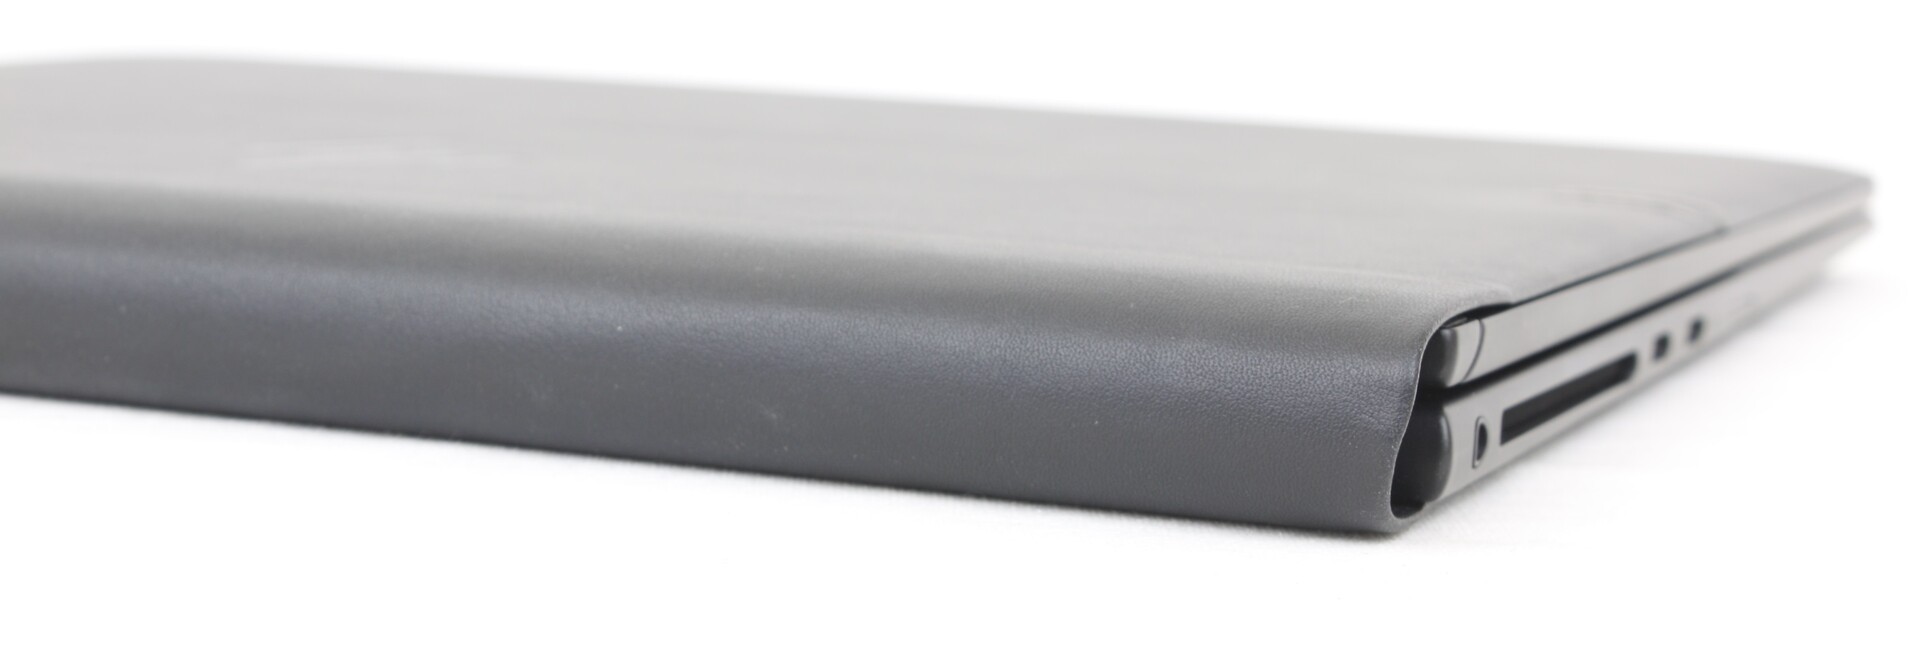
Case — Metal With Faux Leather
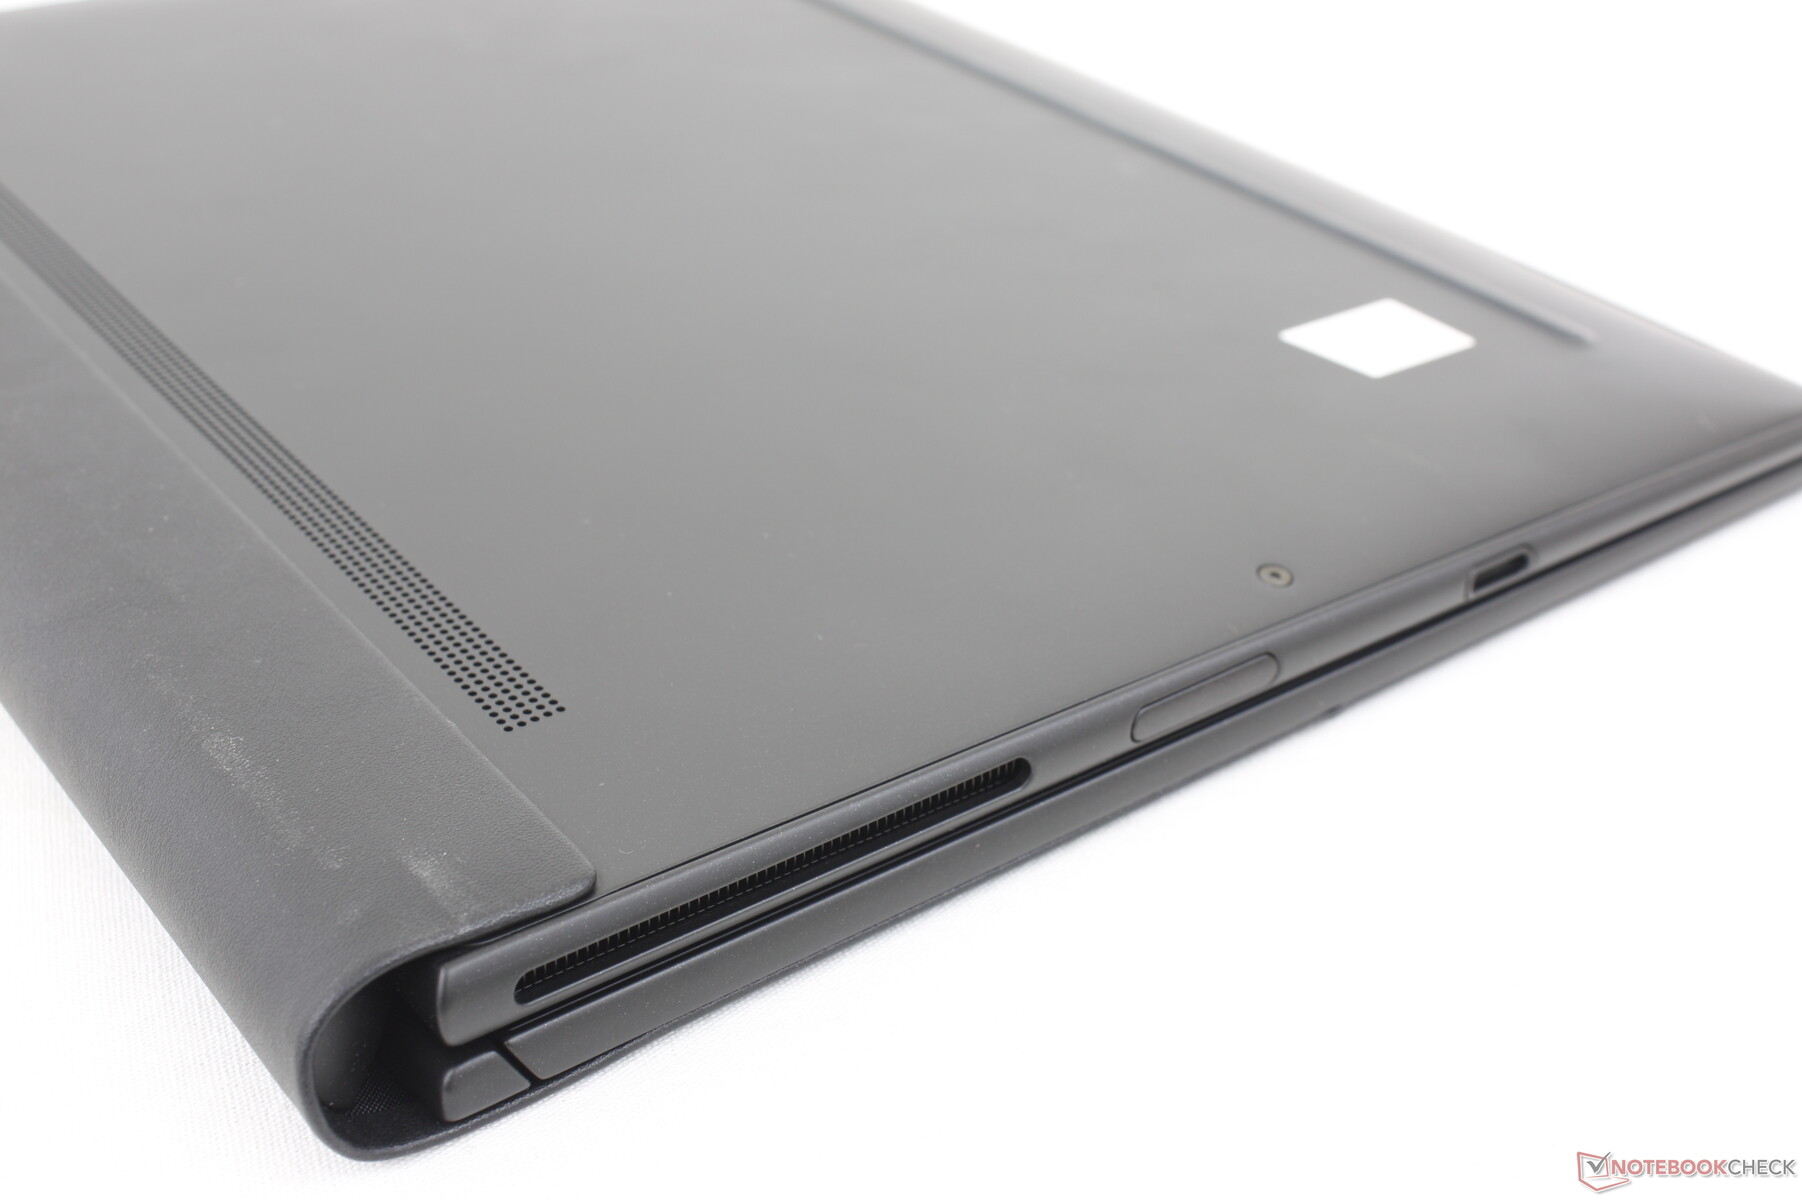
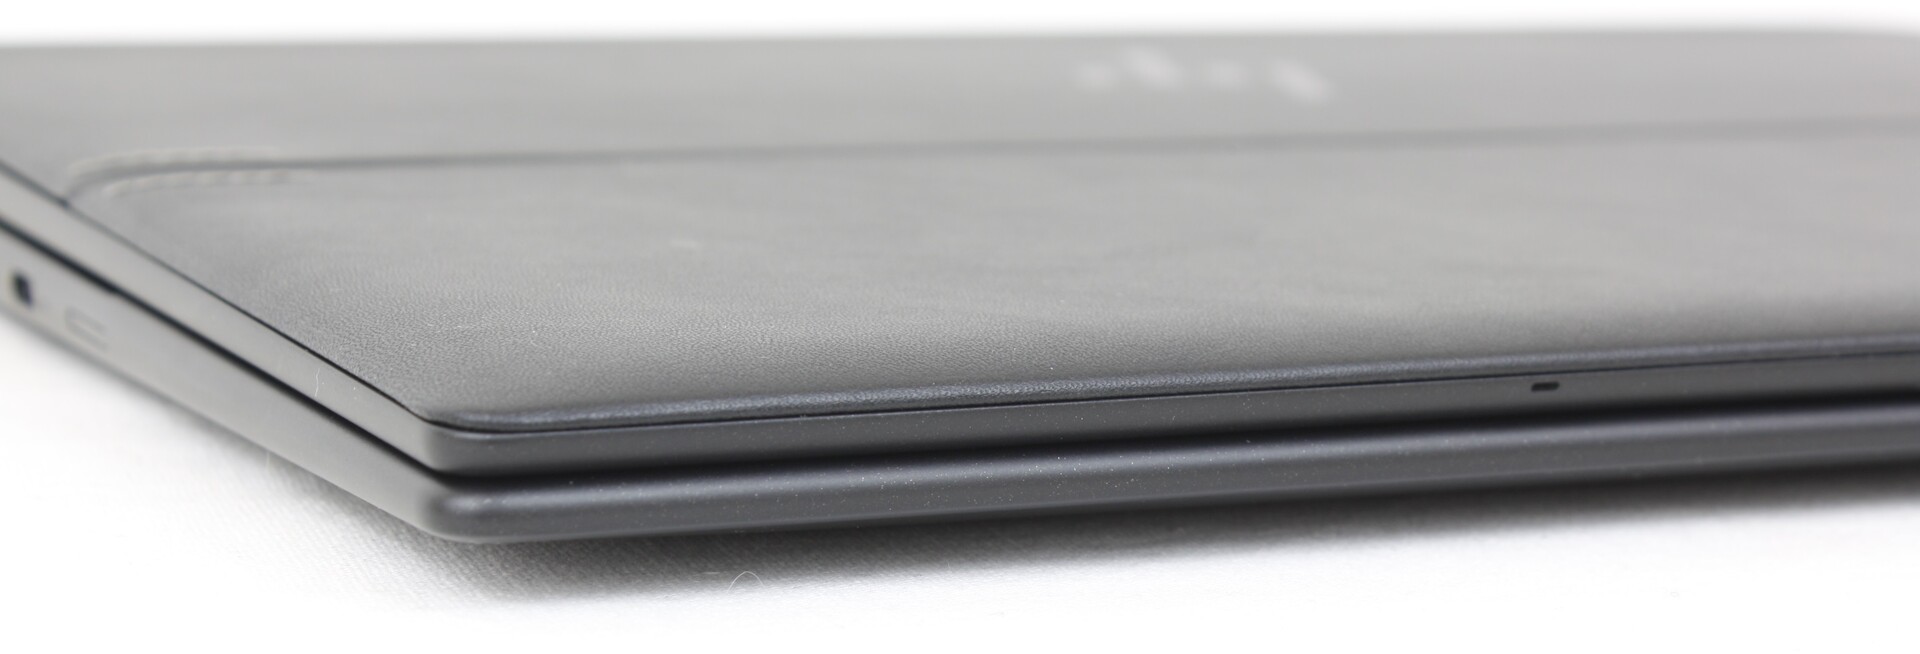
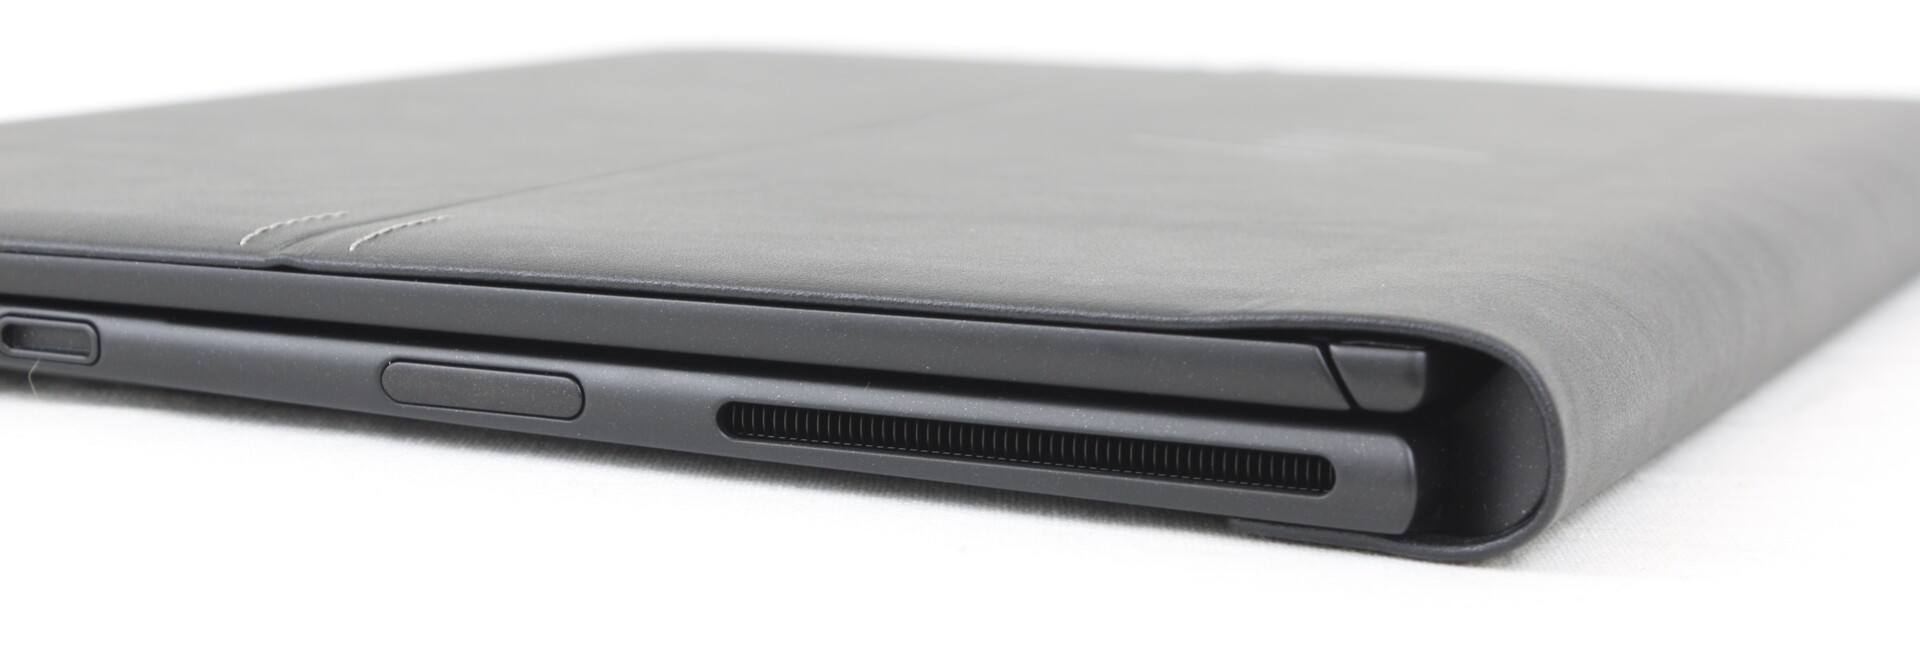
The chassis is an evolution of the original 2020 Dragonfly Folio G1 and the 2021 EliteBook Folio G2. It's most notable feature is the faux leather outer lid that partially wraps around the back of the base. The material is easier to grip than metal for tablet mode and it reduces visible fingerprints. It also adds a sense of "timelessness" to the overall visual design as opposed to the typical plastic or aluminum alloy solutions.
Chassis rigidity is just as good as last year's model since our 2022 version utilizes similar materials. HP's goal this time around was to improve serviceability and performance without sacrificing what makes the Dragonfly Folio series visually unique. Even so, the base of the system still exhibits slightly more flexing than on a Spectre 13.5 or Elitebook x360 1040 and so there is still room for improvement.
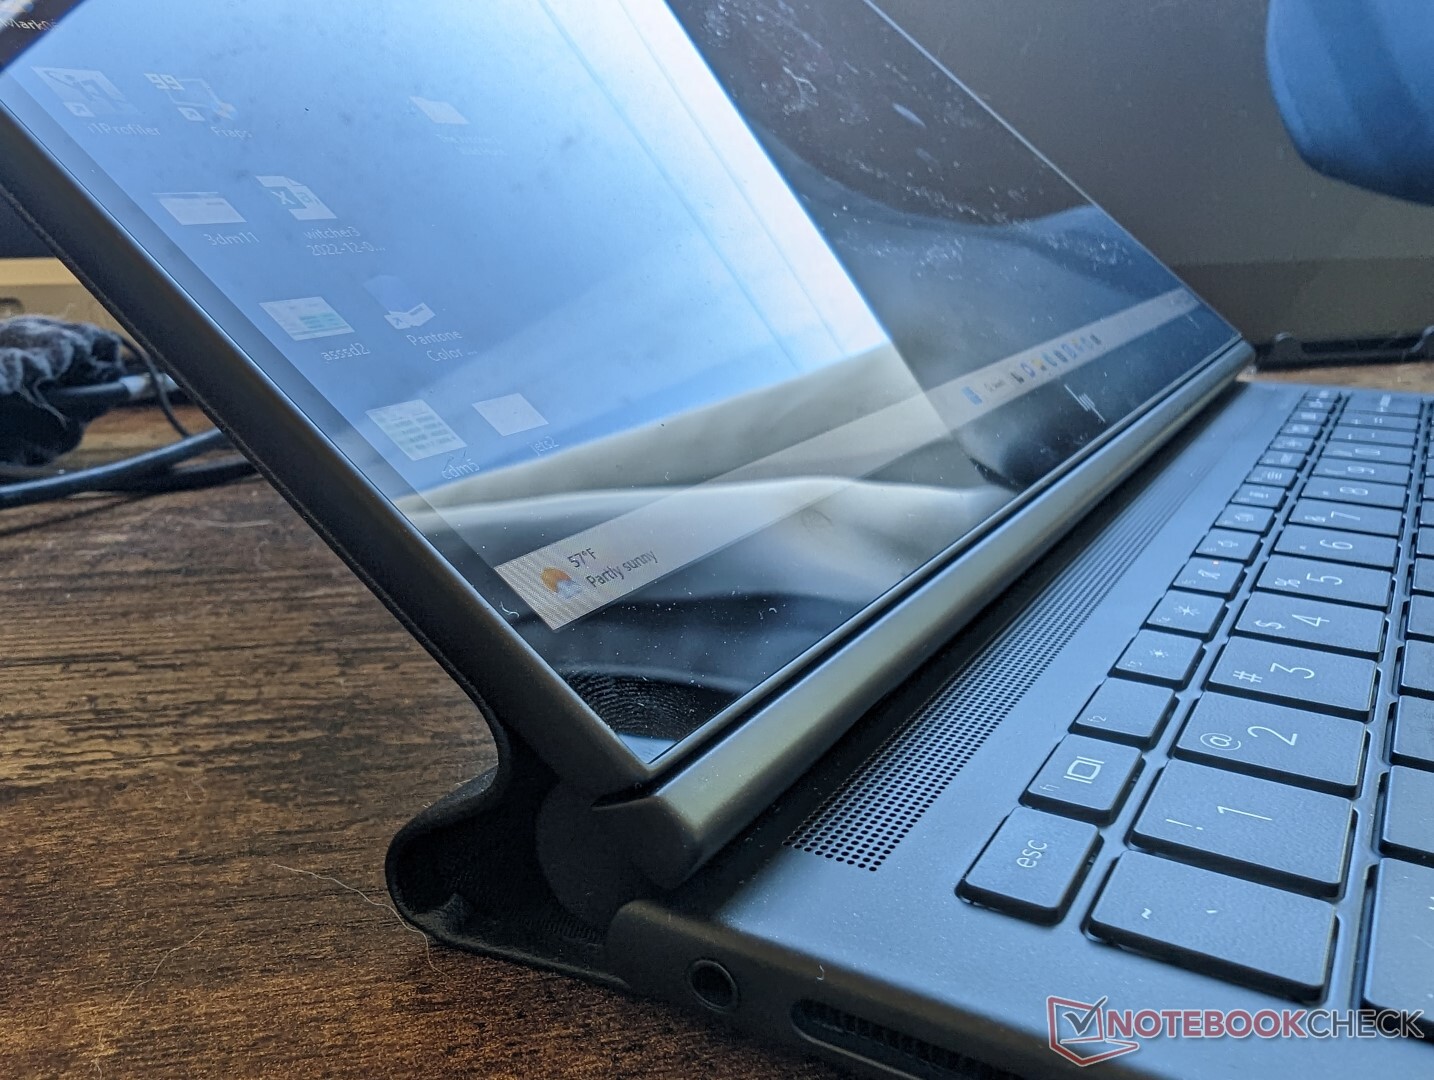
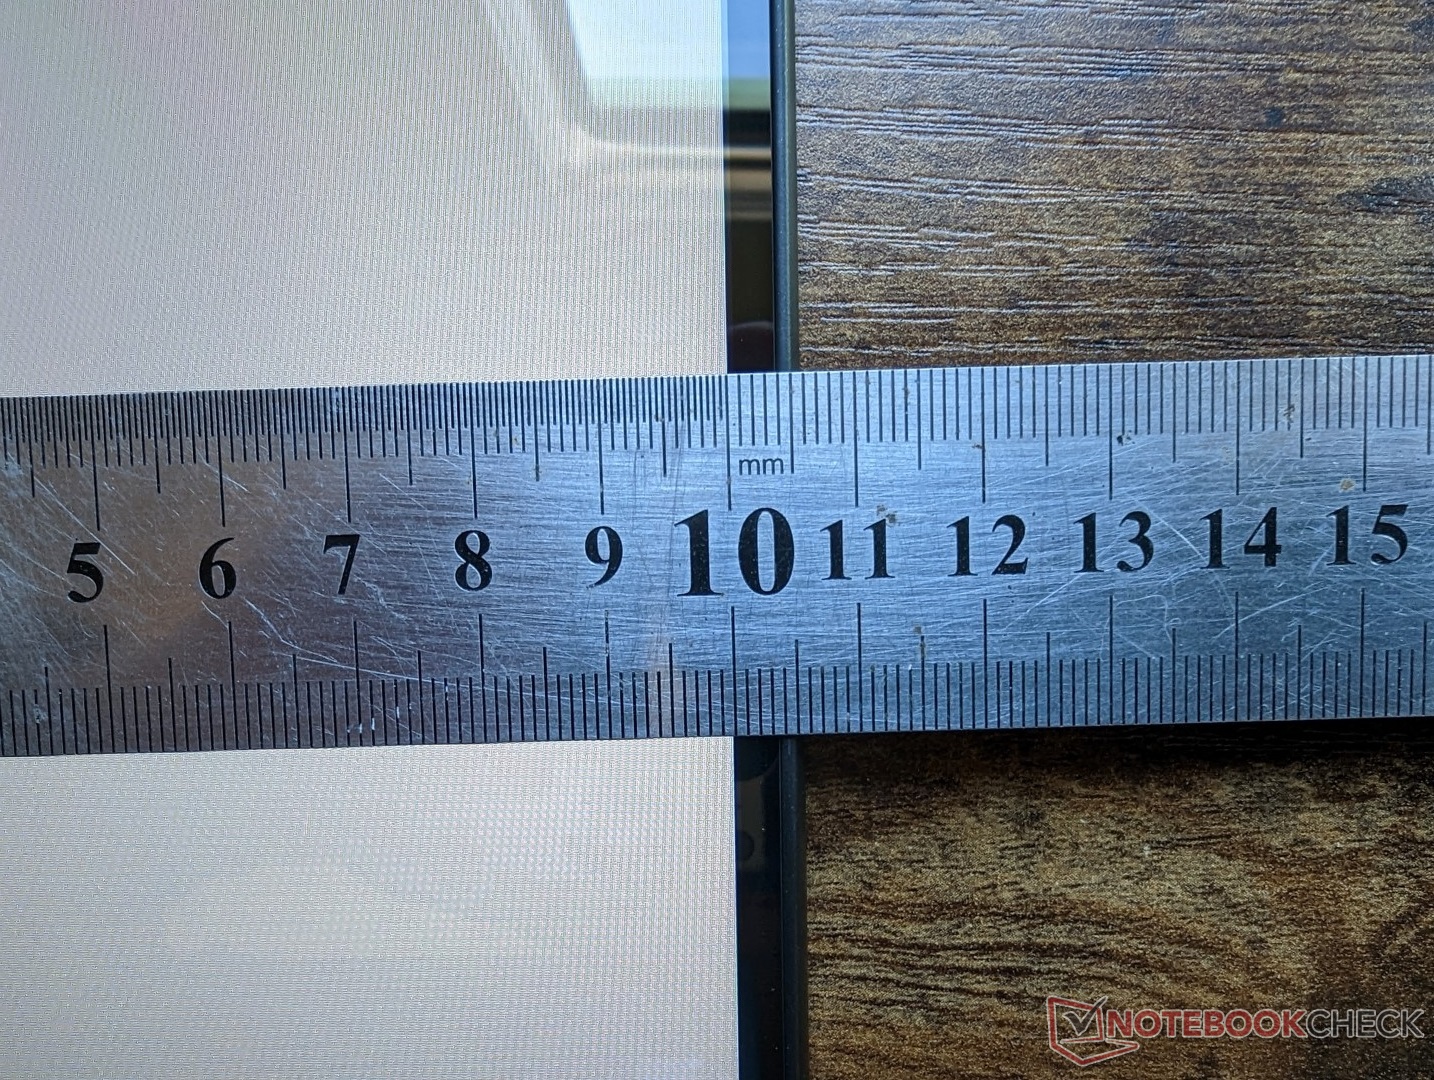
The top and bottom bezels are thicker than on most other laptops since they must support an uncommon 2-in-1 faux leather design and a large 8 MP webcam sensor. Even the more powerful Framework Laptop, for example, is slightly thinner, smaller, and lighter than the Dragonfly Folio G3. It's not heavy or large by any means, but The Dragonfly Folio G3 is certainly not the thinnest or lightest in its size class.
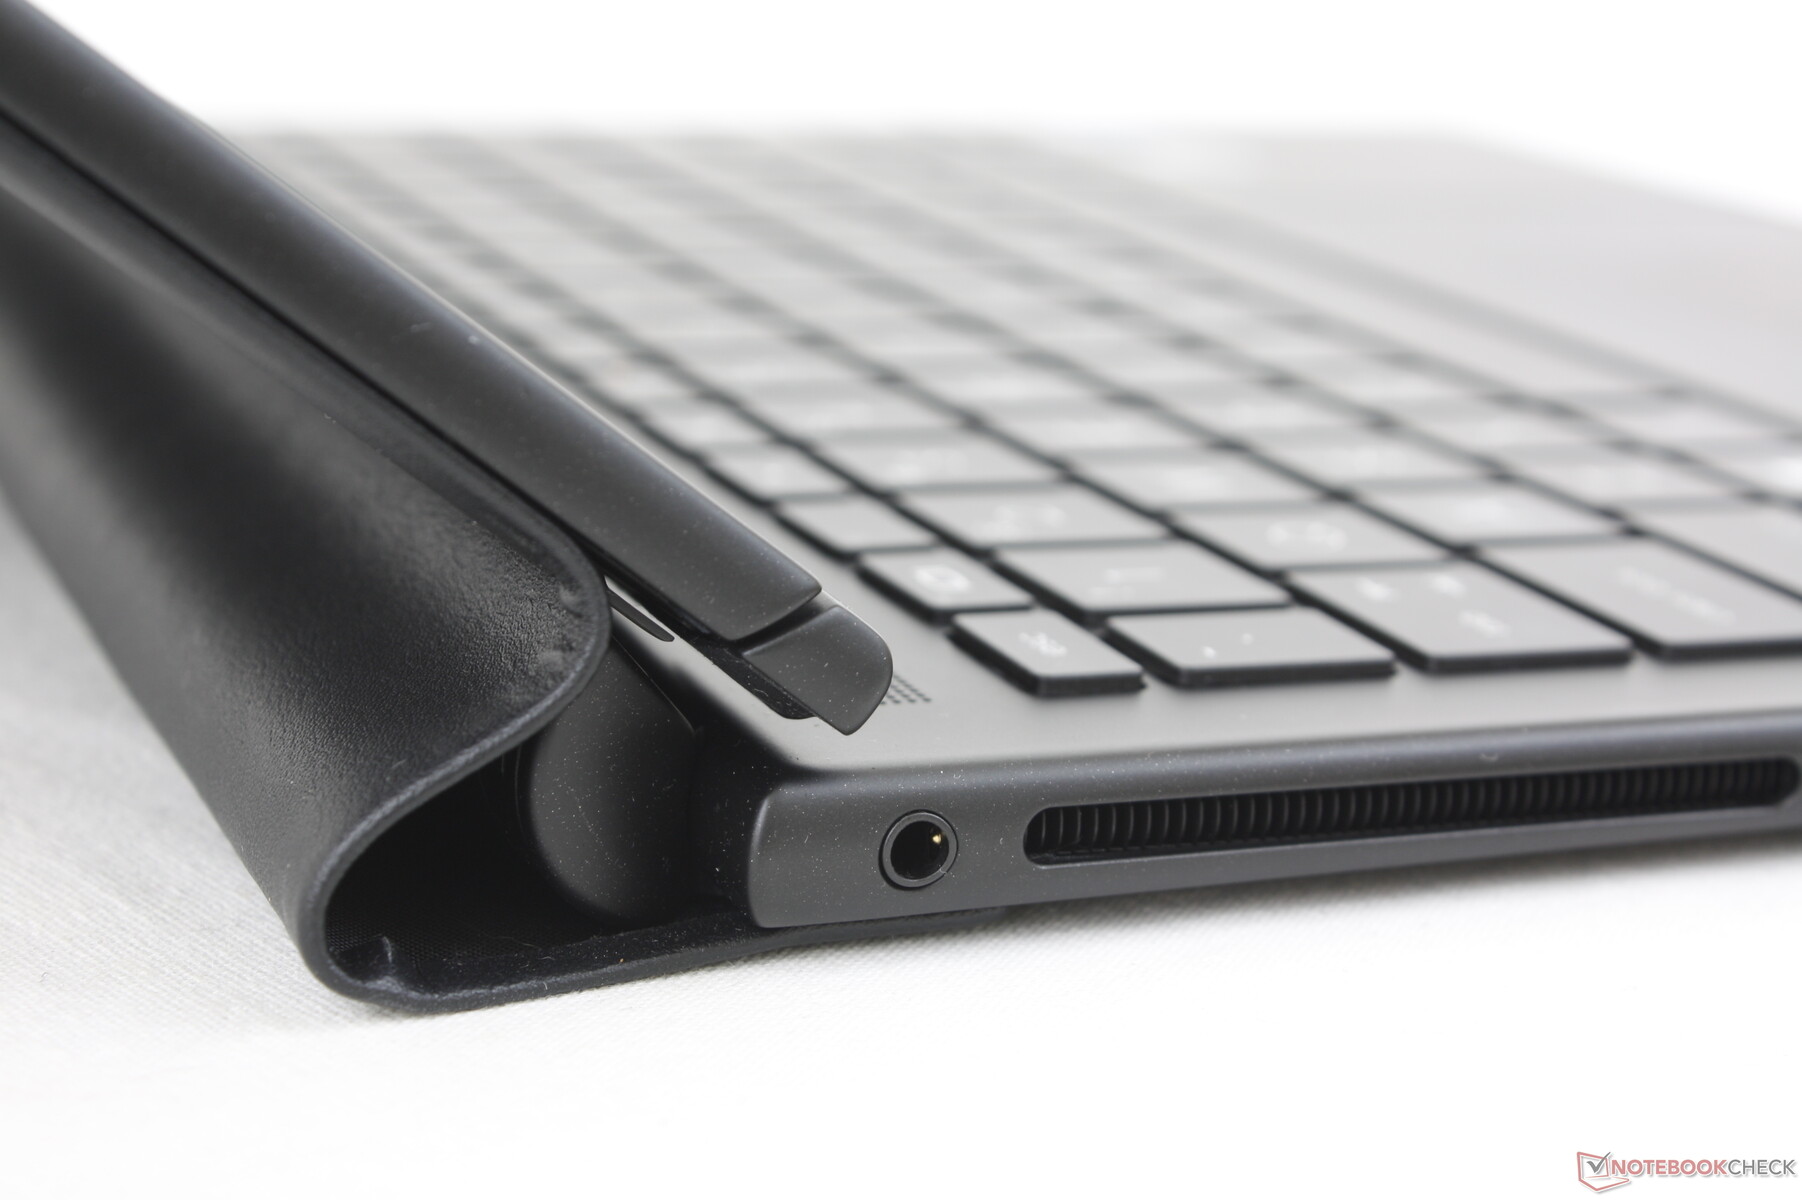
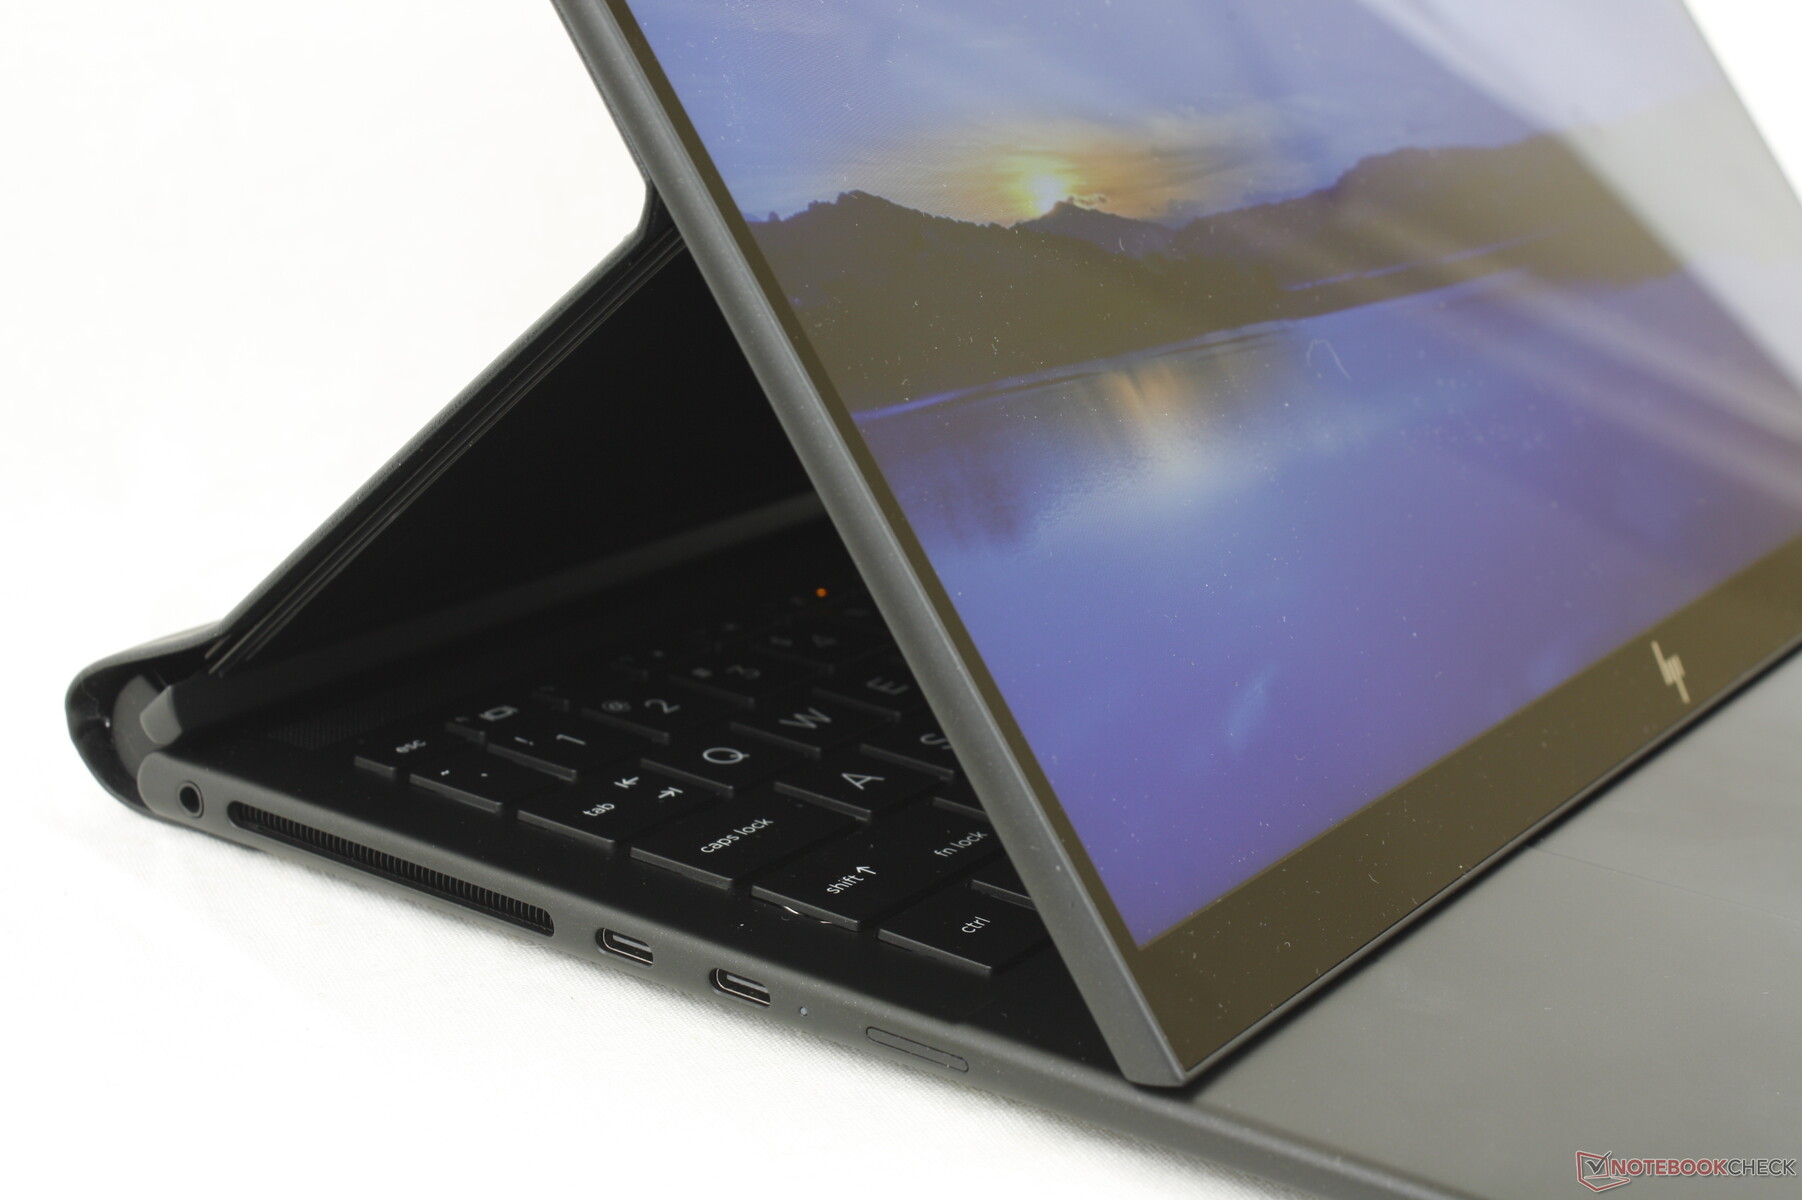
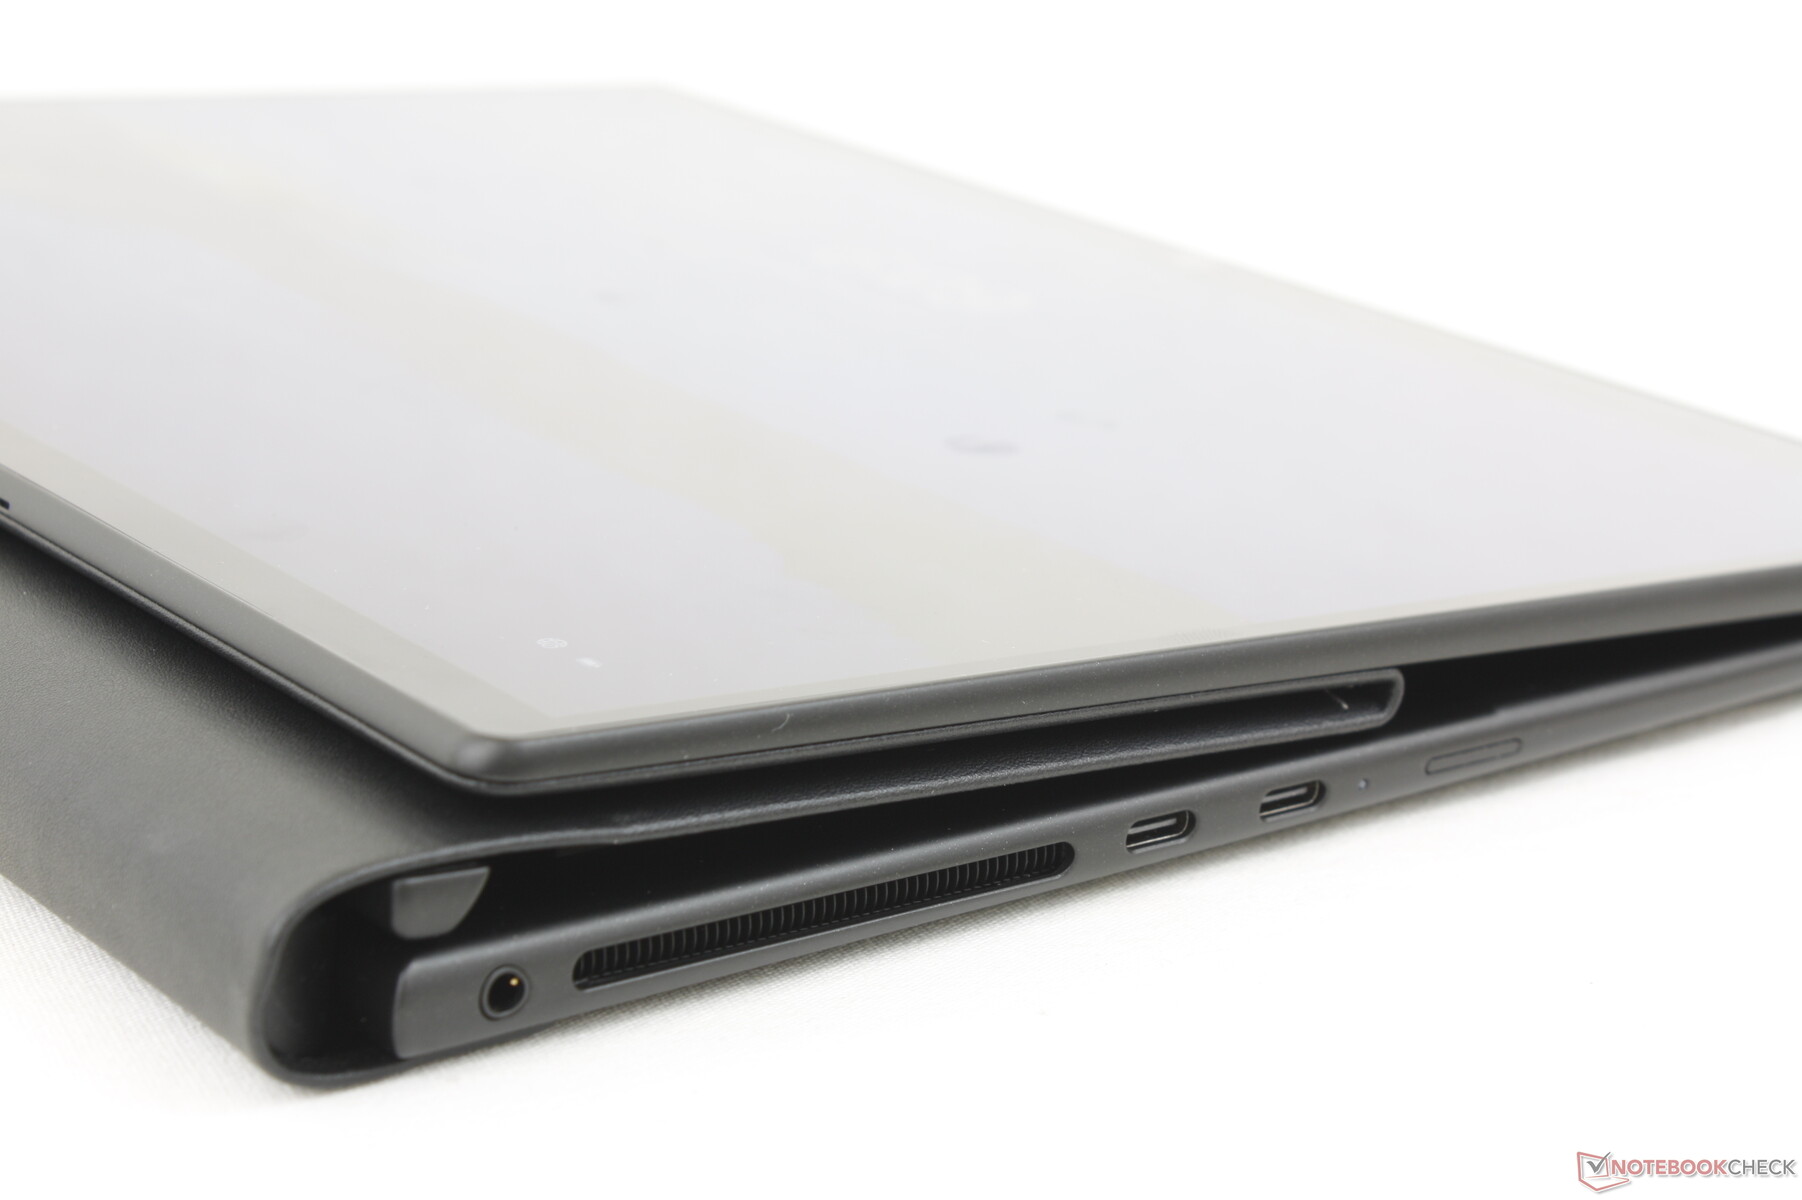
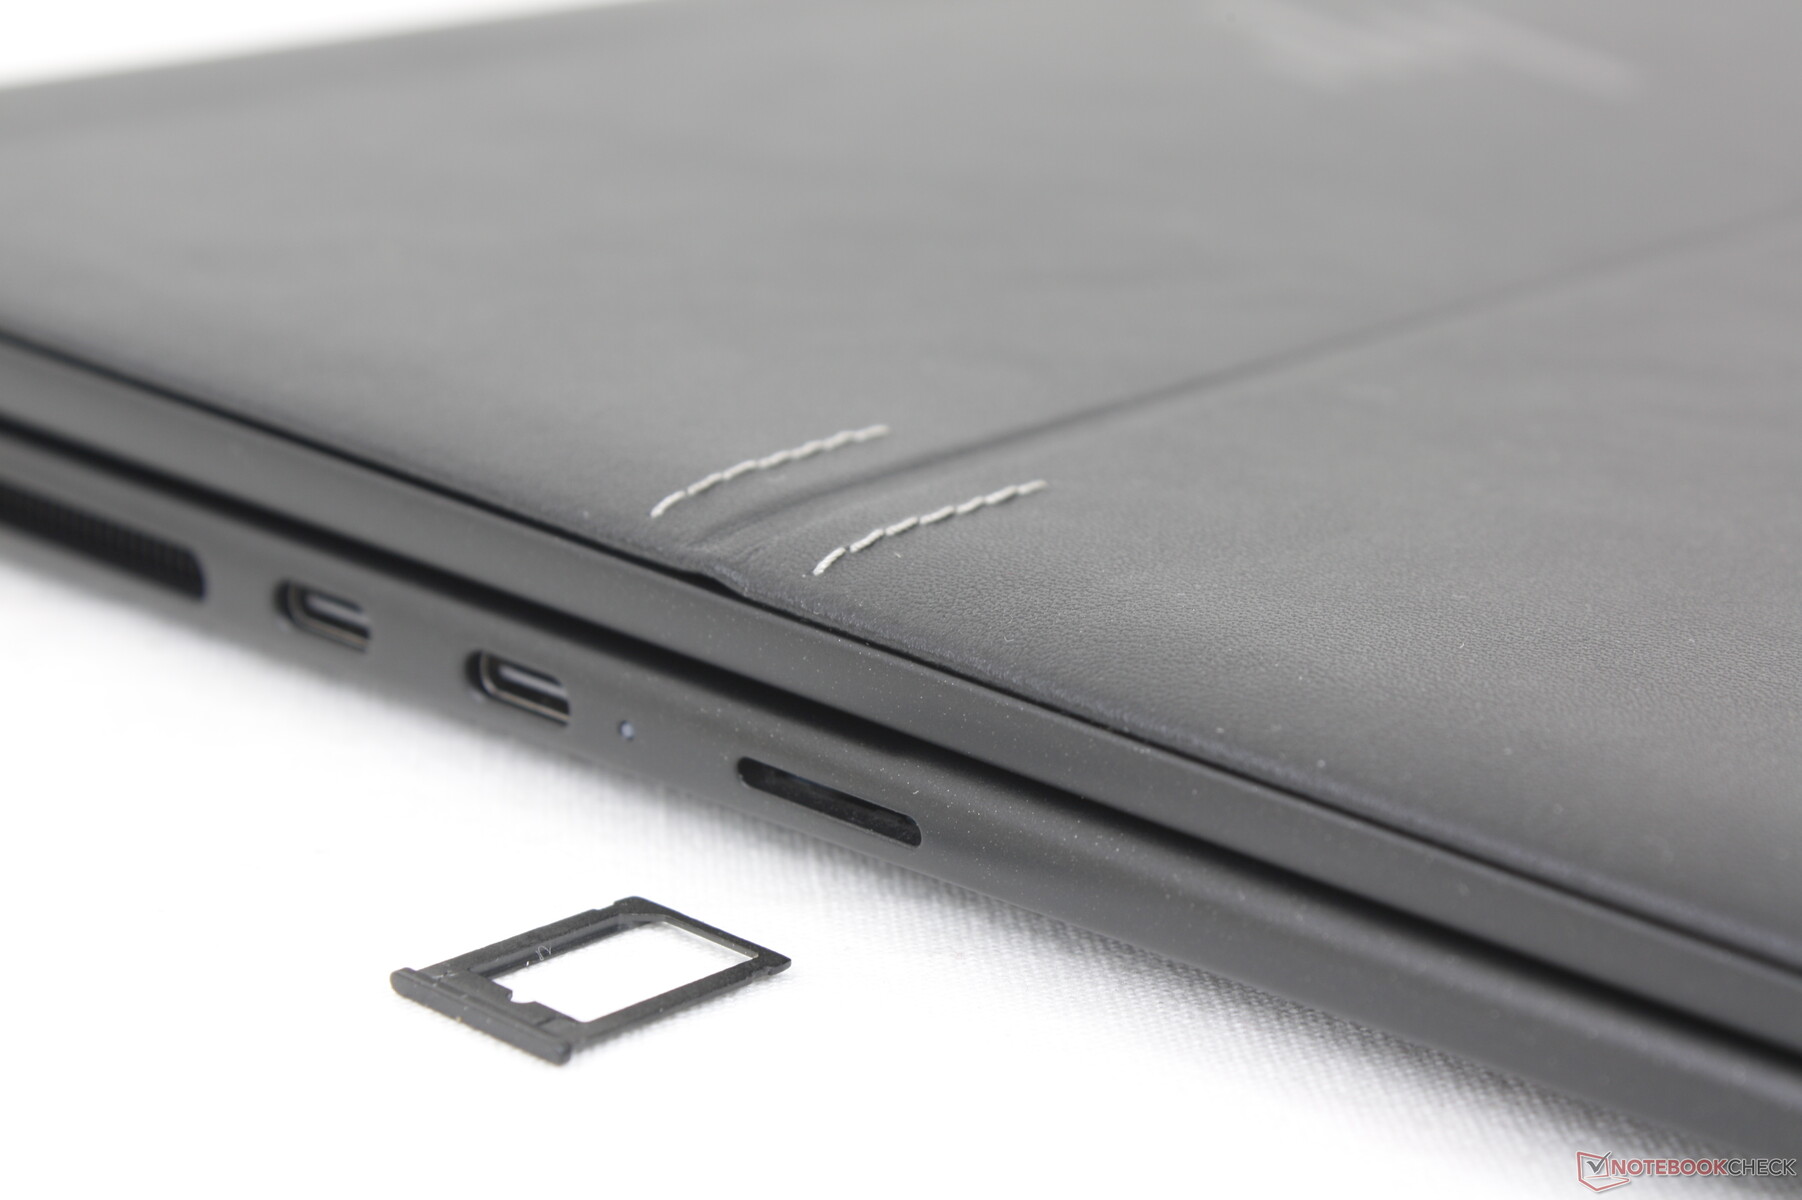
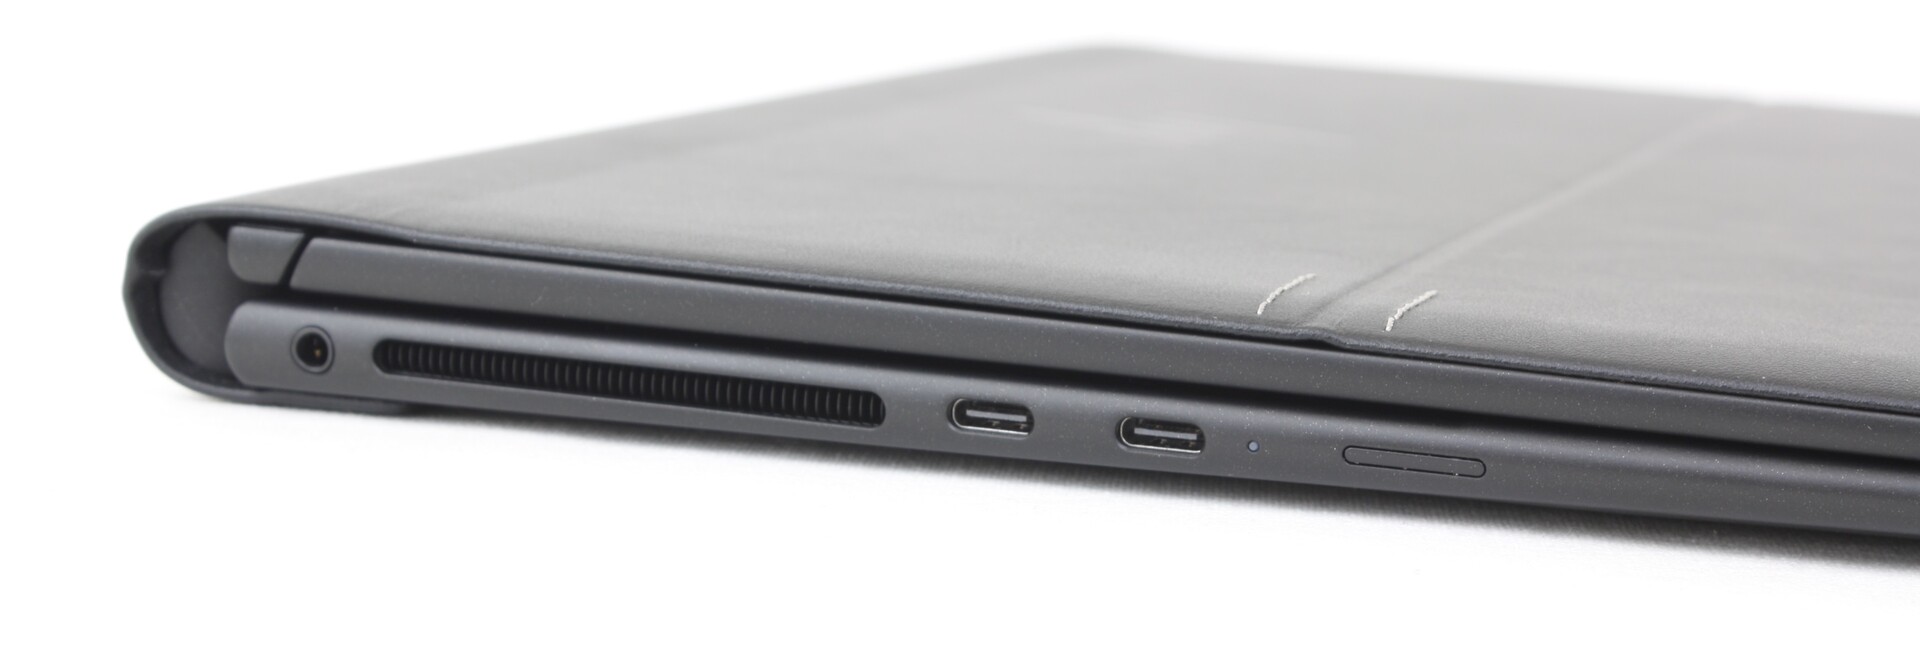
Connectivity — USB-C Only
The system integrates just two USB-C 4.0 ports each compatible with Thunderbolt 4 accessories and monitors. Most other business subnotebooks like the Dragonfly G3 or Latitude 7330 are able to integrate a wider variety of ports to reduce the reliance on docking stations or dongles.
Both USB-C ports are along the left edge with none on the right in contrast to the Razer Book which has one USB-C port on each side. The latter is advantageous as it allows charging from either side of the laptop whereas charging must be done on the left side of the Dragonfly Folio G3.
Communication
An Intel AX211 comes standard for Bluetooth 5.3 and Wi-Fi E connectivity. Transfer rates are both fast and steady and with no issues when paired to our 6 GHz router.
5G WAN is optional and the M.2 WAN module is easily removable. There is no eSIM support, however, and so owners would have to supply their own Nano-SIM cards.
| Networking | |
| iperf3 transmit AX12 | |
| Lenovo ThinkPad L13 Gen2-20VH0017GE | |
| Razer Book 13 FHD | |
| iperf3 receive AX12 | |
| Razer Book 13 FHD | |
| Lenovo ThinkPad L13 Gen2-20VH0017GE | |
| iperf3 receive AXE11000 6GHz | |
| Framework Laptop 13.5 12th Gen Intel | |
| HP Elite Dragonfly Folio 13.5 G3 | |
| HP Elite Dragonfly G3 | |
| Dell Latitude 13 7330 | |
| iperf3 receive AXE11000 | |
| HP Elite Dragonfly Folio 13.5 G3 | |
| iperf3 transmit AXE11000 | |
| HP Elite Dragonfly Folio 13.5 G3 | |
| iperf3 transmit AXE11000 6GHz | |
| Dell Latitude 13 7330 | |
| HP Elite Dragonfly Folio 13.5 G3 | |
| Framework Laptop 13.5 12th Gen Intel | |
| HP Elite Dragonfly G3 | |
Webcam — 8 MP!
The Dragonfly Folio G3 is one the first laptops to ship with an 8 MP webcam whereas other major makers are still utilizing 2 MP or even 1 MP sensors. Video recording of up to 1836p is supported as well. Image quality is one of the sharpest of any laptop as a result, but there are a few limitations. Firstly, video recording at 60 FPS is not supported with the default camera app despite the high MP count. Secondly, colors and usability in low-light conditions don't appear to be any better than most other laptops. And lastly, any movement appears very blurry likely due in part to the slow black-white response times of the display. It's an excellent webcam if under brightly lit conditions with minimal movement involved, but there's certainly still room for improvement.
An IR sensor and a digital webcam shutter are present. Activating the digital webcam shutter does not physically cover up the lens.


Maintenance
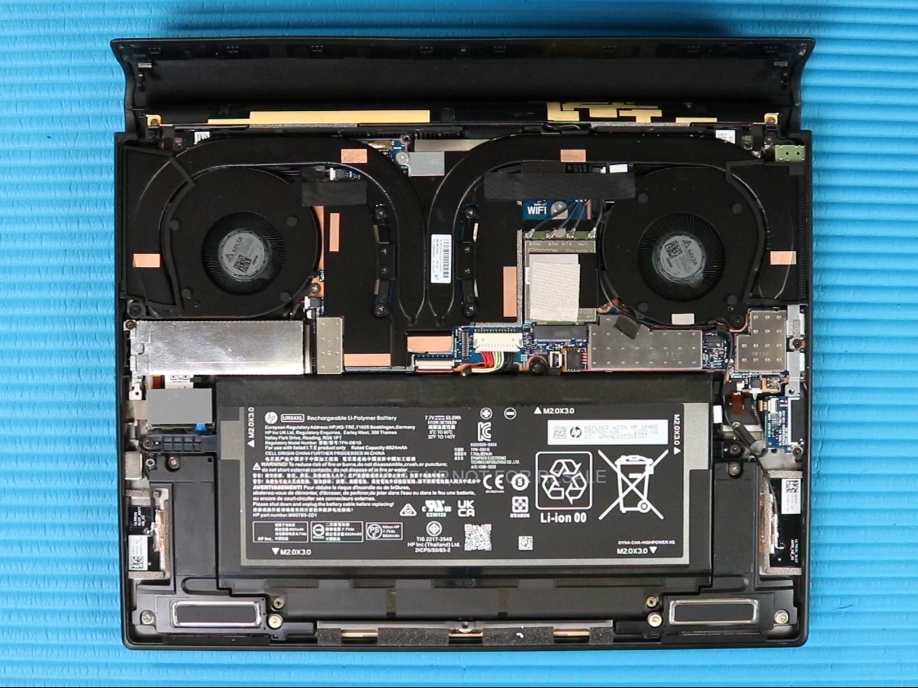
Unlike most other laptop makers, HP uploads official disassembly videos of many of its models including the Dragonfly Folio G3. We highly recommend checking out the video if you are interested in servicing the laptop yourself or seeing exactly what's inside and what can or cannot be upgraded. The manufacturer has made servicing significantly easier when compared to the older 2020 or 2021 models.
Removing the bottom panel requires a few more additional steps when compared to most other laptops due to the faux leather cover. Firstly, two plugs must be removed from the rear corners to expose two Philips screws underneath. Then, the faux leather can be carefully detached from the bottom base to expose additional Torx screws. Once inside, users will only see one M.2 2280 PCIe4 x4 slot for storage and one M.2 expansion slot for WAN. The RAM and WLAN modules are soldered.
Accessories and Warranty
The retail box includes an active pen that attaches magnetically to the right edge of the laptop. We appreciate that the pen comes standard considering that they are more often than not costly extras.
A one-year limited manufacturer warranty comes standard in the US which is disappointing considering that most high-end EliteBook models come with a base three-year warranty instead.
Input Devices — Like An EliteBook
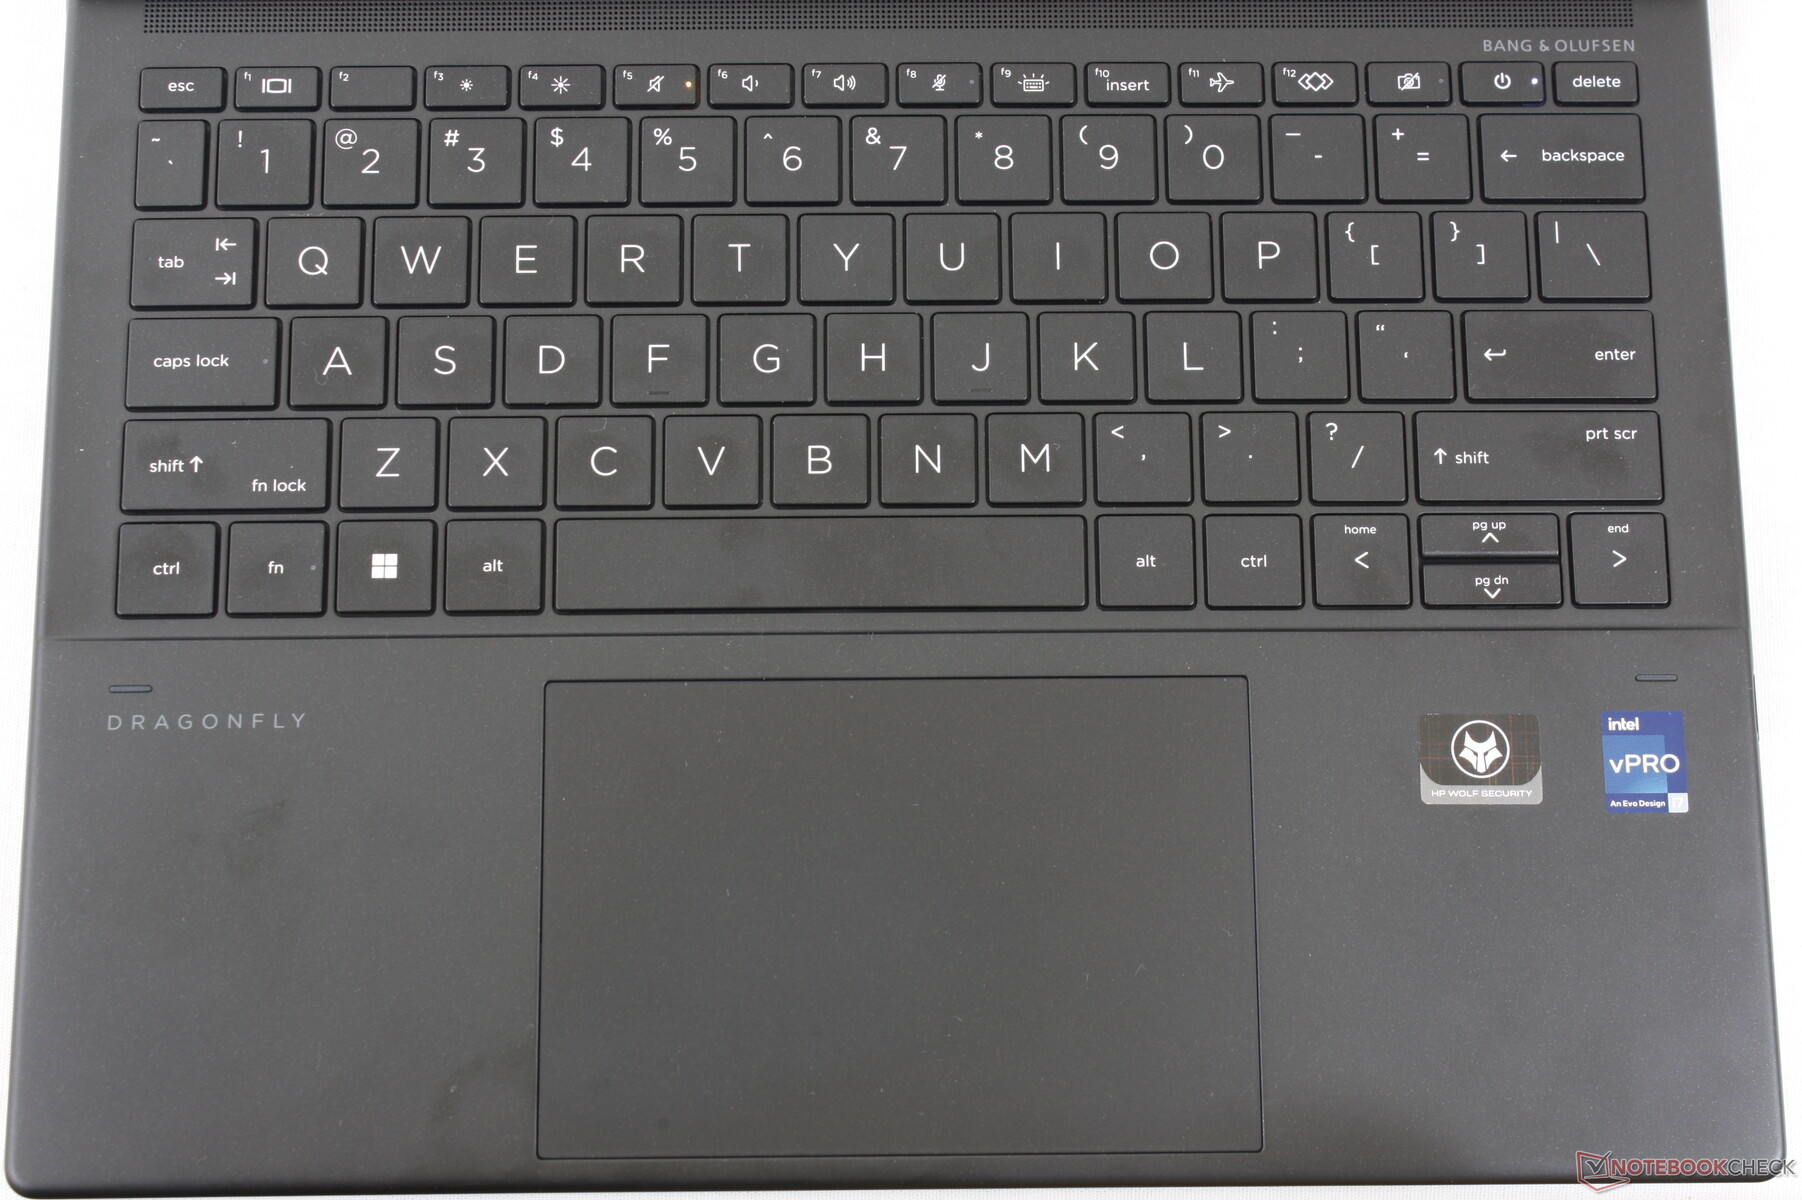
Keyboard
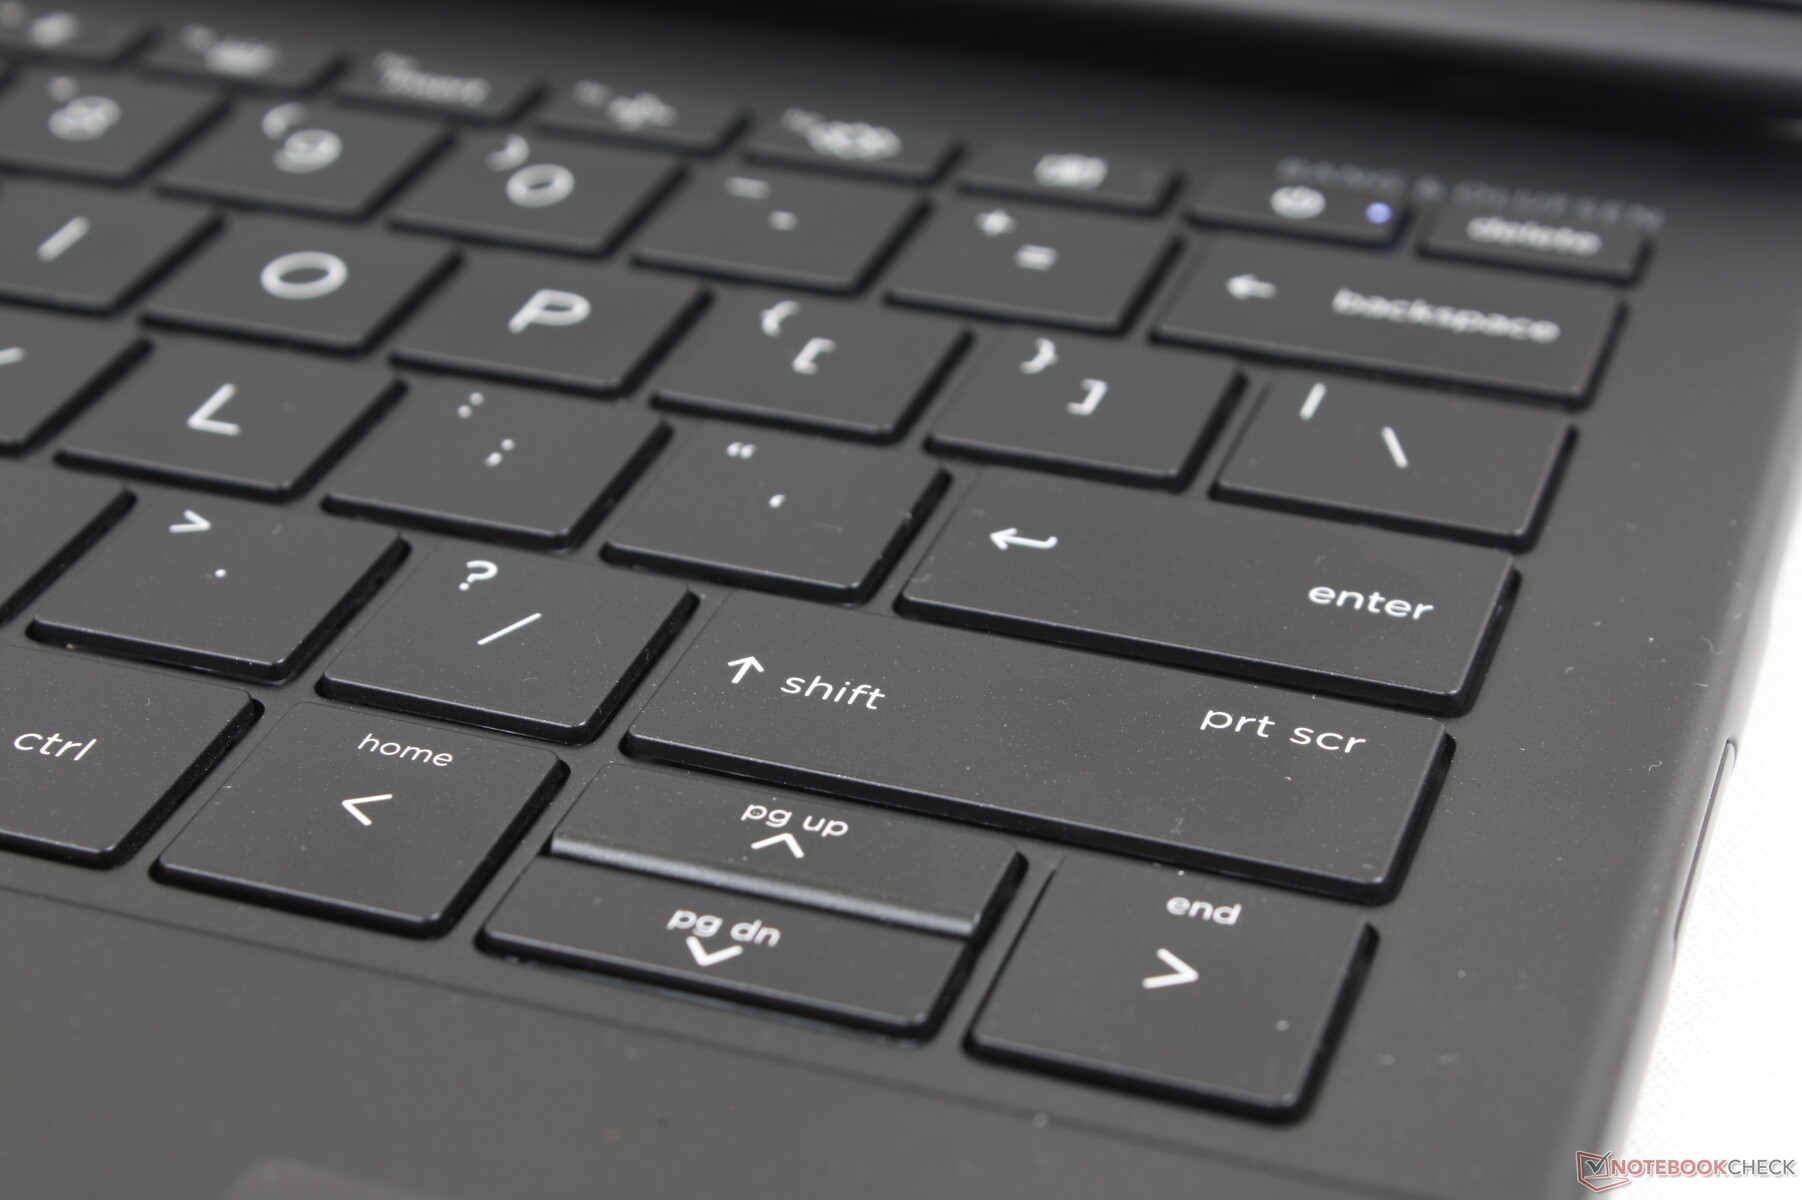
Keyboard layout is identical to the Dragonfly G3 for a similar typing experience. HP Spectre and EliteBook keyboards tend to have crisper feedback to avoid the usual spongy feel that many other cheaper Ultrabooks suffer from.
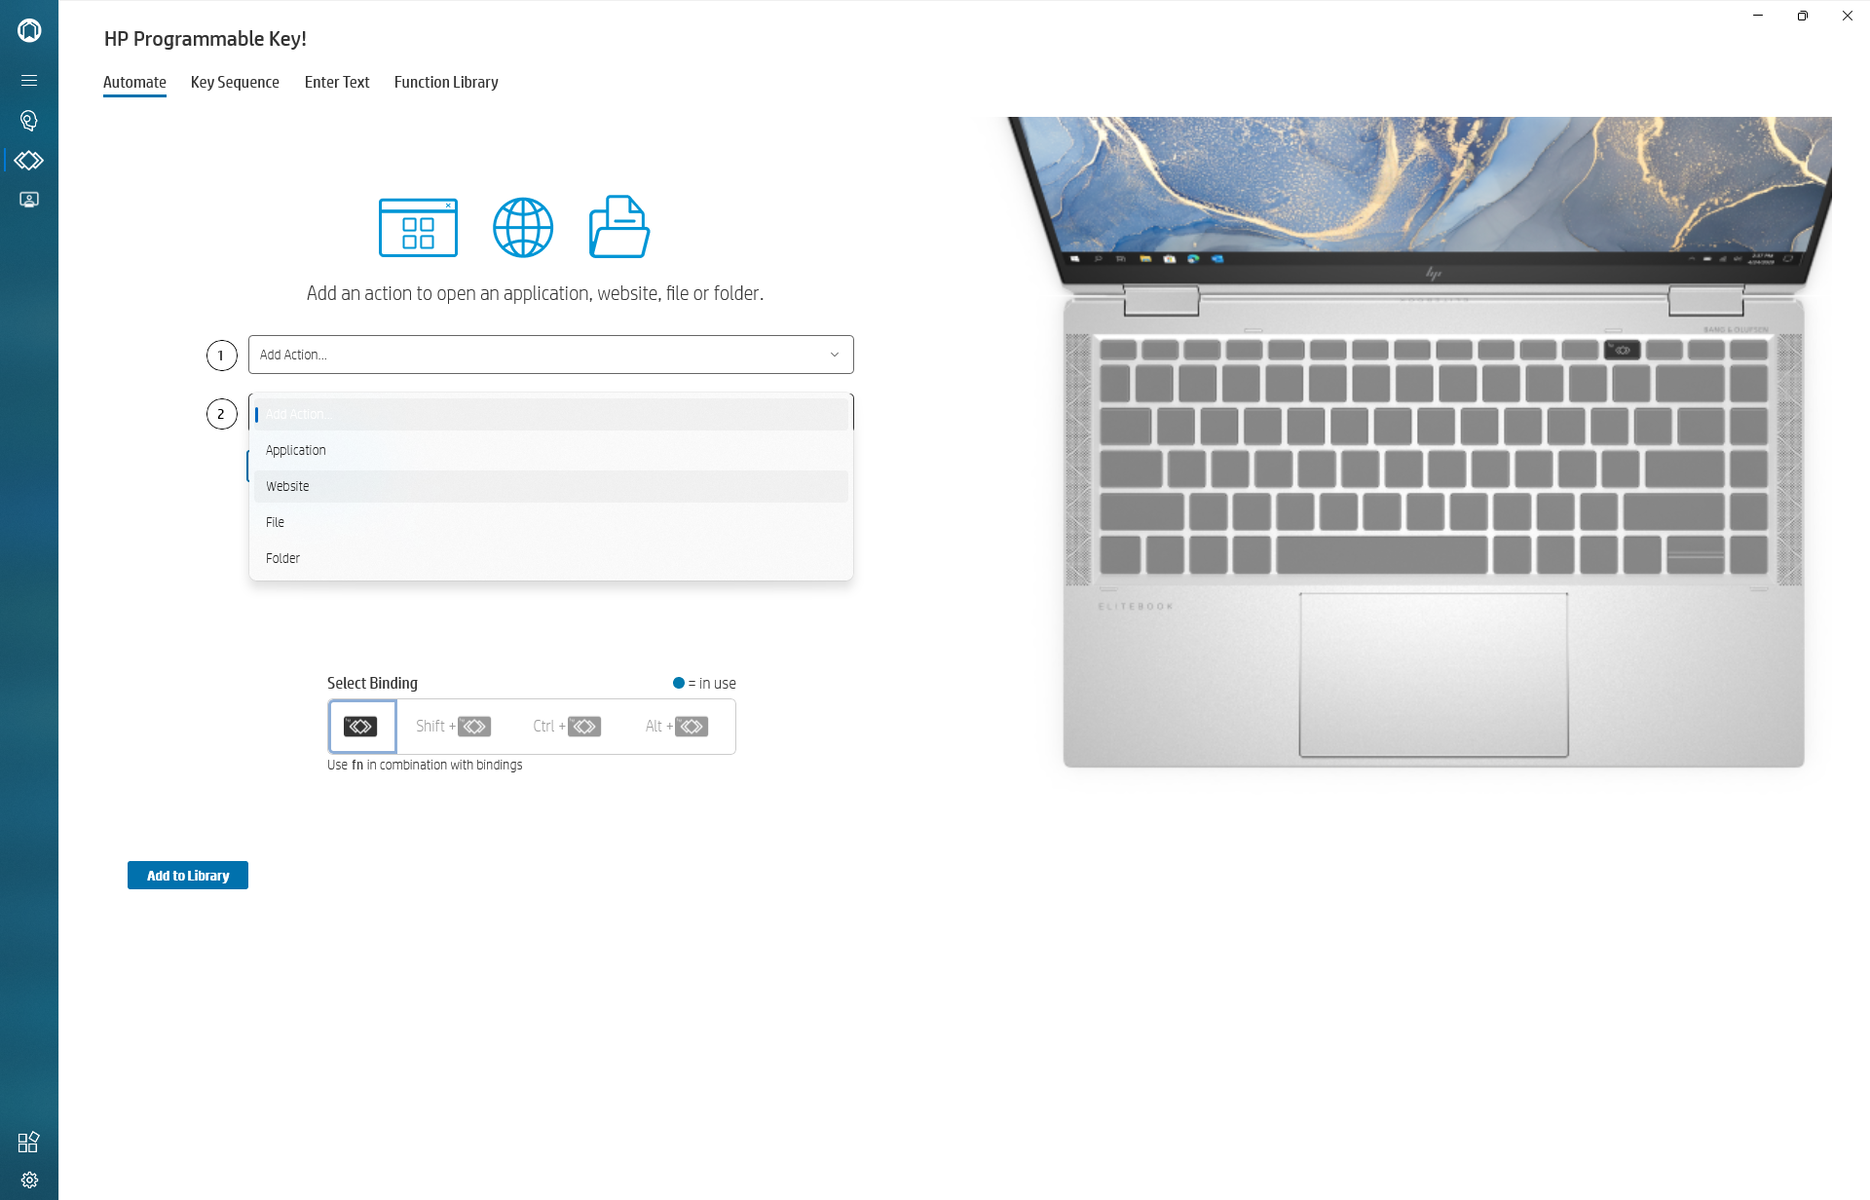
A unique feature on many newer HP laptops is the user customizable key called "Programmable key". The key can be set to launch an app or to input a string of text. Most other laptops do not have this feature built-in or require third-party applications to achieve the same goal.
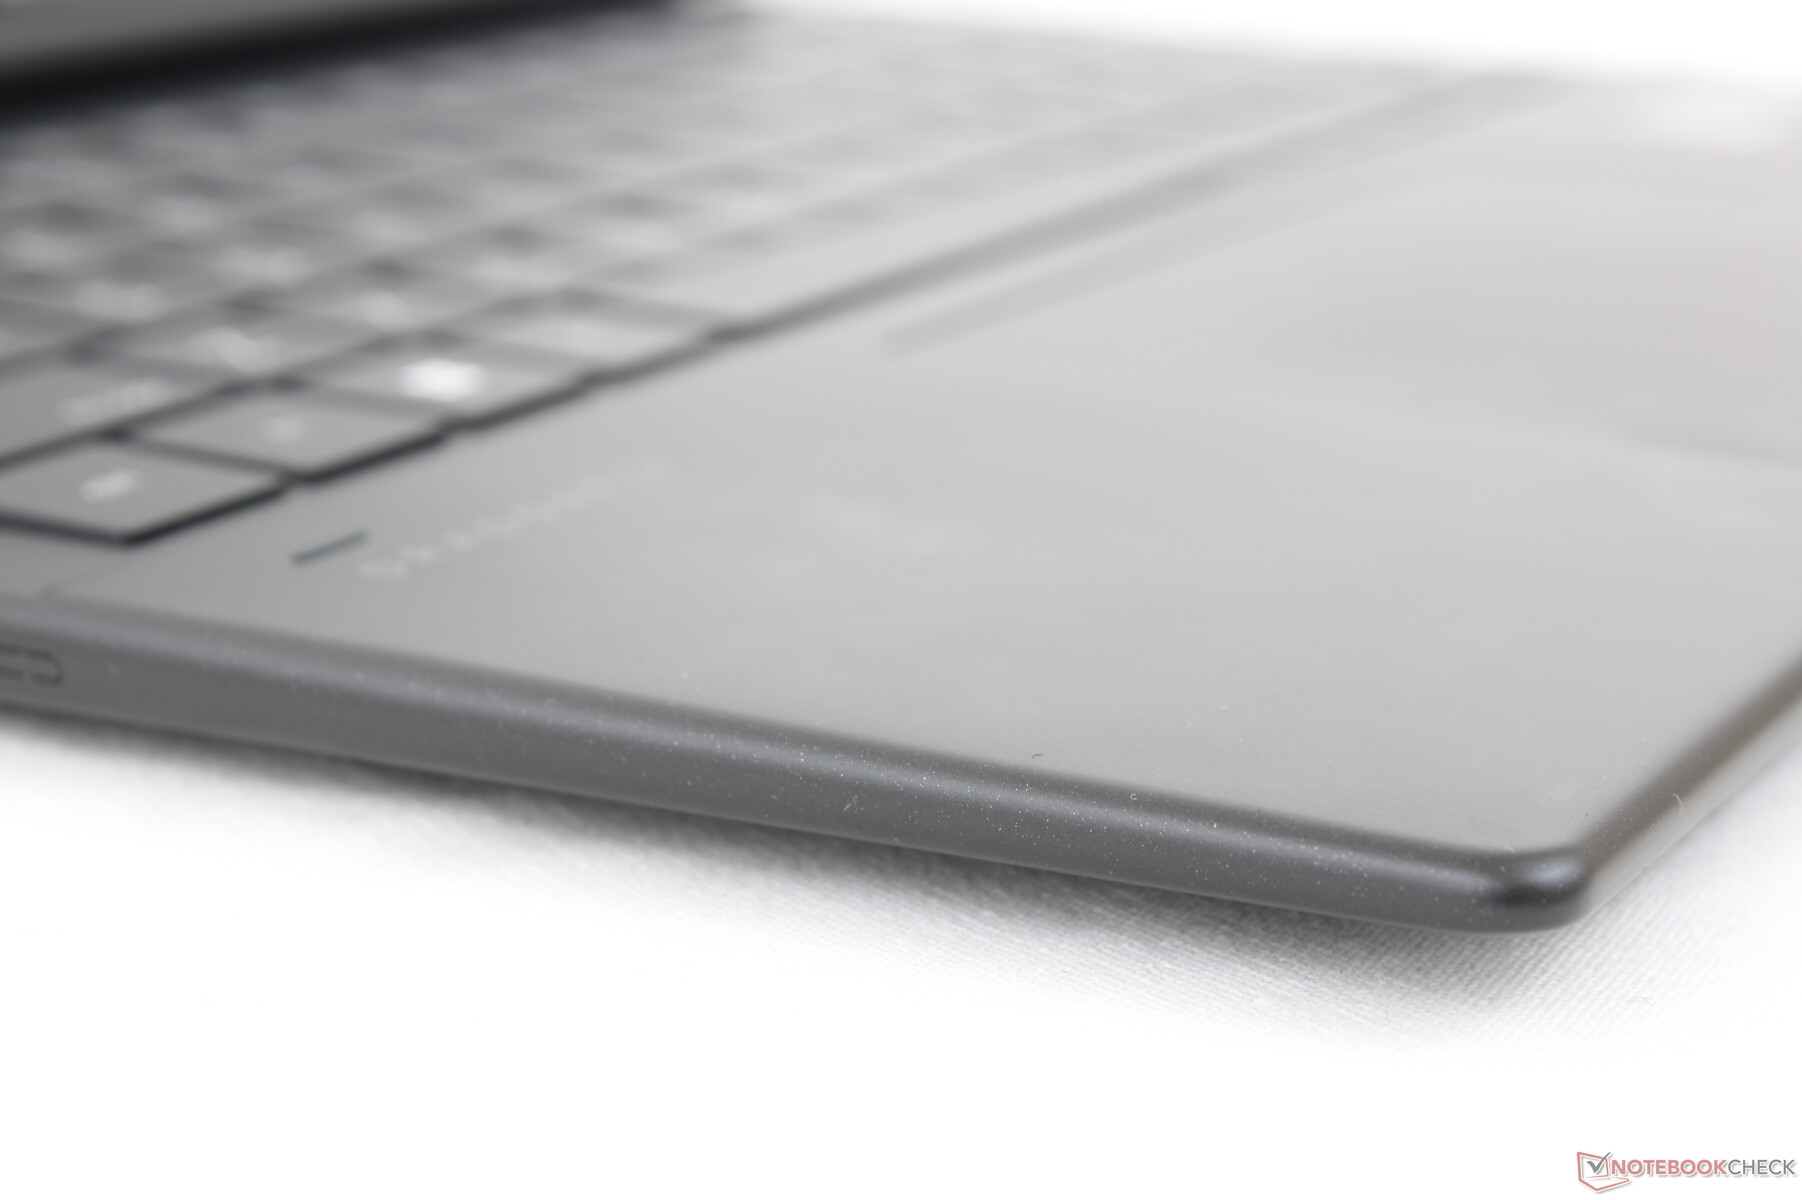
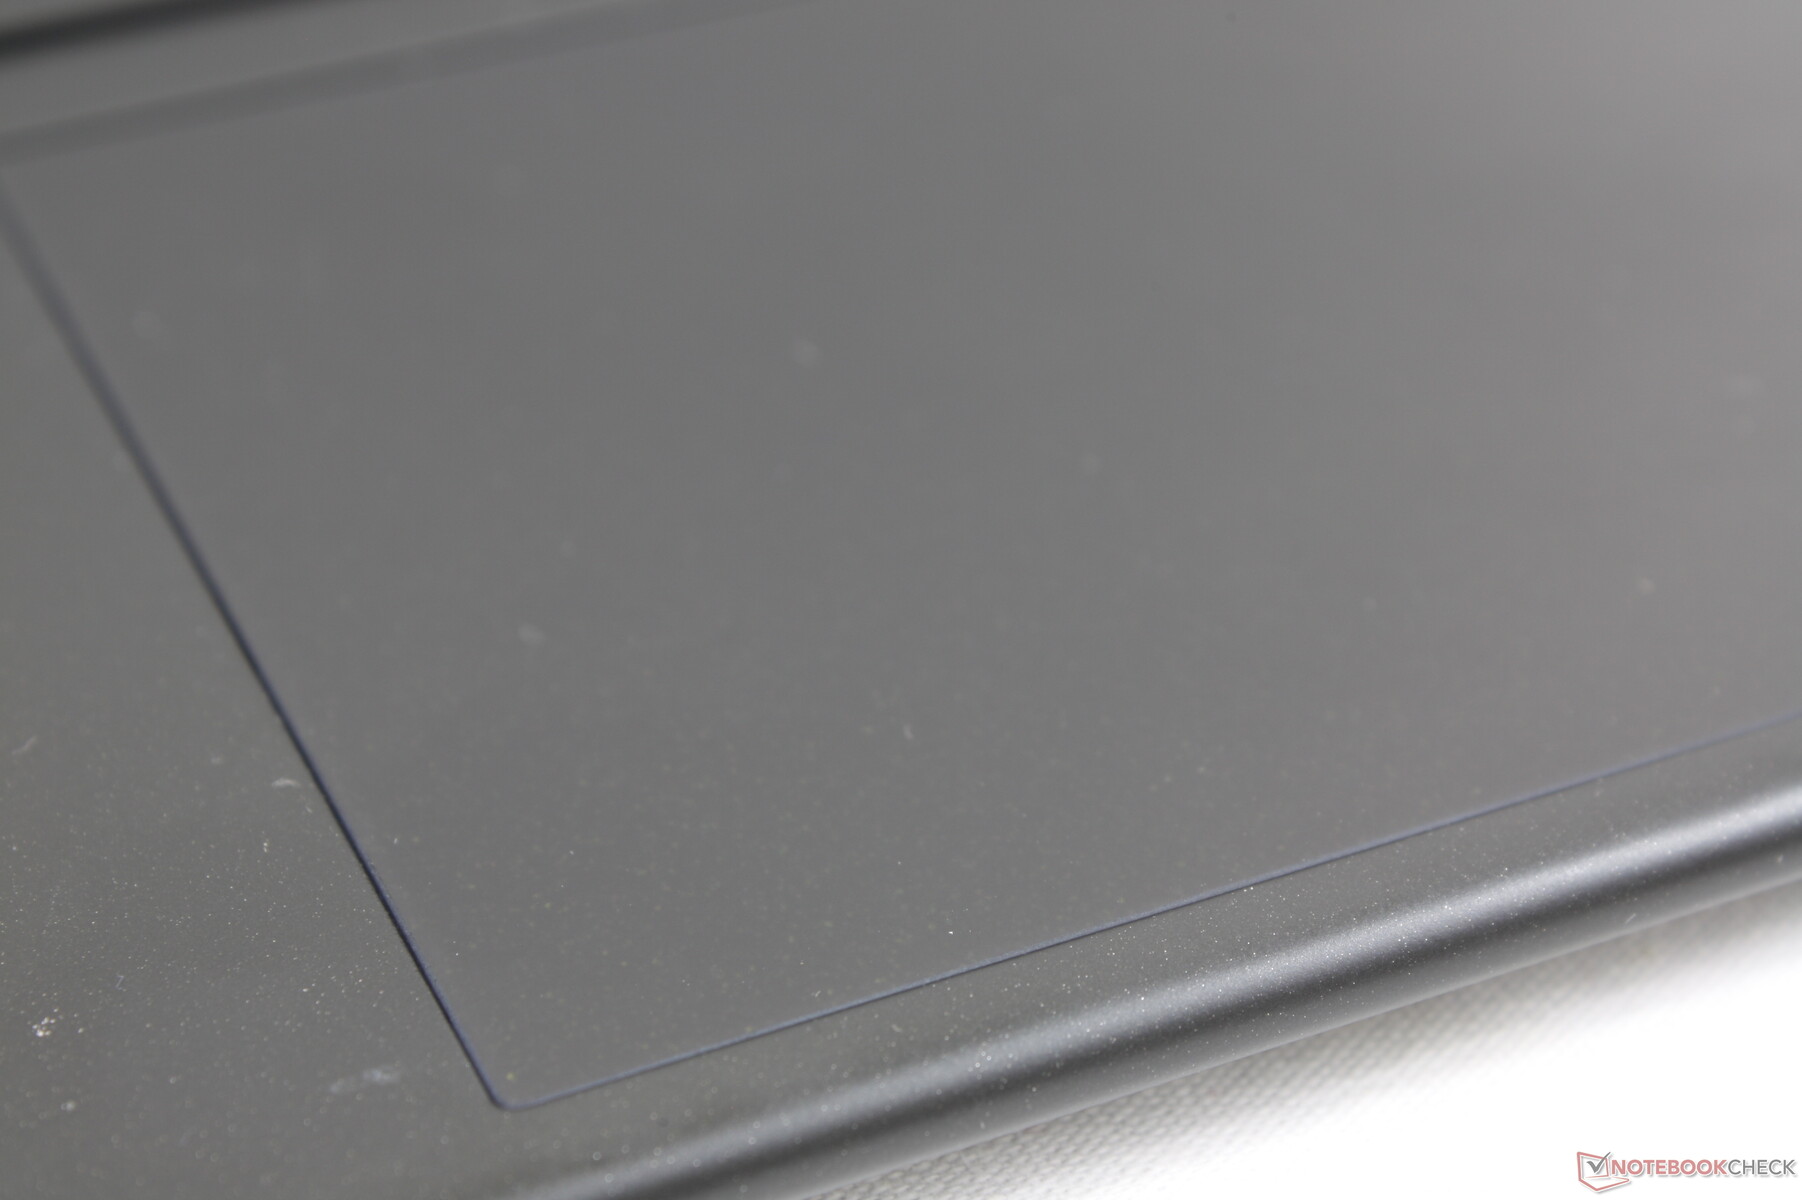
Touchpad
The clickpad is exactly the same size as on the Dragonfly G3 (12 x 8 cm). However, the one here lacks the NFC option of the Dragonfly G3 which is a shame for users who rely on the feature. Cursor control is otherwise reliable and with very little sticking when gliding at slow or fast speeds.
Feedback when clicking on the clickpad is shallow and on the weak side for a slightly unsatisfying feel. Clatter is quieter as a result, but a firmer click would have been preferable.

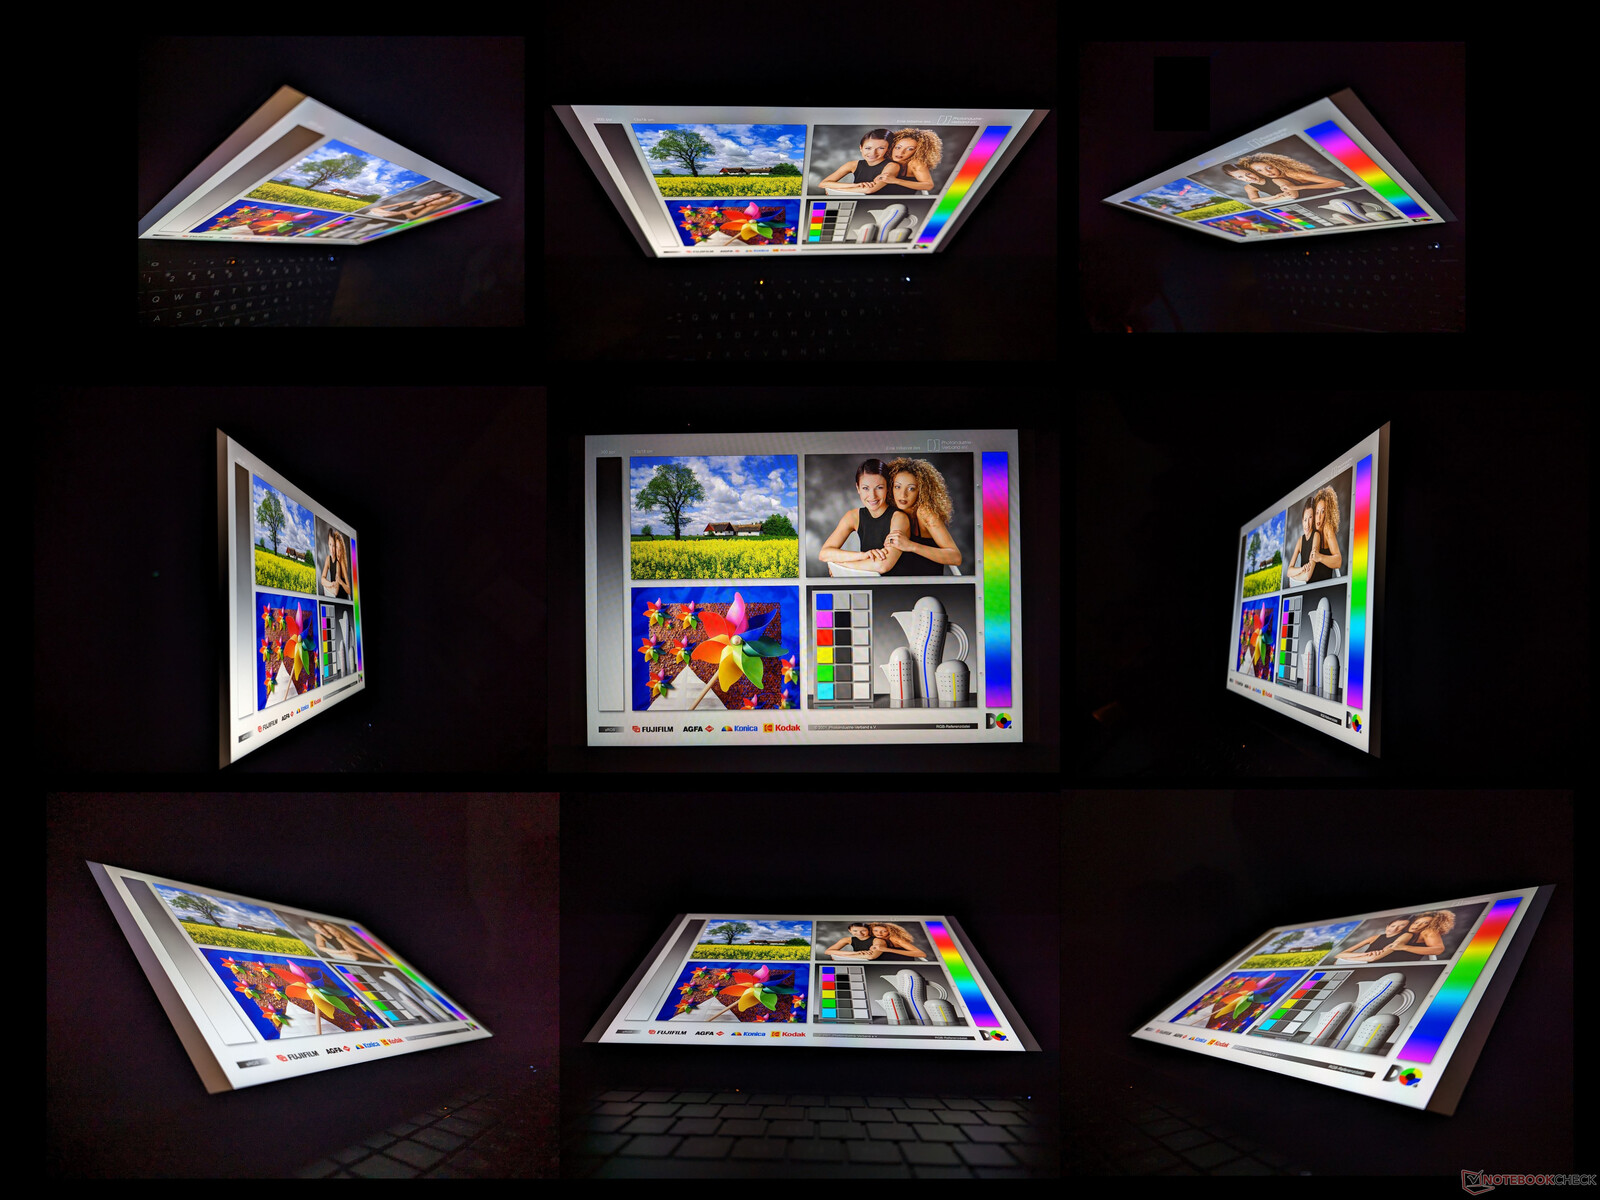
Display — 60 Hz IPS Only
There are three touchscreen options to choose from:
- 1920 x 1280, IPS, 400 nits, matte, 60 Hz
- 1920 x 1280, IPS, 400 nits, glossy, 60 Hz
- 1920 x 1280, IPS, 1000 nits, glossy, Sure View, 60 Hz
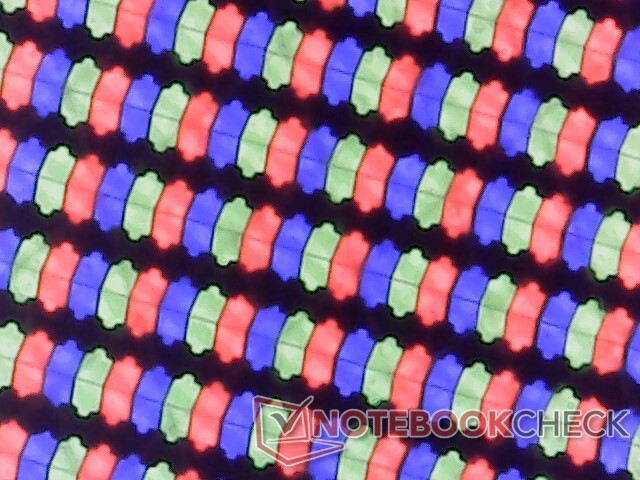
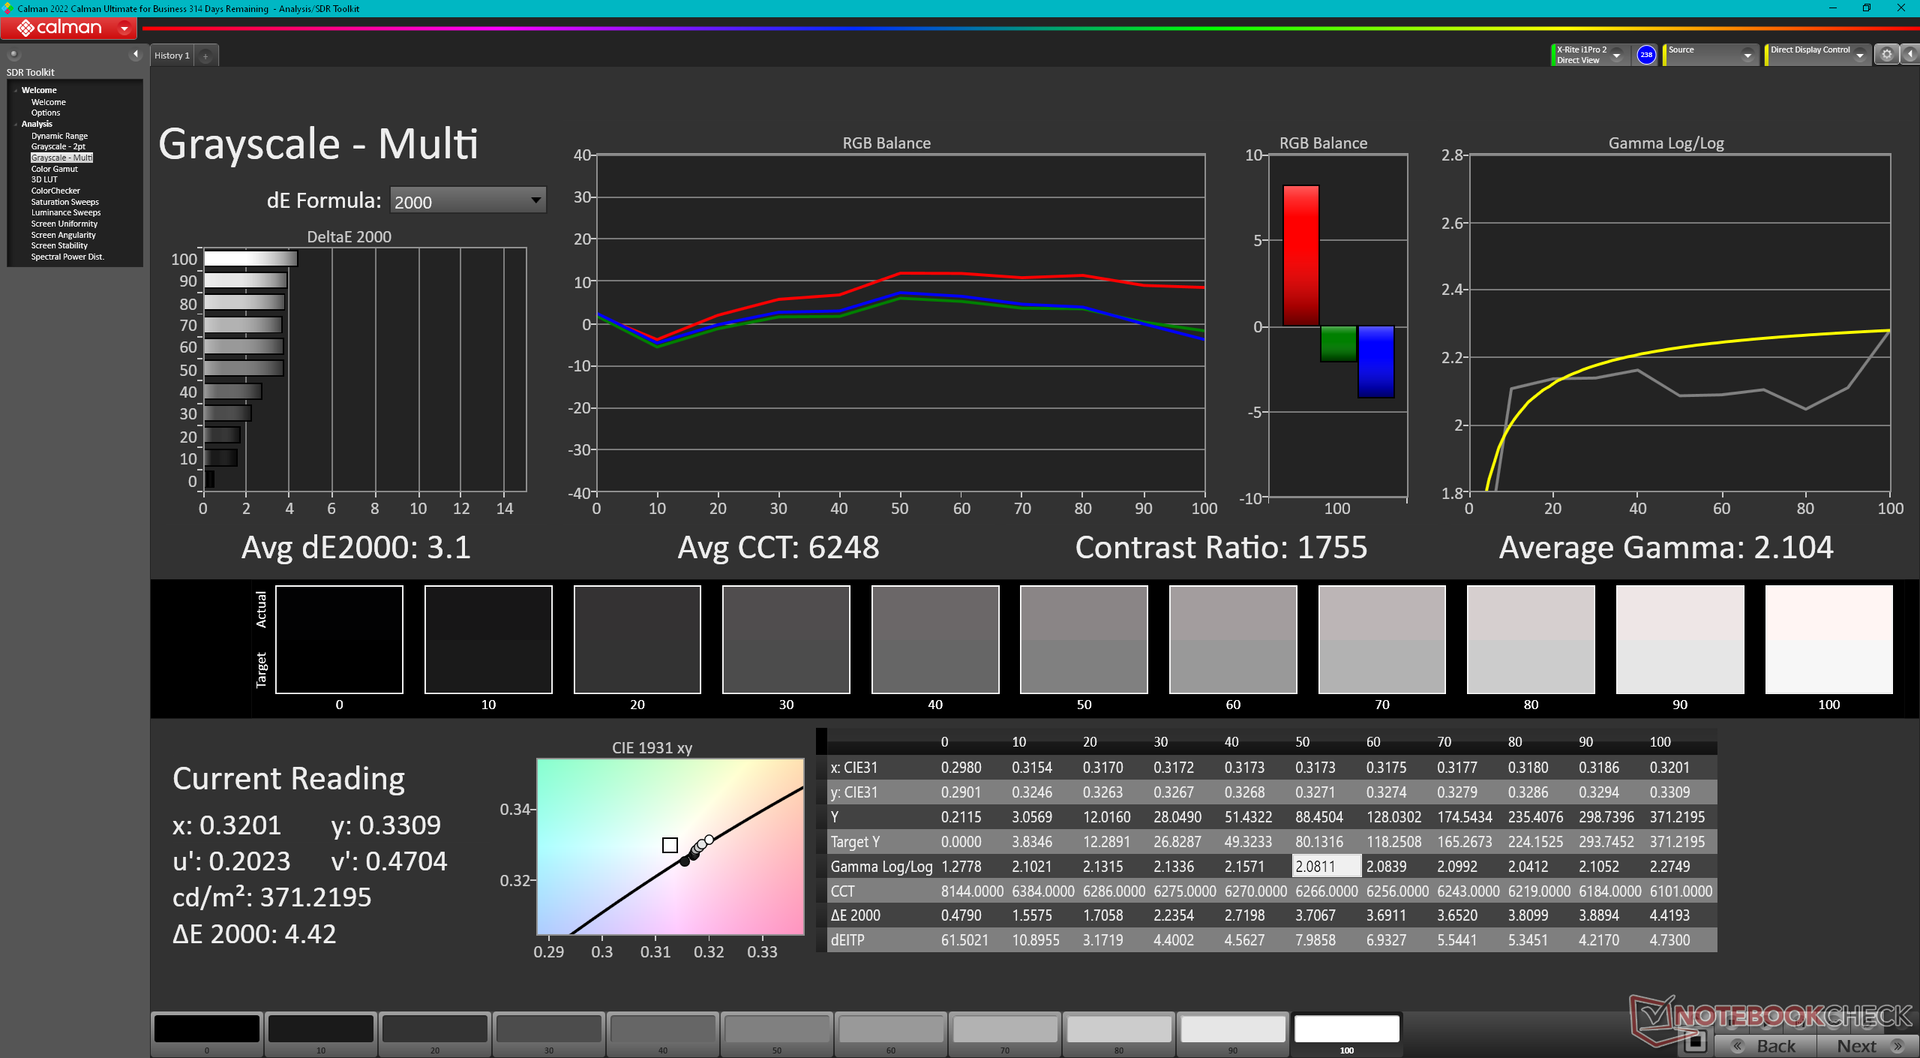
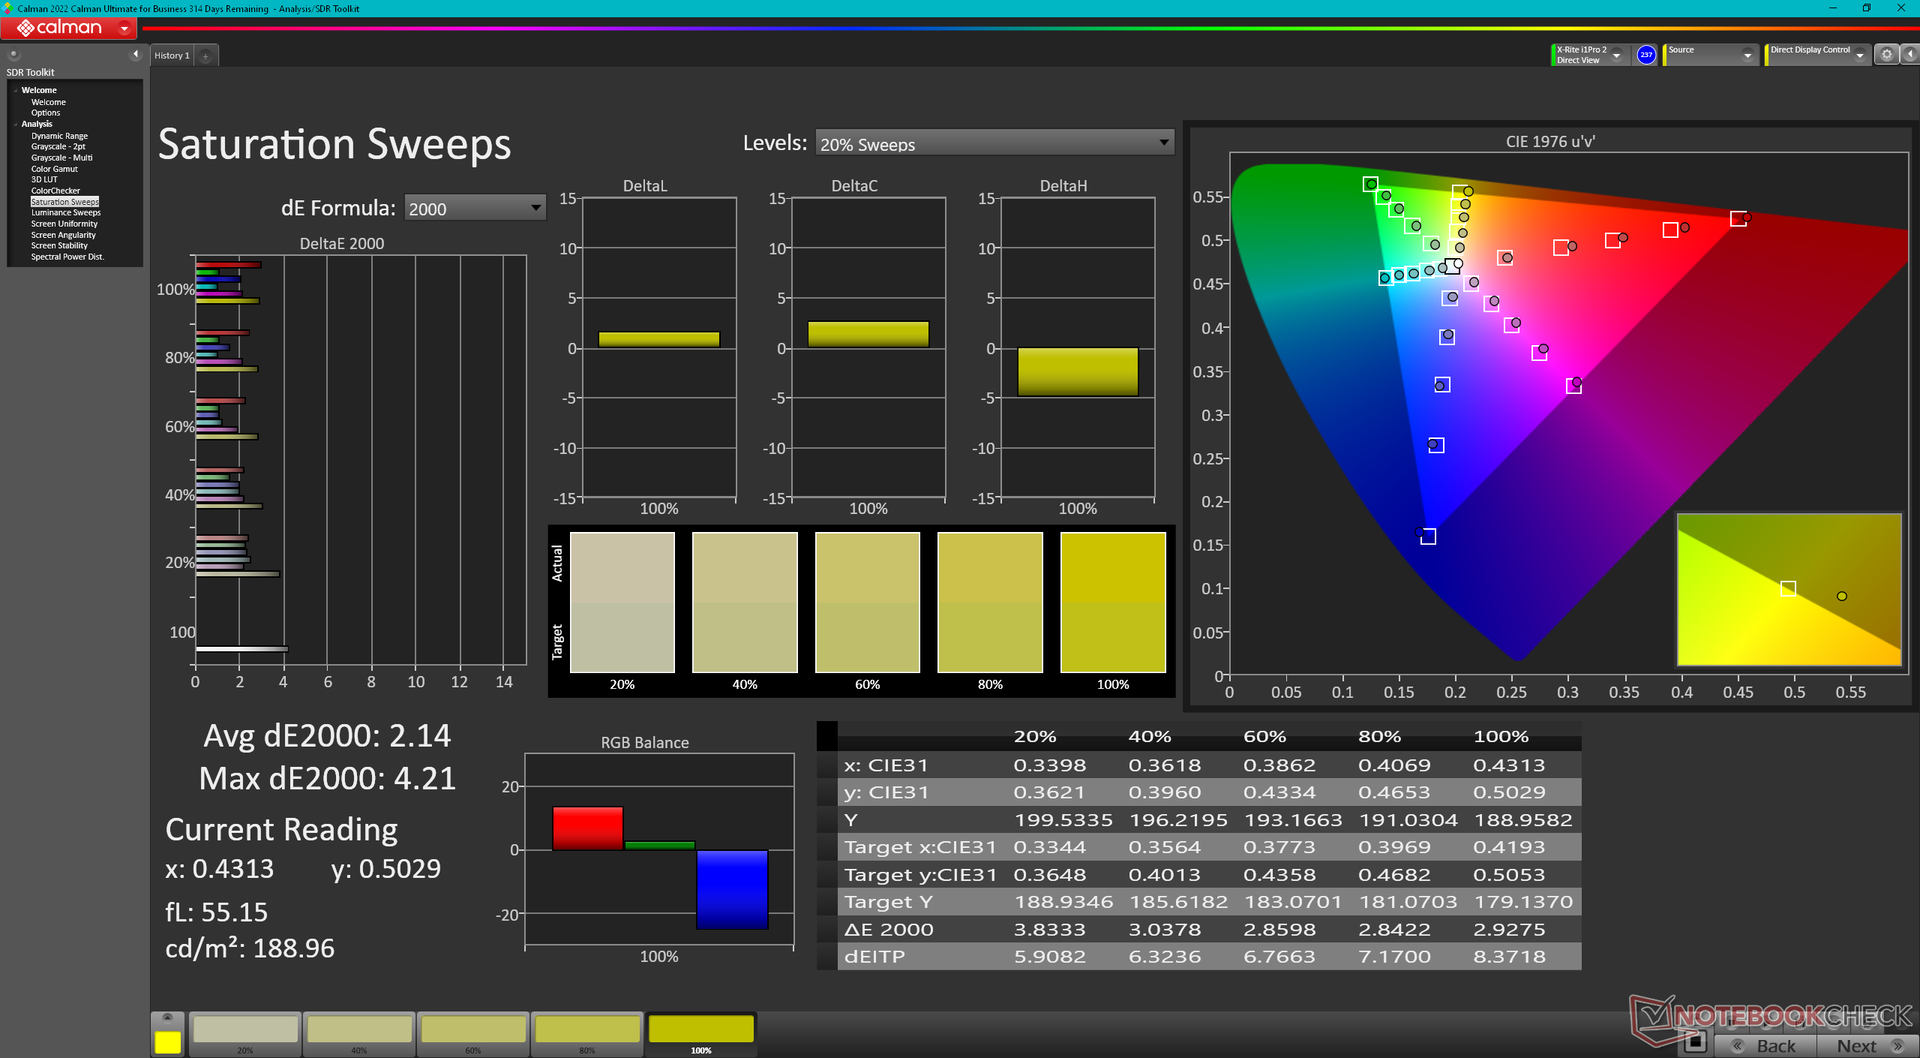
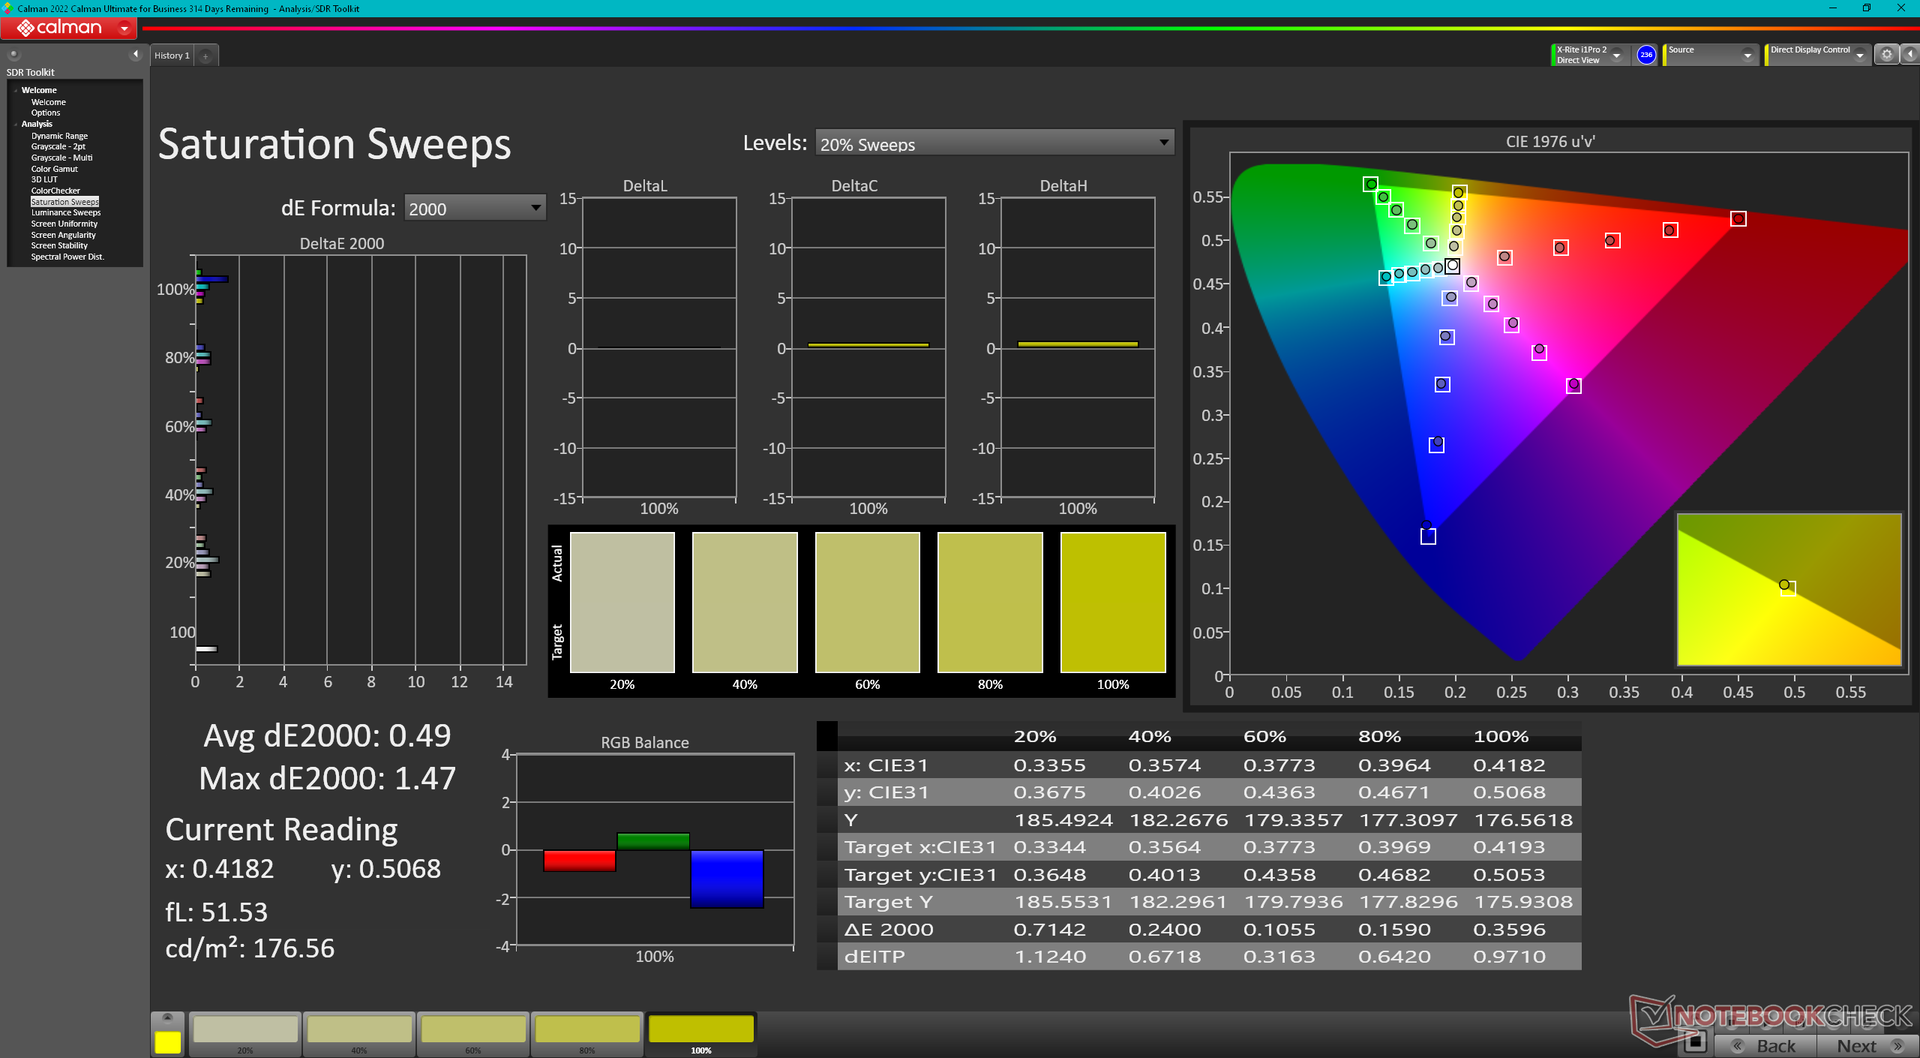
Our measurements below reflect only the bolded selection above, but all are likely to have similar color coverages and response times between them. Users can expect 99% sRGB coverage and a good contrast ratio of ~1500:1 from our particular configuration. Ghosting is unfortunately very noticeable due to the slow black-white and gray-gray response times meaning any fast motions in videos or games will appear blurry. An OLED option would have solved this problem but, alas, there is no such configuration.
Sure View is tied to the 1000-nit panel with no option to separate them. Sure View is a mixed experience as it sacrifices some visual fidelity for narrower and more private viewing angles.
Our system shares the same Chi Mei CMN13C0 display controller as found on the Dragonfly G3 to suggest that HP is utilizing the same panels across both models.
| |||||||||||||||||||||||||
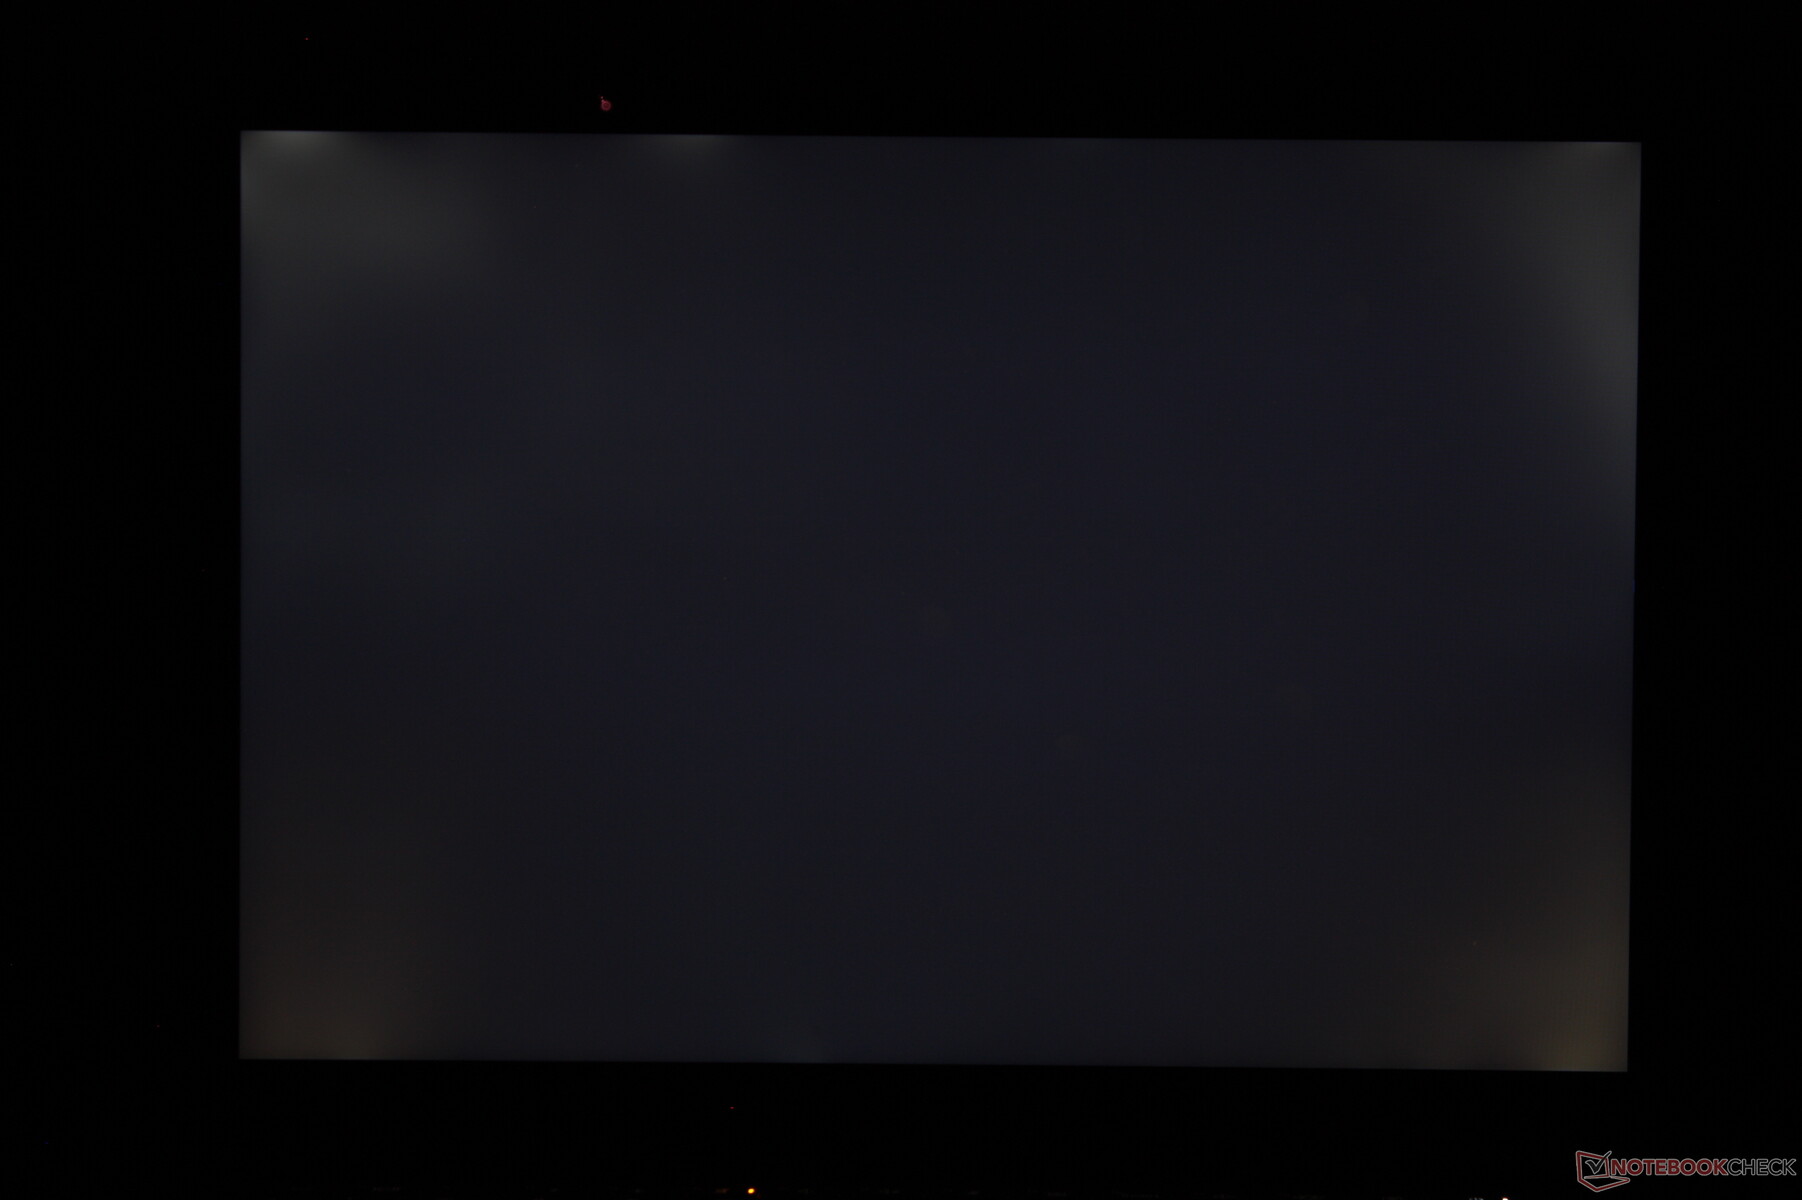
Brightness Distribution: 87 %
Center on Battery: 369.5 cd/m²
Contrast: 1540:1 (Black: 0.24 cd/m²)
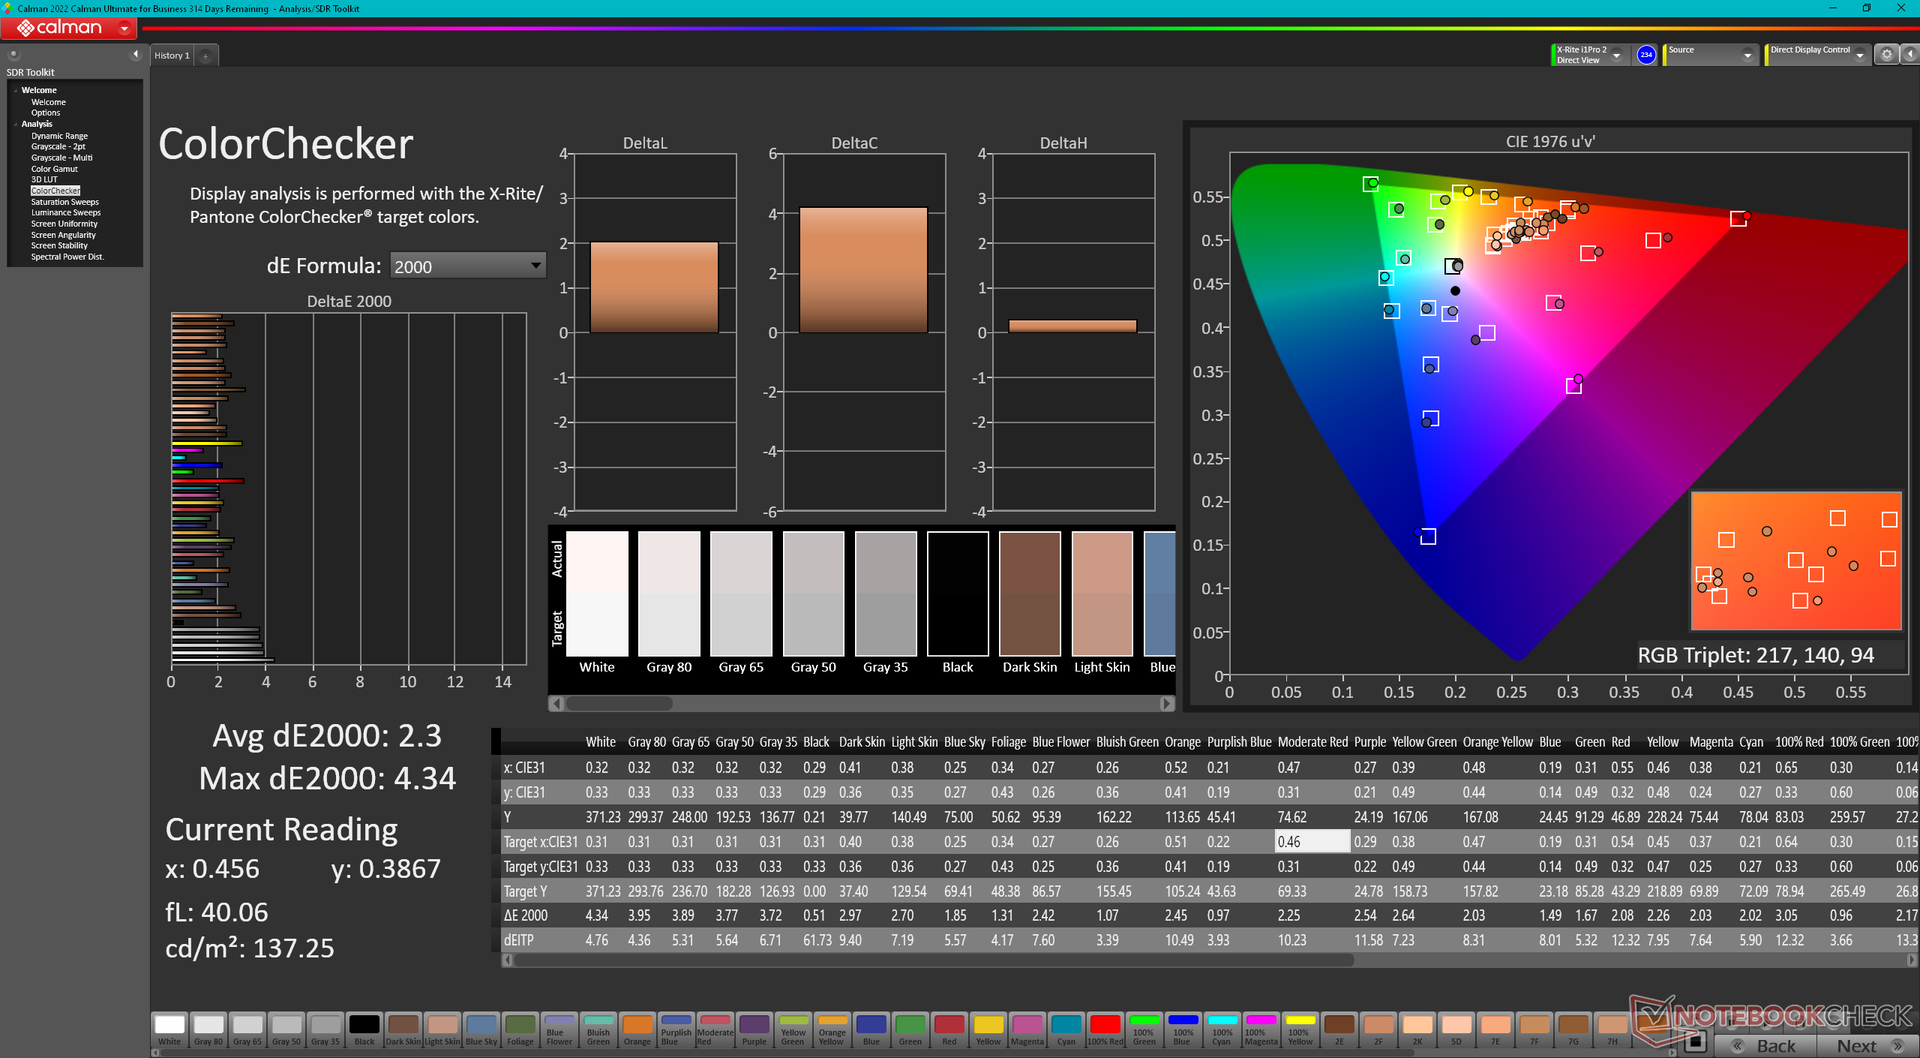
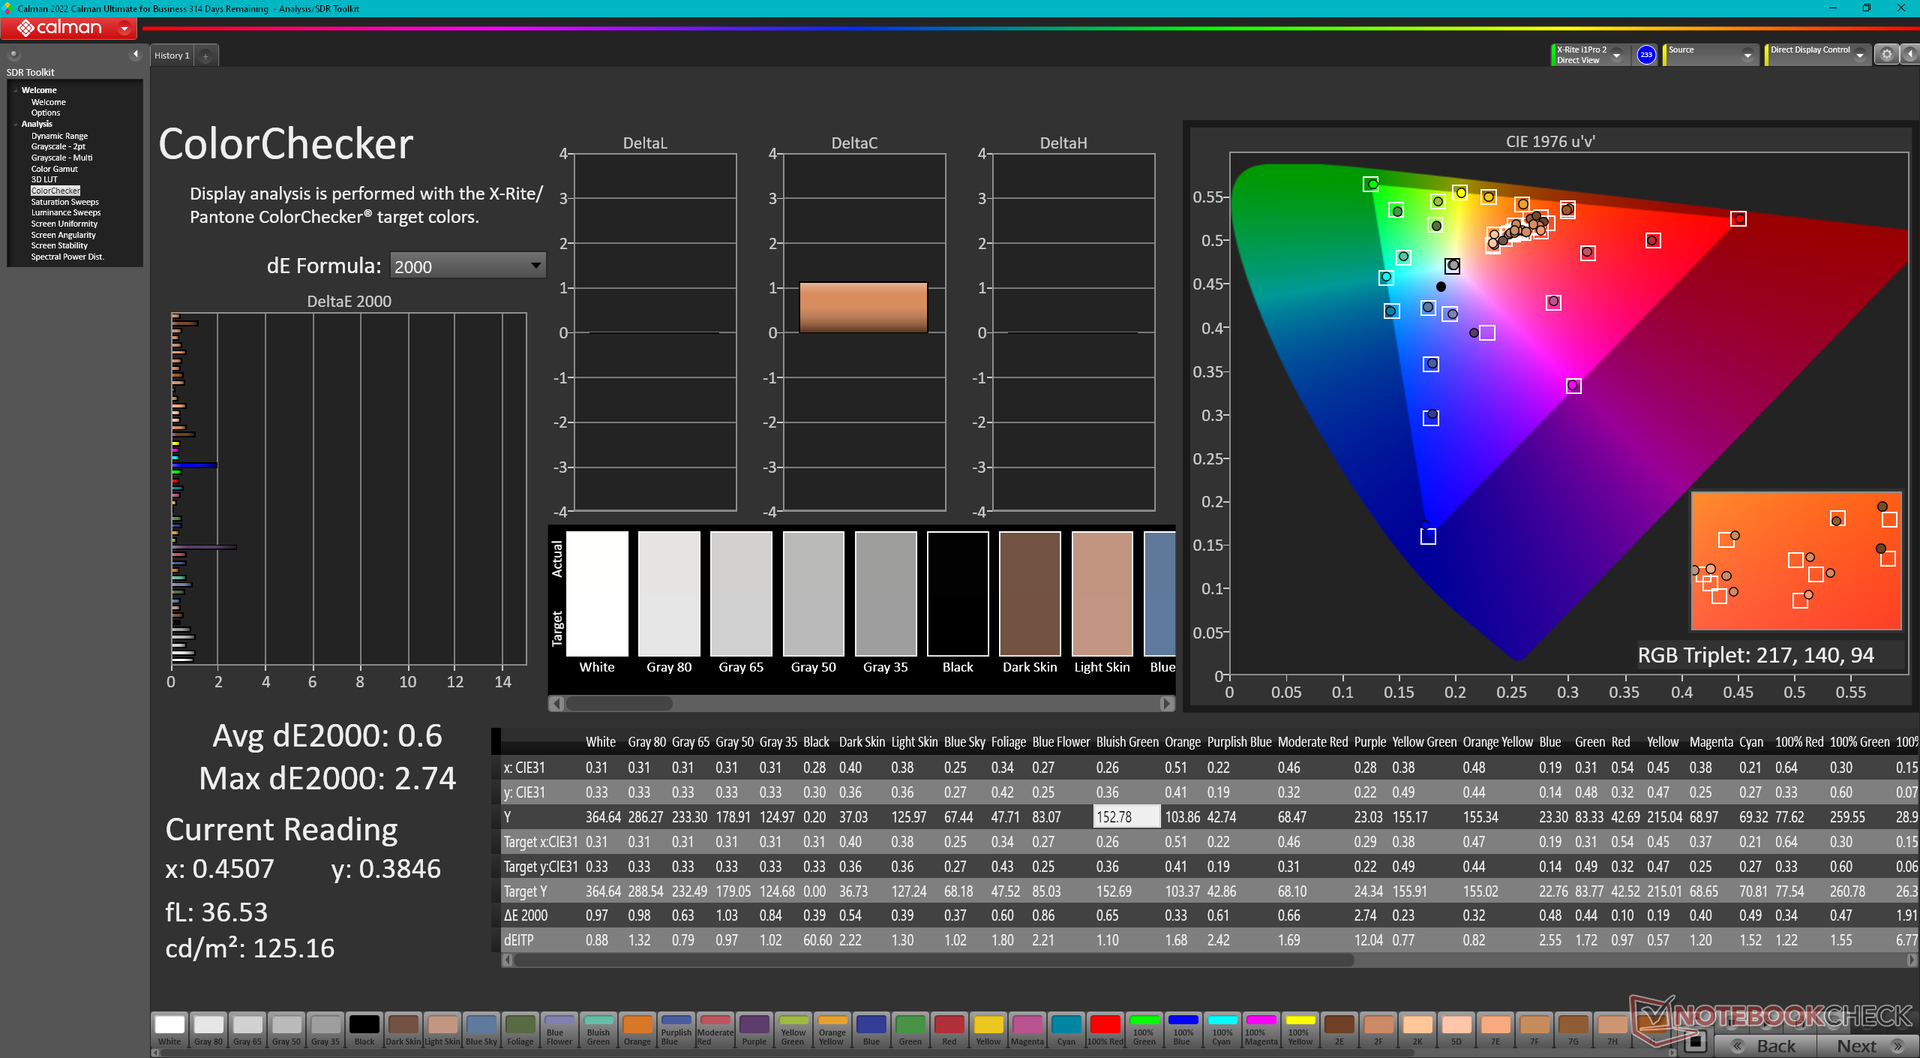
ΔE ColorChecker Calman: 2.3 | ∀{0.5-29.43 Ø4.81}
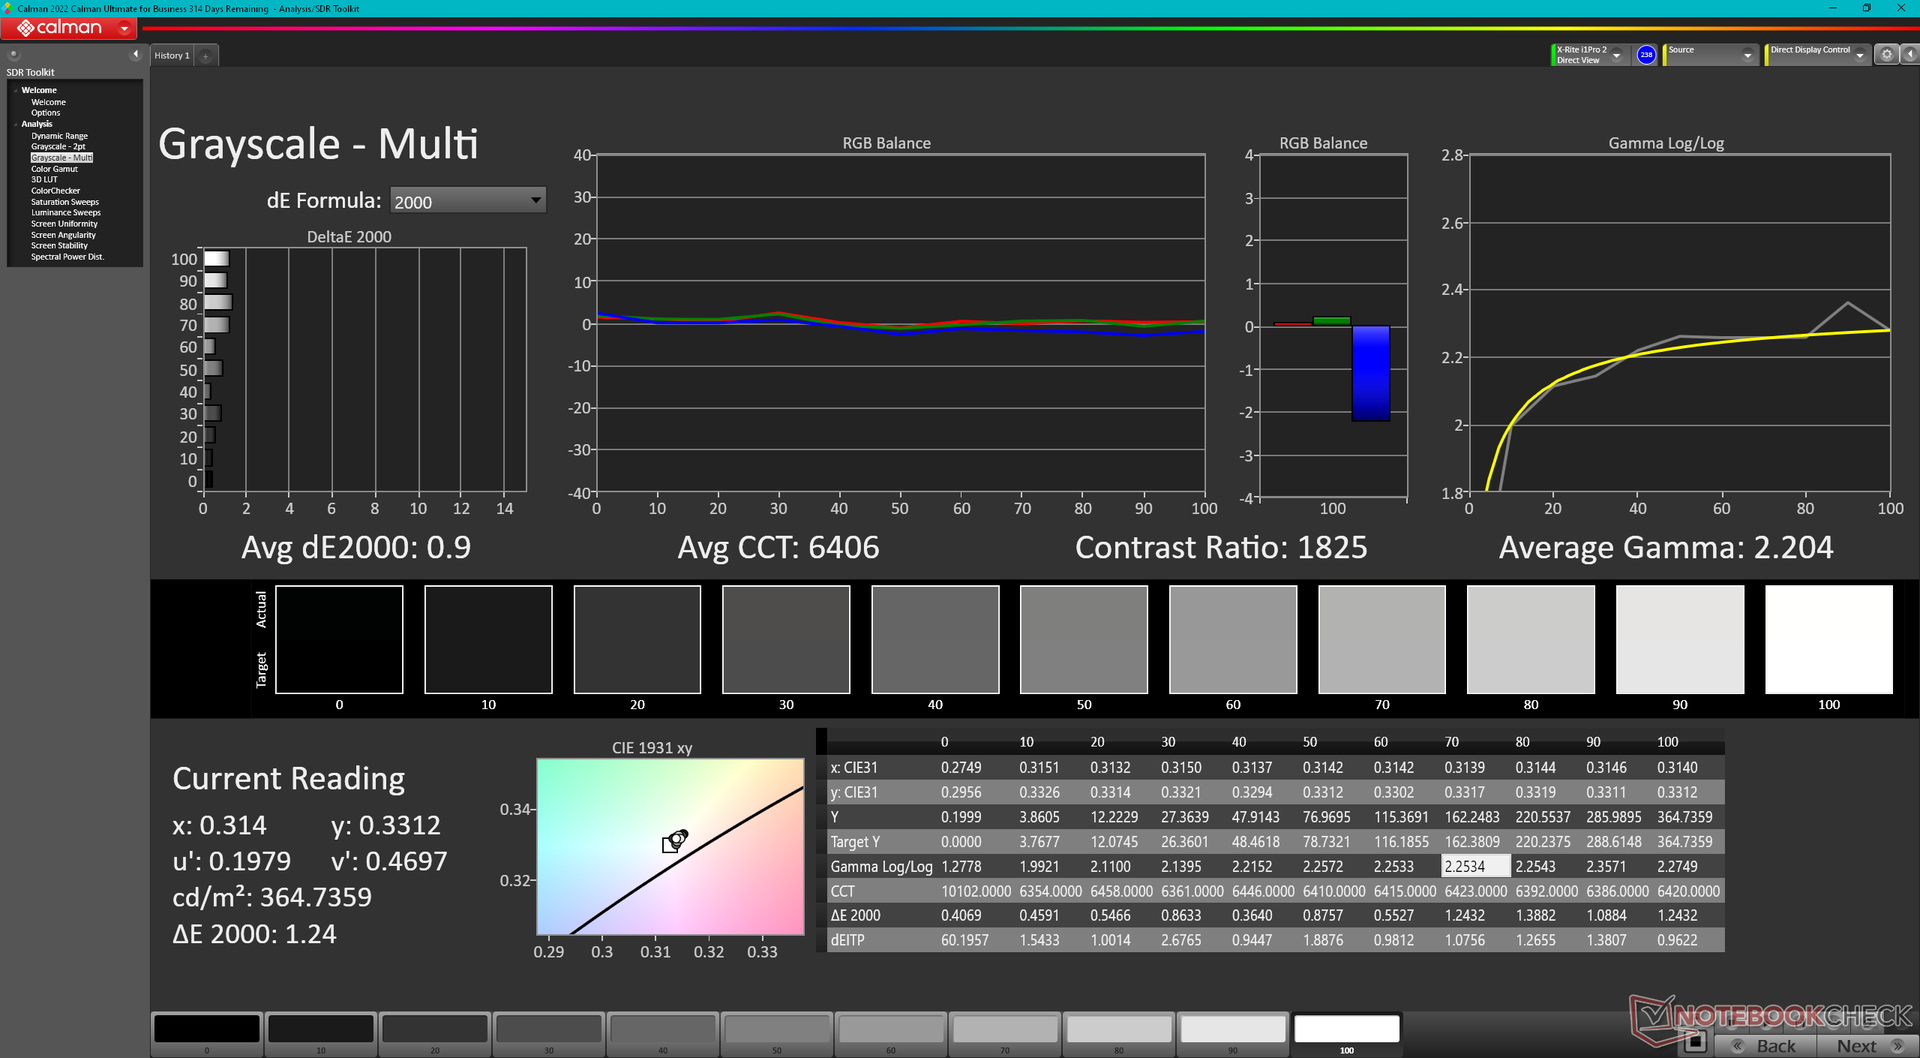
calibrated: 0.6
ΔE Greyscale Calman: 3.1 | ∀{0.09-98 Ø5.1}
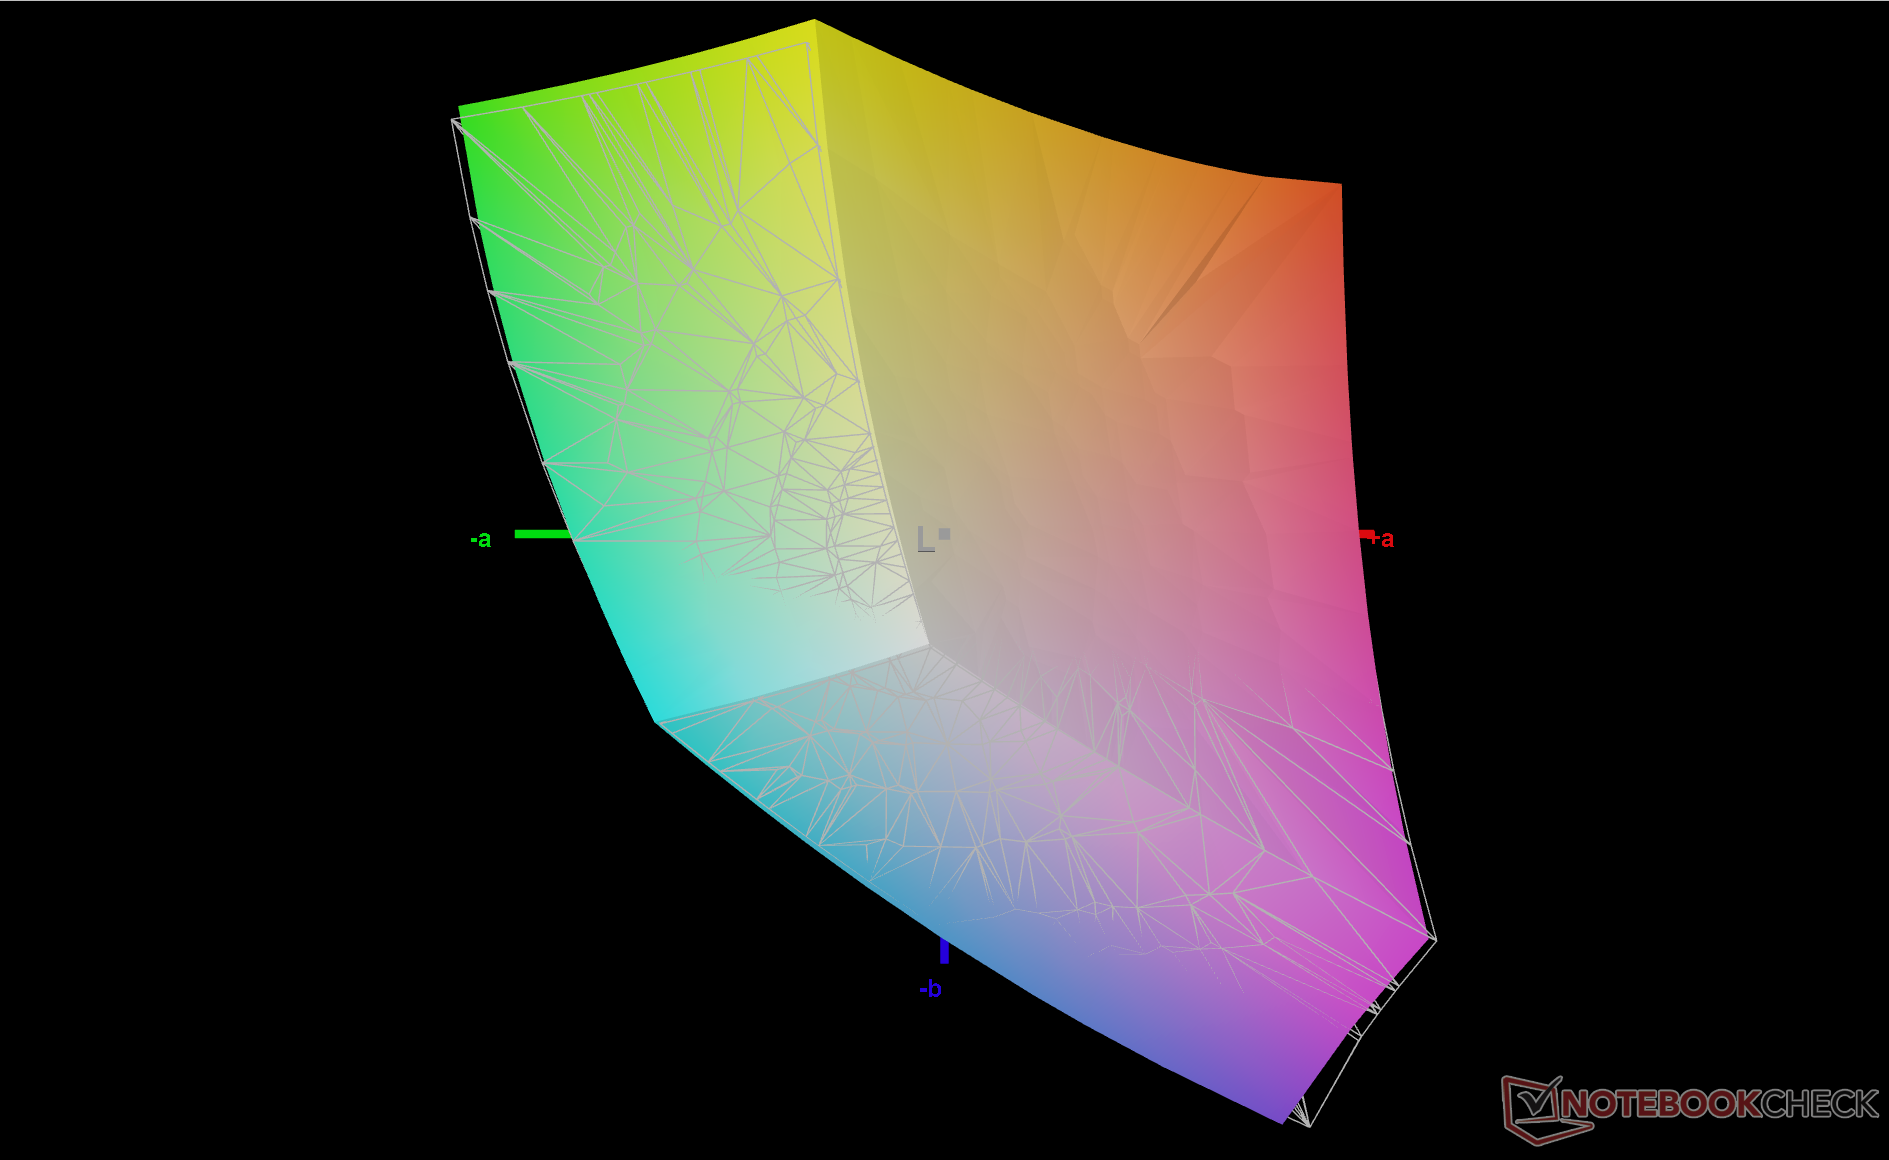
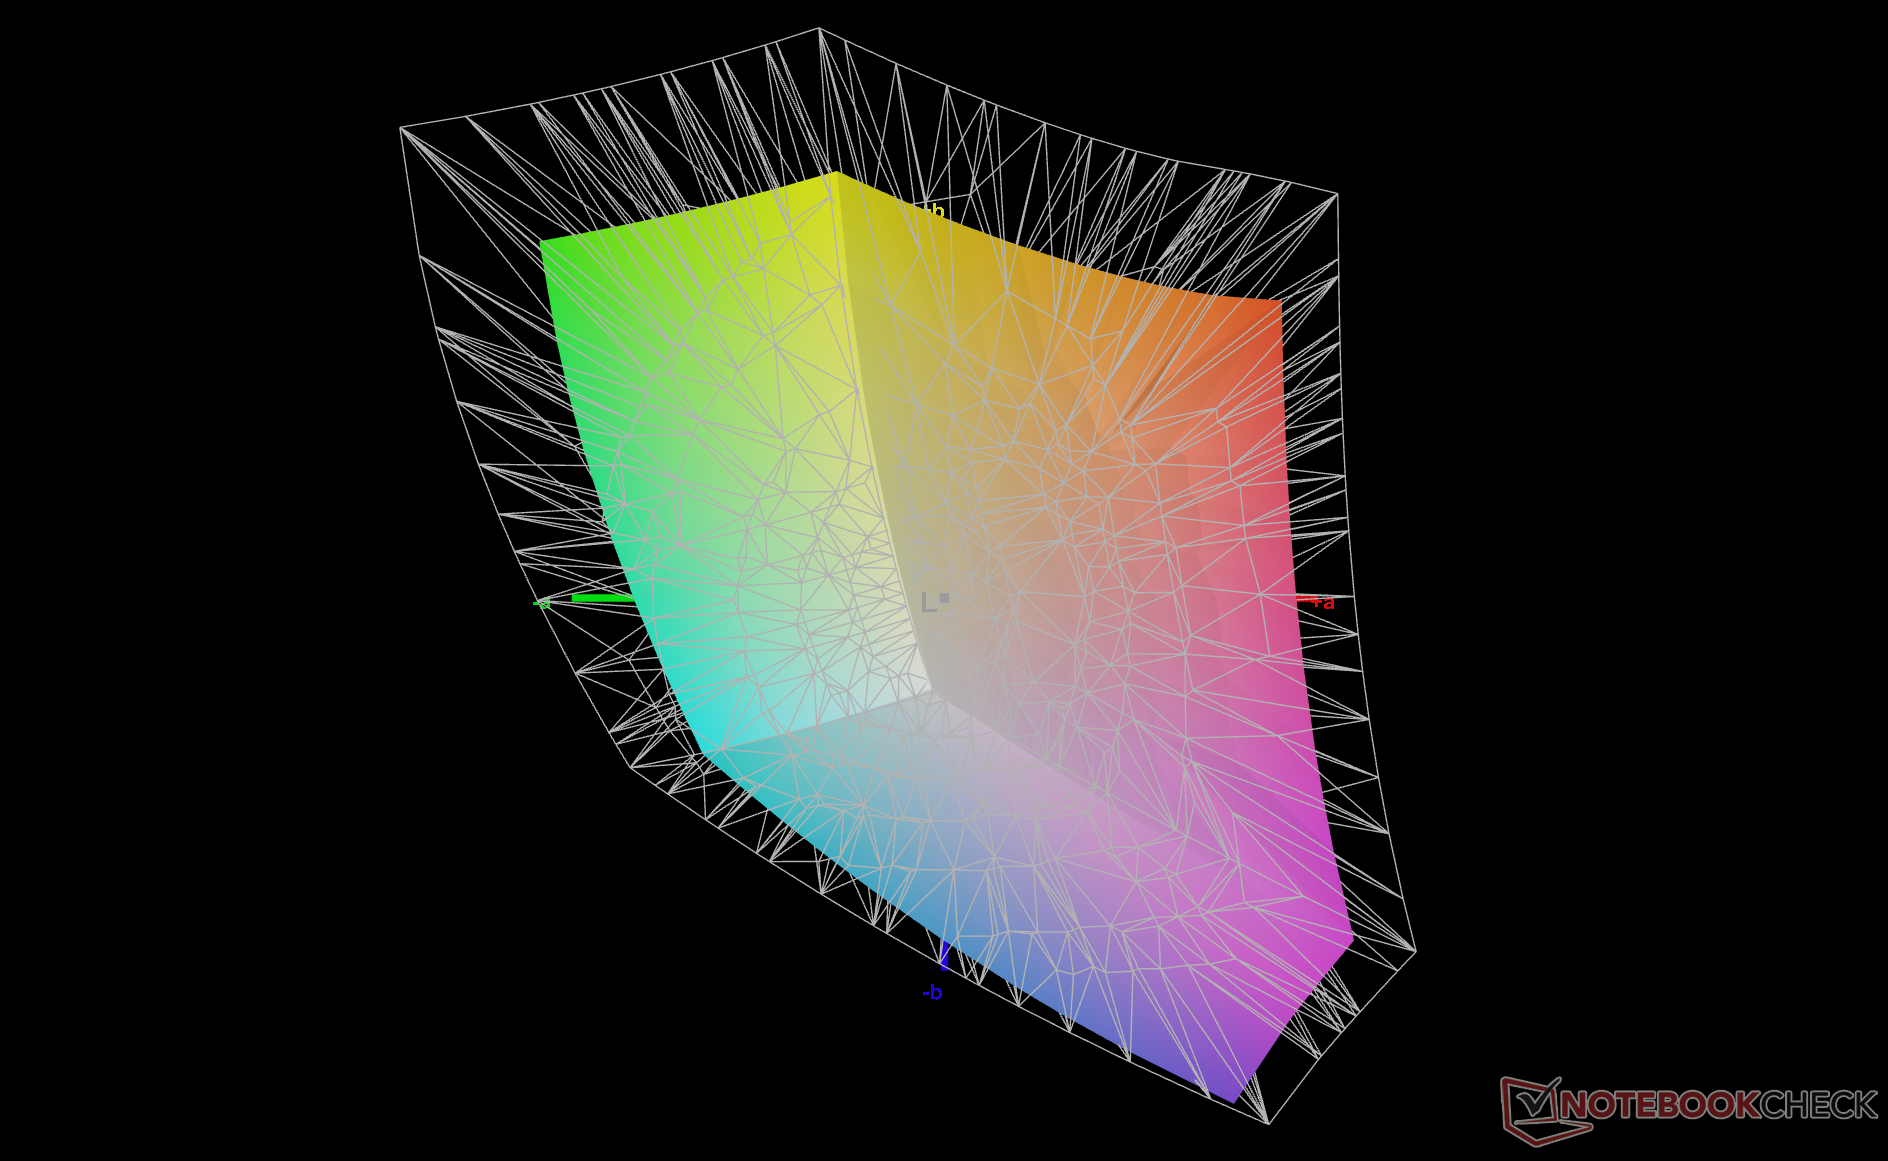
70.2% AdobeRGB 1998 (Argyll 3D)
98.6% sRGB (Argyll 3D)
68.3% Display P3 (Argyll 3D)
Gamma: 2.1
CCT: 6248 K
| HP Elite Dragonfly Folio 13.5 G3 Chi Mei CMN13C0, IPS, 1920x1280, 13.5" | HP Elite Dragonfly G3 Chi Mei CMN13C0, IPS, 1920x1280, 13.5" | Dell Latitude 13 7330 LG Philips 133WF9, IPS, 1920x1080, 13.3" | Framework Laptop 13.5 12th Gen Intel BOE CQ NE135FBM-N41, IPS, 2256x1504, 13.5" | Razer Book 13 FHD Sharp LQ134N1JW48, IPS, 1920x1200, 13.4" | Lenovo ThinkPad L13 Gen2-20VH0017GE B133HAN06.6, IPS, 1920x1080, 13.3" | |
|---|---|---|---|---|---|---|
| Display | 0% | -4% | 1% | 2% | -38% | |
| Display P3 Coverage (%) | 68.3 | 68 0% | 66.1 -3% | 69.9 2% | 70.1 3% | 42.49 -38% |
| sRGB Coverage (%) | 98.6 | 98.3 0% | 93.5 -5% | 99.4 1% | 99.3 1% | |
| AdobeRGB 1998 Coverage (%) | 70.2 | 69.9 0% | 68.2 -3% | 71.1 1% | 71.6 2% | 43.92 -37% |
| Response Times | 23% | 31% | 43% | 14% | 26% | |
| Response Time Grey 50% / Grey 80% * (ms) | 66.8 ? | 50.8 ? 24% | 48.4 ? 28% | 34.7 ? 48% | 56.8 ? 15% | 52.4 ? 22% |
| Response Time Black / White * (ms) | 44.4 ? | 35.2 ? 21% | 29.6 ? 33% | 27.5 ? 38% | 38.8 ? 13% | 31.2 ? 30% |
| PWM Frequency (Hz) | 2475 ? | |||||
| Screen | -3% | 3% | -17% | -15% | -121% | |
| Brightness middle (cd/m²) | 369.5 | 387.2 5% | 460.1 25% | 449.6 22% | 545.3 48% | 244 -34% |
| Brightness (cd/m²) | 350 | 360 3% | 445 27% | 431 23% | 507 45% | 237 -32% |
| Brightness Distribution (%) | 87 | 80 -8% | 89 2% | 90 3% | 88 1% | 93 7% |
| Black Level * (cd/m²) | 0.24 | 0.26 -8% | 0.31 -29% | 0.31 -29% | 0.31 -29% | 0.21 12% |
| Contrast (:1) | 1540 | 1489 -3% | 1484 -4% | 1450 -6% | 1759 14% | 1162 -25% |
| Colorchecker dE 2000 * | 2.3 | 2.36 -3% | 2.42 -5% | 2.76 -20% | 1.39 40% | 4.7 -104% |
| Colorchecker dE 2000 max. * | 4.34 | 4.79 -10% | 3.97 9% | 7.96 -83% | 2.61 40% | 17.7 -308% |
| Colorchecker dE 2000 calibrated * | 0.6 | 0.63 -5% | 0.77 -28% | 0.58 3% | 2.72 -353% | 4.3 -617% |
| Greyscale dE 2000 * | 3.1 | 3 3% | 2.3 26% | 5.2 -68% | 1.3 58% | 2.8 10% |
| Gamma | 2.1 105% | 2.17 101% | 2.23 99% | 2.23 99% | 2.2 100% | 2.24 98% |
| CCT | 6248 104% | 6137 106% | 6262 104% | 6475 100% | 6476 100% | 6259 104% |
| Color Space (Percent of AdobeRGB 1998) (%) | 65.9 | 40.3 | ||||
| Color Space (Percent of sRGB) (%) | 99.6 | 63 | ||||
| Total Average (Program / Settings) | 7% /
1% | 10% /
5% | 9% /
-5% | 0% /
-7% | -44% /
-86% |
* ... smaller is better
The panel is well calibrated out of the box with average grayscale and color deltaE values of 3.1 and 2.3, respectively. Nonetheless, our own calibration attempt would improve accuracy even further with average grayscale and color down to just 0.9 and 0.6, respectively. An end-user calibration can therefore be beneficial but largely unnecessary for most users. Our calibrated ICM profile is available above for owners who may be interested.
Display Response Times
| ↔ Response Time Black to White | ||
|---|---|---|
| 44.4 ms ... rise ↗ and fall ↘ combined | ↗ 24.4 ms rise | 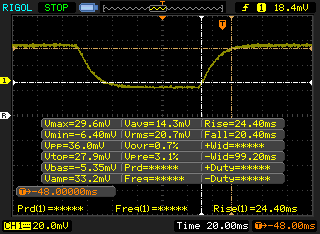 |
| ↘ 20.4 ms fall | ||
| The screen shows slow response rates in our tests and will be unsatisfactory for gamers. In comparison, all tested devices range from 0.1 (minimum) to 240 (maximum) ms. » 99 % of all devices are better. This means that the measured response time is worse than the average of all tested devices (20.4 ms). | ||
| ↔ Response Time 50% Grey to 80% Grey | ||
| 66.8 ms ... rise ↗ and fall ↘ combined | ↗ 35.6 ms rise | 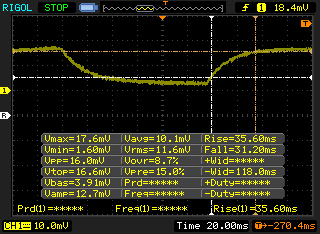 |
| ↘ 31.2 ms fall | ||
| The screen shows slow response rates in our tests and will be unsatisfactory for gamers. In comparison, all tested devices range from 0.165 (minimum) to 636 (maximum) ms. » 98 % of all devices are better. This means that the measured response time is worse than the average of all tested devices (31.9 ms). | ||
Screen Flickering / PWM (Pulse-Width Modulation)
| Screen flickering / PWM not detected |  | ||
In comparison: 53 % of all tested devices do not use PWM to dim the display. If PWM was detected, an average of 8255 (minimum: 5 - maximum: 343500) Hz was measured. | |||
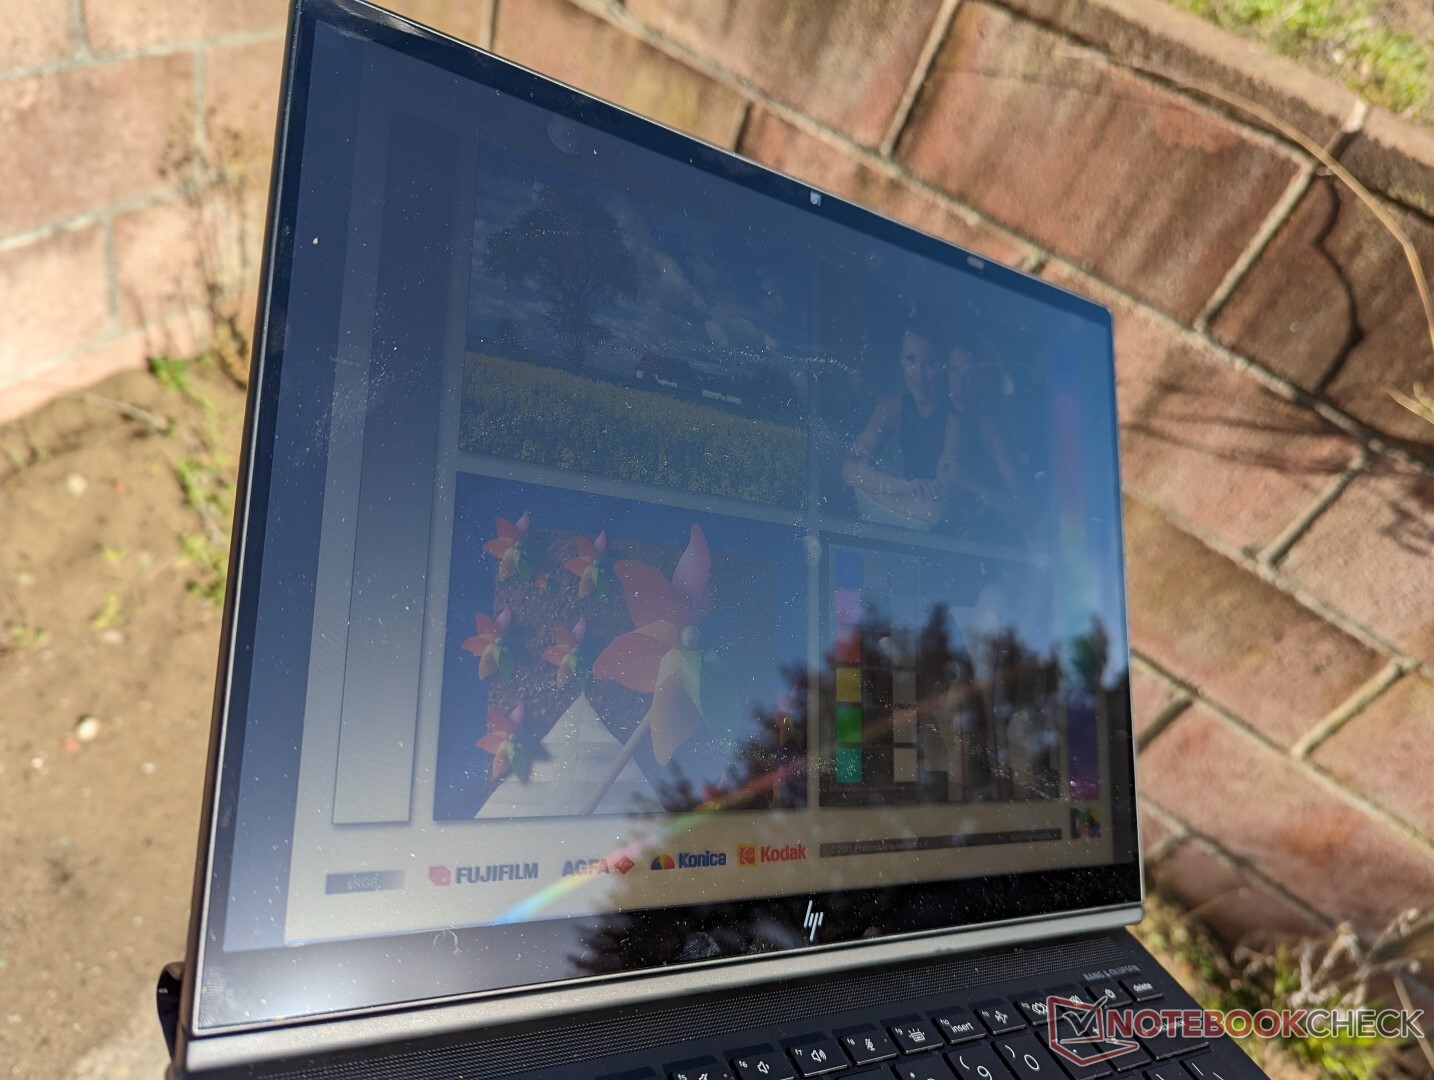
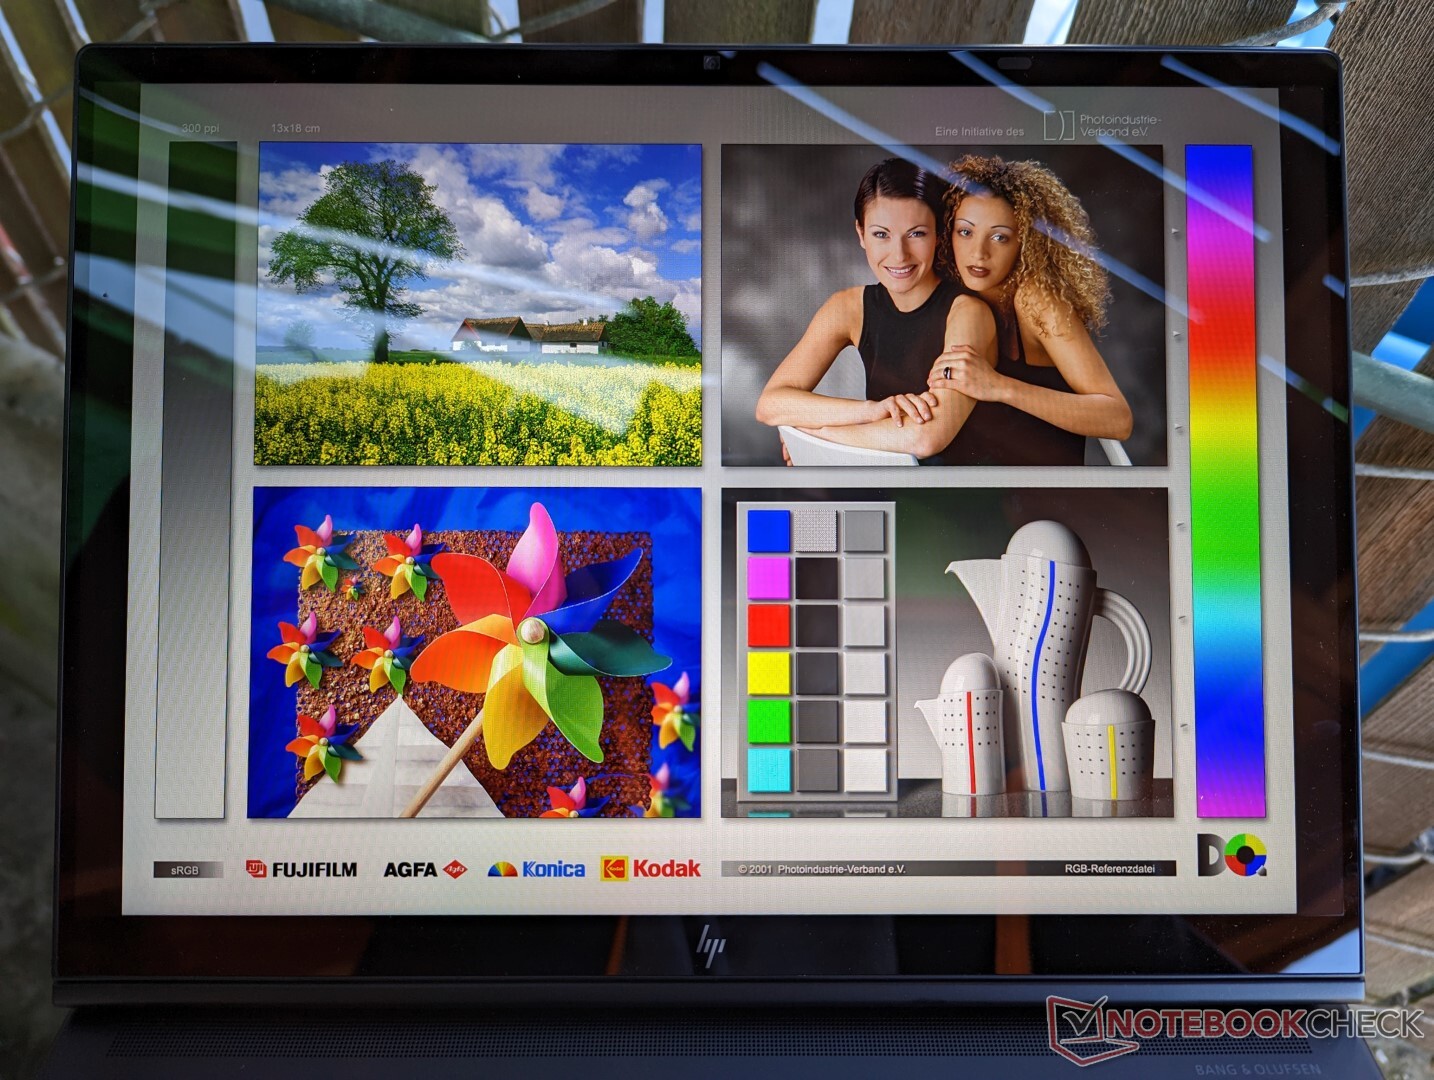
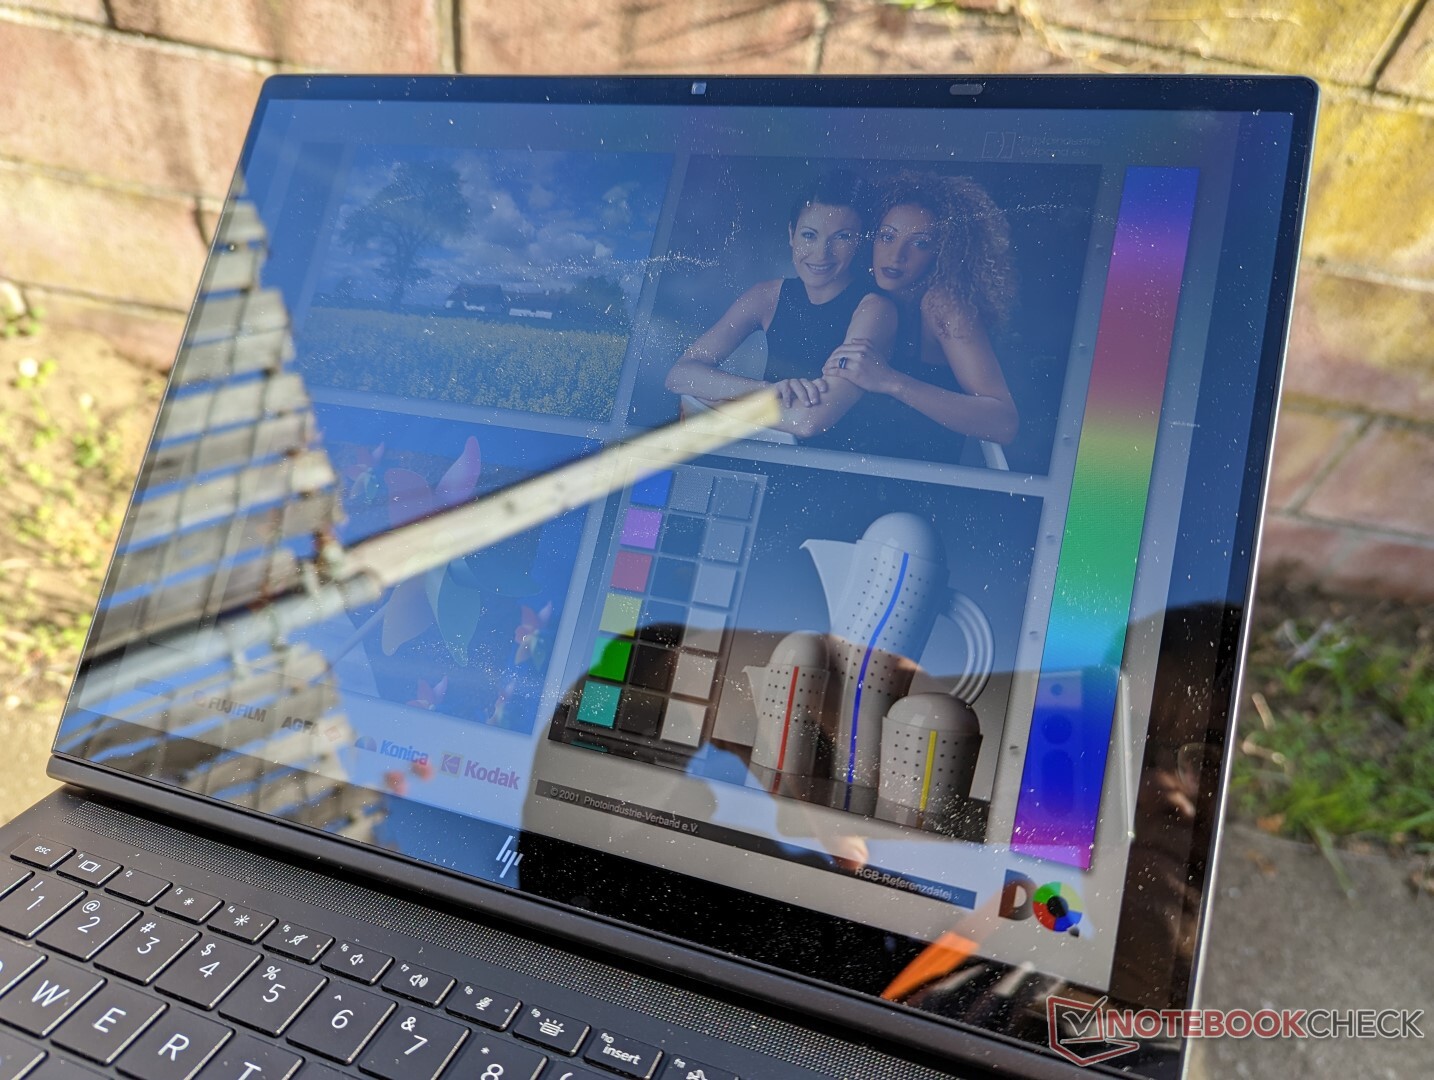
Outdoor visibility is decent only when under shade as brighter conditions will wash out colors and create even more glare. As mentioned earlier, HP offers 1000-nit panel options for better visibility outdoors. Lenovo and Dell have yet to match this feature with their respective ThinkPad or Latitude convertibles.
Performance — Proper Core U-series Options
Testing Conditions
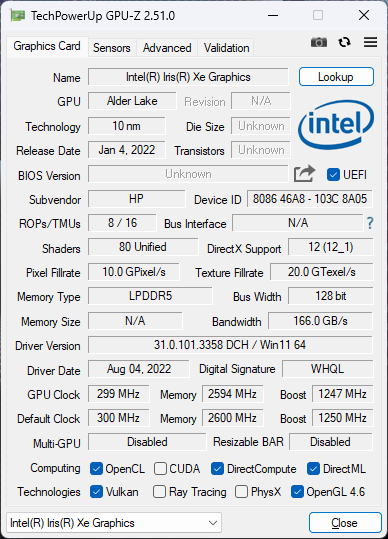
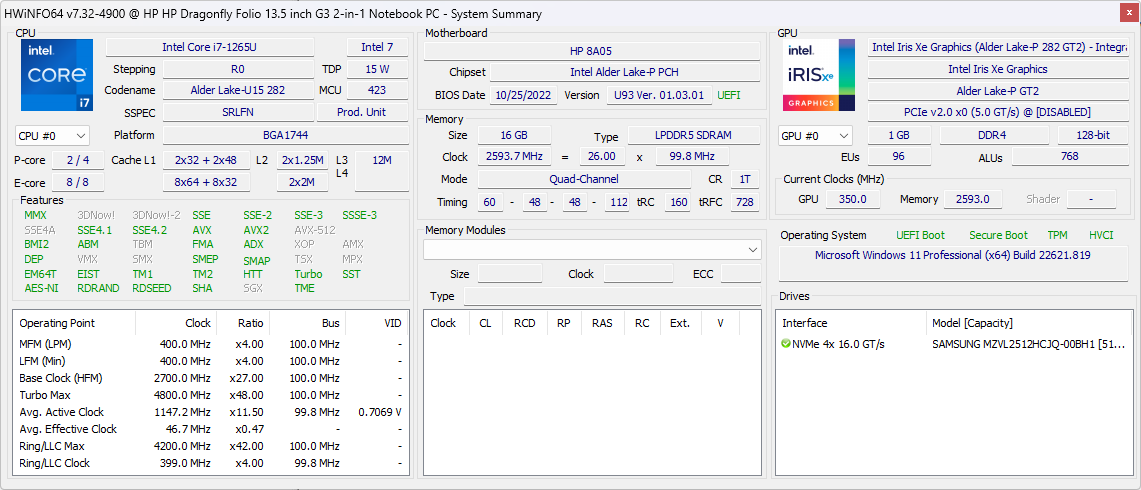
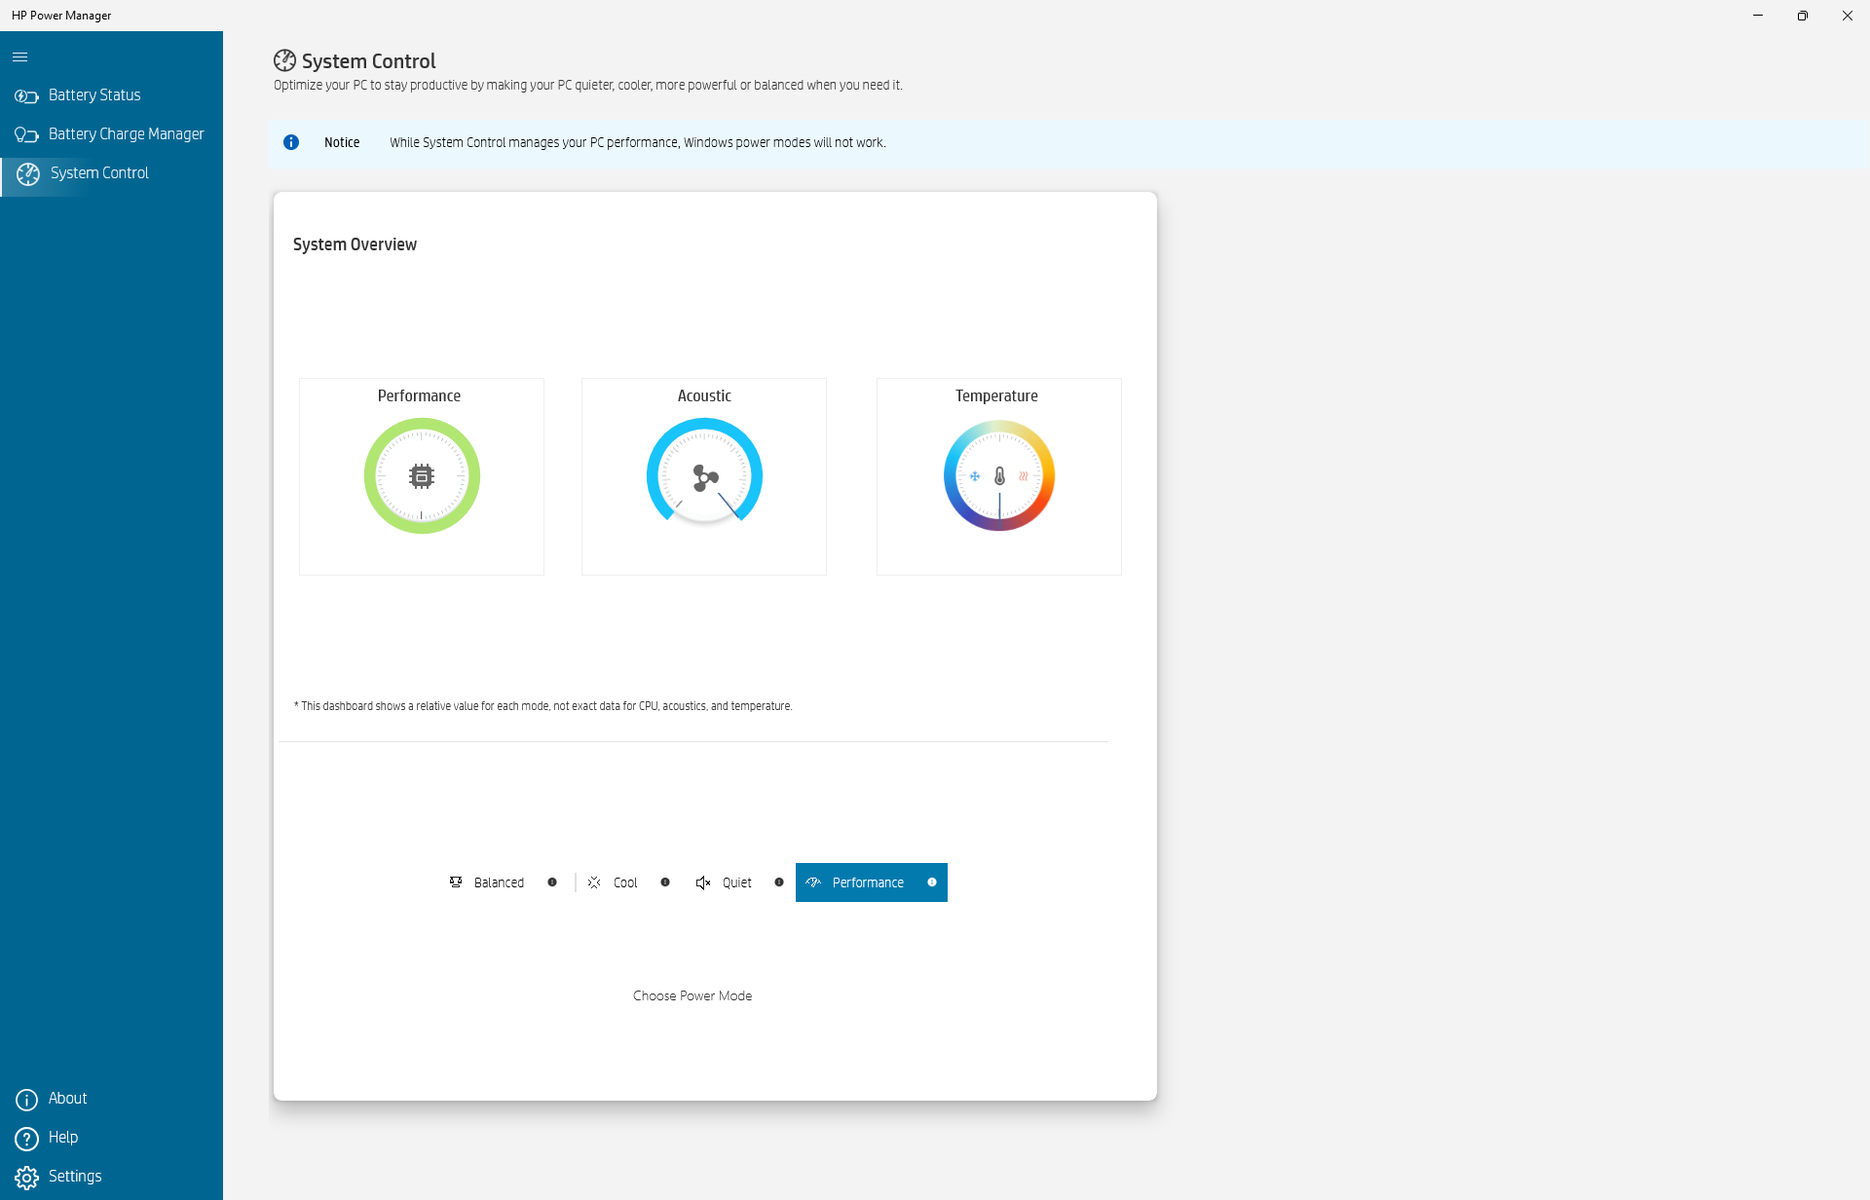
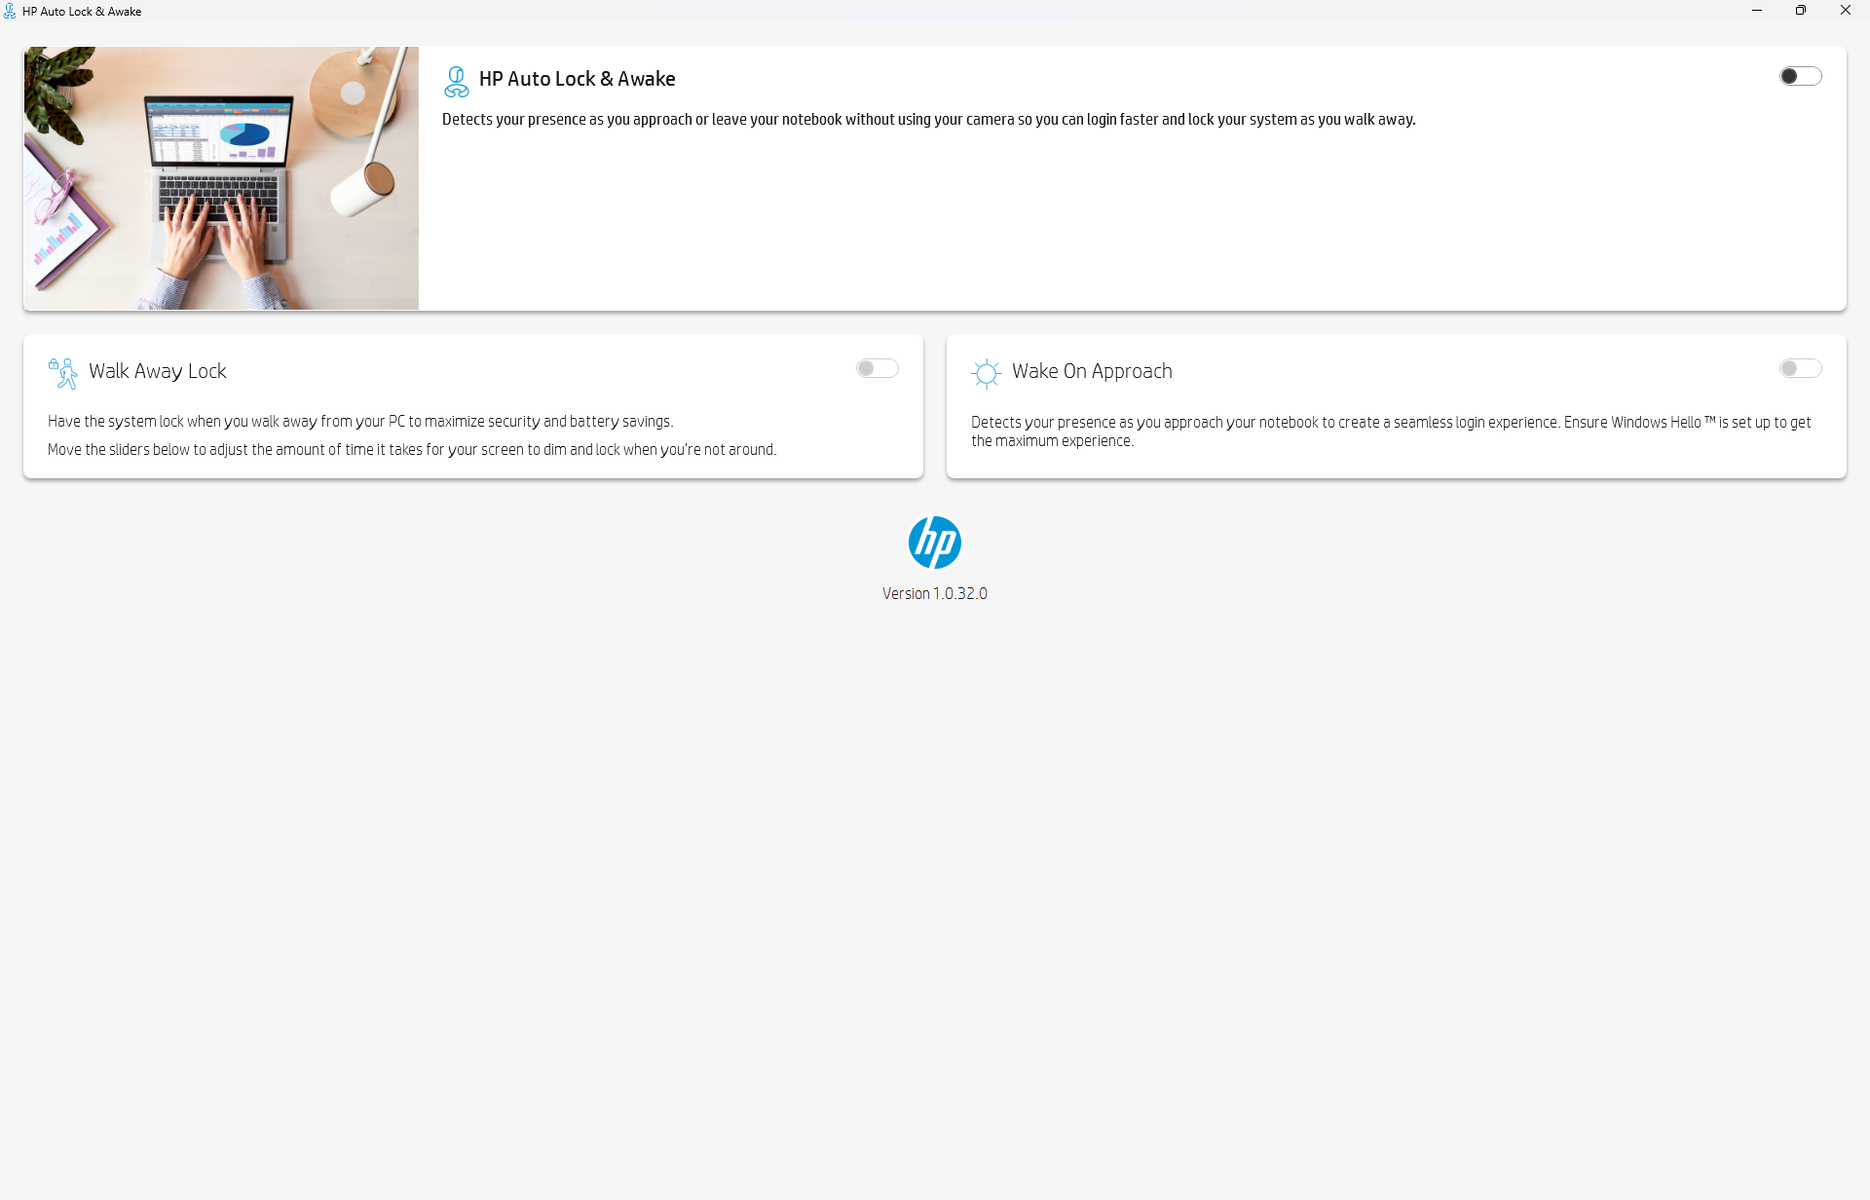
We set our unit to Best Performance mode via Windows and Performance mode via the HP Power Manager software prior to running any benchmarks below. It's recommended that owners become familiar with HP Power Manager, Auto Lock and Awake, and the Programmable Key applications. Power Manager sets the different performance levels of the laptop, Auto Lock and Awake toggles the IR sensor and auto-dimming features, and Programmable Key customizes the function of certain keys on the keyboard.

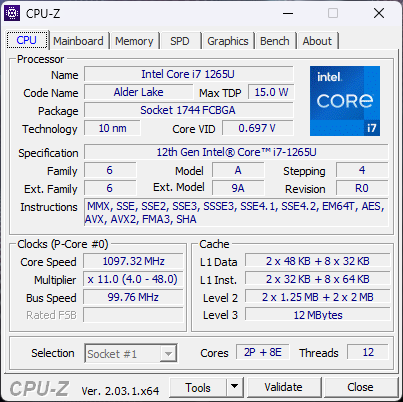
Processor
CPU performance is excellent with multi-thread results that are 10 to 15 percent faster than the average laptop in our database equipped with the same Core i7-1265U CPU. Most notably, it performs consistently faster than the Core i7-1265U in the Dragonfly G3 even after accounting for any throttling. Users upgrading from an older 10th gen Core i7-1065G7 will see massive gains in multi-thread performance by almost 2x.
Turbo Boost sustainability is not indefinite which is to be expected from a U-series Ultrabook. Running CineBench R15 xT in a loop shows a performance dip of about 20 percent over time as shown by the graph below.
Cinebench R15 Multi Loop
Cinebench R23: Multi Core | Single Core
Cinebench R15: CPU Multi 64Bit | CPU Single 64Bit
Blender: v2.79 BMW27 CPU
7-Zip 18.03: 7z b 4 | 7z b 4 -mmt1
Geekbench 5.5: Multi-Core | Single-Core
HWBOT x265 Benchmark v2.2: 4k Preset
LibreOffice : 20 Documents To PDF
R Benchmark 2.5: Overall mean
Cinebench R23: Multi Core | Single Core
Cinebench R15: CPU Multi 64Bit | CPU Single 64Bit
Blender: v2.79 BMW27 CPU
7-Zip 18.03: 7z b 4 | 7z b 4 -mmt1
Geekbench 5.5: Multi-Core | Single-Core
HWBOT x265 Benchmark v2.2: 4k Preset
LibreOffice : 20 Documents To PDF
R Benchmark 2.5: Overall mean
* ... smaller is better
* ... smaller is better
AIDA64: FP32 Ray-Trace | FPU Julia | CPU SHA3 | CPU Queen | FPU SinJulia | FPU Mandel | CPU AES | CPU ZLib | FP64 Ray-Trace | CPU PhotoWorxx
| Performance Rating | |
| Framework Laptop 13.5 12th Gen Intel | |
| HP Elite Dragonfly Folio 13.5 G3 | |
| Dell Latitude 13 7330 | |
| Average Intel Core i7-1265U | |
| HP Elite Dragonfly G3 | |
| Lenovo ThinkPad L13 Gen2-20VH0017GE | |
| AIDA64 / FP32 Ray-Trace | |
| HP Elite Dragonfly Folio 13.5 G3 | |
| Dell Latitude 13 7330 | |
| Average Intel Core i7-1265U (2619 - 8178, n=10) | |
| Lenovo ThinkPad L13 Gen2-20VH0017GE | |
| Lenovo ThinkPad L13 Gen2-20VH0017GE | |
| HP Elite Dragonfly G3 | |
| Framework Laptop 13.5 12th Gen Intel | |
| AIDA64 / FPU SinJulia | |
| Framework Laptop 13.5 12th Gen Intel | |
| HP Elite Dragonfly Folio 13.5 G3 | |
| Lenovo ThinkPad L13 Gen2-20VH0017GE | |
| Lenovo ThinkPad L13 Gen2-20VH0017GE | |
| Average Intel Core i7-1265U (3105 - 5135, n=10) | |
| Dell Latitude 13 7330 | |
| HP Elite Dragonfly G3 | |
| AIDA64 / FPU Mandel | |
| HP Elite Dragonfly Folio 13.5 G3 | |
| Dell Latitude 13 7330 | |
| Average Intel Core i7-1265U (6967 - 20804, n=10) | |
| Lenovo ThinkPad L13 Gen2-20VH0017GE | |
| Lenovo ThinkPad L13 Gen2-20VH0017GE | |
| HP Elite Dragonfly G3 | |
| Framework Laptop 13.5 12th Gen Intel | |
| AIDA64 / FP64 Ray-Trace | |
| HP Elite Dragonfly Folio 13.5 G3 | |
| Dell Latitude 13 7330 | |
| Lenovo ThinkPad L13 Gen2-20VH0017GE | |
| Lenovo ThinkPad L13 Gen2-20VH0017GE | |
| Average Intel Core i7-1265U (1473 - 4376, n=10) | |
| HP Elite Dragonfly G3 | |
| Framework Laptop 13.5 12th Gen Intel | |
| AIDA64 / CPU PhotoWorxx | |
| HP Elite Dragonfly Folio 13.5 G3 | |
| HP Elite Dragonfly G3 | |
| Average Intel Core i7-1265U (20213 - 47031, n=10) | |
| Framework Laptop 13.5 12th Gen Intel | |
| Lenovo ThinkPad L13 Gen2-20VH0017GE | |
| Lenovo ThinkPad L13 Gen2-20VH0017GE | |
| Dell Latitude 13 7330 | |
System Performance
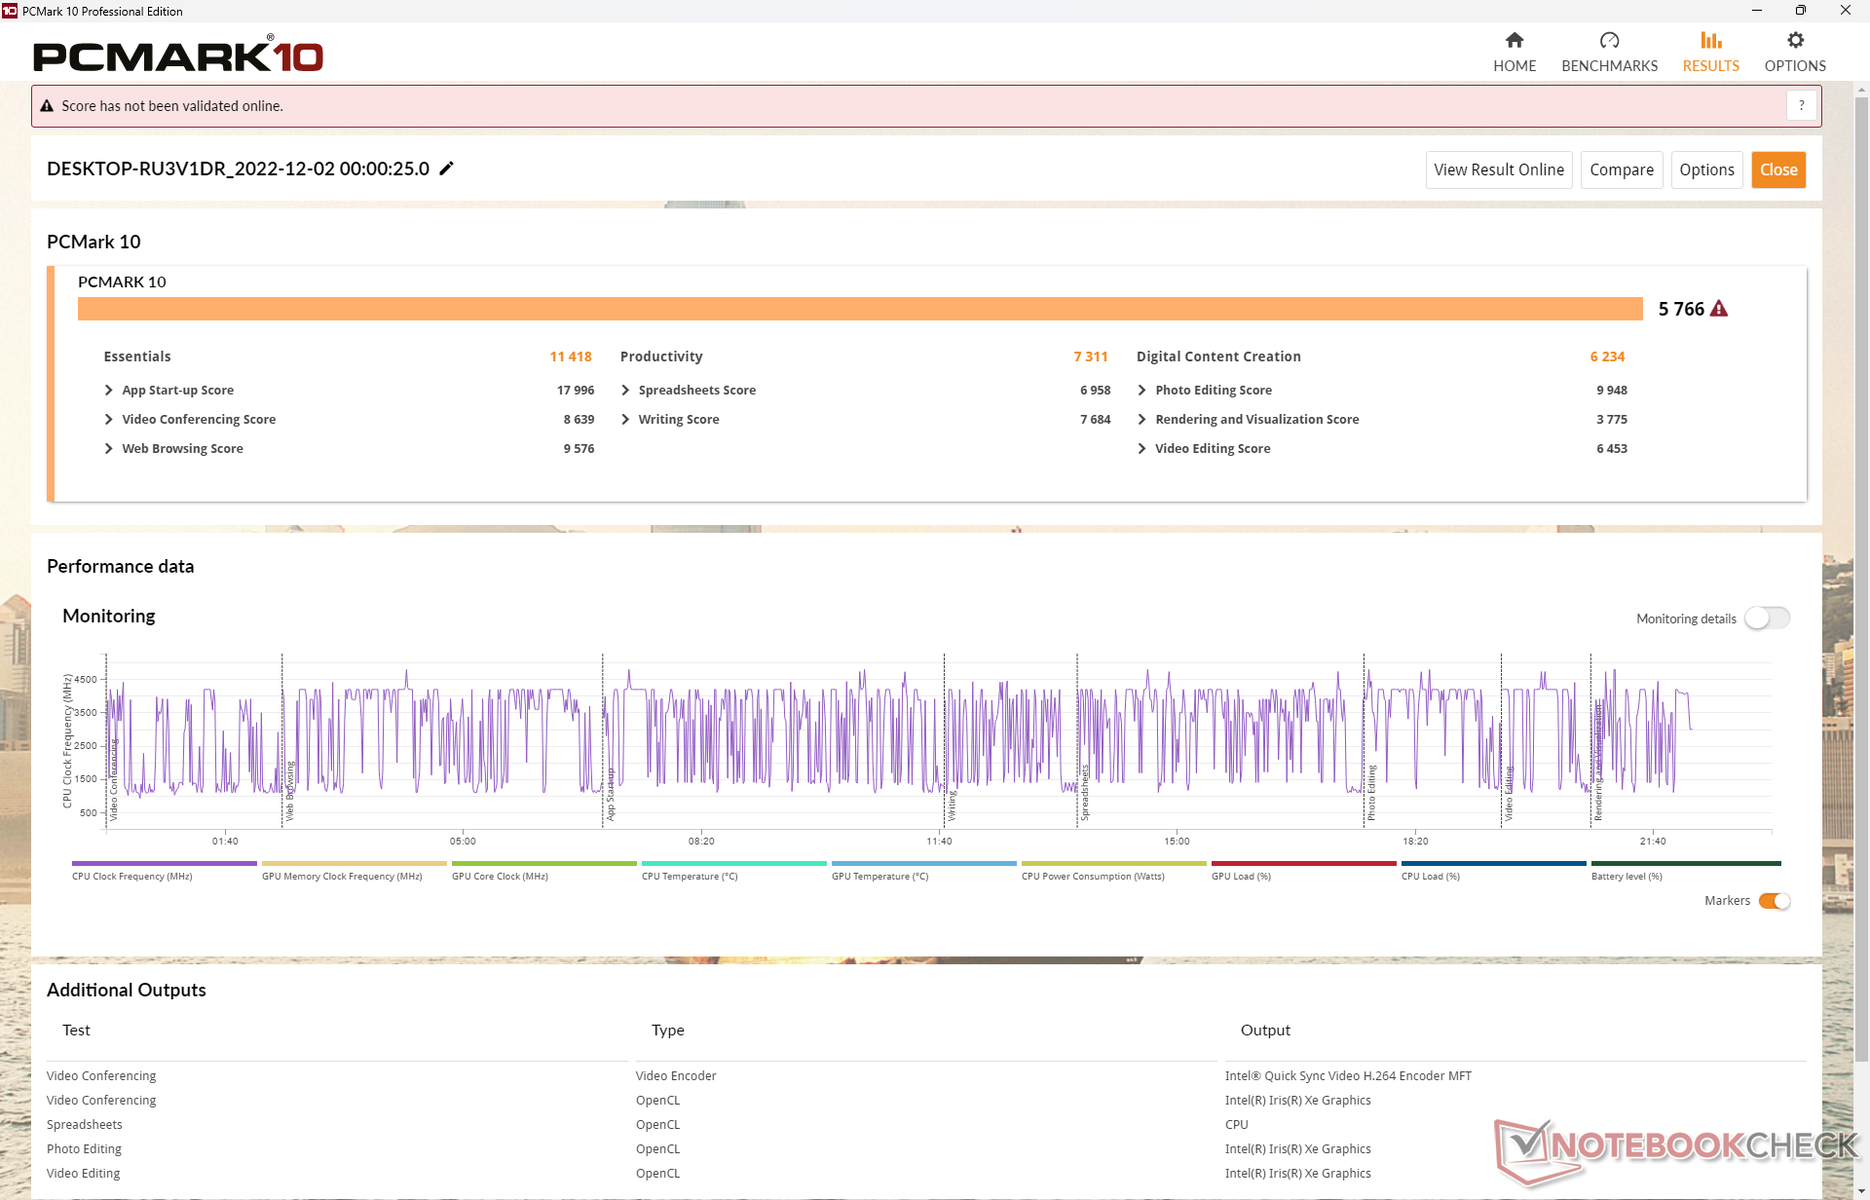
PCMark 10 results are higher than most other convertibles and competing business subnotebooks including HP's own Dragonfly G3. We attribute the higher scores to the PCIe4 x4 Samsung SSD which is generally faster than the Micron 3400 in most scenarios.
CrossMark: Overall | Productivity | Creativity | Responsiveness
| PCMark 10 / Score | |
| Average of class Convertible (3229 - 9125, n=56, last 2 years) | |
| Framework Laptop 13.5 12th Gen Intel | |
| HP Elite Dragonfly Folio 13.5 G3 | |
| Average Intel Core i7-1265U, Intel Iris Xe Graphics G7 96EUs (4753 - 5766, n=7) | |
| Dell Latitude 13 7330 | |
| Razer Book 13 FHD | |
| HP Elite Dragonfly G3 | |
| Lenovo ThinkPad L13 Gen2-20VH0017GE | |
| PCMark 10 / Essentials | |
| HP Elite Dragonfly Folio 13.5 G3 | |
| Framework Laptop 13.5 12th Gen Intel | |
| Average of class Convertible (7233 - 12222, n=56, last 2 years) | |
| Dell Latitude 13 7330 | |
| Average Intel Core i7-1265U, Intel Iris Xe Graphics G7 96EUs (9278 - 11418, n=7) | |
| Razer Book 13 FHD | |
| Lenovo ThinkPad L13 Gen2-20VH0017GE | |
| HP Elite Dragonfly G3 | |
| PCMark 10 / Productivity | |
| Average of class Convertible (5062 - 10643, n=56, last 2 years) | |
| HP Elite Dragonfly Folio 13.5 G3 | |
| Framework Laptop 13.5 12th Gen Intel | |
| Dell Latitude 13 7330 | |
| Razer Book 13 FHD | |
| Average Intel Core i7-1265U, Intel Iris Xe Graphics G7 96EUs (5828 - 7311, n=7) | |
| Lenovo ThinkPad L13 Gen2-20VH0017GE | |
| HP Elite Dragonfly G3 | |
| PCMark 10 / Digital Content Creation | |
| Average of class Convertible (2496 - 16551, n=56, last 2 years) | |
| Framework Laptop 13.5 12th Gen Intel | |
| HP Elite Dragonfly Folio 13.5 G3 | |
| Average Intel Core i7-1265U, Intel Iris Xe Graphics G7 96EUs (5127 - 6330, n=7) | |
| HP Elite Dragonfly G3 | |
| Razer Book 13 FHD | |
| Dell Latitude 13 7330 | |
| Lenovo ThinkPad L13 Gen2-20VH0017GE | |
| CrossMark / Overall | |
| Framework Laptop 13.5 12th Gen Intel | |
| HP Elite Dragonfly Folio 13.5 G3 | |
| Average of class Convertible (524 - 2274, n=59, last 2 years) | |
| Average Intel Core i7-1265U, Intel Iris Xe Graphics G7 96EUs (1301 - 1615, n=7) | |
| Dell Latitude 13 7330 | |
| HP Elite Dragonfly G3 | |
| CrossMark / Productivity | |
| Framework Laptop 13.5 12th Gen Intel | |
| HP Elite Dragonfly Folio 13.5 G3 | |
| Average of class Convertible (554 - 1925, n=59, last 2 years) | |
| Dell Latitude 13 7330 | |
| Average Intel Core i7-1265U, Intel Iris Xe Graphics G7 96EUs (1230 - 1586, n=7) | |
| HP Elite Dragonfly G3 | |
| CrossMark / Creativity | |
| Framework Laptop 13.5 12th Gen Intel | |
| Average of class Convertible (550 - 2949, n=59, last 2 years) | |
| HP Elite Dragonfly Folio 13.5 G3 | |
| Average Intel Core i7-1265U, Intel Iris Xe Graphics G7 96EUs (1413 - 1706, n=7) | |
| HP Elite Dragonfly G3 | |
| Dell Latitude 13 7330 | |
| CrossMark / Responsiveness | |
| HP Elite Dragonfly Folio 13.5 G3 | |
| Framework Laptop 13.5 12th Gen Intel | |
| Average Intel Core i7-1265U, Intel Iris Xe Graphics G7 96EUs (1193 - 1521, n=7) | |
| Average of class Convertible (381 - 1719, n=59, last 2 years) | |
| Dell Latitude 13 7330 | |
| HP Elite Dragonfly G3 | |
| PCMark 10 Score | 5766 points | |
Help | ||
| AIDA64 / Memory Copy | |
| HP Elite Dragonfly G3 | |
| HP Elite Dragonfly Folio 13.5 G3 | |
| Average Intel Core i7-1265U (40212 - 72204, n=10) | |
| Framework Laptop 13.5 12th Gen Intel | |
| Dell Latitude 13 7330 | |
| Lenovo ThinkPad L13 Gen2-20VH0017GE | |
| Lenovo ThinkPad L13 Gen2-20VH0017GE | |
| AIDA64 / Memory Read | |
| HP Elite Dragonfly Folio 13.5 G3 | |
| HP Elite Dragonfly G3 | |
| Average Intel Core i7-1265U (41808 - 69493, n=10) | |
| Framework Laptop 13.5 12th Gen Intel | |
| Dell Latitude 13 7330 | |
| Lenovo ThinkPad L13 Gen2-20VH0017GE | |
| Lenovo ThinkPad L13 Gen2-20VH0017GE | |
| AIDA64 / Memory Write | |
| HP Elite Dragonfly Folio 13.5 G3 | |
| Average Intel Core i7-1265U (41382 - 76027, n=10) | |
| HP Elite Dragonfly G3 | |
| Framework Laptop 13.5 12th Gen Intel | |
| Dell Latitude 13 7330 | |
| Lenovo ThinkPad L13 Gen2-20VH0017GE | |
| Lenovo ThinkPad L13 Gen2-20VH0017GE | |
| AIDA64 / Memory Latency | |
| HP Elite Dragonfly Folio 13.5 G3 | |
| HP Elite Dragonfly G3 | |
| Average Intel Core i7-1265U (74.6 - 112.4, n=10) | |
| Framework Laptop 13.5 12th Gen Intel | |
| Dell Latitude 13 7330 | |
| Lenovo ThinkPad L13 Gen2-20VH0017GE | |
| Lenovo ThinkPad L13 Gen2-20VH0017GE | |
* ... smaller is better
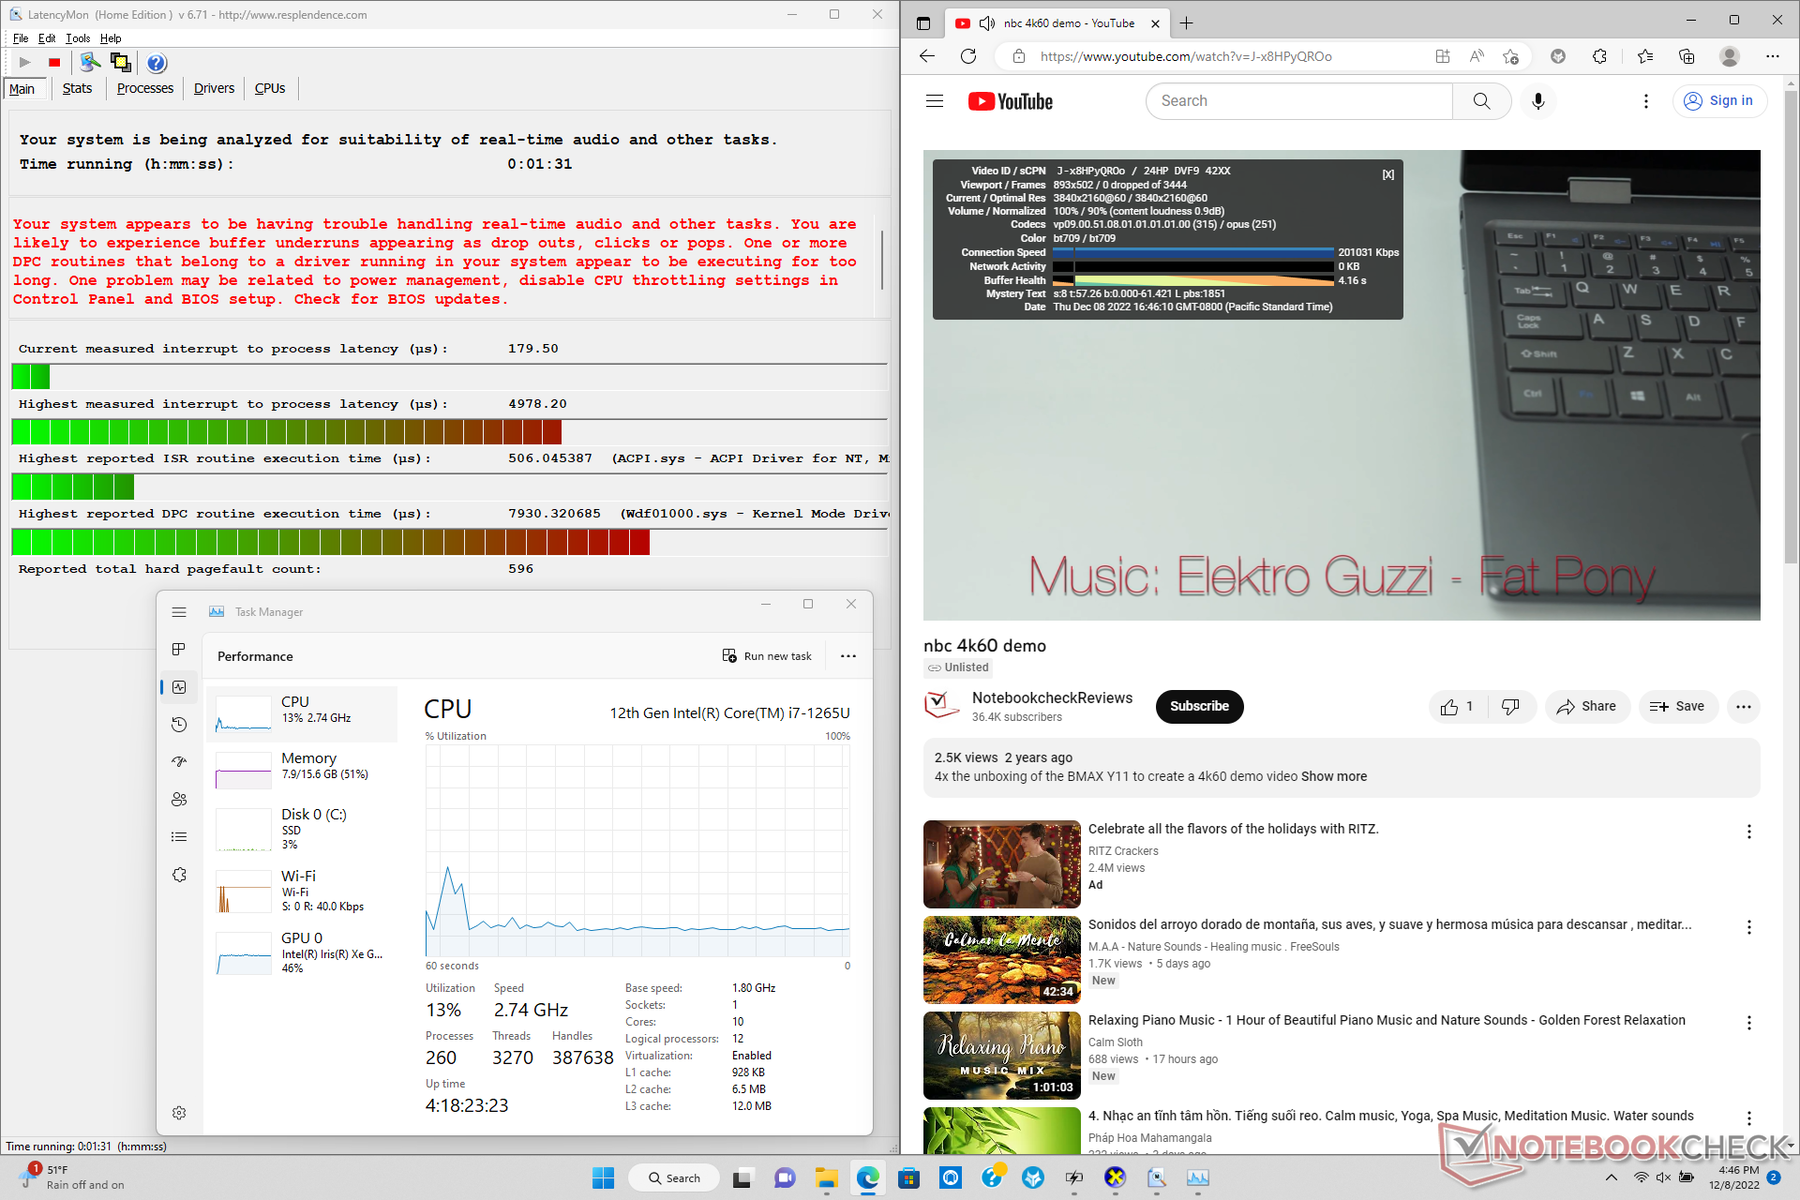
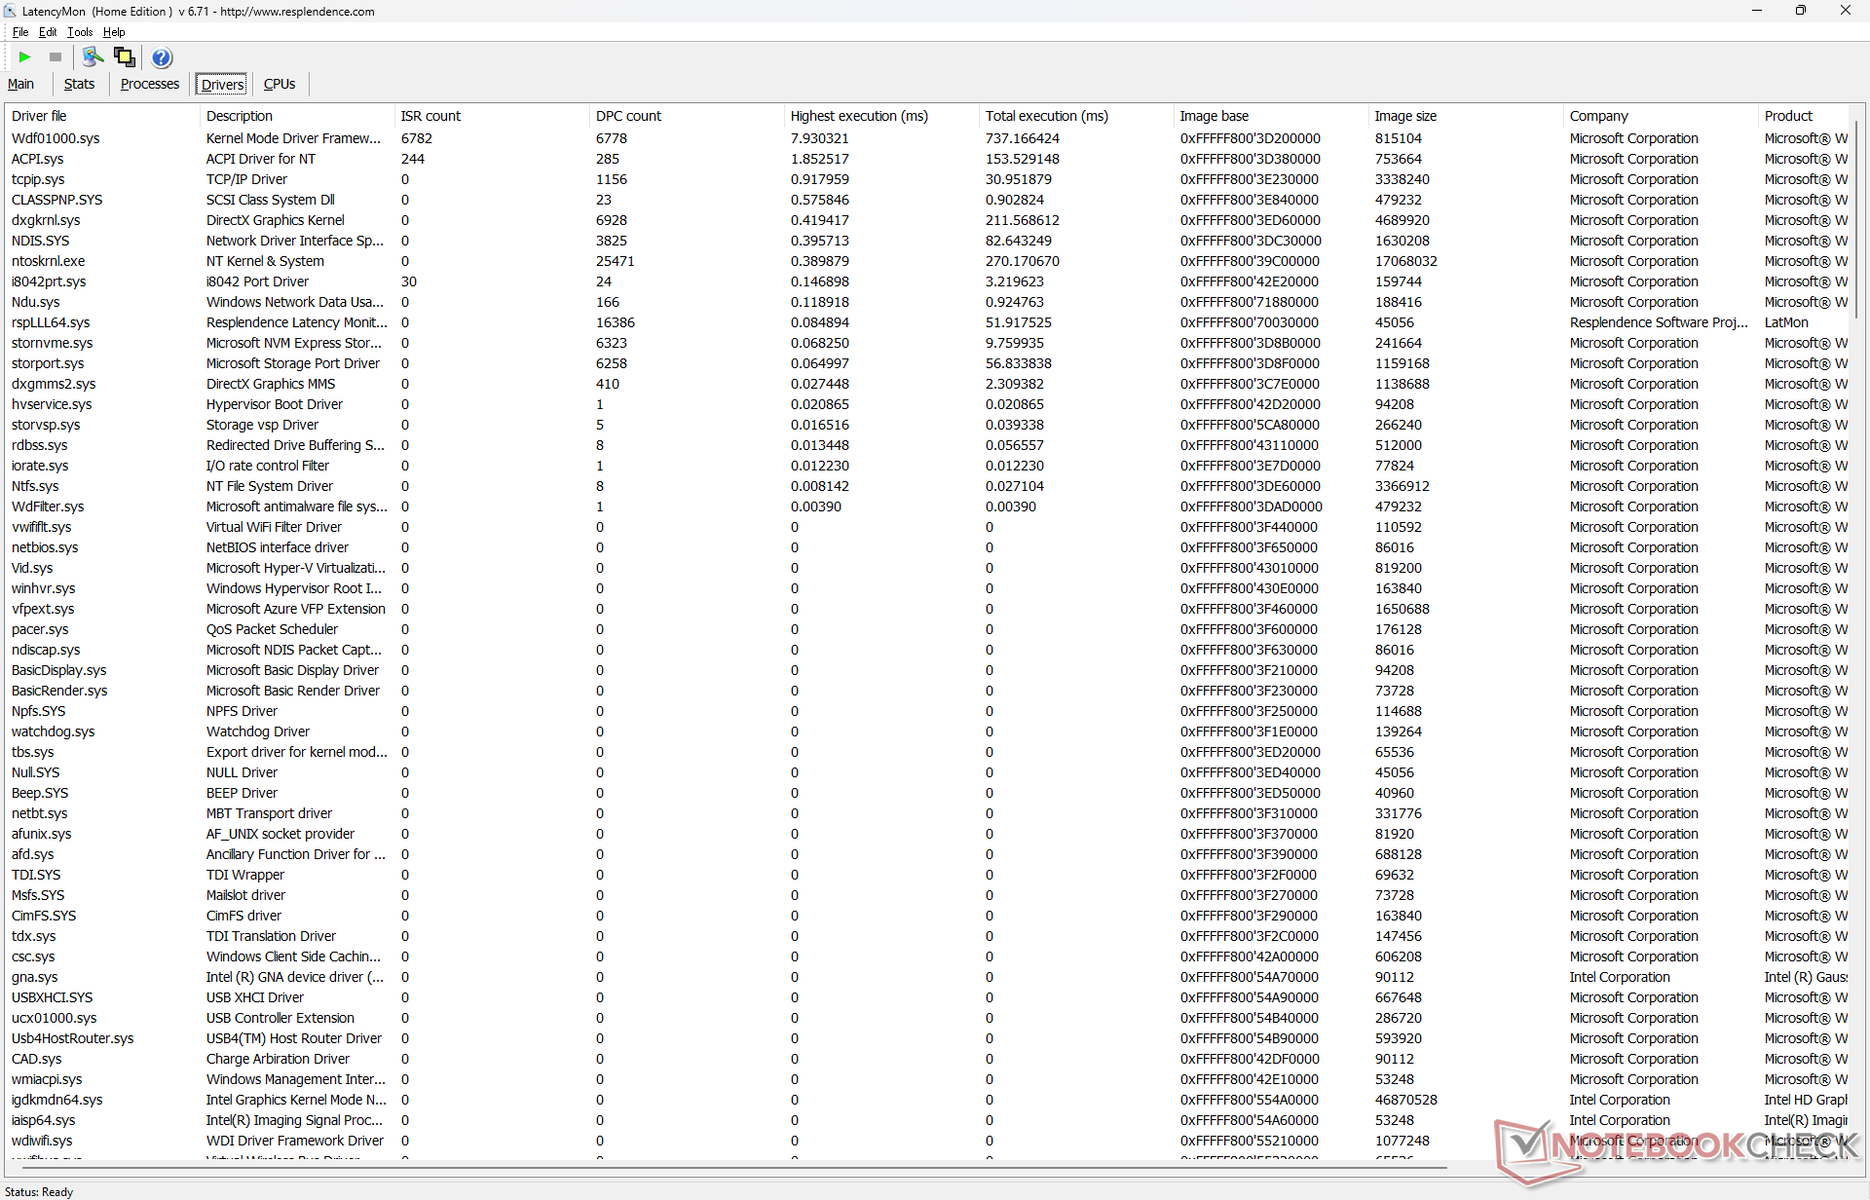
DPC Latency
LastencyMon shows significant DPC issues when opening multiple browser tabs on our homepage. We repeated this test several times and results would not change. 4K video playback at 60 FPS is otherwise perfect with no dropped frames.
| DPC Latencies / LatencyMon - interrupt to process latency (max), Web, Youtube, Prime95 | |
| HP Elite Dragonfly Folio 13.5 G3 | |
| Razer Book 13 FHD | |
| Lenovo ThinkPad L13 Gen2-20VH0017GE | |
| Framework Laptop 13.5 12th Gen Intel | |
| Dell Latitude 13 7330 | |
| HP Elite Dragonfly G3 | |
* ... smaller is better
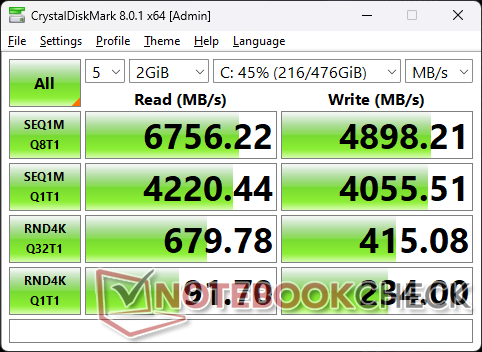
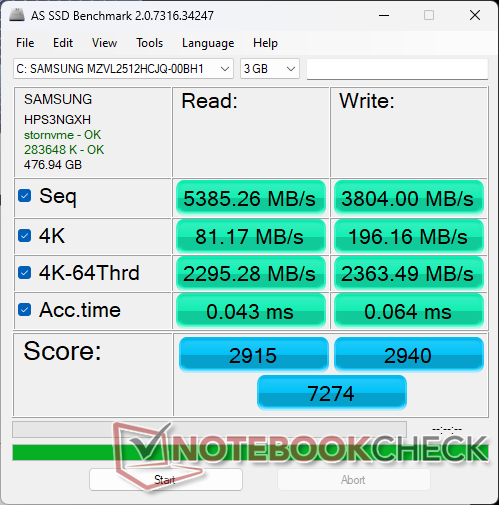
Storage Devices — PCIe4 x4 Support
There is only room for one M.2 PCIe4 x4 NVMe SSD with no secondary options. Our test unit ships with a 512 GB Samsung PM9A1 for maximum read and write rates of up to 6700 MB/s and 4900 MB/s, respectively. Unfortunately, the drive cannot maintain such high transfer rates over long periods as shown by our DiskSpd loop test results below. The Dragonfly Folio G3 lacks an SSD heat spreader meaning the drive must throttle to keep temperatures at safer levels. It takes a few minutes of heavy SSD usage before any throttling would occur, however, and so this should shouldn't be a problem for most users.

| Drive Performance Rating - Percent | |
| HP Elite Dragonfly Folio 13.5 G3 -11! | |
| HP Elite Dragonfly G3 | |
| Lenovo ThinkPad L13 Gen2-20VH0017GE | |
| Framework Laptop 13.5 12th Gen Intel | |
| Razer Book 13 FHD | |
| Dell Latitude 13 7330 | |
* ... smaller is better
Disk Throttling: DiskSpd Read Loop, Queue Depth 8
GPU Performance — Iris Xe All The Way
The Iris Xe 96 EUs is still the fastest integrated graphics solution that Intel has to offer at the moment. Though it has since fallen behind AMD, high graphics performance isn't exactly the focus for a 2-in-1 business subnotebook. Downgrading to a lesser Core i5 SKU with the Iris Xe 80 EUs will entail a graphics performance drop of about 20 to 30 percent.
Running 3DMark 11 in Balanced mode or Performance mode shows negligible performance differences between the two modes.
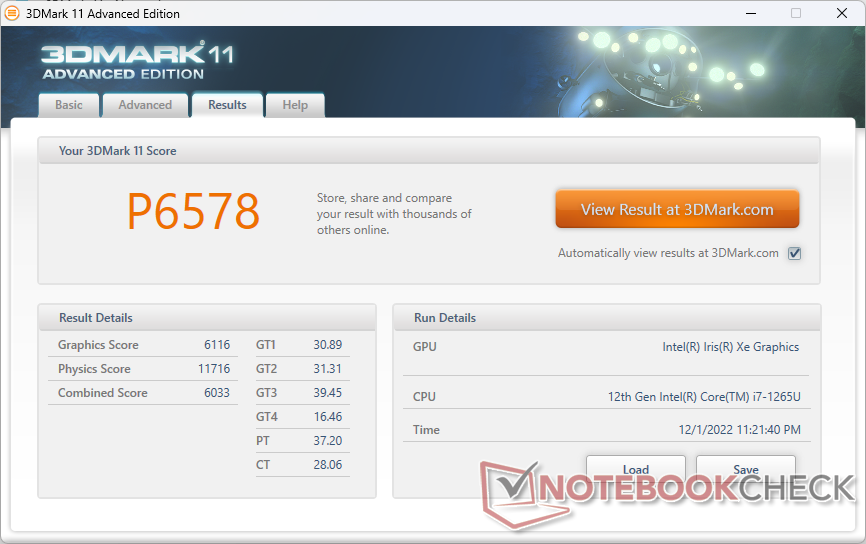
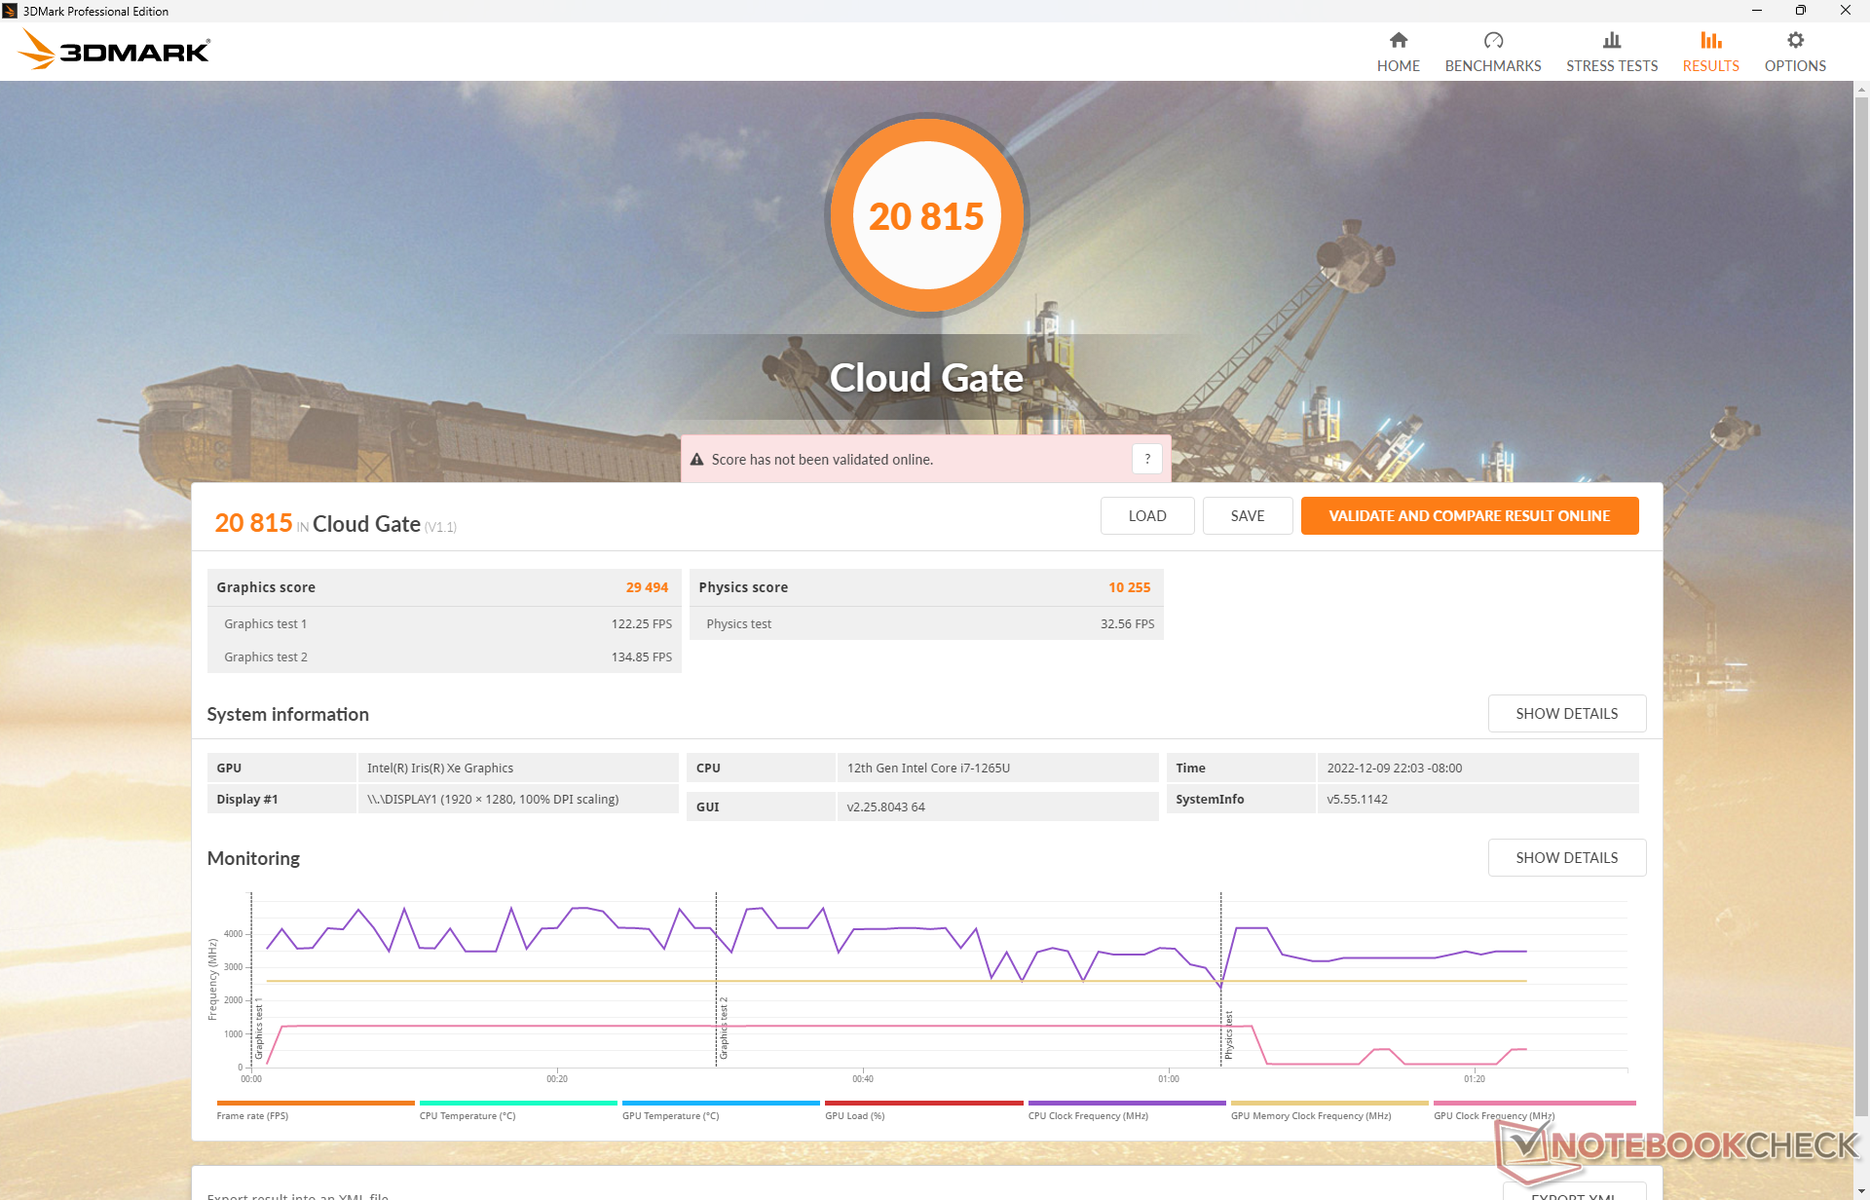
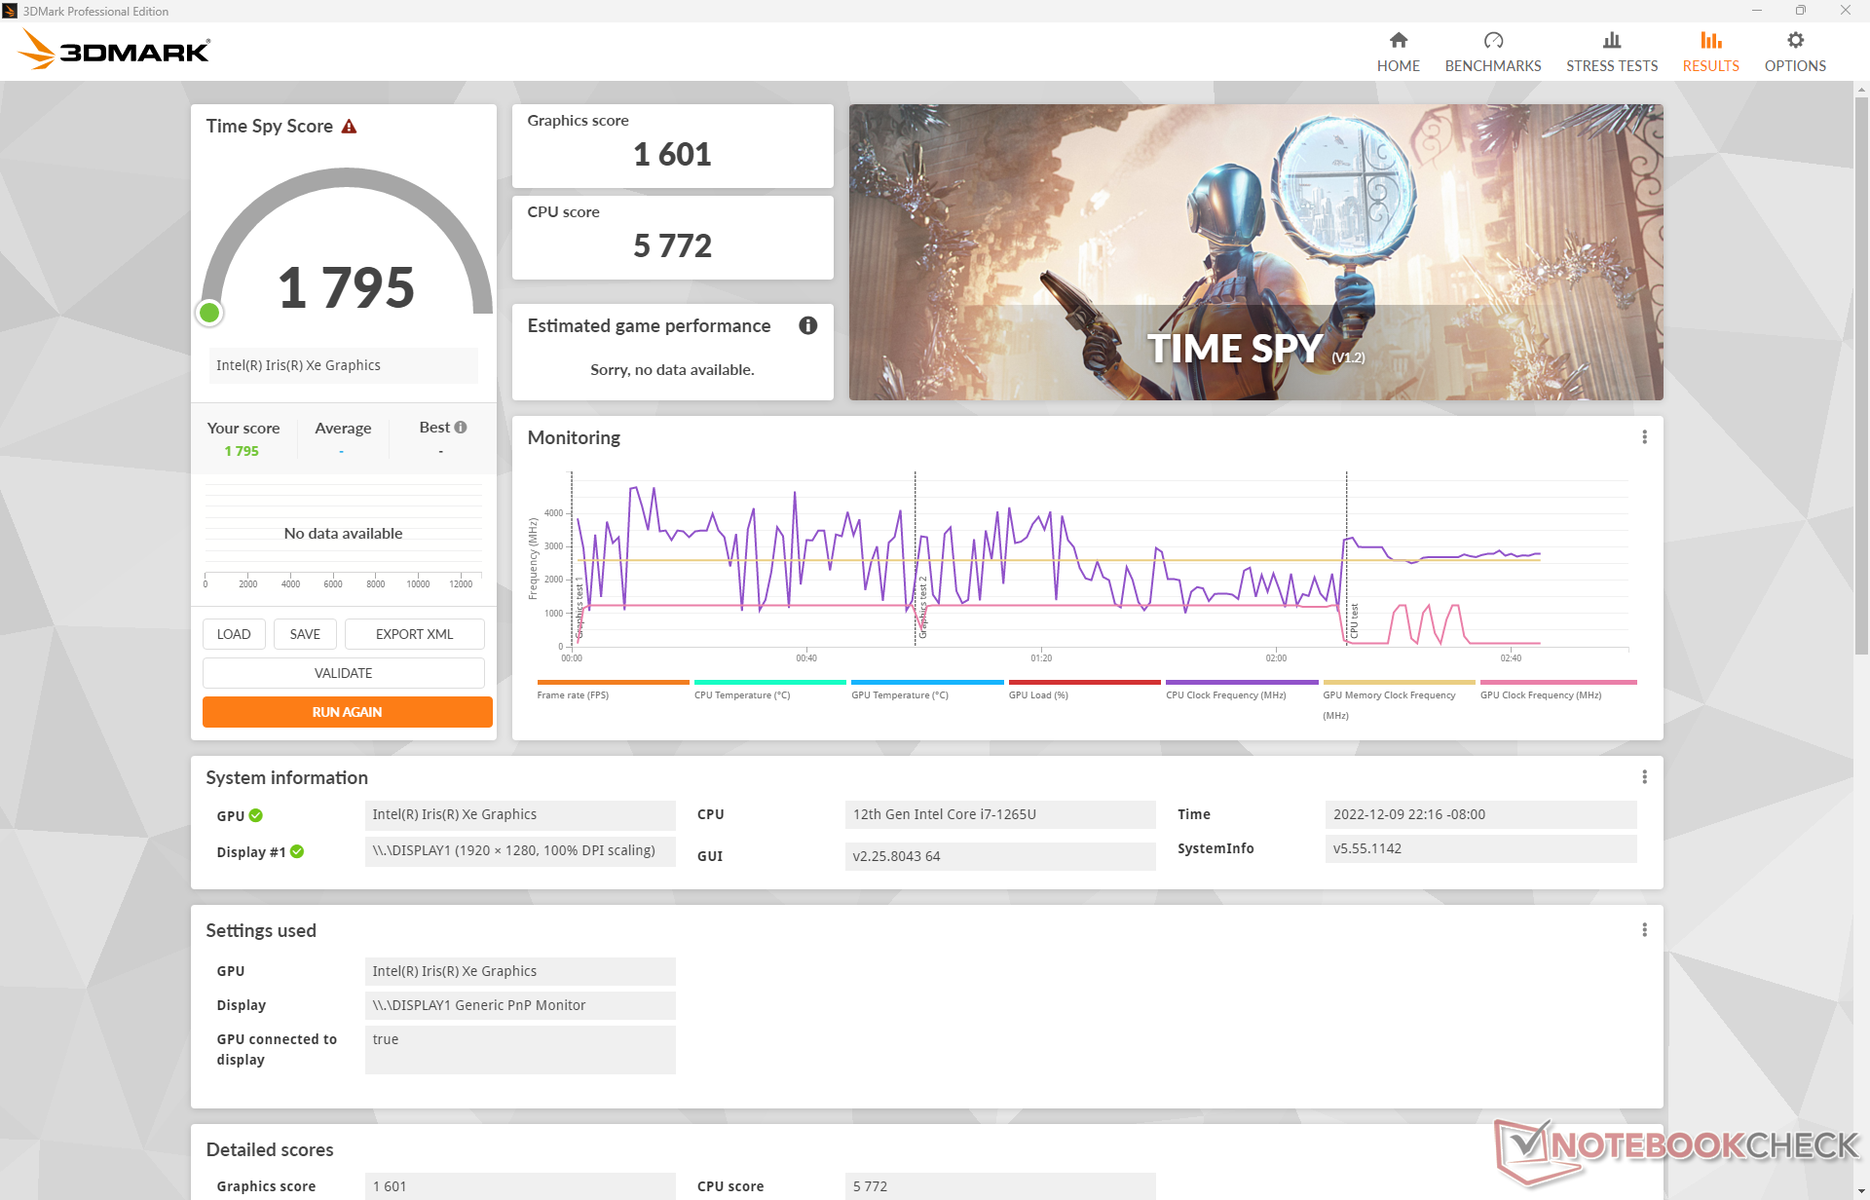
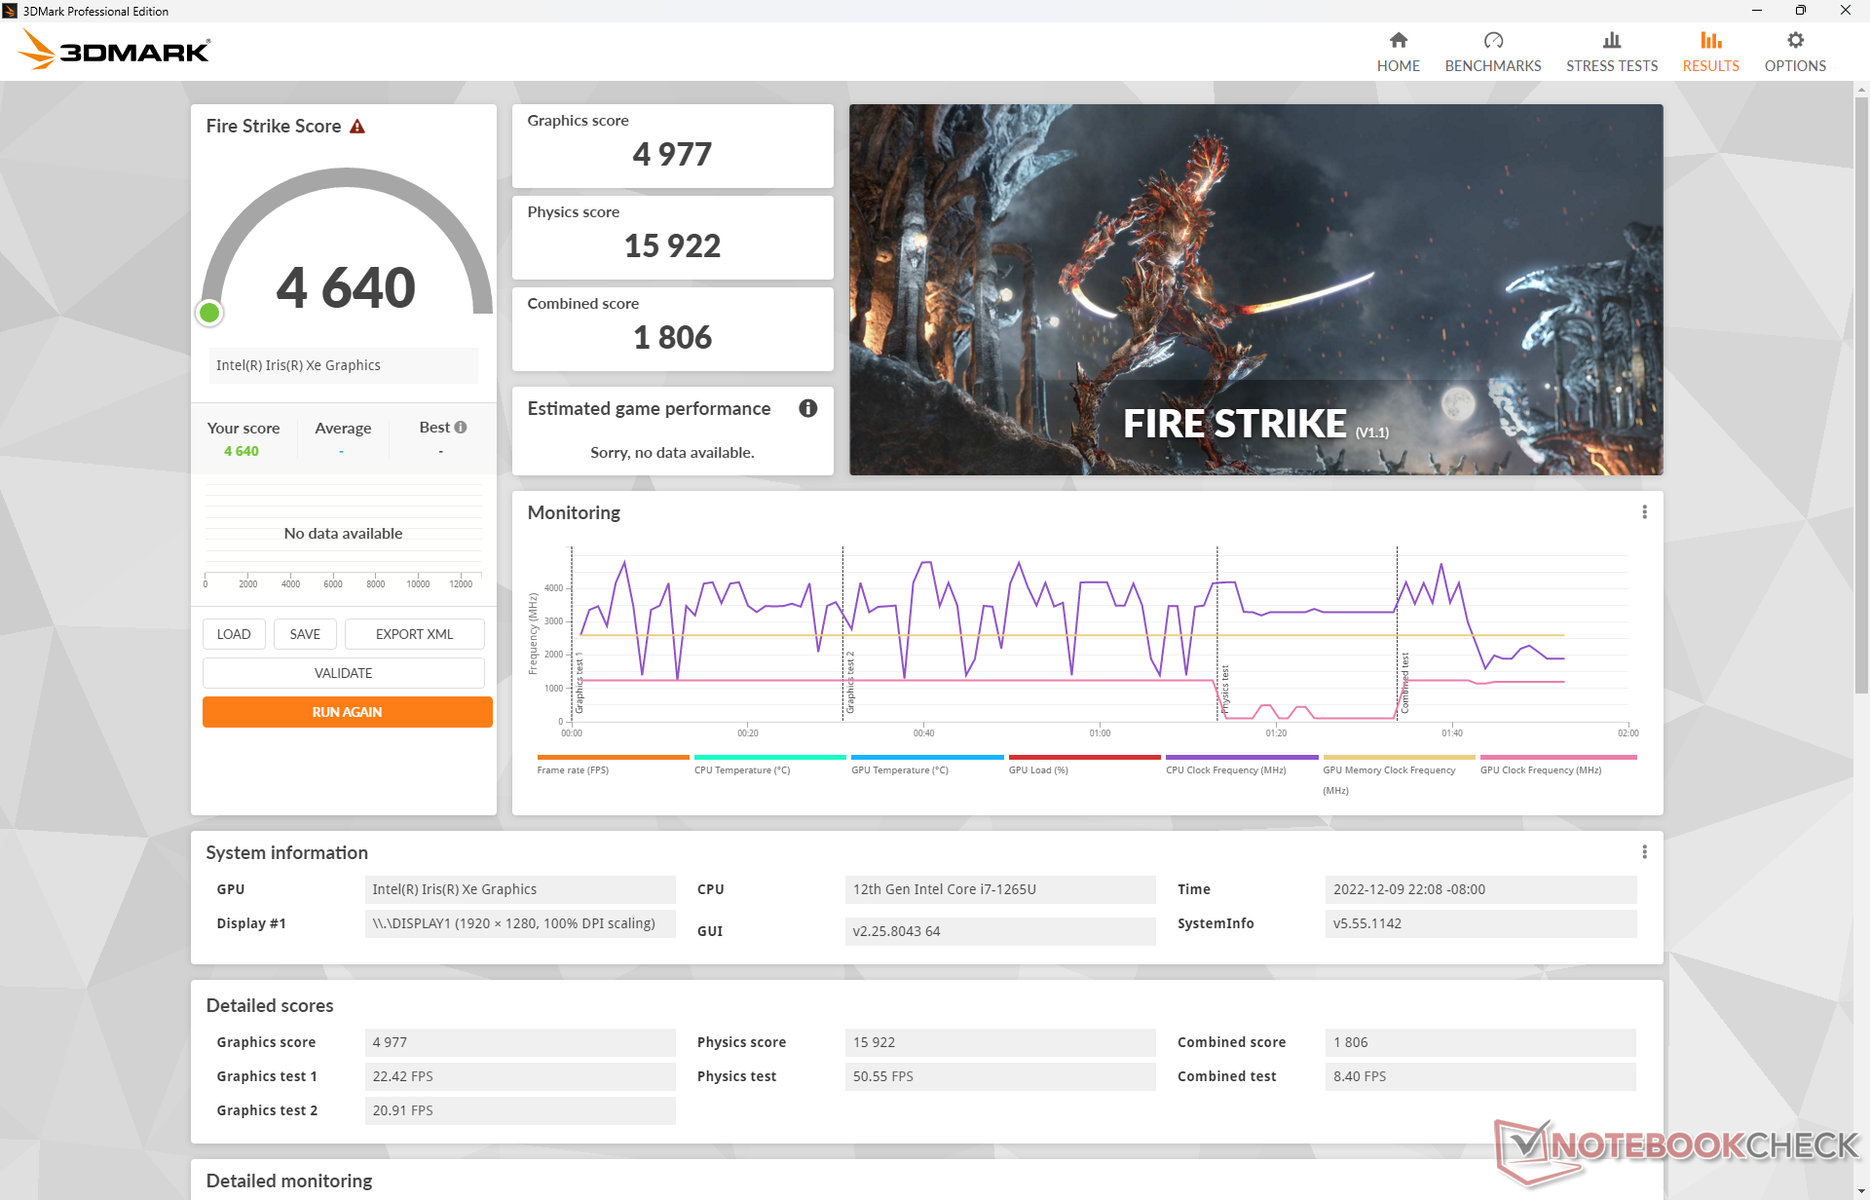
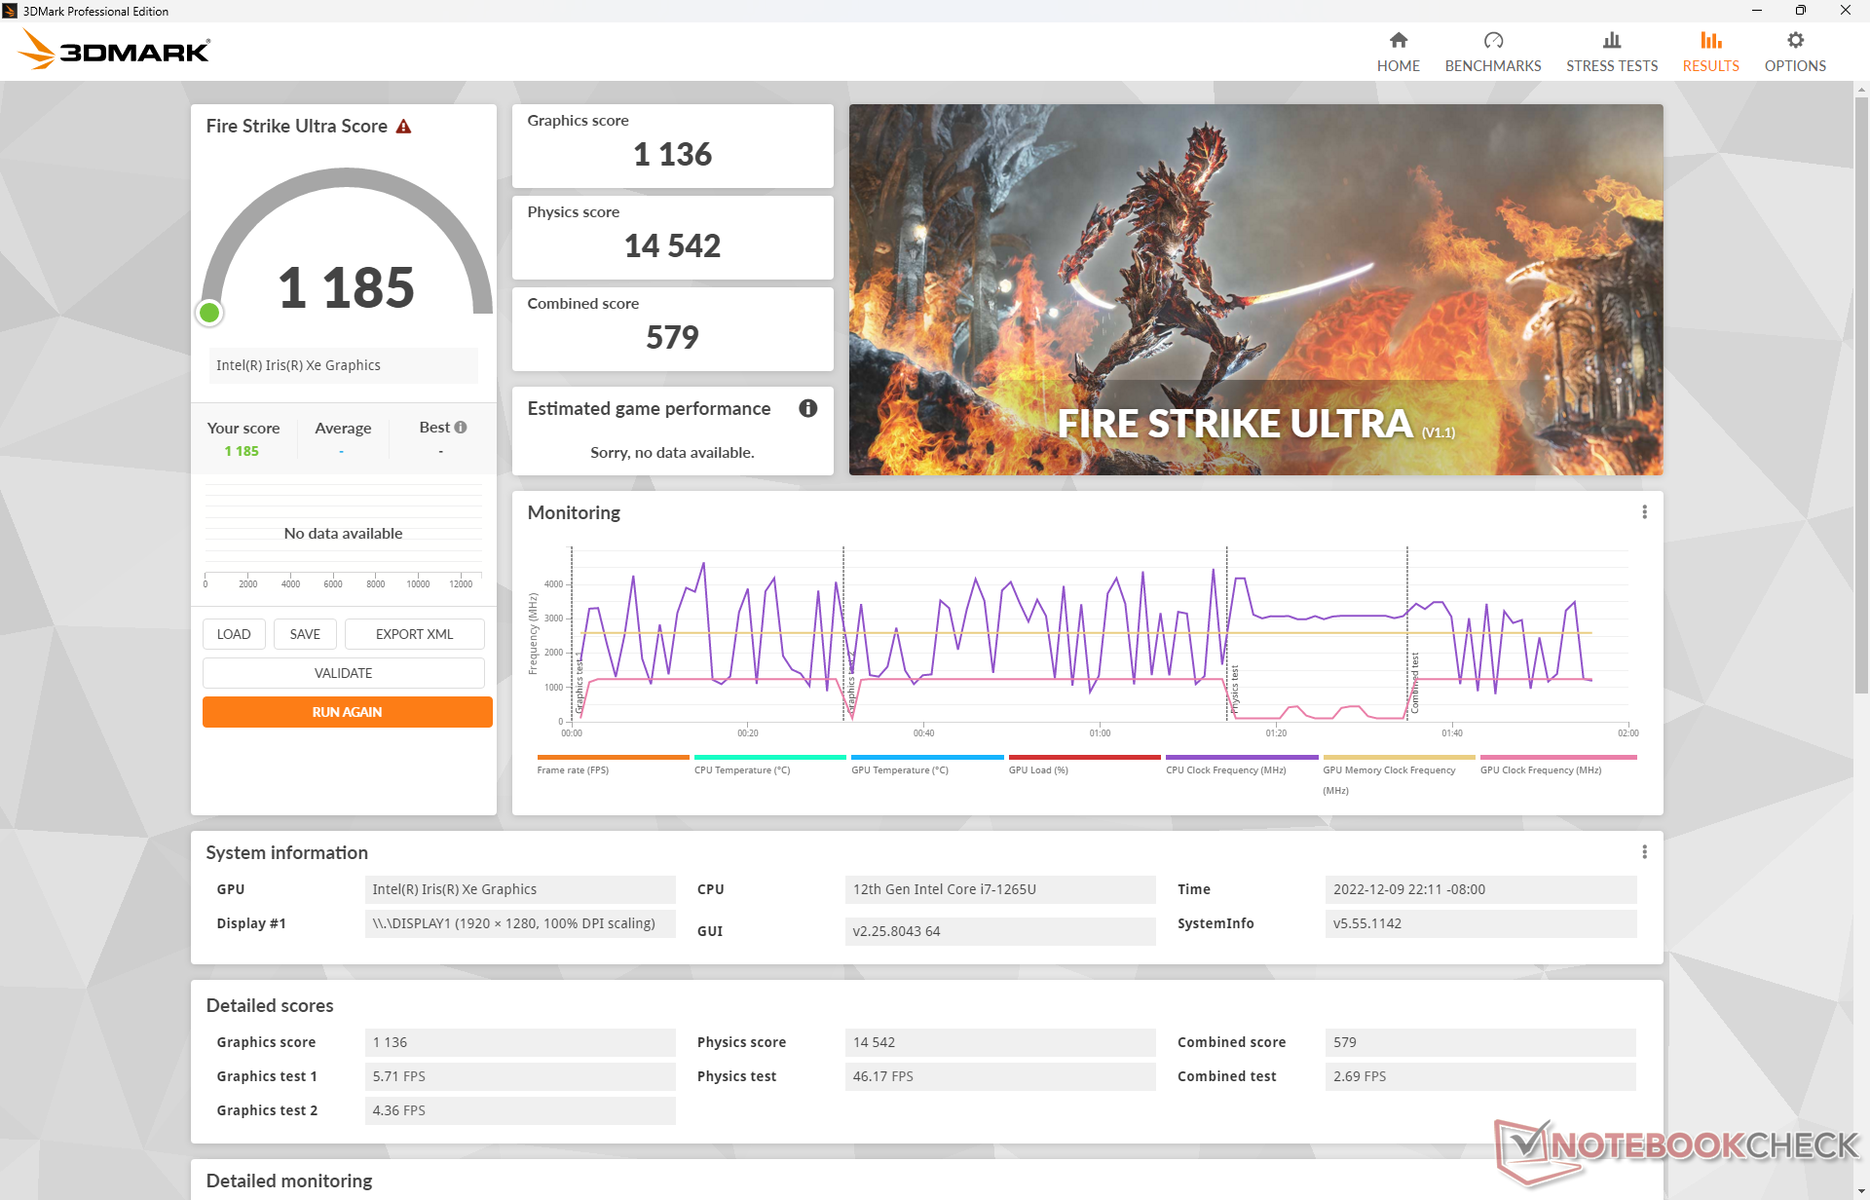
| 3DMark 11 Performance | 6578 points | |
| 3DMark Cloud Gate Standard Score | 20815 points | |
| 3DMark Fire Strike Score | 4640 points | |
| 3DMark Time Spy Score | 1795 points | |
Help | ||
| GTA V - 1920x1080 Highest Settings possible AA:4xMSAA + FX AF:16x | |
| Asus Zenbook S 13 OLED | |
| Razer Book 13 FHD | |
| Dell XPS 13 Plus 9320 i7-1280P OLED | |
| HP Elite Dragonfly G3 | |
| HP Elite Dragonfly Folio 13.5 G3 | |
| Lenovo Yoga 6 13ALC6 | |
| Dell Latitude 9330 | |
| Framework Laptop 13.5 12th Gen Intel | |
| HP Envy x360 13-bf0013dx | |
| Asus ExpertBook B5 Flip B5302FEA | |
Witcher 3 FPS Chart
| low | med. | high | ultra | |
|---|---|---|---|---|
| GTA V (2015) | 94.4 | 84.5 | 23.6 | 10.1 |
| The Witcher 3 (2015) | 89.7 | 52.9 | 32.6 | 14.5 |
| Dota 2 Reborn (2015) | 109 | 76.4 | 60.3 | 54.5 |
| Final Fantasy XV Benchmark (2018) | 42.2 | 23.1 | 16.5 | |
| X-Plane 11.11 (2018) | 48.4 | 39.5 | 35.1 | |
| Strange Brigade (2018) | 86.4 | 39.8 | 31.9 | 25.5 |
| Cyberpunk 2077 1.6 (2022) | 19.7 | 16.3 | 12.5 | 10.1 |
Emissions
System Noise — Incredibly Quiet
Fan noise is some of the quietest we've observed on any subnotebook with a Core U-series CPU. When compared to last year's Dragonfly Folio G2, the G3 model incorporates thinner fan blades and a new fan algorithm to limit pulsing behavior. The end result is pretty surprising; running 3DMark 06 several times in a loop would result in a fan noise of just under 28 dB(A) compared to 38 dB(A) or 34 dB(A) on the Latitude 7330 or ThinkPad L13 Gen 2, respectively. We're only able to record a maximum of just 33 dB(A) when running heavier loads like games.
HP has four power modes to choose from: Quiet, Cool, Balanced, and Performance. There is little reason to select the slower modes as fan noise is already very quiet even when set to Performance.
For a completely silent experience without needing to sacrifice performance, users can consider the fanless MacBook Air M2.
Noise Level
| Idle |
| 24.6 / 24.6 / 24.6 dB(A) |
| Load |
| 27.8 / 33.4 dB(A) |
 | ||
30 dB silent 40 dB(A) audible 50 dB(A) loud |
||
min: | ||
| HP Elite Dragonfly Folio 13.5 G3 Iris Xe G7 96EUs, i7-1265U, Samsung PM9A1 MZVL2512HCJQ | HP Elite Dragonfly G3 Iris Xe G7 96EUs, i7-1265U, Micron 3400 MTFDKBA512TFH 512GB | Dell Latitude 13 7330 Iris Xe G7 96EUs, i7-1265U, Toshiba KBG40ZNS512G NVMe | Framework Laptop 13.5 12th Gen Intel Iris Xe G7 96EUs, i7-1260P, WDC PC SN730 SDBPNTY-512G | Razer Book 13 FHD Iris Xe G7 96EUs, i7-1165G7, Samsung SSD PM981a MZVLB256HBHQ | Lenovo ThinkPad L13 Gen2-20VH0017GE Iris Xe G7 80EUs, i5-1135G7, Samsung SSD PM981a MZVLB512HBJQ | |
|---|---|---|---|---|---|---|
| Noise | 5% | -9% | -19% | -11% | -18% | |
| off / environment * (dB) | 24.6 | 22.8 7% | 23.4 5% | 22.8 7% | 27 -10% | 29.3 -19% |
| Idle Minimum * (dB) | 24.6 | 23.2 6% | 23.4 5% | 23 7% | 27 -10% | 29.3 -19% |
| Idle Average * (dB) | 24.6 | 23.2 6% | 23.4 5% | 23 7% | 27 -10% | 29.3 -19% |
| Idle Maximum * (dB) | 24.6 | 23.2 6% | 23.4 5% | 23 7% | 27.1 -10% | 29.3 -19% |
| Load Average * (dB) | 27.8 | 25.1 10% | 37.8 -36% | 47.3 -70% | 29 -4% | 34.3 -23% |
| Witcher 3 ultra * (dB) | 33.4 | 32 4% | 39.2 -17% | 47.3 -42% | 33.3 -0% | |
| Load Maximum * (dB) | 33.4 | 35.2 -5% | 43 -29% | 49.8 -49% | 44.8 -34% | 36.3 -9% |
* ... smaller is better
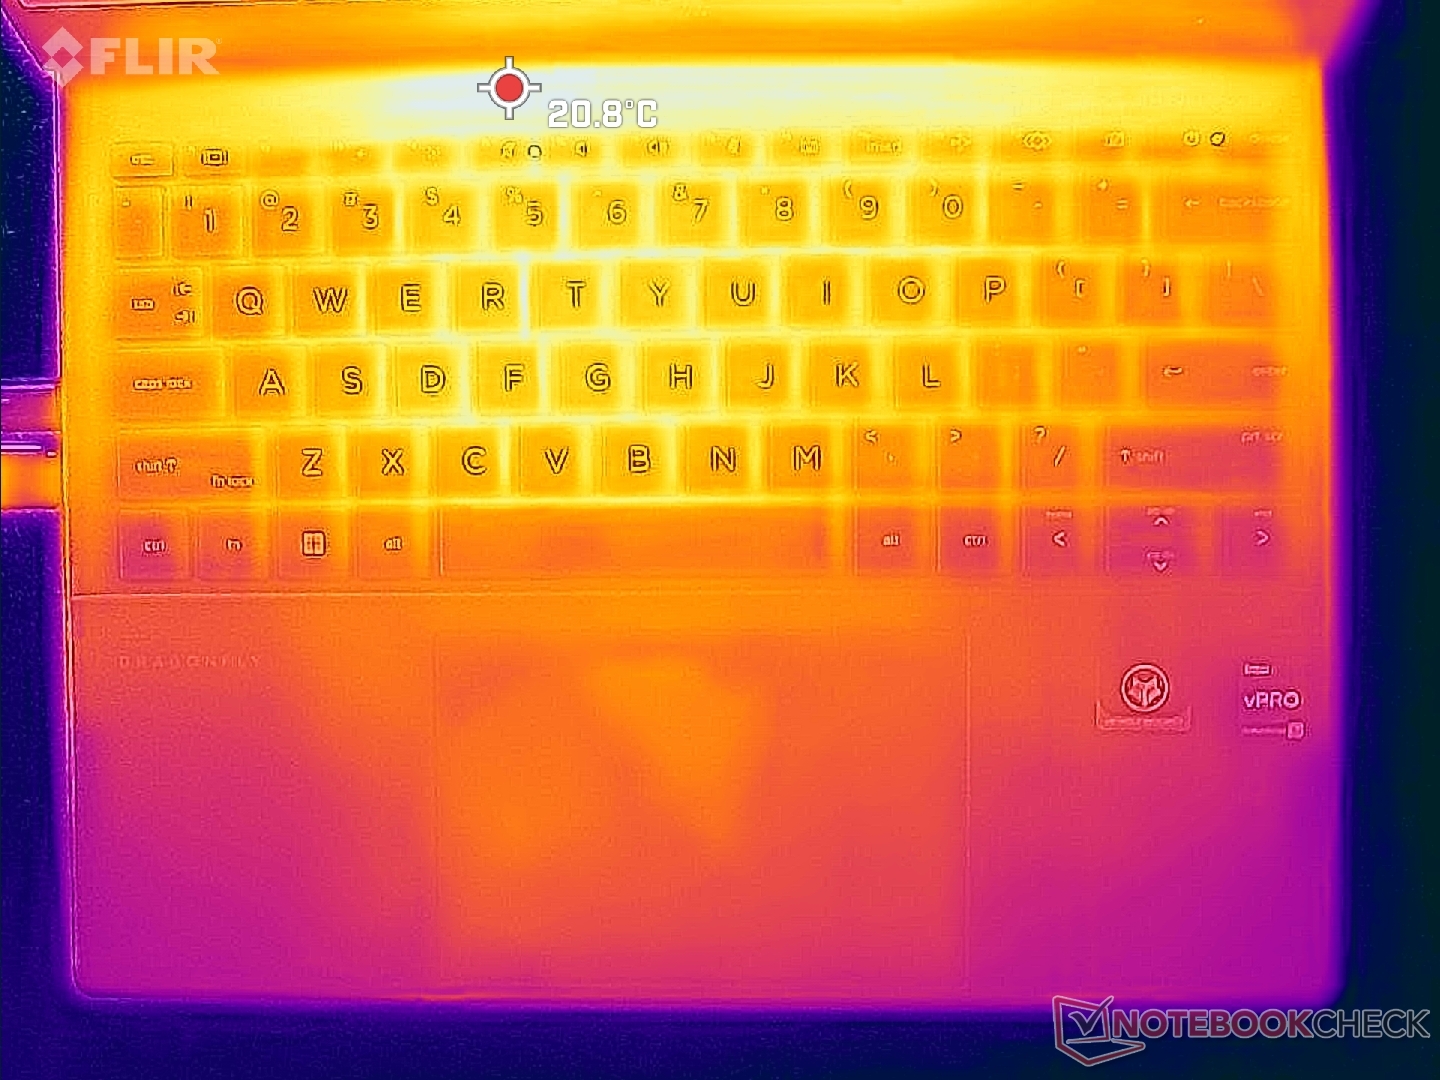
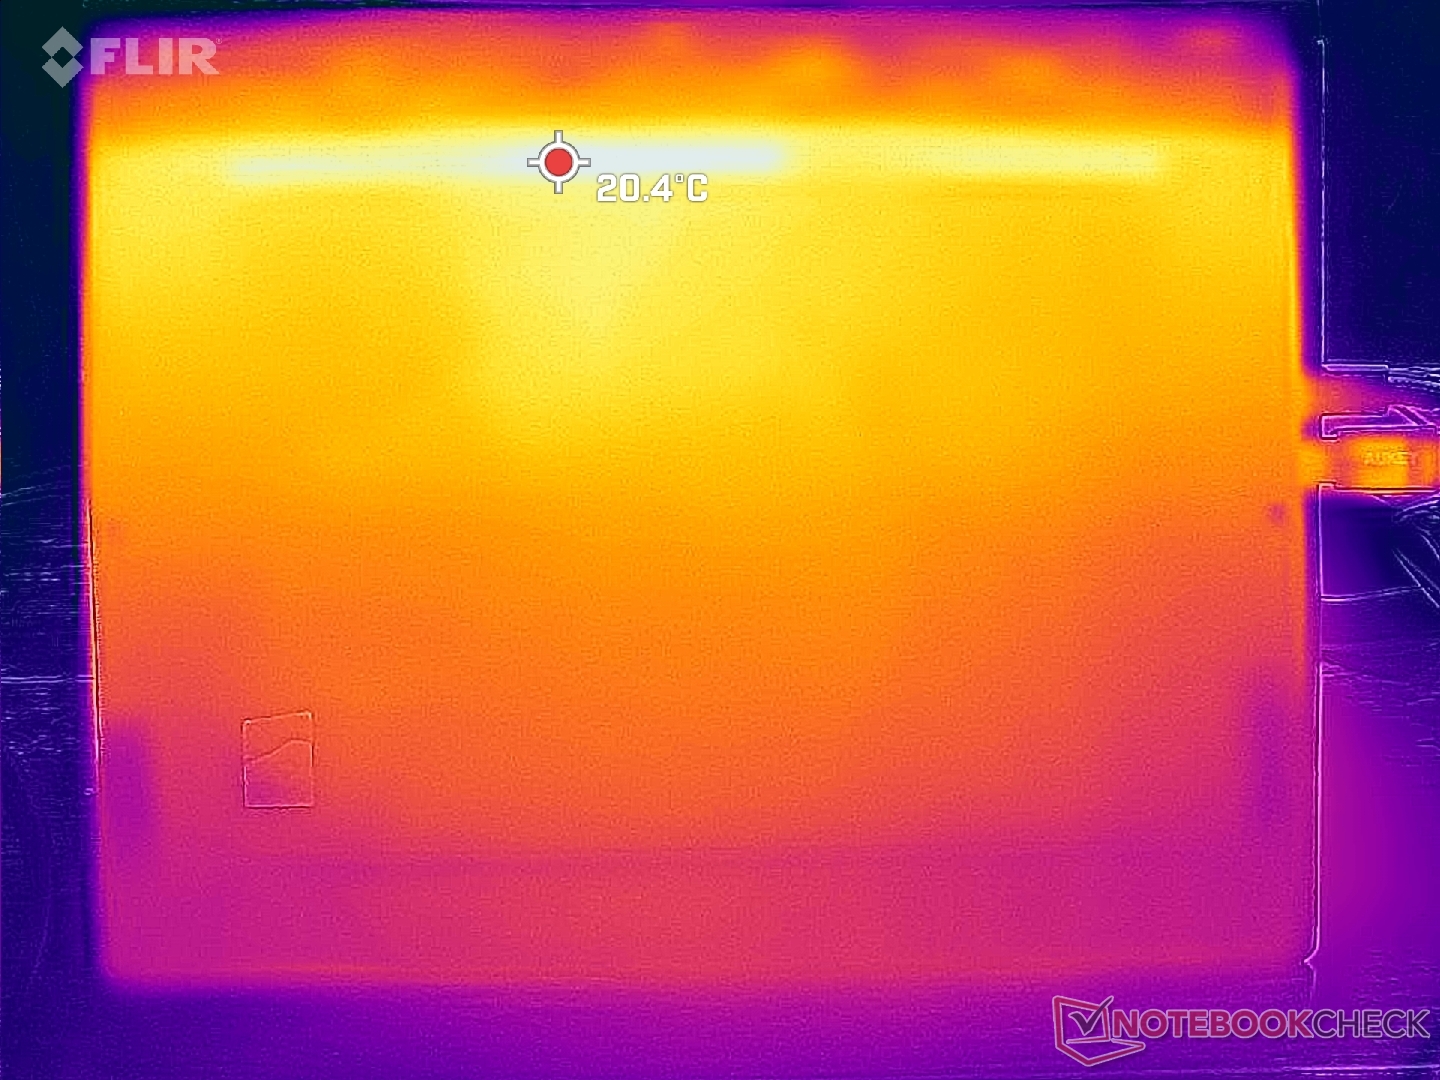
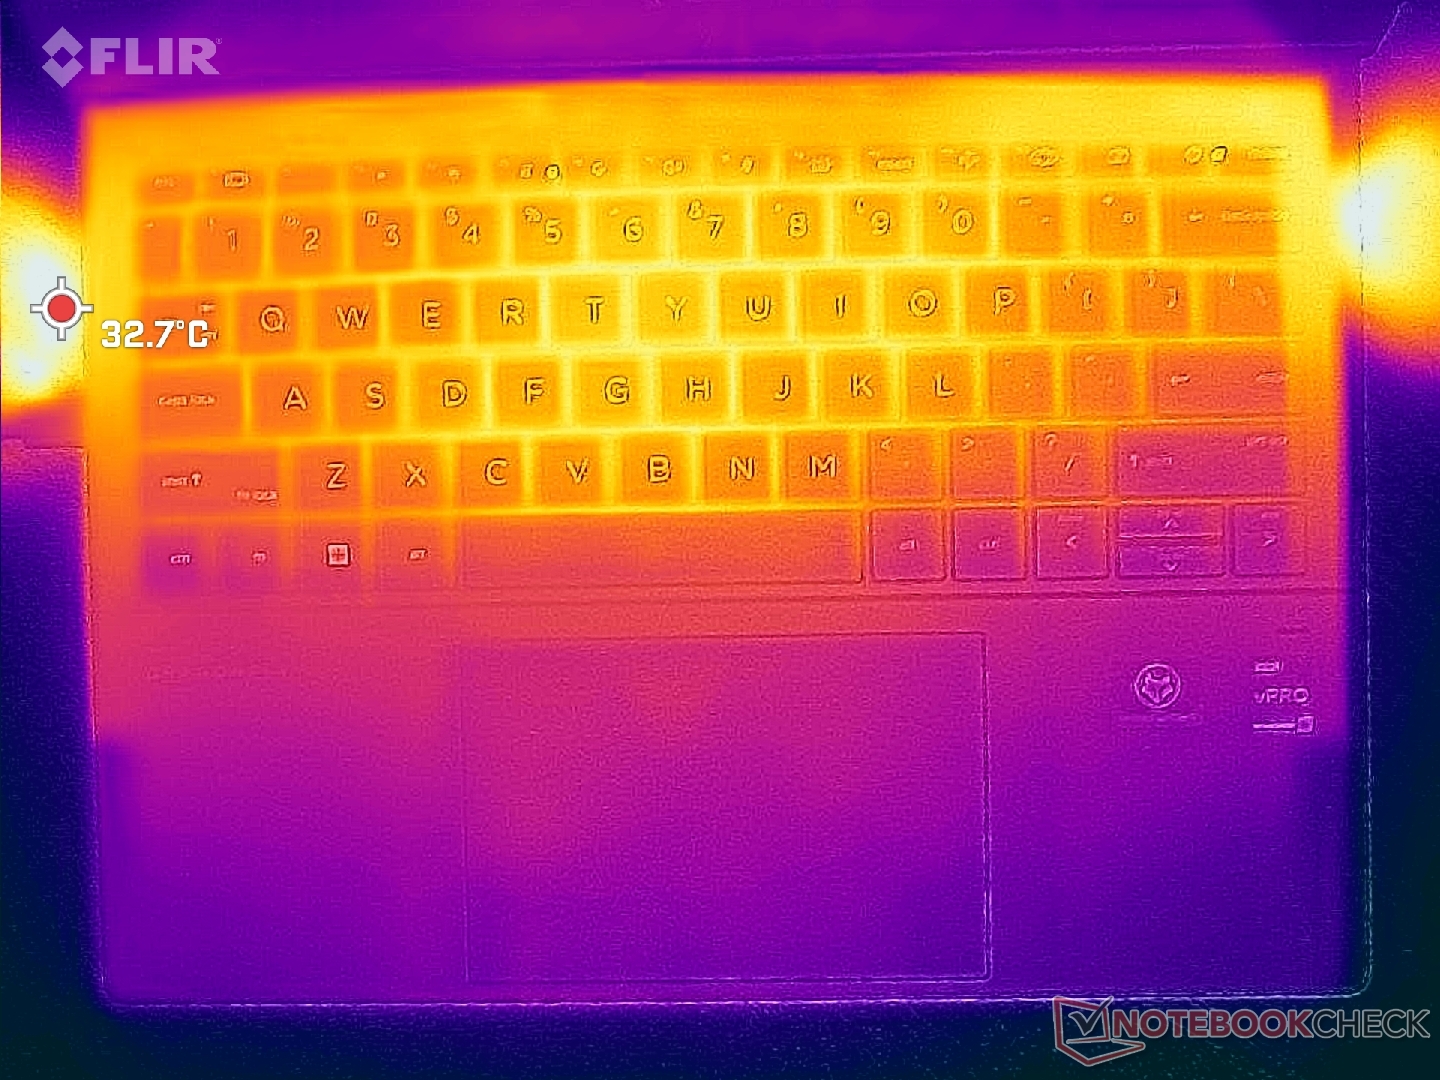
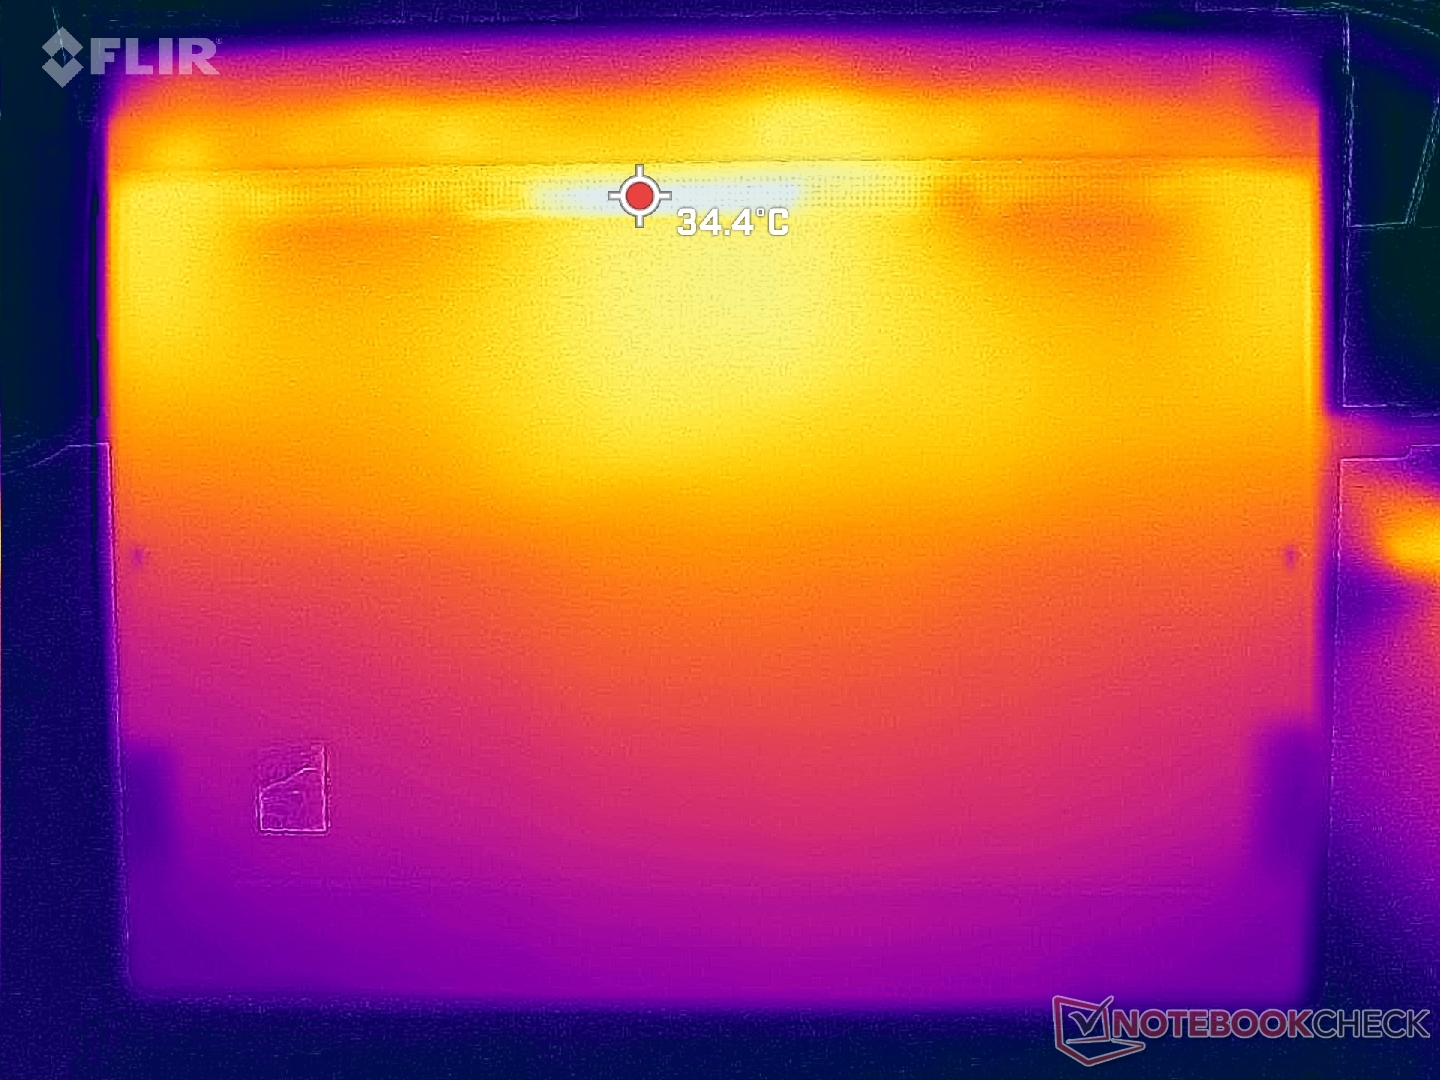
Temperature
Surface temperatures are cooler than expected even when running demanding loads. Hot spots top out at just 33 C and 34 C on the top and bottom, respectively, compared to 37 C or 39 C on the Dragonfly G3 or Dell Latitude 13 7330, respectively. The Dragonfly Folio G3 utilizes more fans than on the Dell and longer heat pipes than on the Dragonfly G3 for improved cooling potential. The lower surface temperatures can also be attributed to the lower core temperatures as detailed in the next section.
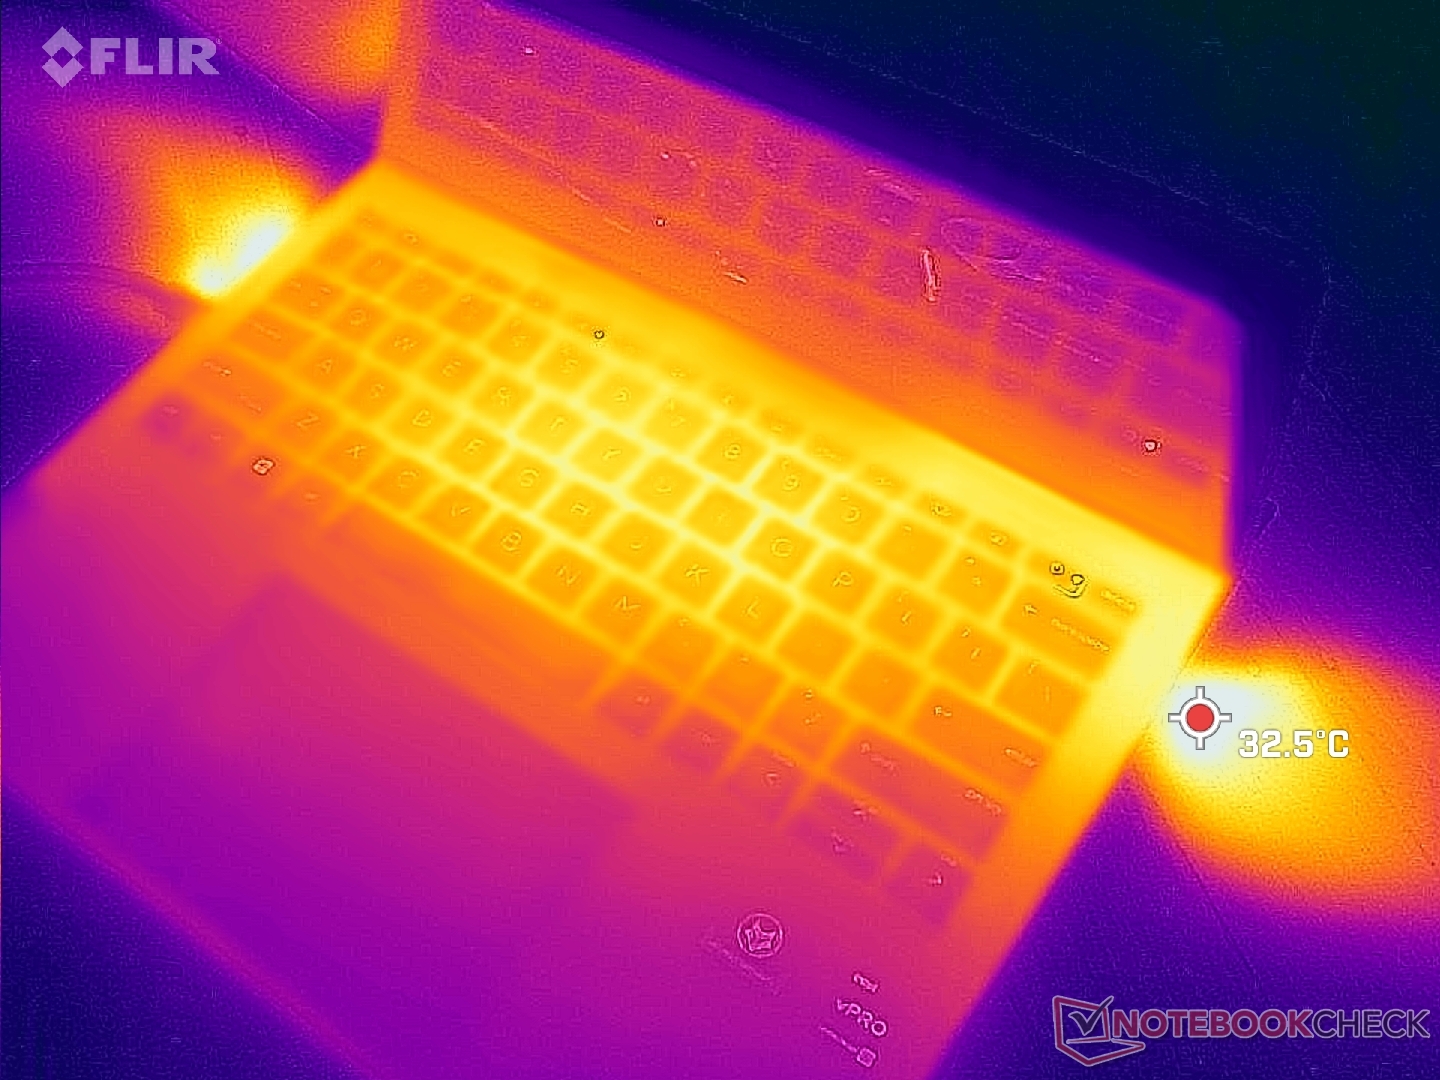
(+) The maximum temperature on the upper side is 32.8 °C / 91 F, compared to the average of 35.4 °C / 96 F, ranging from 19.6 to 60 °C for the class Convertible.
(+) The bottom heats up to a maximum of 33.4 °C / 92 F, compared to the average of 36.8 °C / 98 F
(+) In idle usage, the average temperature for the upper side is 22.2 °C / 72 F, compared to the device average of 30.3 °C / 87 F.
(+) The palmrests and touchpad are cooler than skin temperature with a maximum of 22.4 °C / 72.3 F and are therefore cool to the touch.
(+) The average temperature of the palmrest area of similar devices was 27.9 °C / 82.2 F (+5.5 °C / 9.9 F).
| HP Elite Dragonfly Folio 13.5 G3 Intel Core i7-1265U, Intel Iris Xe Graphics G7 96EUs | HP Elite Dragonfly G3 Intel Core i7-1265U, Intel Iris Xe Graphics G7 96EUs | Dell Latitude 13 7330 Intel Core i7-1265U, Intel Iris Xe Graphics G7 96EUs | Framework Laptop 13.5 12th Gen Intel Intel Core i7-1260P, Intel Iris Xe Graphics G7 96EUs | Razer Book 13 FHD Intel Core i7-1165G7, Intel Iris Xe Graphics G7 96EUs | Lenovo ThinkPad L13 Gen2-20VH0017GE Intel Core i5-1135G7, Intel Iris Xe Graphics G7 80EUs | |
|---|---|---|---|---|---|---|
| Heat | -17% | -10% | -14% | -14% | -32% | |
| Maximum Upper Side * (°C) | 32.8 | 39 -19% | 38.6 -18% | 36.8 -12% | 39.2 -20% | 43.3 -32% |
| Maximum Bottom * (°C) | 33.4 | 42.2 -26% | 42 -26% | 42.4 -27% | 44 -32% | 58 -74% |
| Idle Upper Side * (°C) | 24.6 | 26.8 -9% | 23.8 3% | 24.2 2% | 23 7% | 25.6 -4% |
| Idle Bottom * (°C) | 24.6 | 28.2 -15% | 24.6 -0% | 29 -18% | 26.8 -9% | 28.8 -17% |
* ... smaller is better
Stress Test
When running Prime95, the CPU would boost to 3.5 GHz and 49 W for just the first few seconds until hitting a core temperature of 69 C. Thereafter, clock rates and power draw would drop to just 2.3 GHz and 20 W, respectively, in order to maintain a core temperature of just 60 C. Most other laptops typically have much higher core temperature ceilings and so the low 60 C range is unexpected. The Core i7-1265U in the Latitude 7330, for example, can reach 85 C and 2.5 GHz when running the same Prime95 test.
GPU clock rate and temperature when running Witcher 3 would stabilize at 1100 MHz and 58 C, respectively, compared to 1247 MHz and 83 C on the Latitude 7330.
Performance is throttled slightly if running on battery power. 3DMark 11 on batteries would return Physics and Graphics scores of 10407 and 5888 points, respectively, compared to 11716 and 6116 points when on mains.
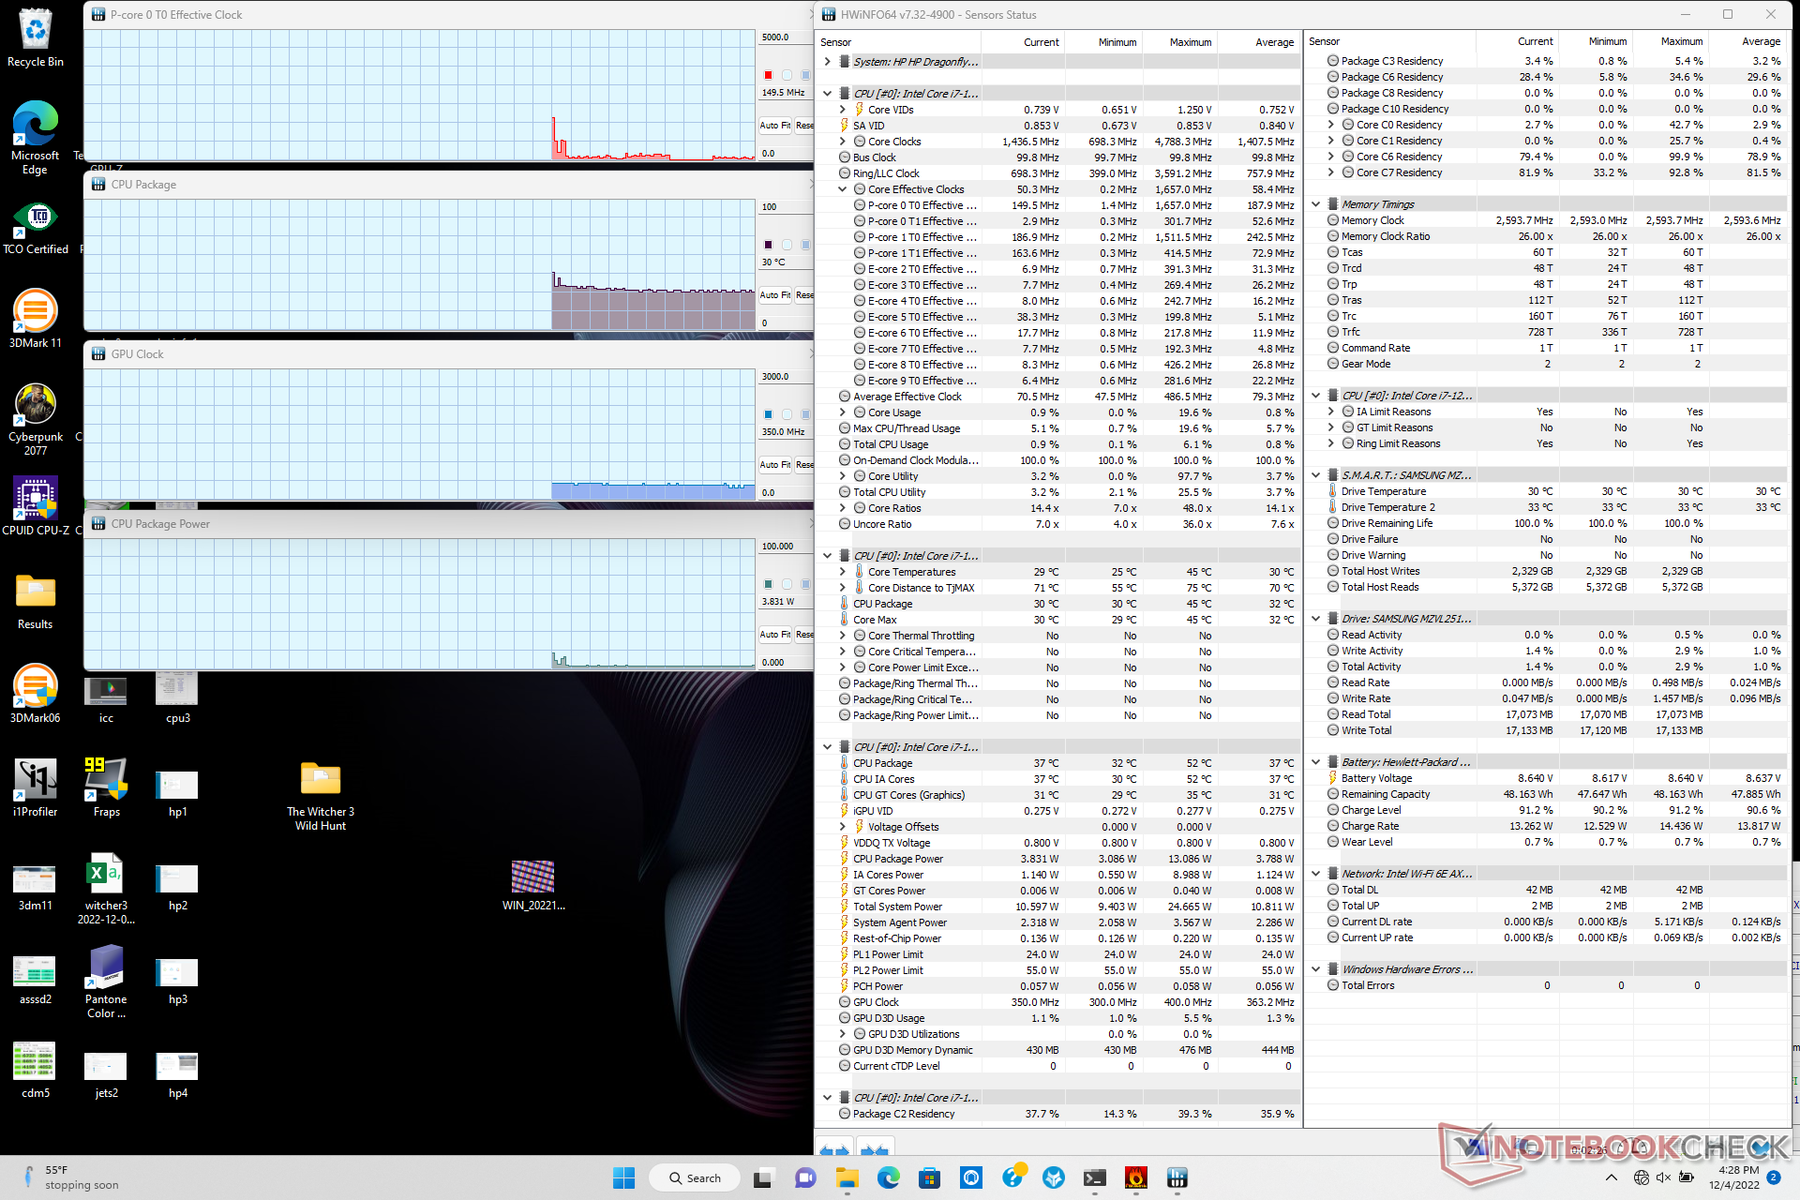
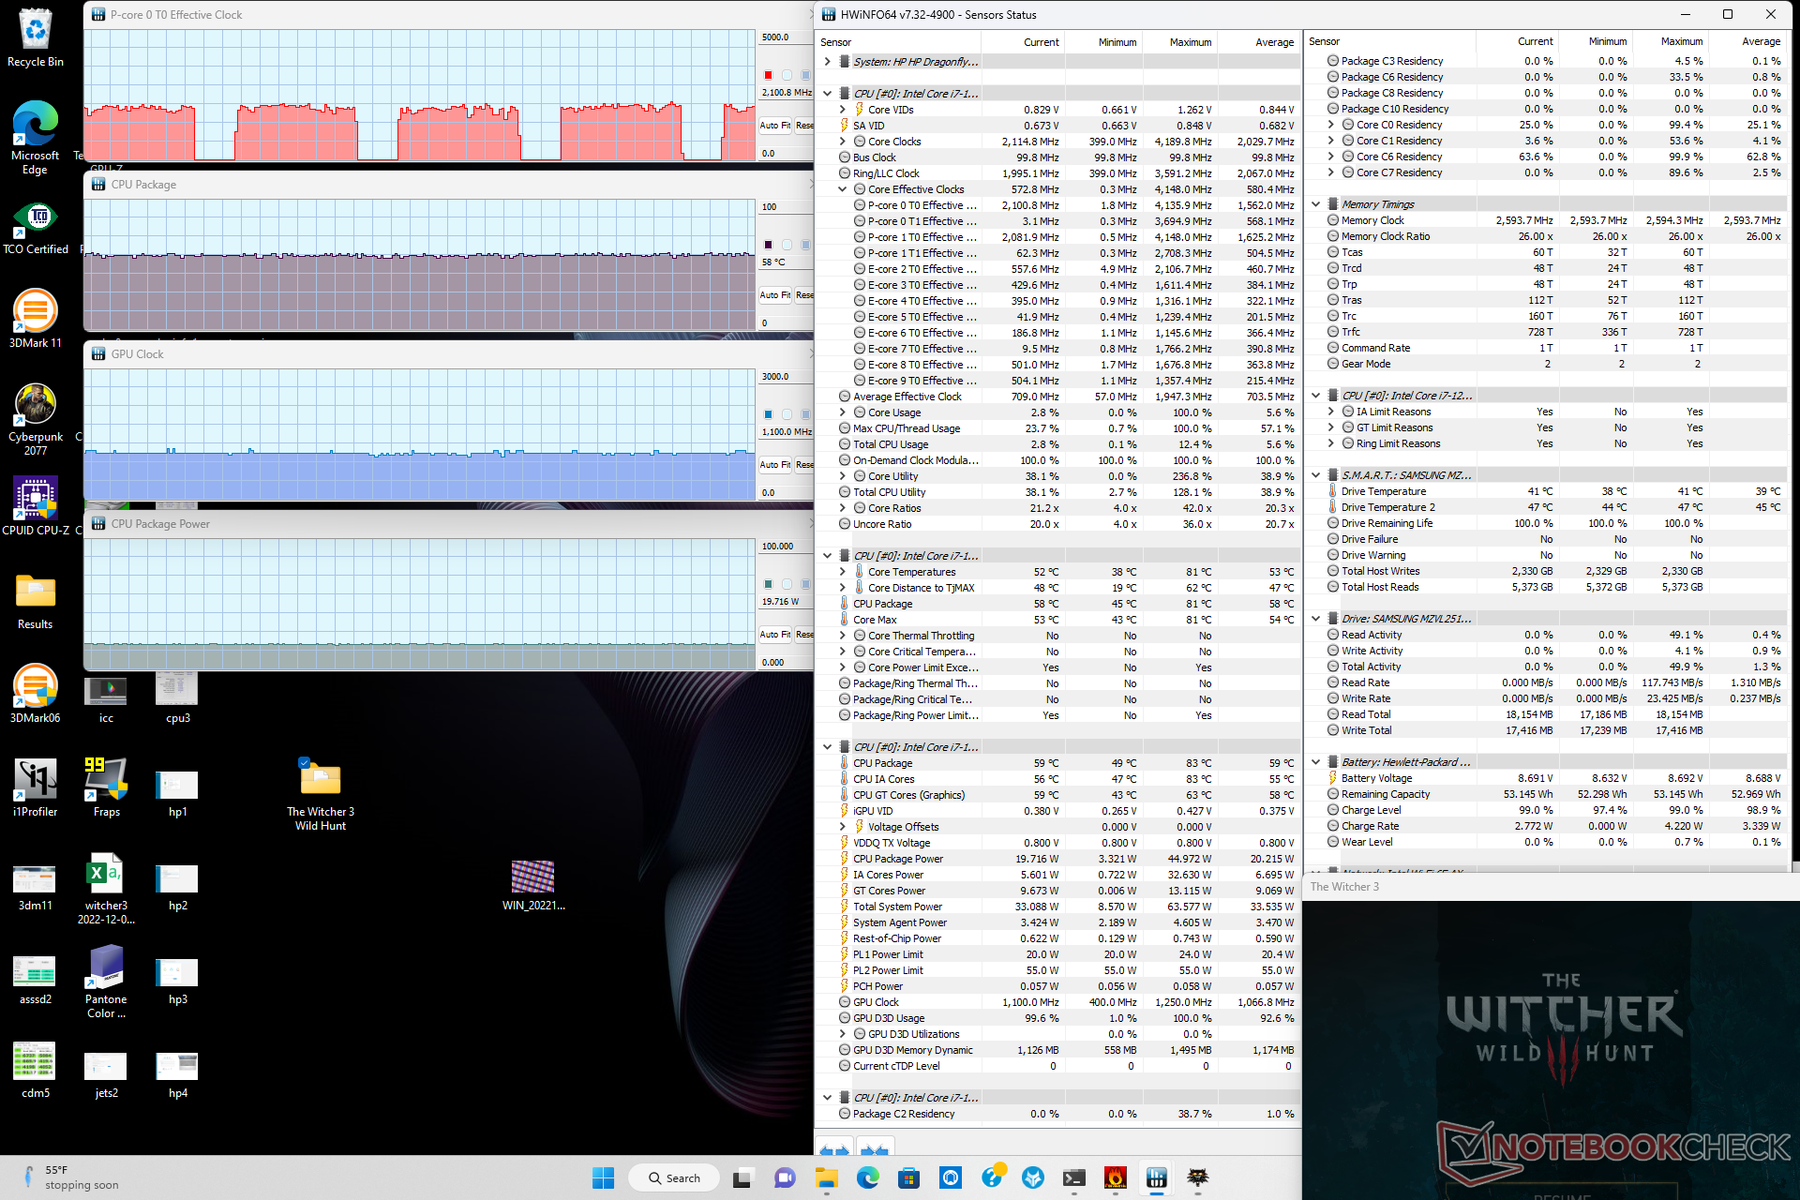
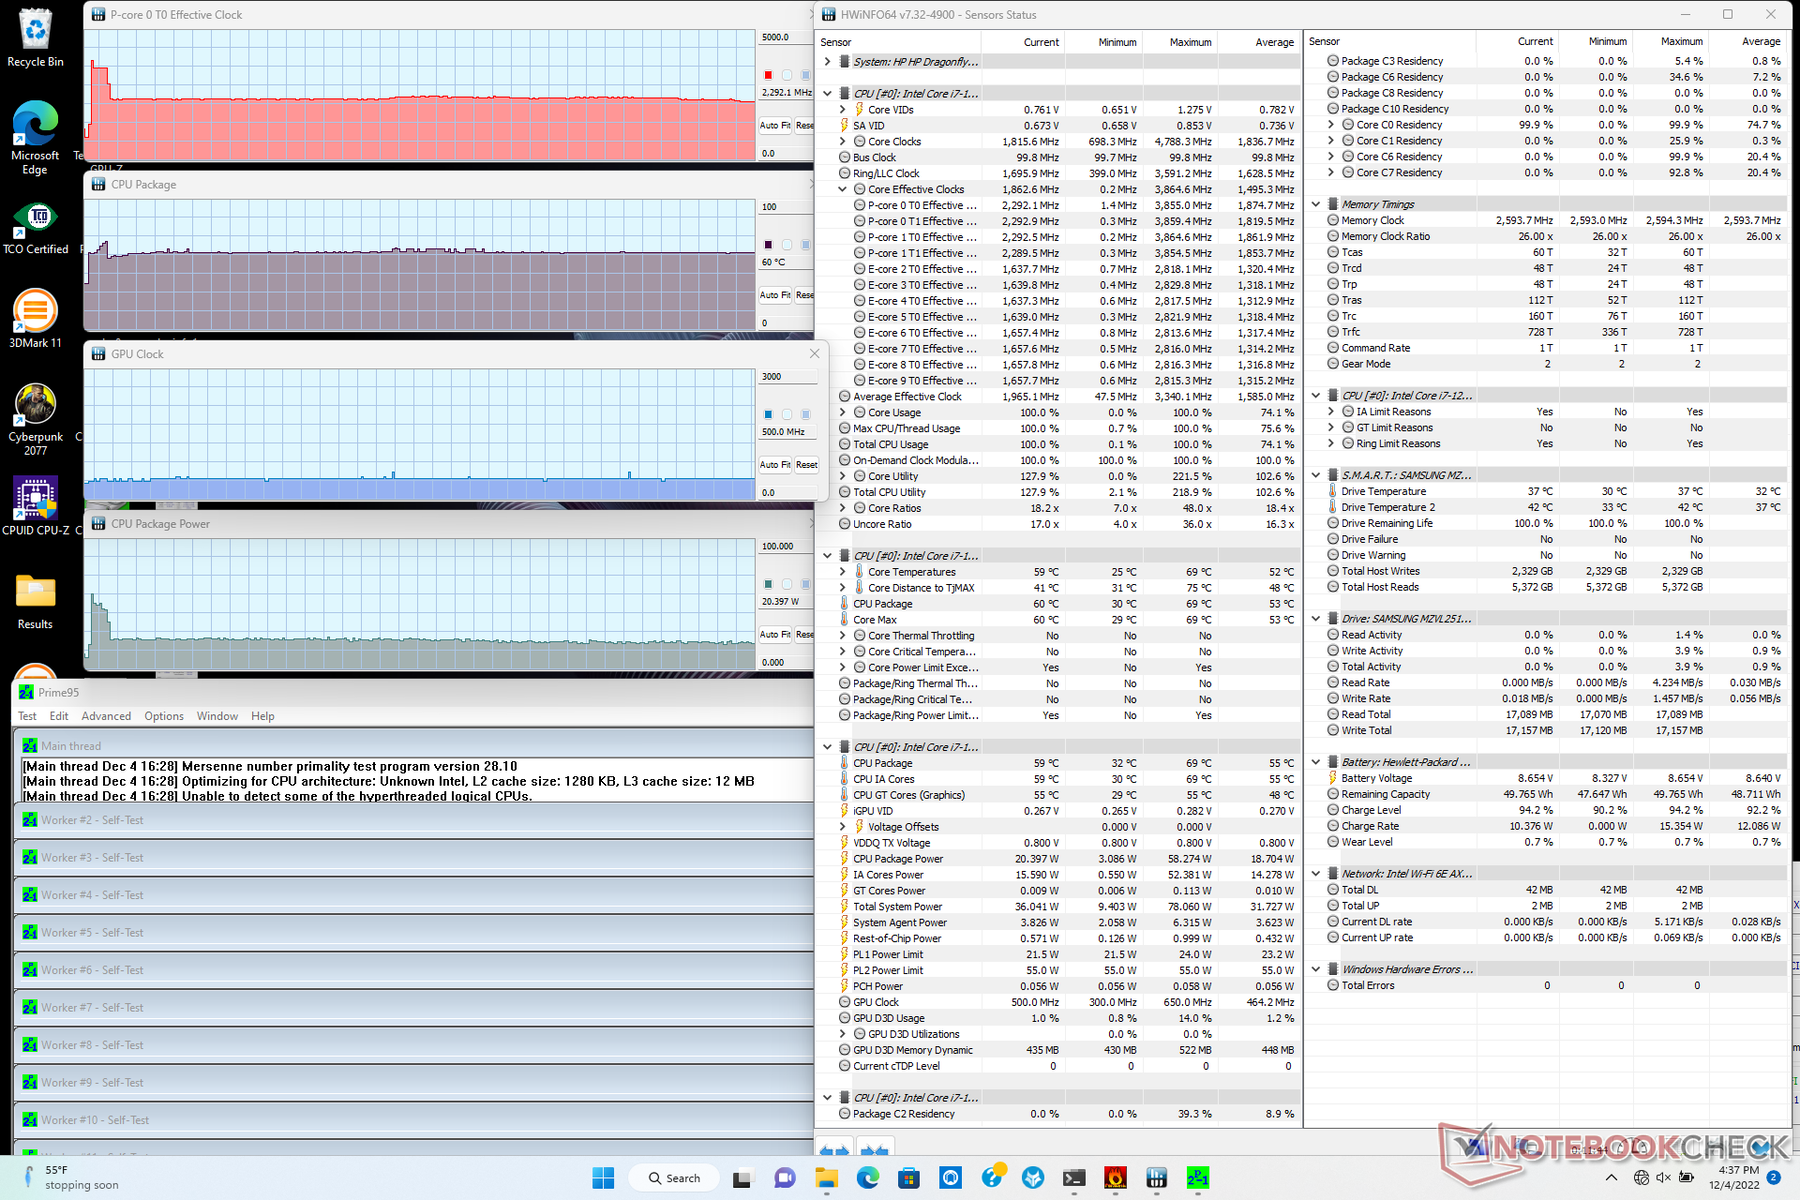
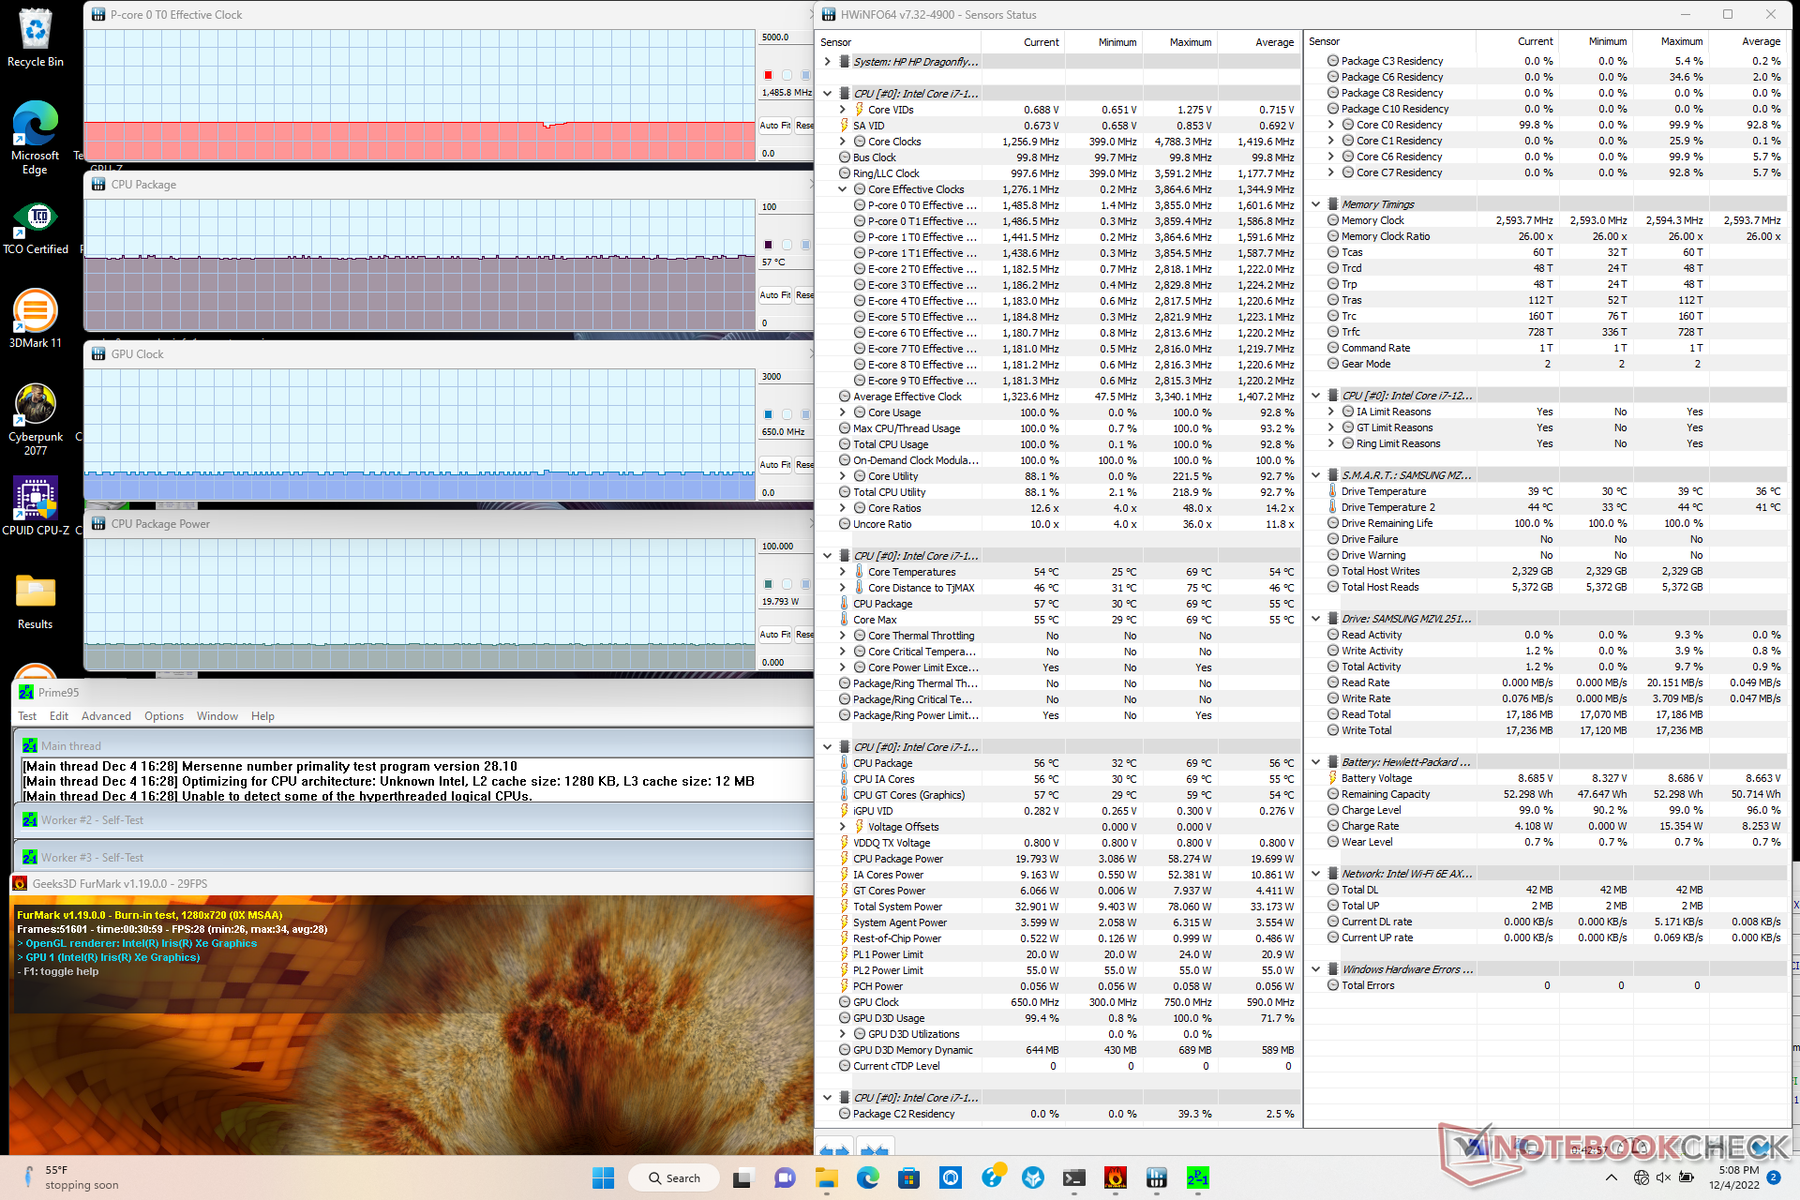
| CPU Clock (GHz) | GPU Clock (MHz) | Average CPU Temperature (°C) | |
| System Idle | -- | -- | 30 |
| Prime95 Stress | 2.3 | -- | 60 |
| Prime95 + FurMark Stress | 1.5 | 650 | 57 |
| Witcher 3 Stress | 2.1 | 1100 | 58 |
Speakers
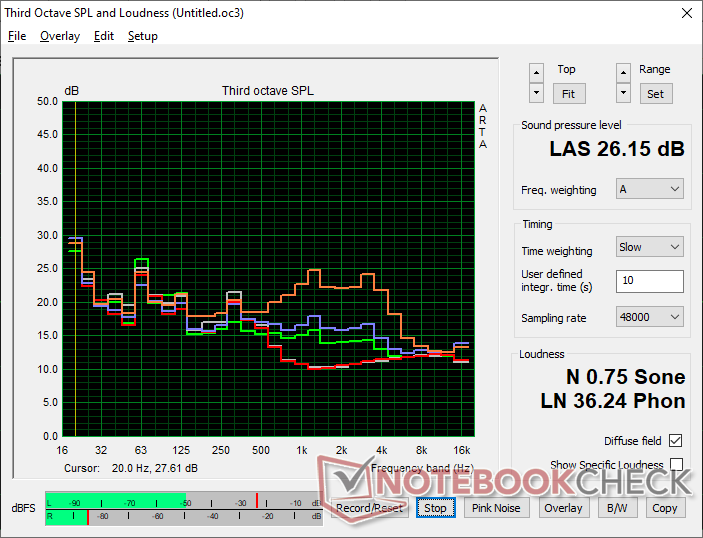
The quad speakers are of excellent quality despite the small form factor. Our microphone measurements reveal them to be very loud at almost 89 dB(A) and with a broad pink noise curve for a wide playback range. The speakers work well for both video calls and multimedia content as a result.
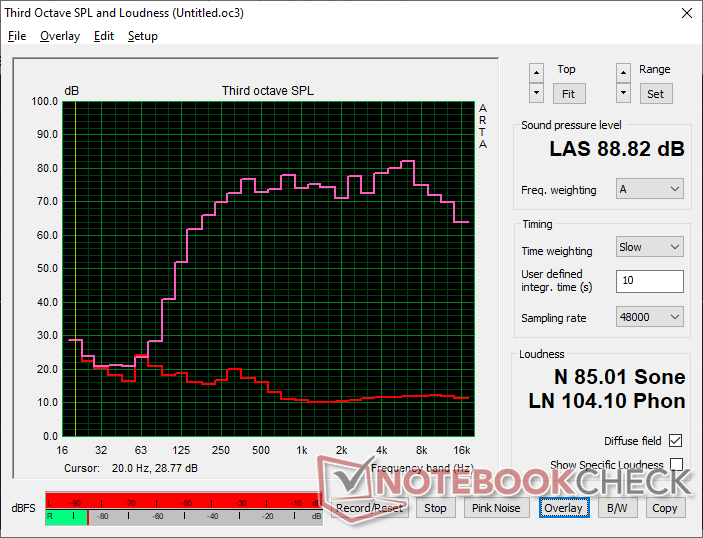
HP Elite Dragonfly Folio 13.5 G3 audio analysis
(+) | speakers can play relatively loud (88.8 dB)
Bass 100 - 315 Hz
(±) | reduced bass - on average 13.2% lower than median
(±) | linearity of bass is average (11.9% delta to prev. frequency)
Mids 400 - 2000 Hz
(+) | balanced mids - only 1.7% away from median
(+) | mids are linear (4.5% delta to prev. frequency)
Highs 2 - 16 kHz
(+) | balanced highs - only 4% away from median
(±) | linearity of highs is average (7.3% delta to prev. frequency)
Overall 100 - 16.000 Hz
(+) | overall sound is linear (10.4% difference to median)
Compared to same class
» 6% of all tested devices in this class were better, 2% similar, 92% worse
» The best had a delta of 6%, average was 20%, worst was 57%
Compared to all devices tested
» 5% of all tested devices were better, 1% similar, 94% worse
» The best had a delta of 4%, average was 24%, worst was 134%
Apple MacBook Pro 16 2021 M1 Pro audio analysis
(+) | speakers can play relatively loud (84.7 dB)
Bass 100 - 315 Hz
(+) | good bass - only 3.8% away from median
(+) | bass is linear (5.2% delta to prev. frequency)
Mids 400 - 2000 Hz
(+) | balanced mids - only 1.3% away from median
(+) | mids are linear (2.1% delta to prev. frequency)
Highs 2 - 16 kHz
(+) | balanced highs - only 1.9% away from median
(+) | highs are linear (2.7% delta to prev. frequency)
Overall 100 - 16.000 Hz
(+) | overall sound is linear (4.6% difference to median)
Compared to same class
» 0% of all tested devices in this class were better, 0% similar, 100% worse
» The best had a delta of 5%, average was 18%, worst was 45%
Compared to all devices tested
» 0% of all tested devices were better, 0% similar, 100% worse
» The best had a delta of 4%, average was 24%, worst was 134%
Energy Management
Power Consumption
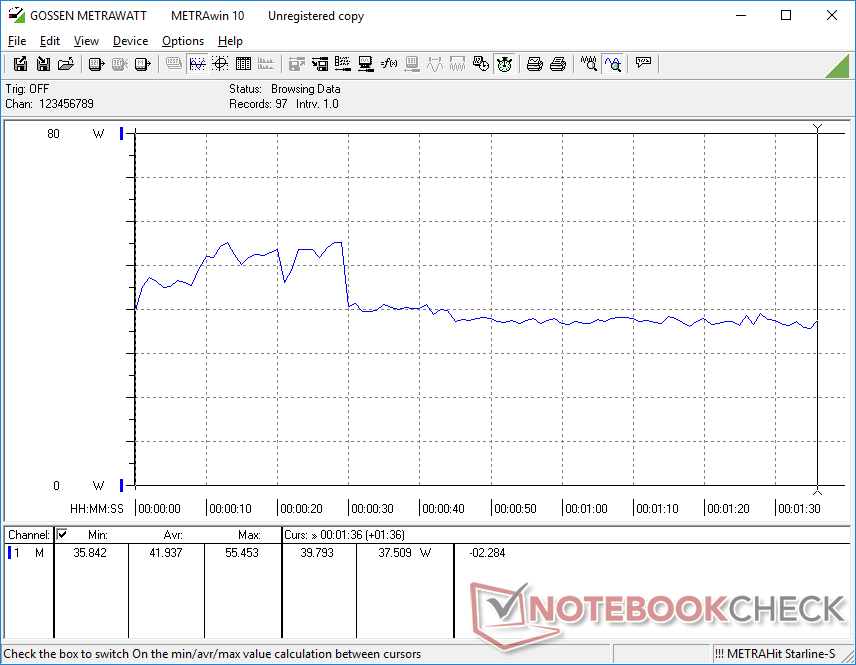
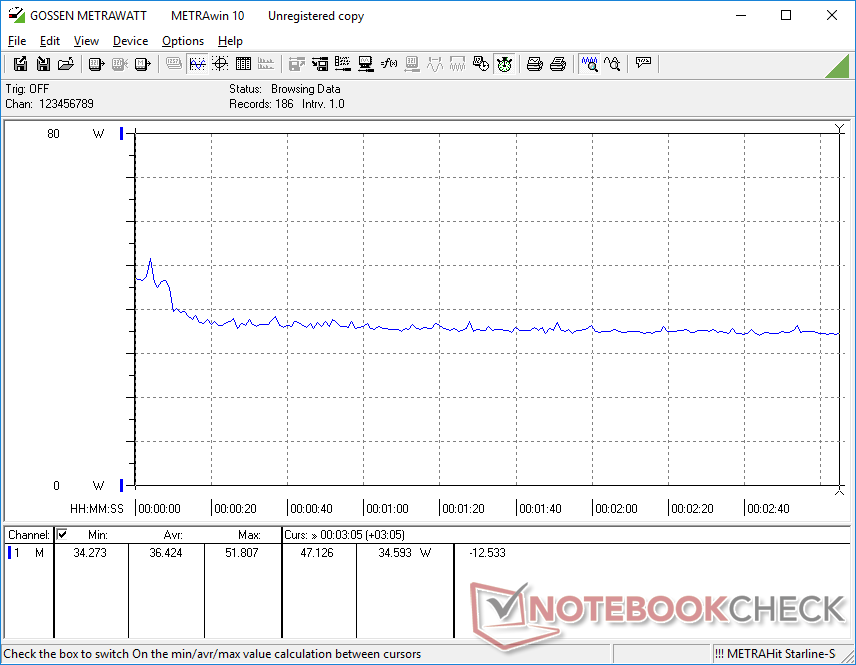
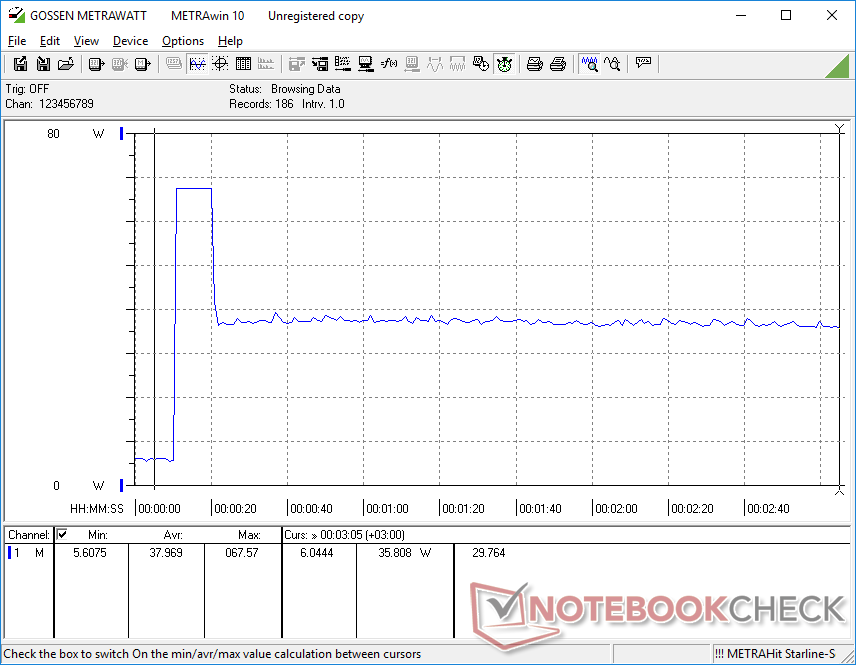
Power consumption levels are nearly identical across the board to what we recorded on the Dragonfly G3 since they both share the same panels and processors. Note that the 1000-nit SKU will likely consume more power if on the maximum brightness setting.
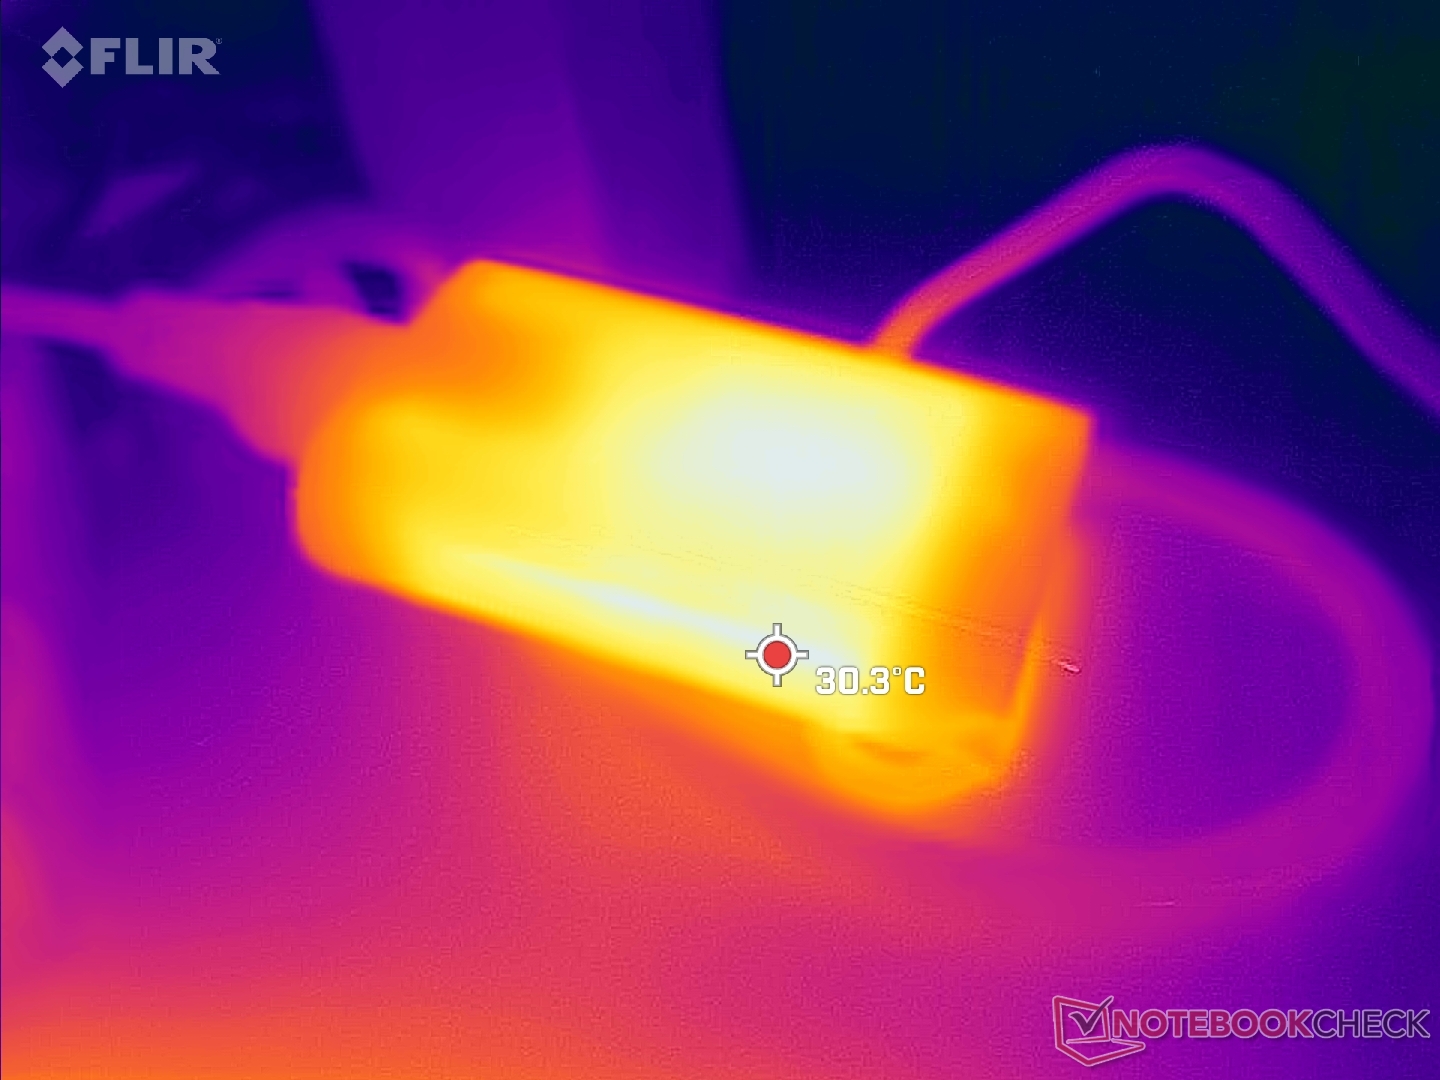
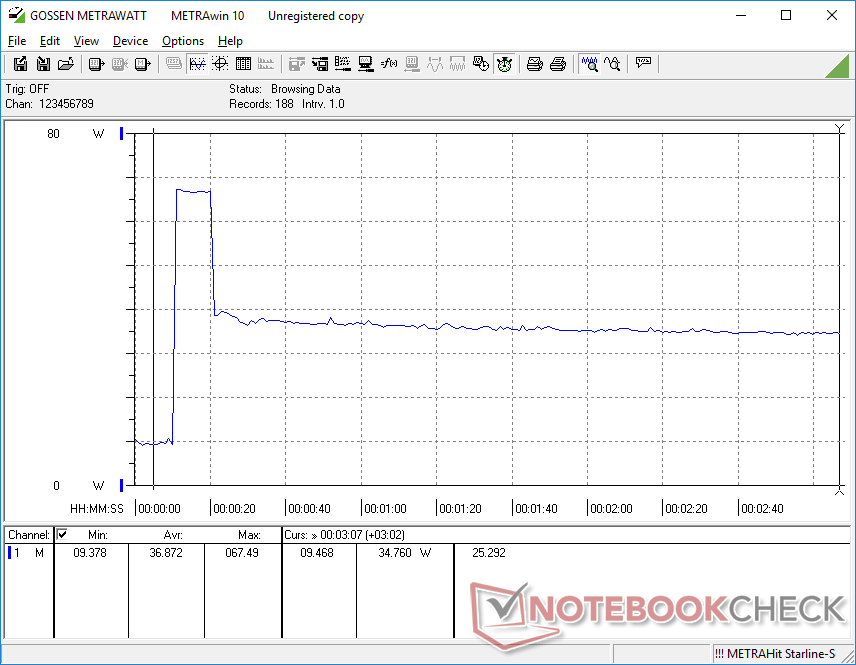
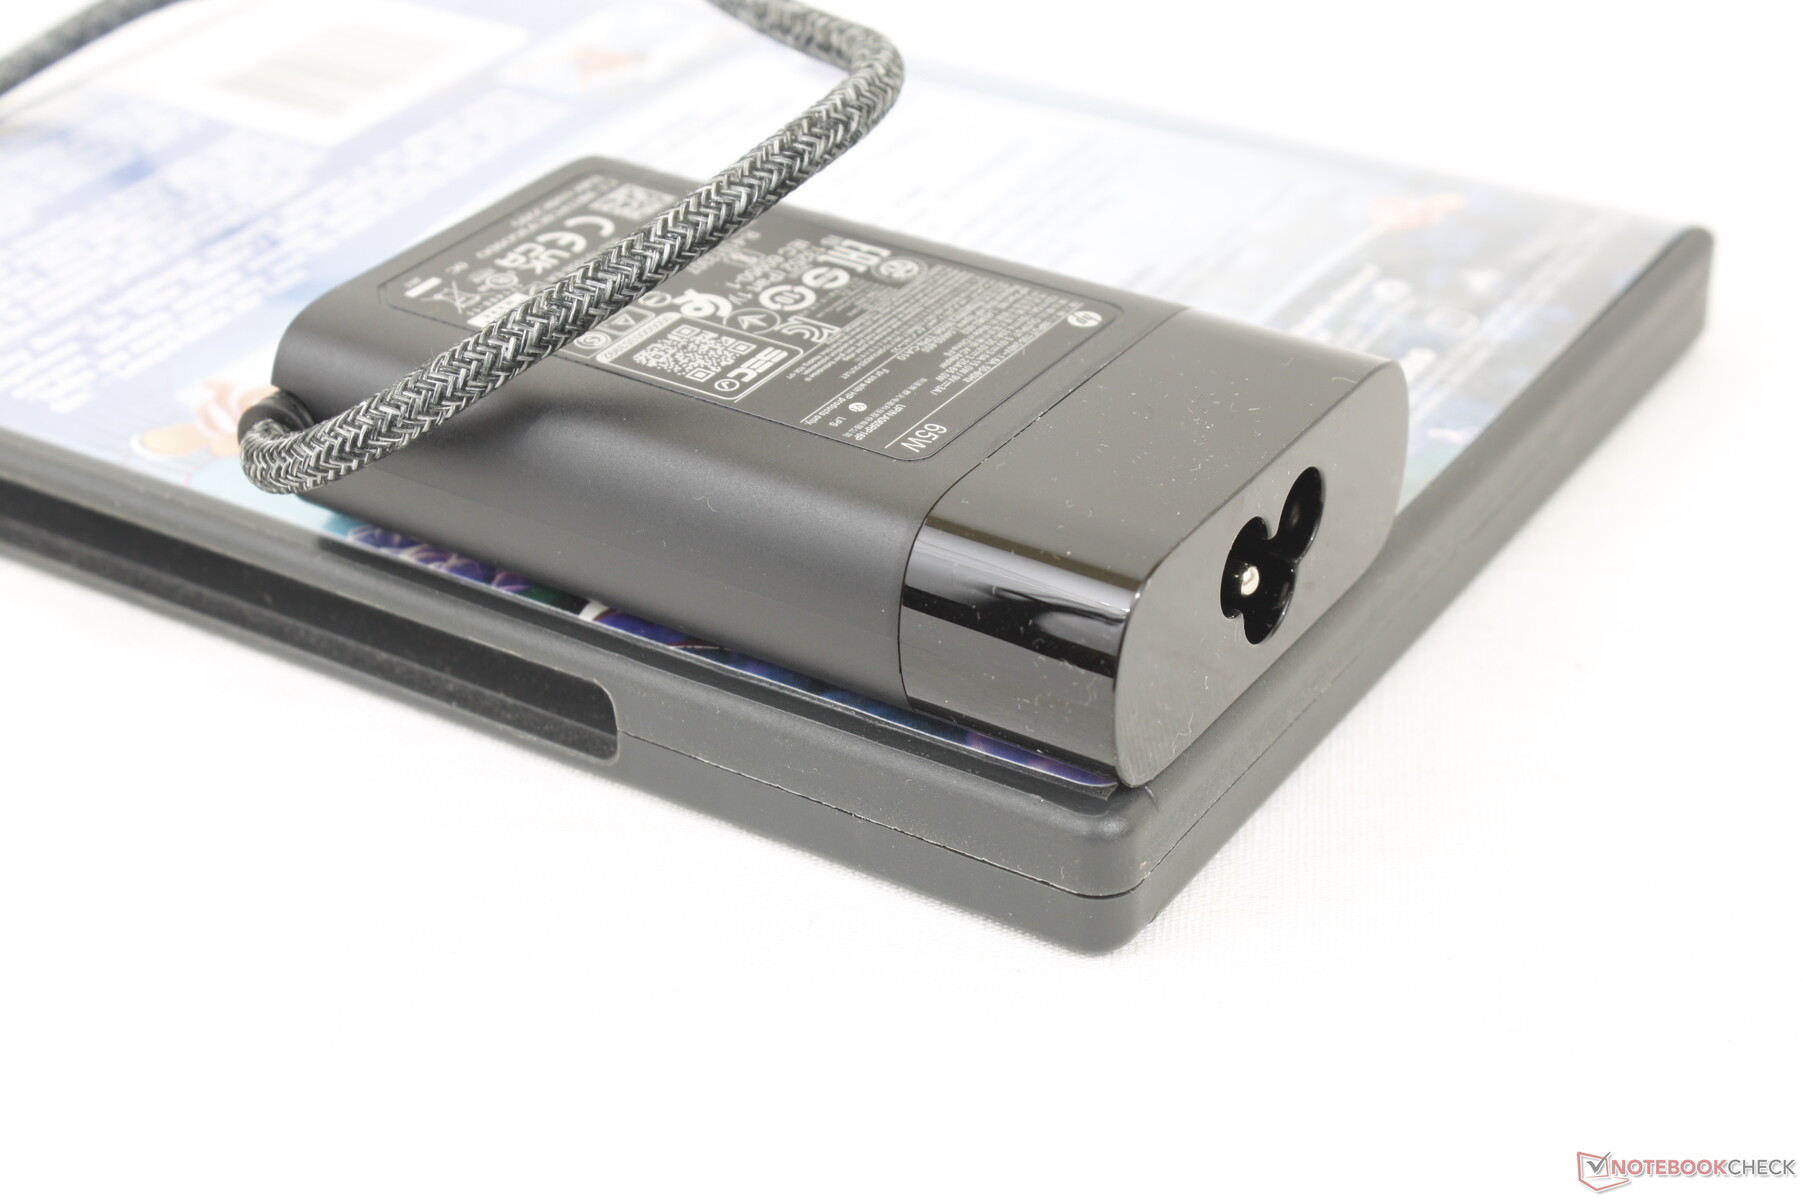
We're able to record a maximum draw of 67.5 W from the small (~8.8 x 5.4 x 2.2 cm) 65 W USB-C AC adapter. This rate is only temporary as shown by the screenshots below and so the system can still charge and run demanding loads simultaneously. Competing models with the Core i7-1260P like the Framework Laptop can offer faster performance but with a linearly higher increase in power consumption.
Three different 65 W USB-C AC adapters are available in different sizes and mains connectors.
| Off / Standby | |
| Idle | |
| Load |
|
Key:
min: | |
| HP Elite Dragonfly Folio 13.5 G3 i7-1265U, Iris Xe G7 96EUs, Samsung PM9A1 MZVL2512HCJQ, IPS, 1920x1280, 13.5" | HP Elite Dragonfly G3 i7-1265U, Iris Xe G7 96EUs, Micron 3400 MTFDKBA512TFH 512GB, IPS, 1920x1280, 13.5" | Dell Latitude 13 7330 i7-1265U, Iris Xe G7 96EUs, Toshiba KBG40ZNS512G NVMe, IPS, 1920x1080, 13.3" | Framework Laptop 13.5 12th Gen Intel i7-1260P, Iris Xe G7 96EUs, WDC PC SN730 SDBPNTY-512G, IPS, 2256x1504, 13.5" | Razer Book 13 FHD i7-1165G7, Iris Xe G7 96EUs, Samsung SSD PM981a MZVLB256HBHQ, IPS, 1920x1200, 13.4" | Lenovo ThinkPad L13 Gen2-20VH0017GE i5-1135G7, Iris Xe G7 80EUs, Samsung SSD PM981a MZVLB512HBJQ, IPS, 1920x1080, 13.3" | |
|---|---|---|---|---|---|---|
| Power Consumption | 0% | 6% | -34% | 5% | -8% | |
| Idle Minimum * (Watt) | 3.4 | 3.4 -0% | 2.8 18% | 5.3 -56% | 3.3 3% | 4.4 -29% |
| Idle Average * (Watt) | 4.9 | 5.6 -14% | 4.8 2% | 8.4 -71% | 6.4 -31% | 7.2 -47% |
| Idle Maximum * (Watt) | 9.3 | 8.4 10% | 7.3 22% | 11.2 -20% | 7 25% | 9.8 -5% |
| Load Average * (Watt) | 41.9 | 40.8 3% | 48.1 -15% | 57.4 -37% | 37.3 11% | 31.7 24% |
| Witcher 3 ultra * (Watt) | 36.4 | 35.5 2% | 35.4 3% | 46.7 -28% | 36.4 -0% | 33.3 9% |
| Load Maximum * (Watt) | 67.5 | 68.4 -1% | 63.6 6% | 61.2 9% | 53.7 20% | 66.6 1% |
* ... smaller is better
Power Consumption Witcher 3 / Stresstest
Power Consumption external Monitor
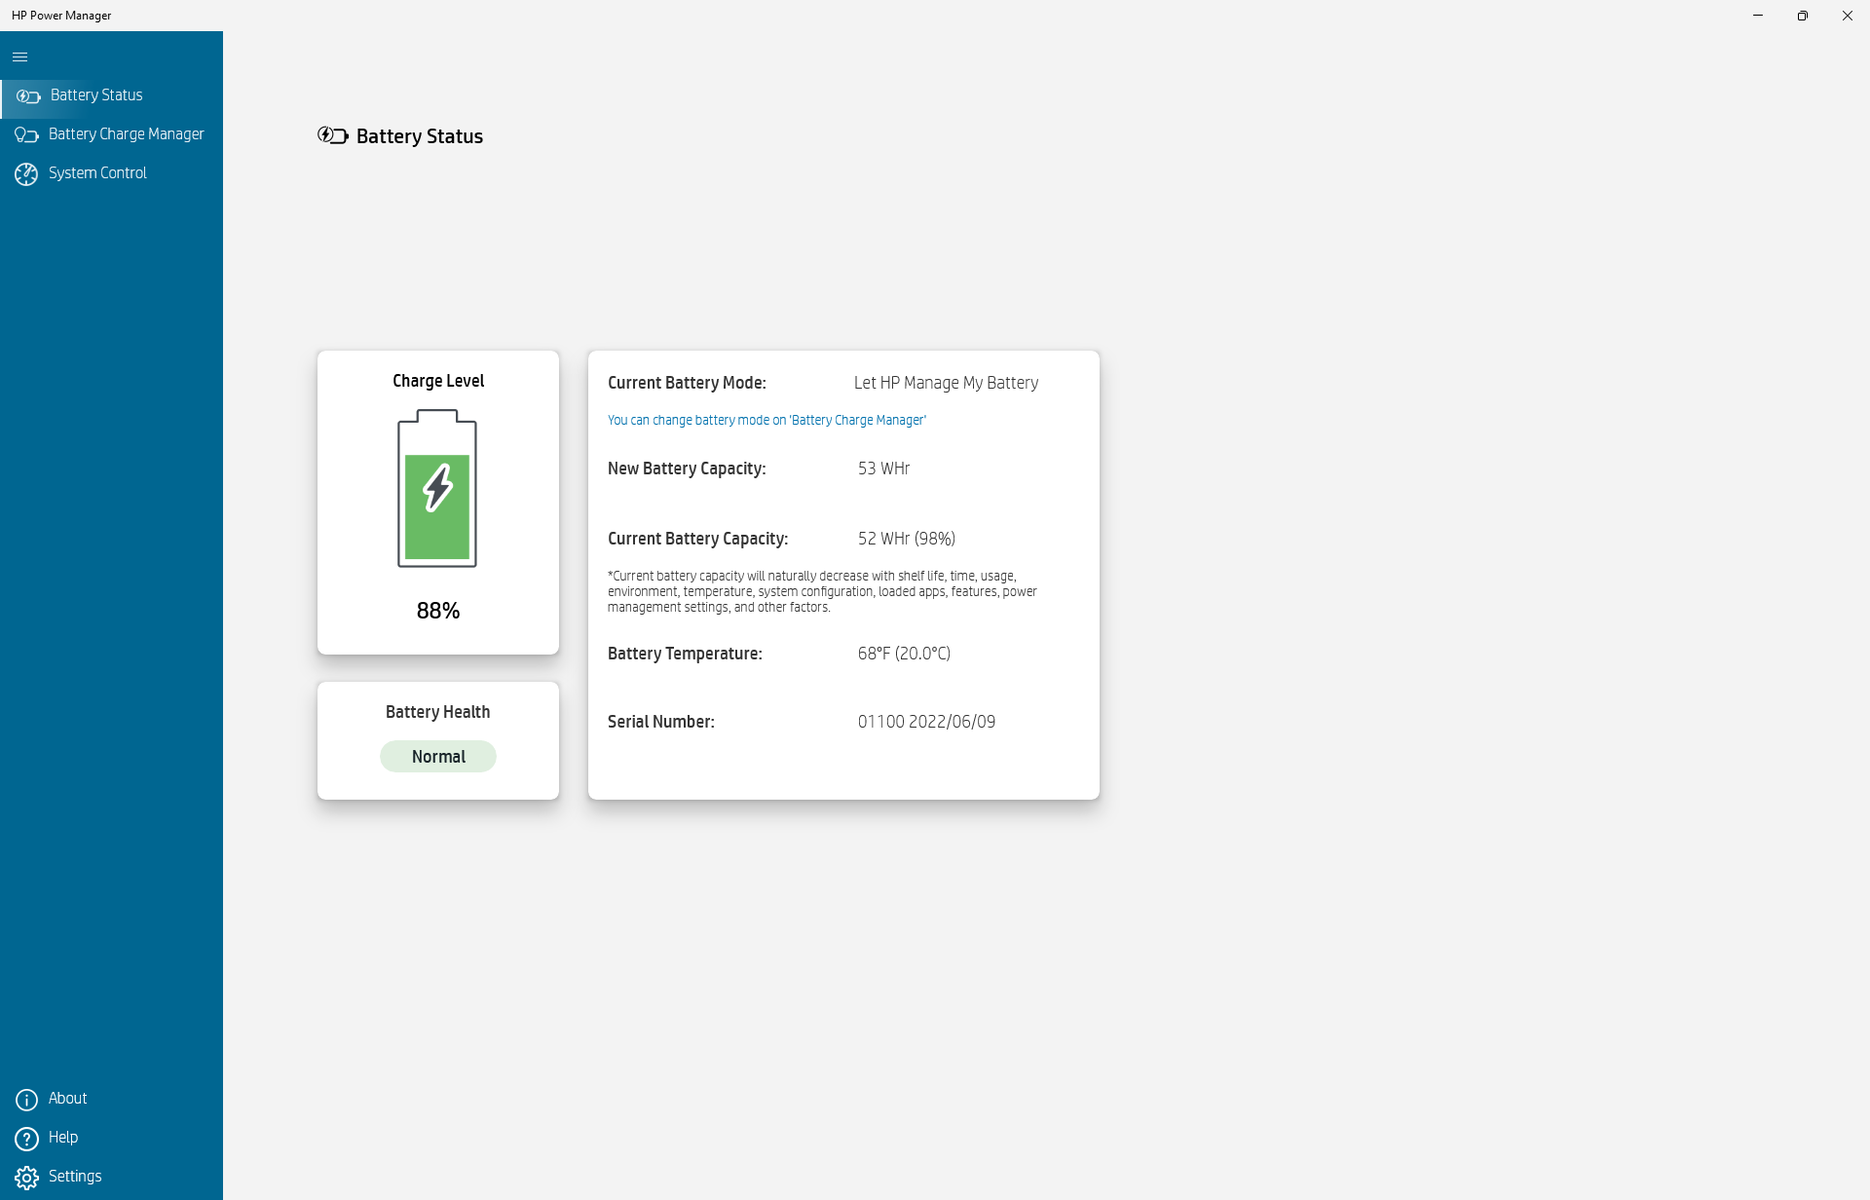
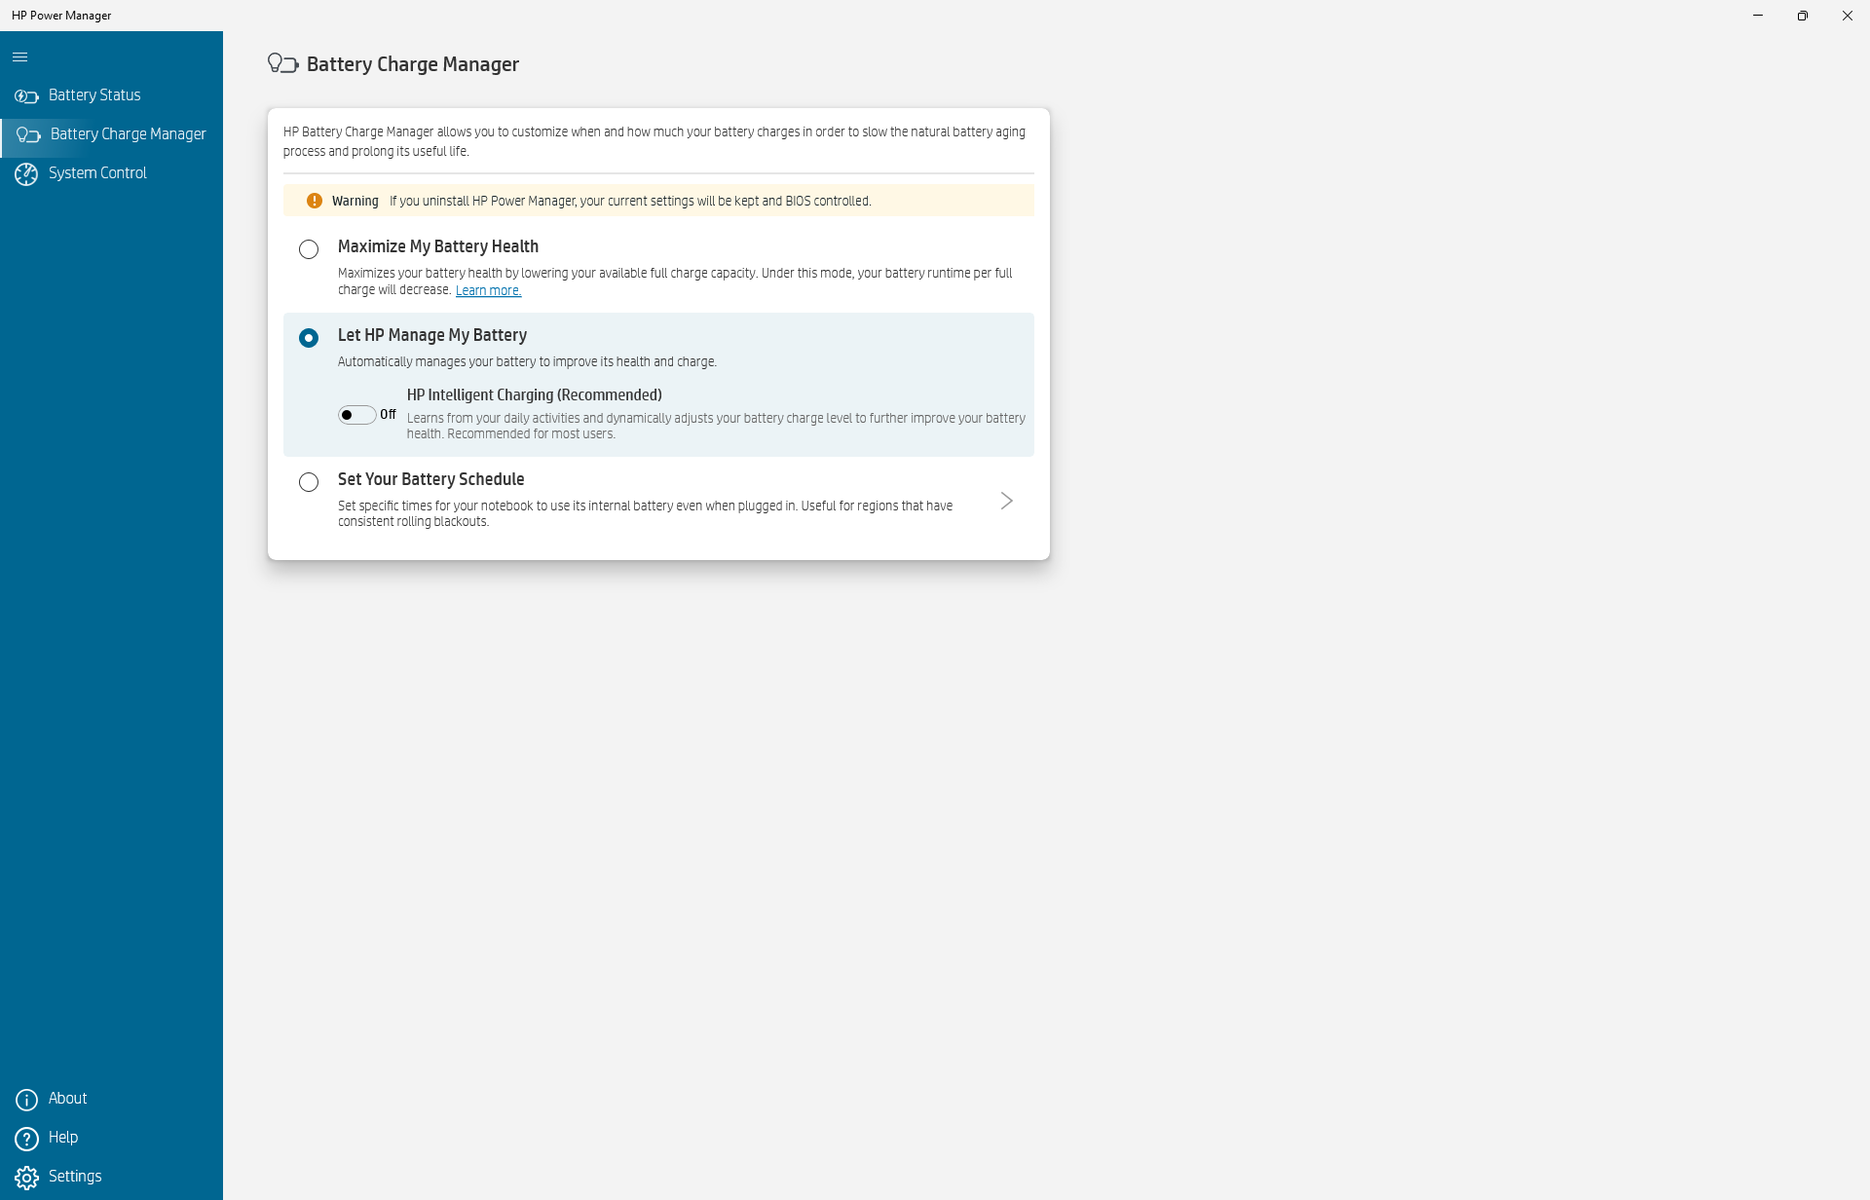
Battery Life — Small 53 Wh Capacity
Battery capacity is 22 percent smaller than on the Dragonfly G3. Perhaps not coincidentally, we're able to record a WLAN runtime that's about 20 percent shorter on our Dragonfly Folio G3 for a total of 9 hours and 25 minutes. Battery life is still longer than what we recorded on the Latitude 13 7330, Framework Laptop, or ThinkPad L13 by at least an hour each.
Charging from empty to full capacity takes less than 90 minutes with the included AC adapter.
| HP Elite Dragonfly Folio 13.5 G3 i7-1265U, Iris Xe G7 96EUs, 53 Wh | HP Elite Dragonfly G3 i7-1265U, Iris Xe G7 96EUs, 68 Wh | Dell Latitude 13 7330 i7-1265U, Iris Xe G7 96EUs, 41 Wh | Framework Laptop 13.5 12th Gen Intel i7-1260P, Iris Xe G7 96EUs, 55 Wh | Razer Book 13 FHD i7-1165G7, Iris Xe G7 96EUs, 55 Wh | Lenovo ThinkPad L13 Gen2-20VH0017GE i5-1135G7, Iris Xe G7 80EUs, 46 Wh | |
|---|---|---|---|---|---|---|
| Battery Runtime | 33% | -26% | -20% | 24% | -39% | |
| Reader / Idle (h) | 27.3 | 37.8 38% | 21.9 -20% | 36.8 35% | ||
| WiFi v1.3 (h) | 9.4 | 11.8 26% | 8.3 -12% | 7.5 -20% | 14.8 57% | 6.1 -35% |
| Load (h) | 2.6 | 3.5 35% | 1.4 -46% | 2.1 -19% | 1.5 -42% | |
| H.264 (h) | 7.6 |
Pros
Cons
Verdict — For Those Who Like Leather
The Dragonfly Folio G3 ditches the Snapdragon SoC on last year's model for a more traditional Intel Core U-series CPU. This change alone makes the model much more attractive to a wider variety of users who aren't interested in Windows on ARM or would prefer a more conventional Windows PC experience. The system is also now much easier to service without needing to sacrifice the unique faux leather design. These changes are definitely a step up for the series as a whole.
The biggest challenger to the Dragonfly Folio G3 is perhaps HP itself as there is already an excellent 2-in-1 series for business users: the EliteBook x360. The EliteBook x360 1040 G9 in particular is lighter, thinner, integrates more ports, offers similar 400-nit and 1000-nit panel options, 5G connectivity, and even the same Core i7-1265U CPU. It's tough to choose the Dragonfly Folio G3 when you have a sleeker and better-equipped alternative from the exact same manufacturer.
The Dragonfly Folio G3 leans into style a bit too heavily. Thinner EliteBook alternatives from HP pack in more ports and are thus more versatile if the unique design of the Dragonfly isn't your fancy.
The key selling point of the Dragonfly Folio G3 comes down to how much you value the faux leather style. It's a solid-looking executive convertible for sure, but we're not sure if that's worth the wider girth and giving up a bunch of ports in the process.
Price and Availability
HP is now shipping its Dragonfly Folio G3 model in multiple configurations starting at $2479 up to almost $4000 USD.
HP Elite Dragonfly Folio 13.5 G3
- 12/10/2022 v7 (old)
Allen Ngo
More articles related to this device
HP Elite Dragonfly Folio 13.5 G3 (Elite Dragonfly Series)Related Articles


Price comparison
