

Beelink SER5 Pro 5600H mini PC review: NUC 11 speeds with AMD Ryzen
")
Much like Zotac and its notoriously large selection of ZBox mini PCs, Beelink is looking to do the same by launching new models every few months equipped with faster and faster processors. The Beelink SER4 launched earlier this year with the Zen 2 Ryzen 7 4800U processor, but now the SER5 has hit the market with an even faster Zen 3 Ryzen 5 5600H all while keeping prices well below $500 USD.
Competitors in this space include other mini PCs or HTPCs with no discrete graphics such as the Ace Magician TK11, Geekom MiniAir 11, Zotac ZBox PI336, and most Intel NUC models.
More Beelink reviews:
Potential Competitors in Comparison
Rating | Date | Model | Weight | Height | Size | Resolution | Price |
|---|---|---|---|---|---|---|---|
v (old) | 10 / 2022 | Beelink SER Pro Ryzen 5 5600H R5 5600H, Vega 7 | 498 g | 42 mm | x | ||
v (old) | 09 / 2022 | Beelink SEi11 Pro i5-11320H, Iris Xe G7 96EUs | 440 g | 40 mm | x | ||
v (old) | 01 / 2022 | Beelink GTR5 R9 5900HX, Vega 8 | 686 g | 39 mm | x | ||
v (old) | 04 / 2021 | Intel NUC11TNKi5 i5-1135G7, Iris Xe G7 80EUs | 504 g | 37 mm | x | ||
v (old) | 02 / 2020 | Intel NUC10i7FNH i7-10710U, UHD Graphics 620 | 697 g | 51 mm | 0.00" | 0x0 | |
v (old) | 07 / 2022 | Zotac ZBOX PI336 pico Celeron N6211, UHD Graphics (Elkhart Lake 16 EU) | 293 g | 20.7 mm | x |
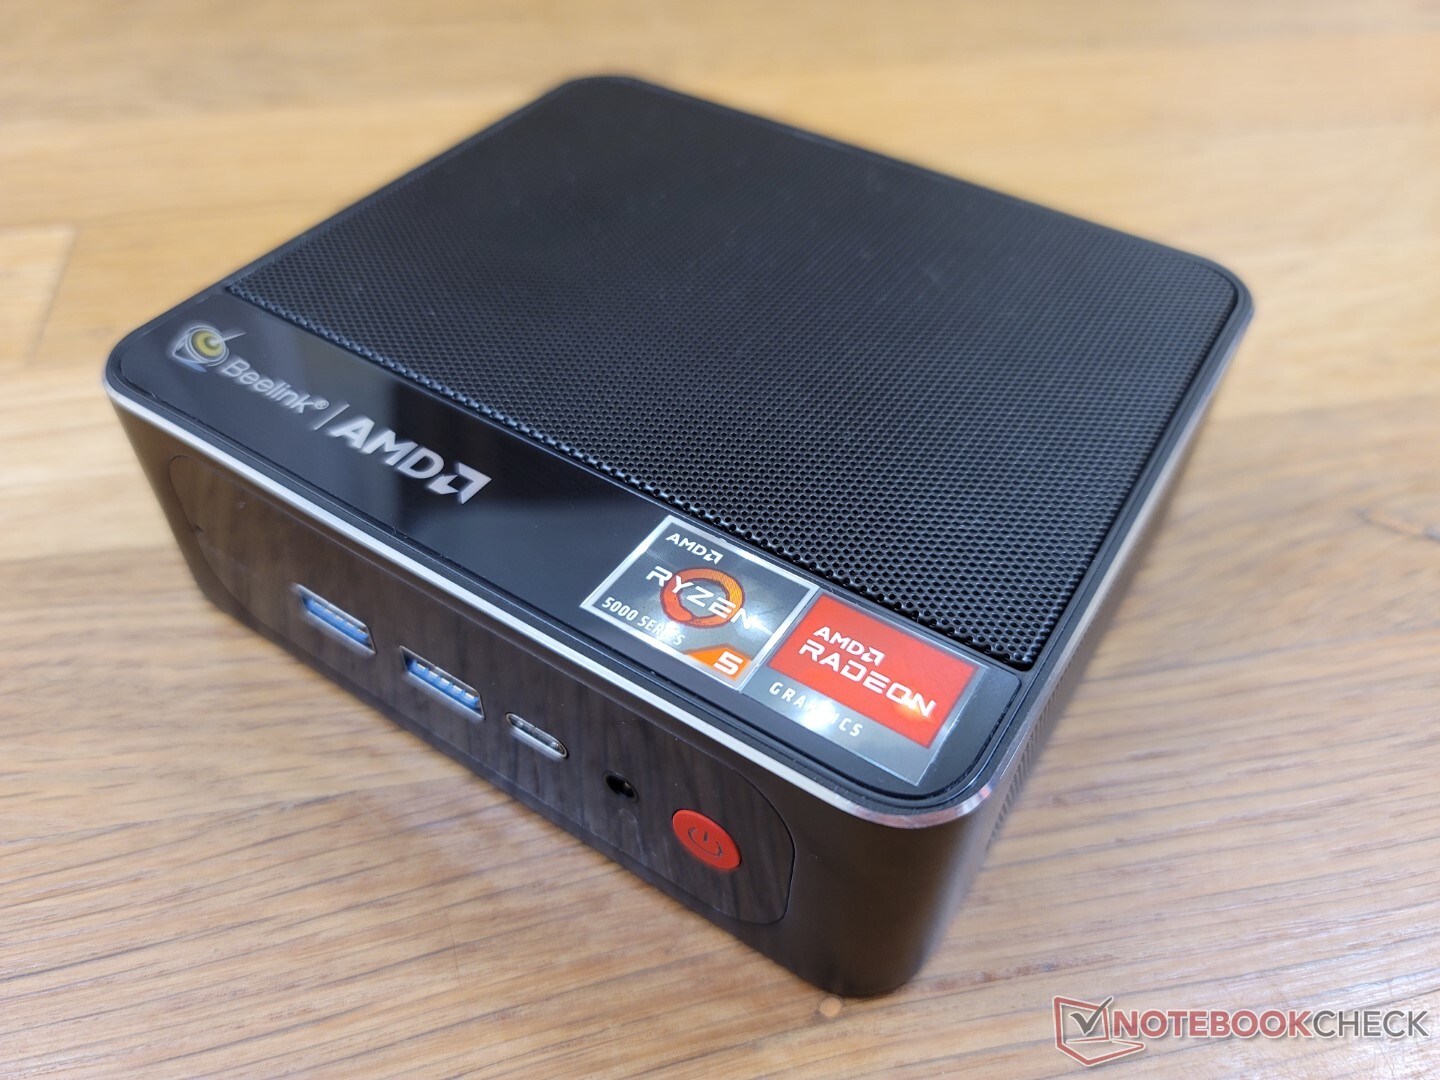
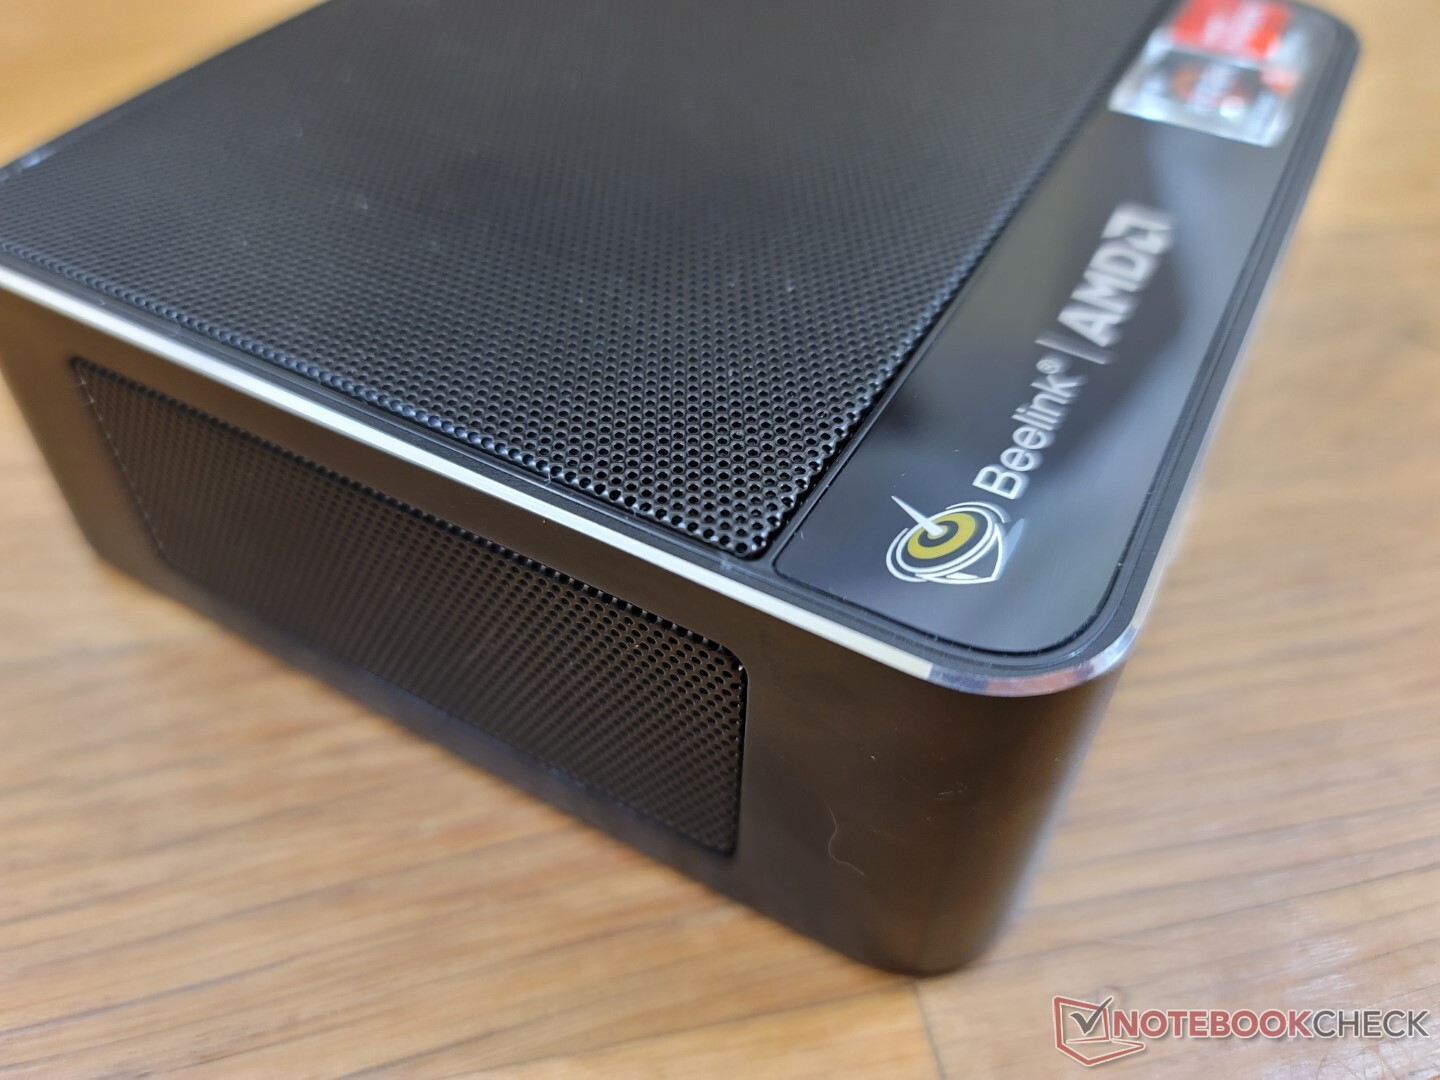
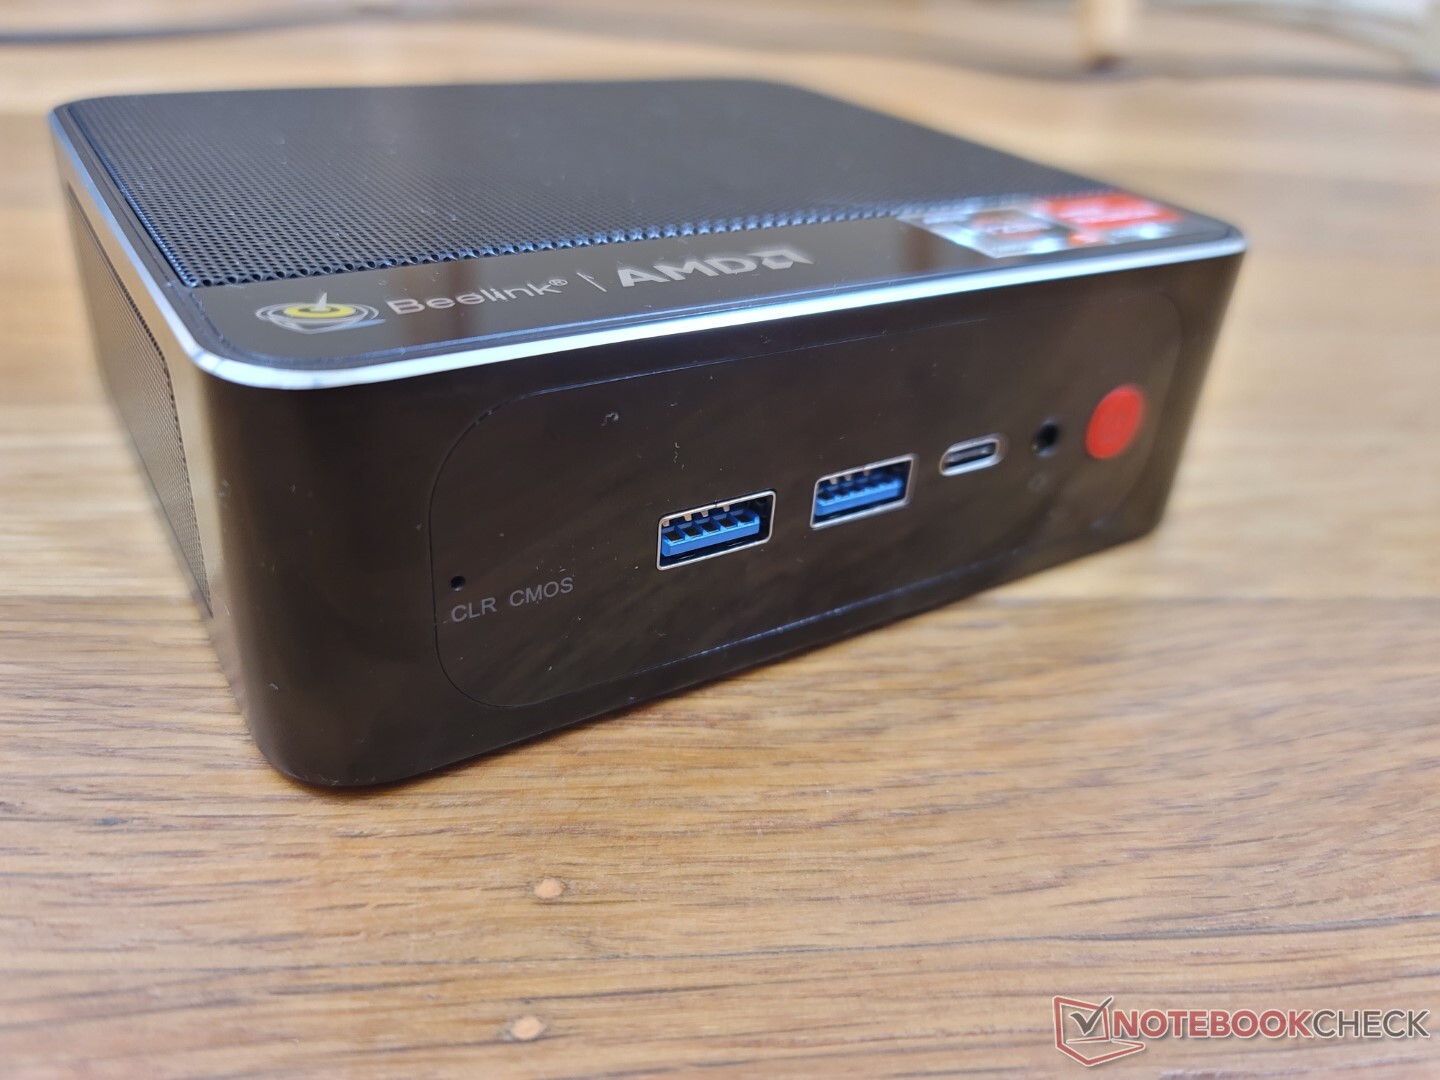
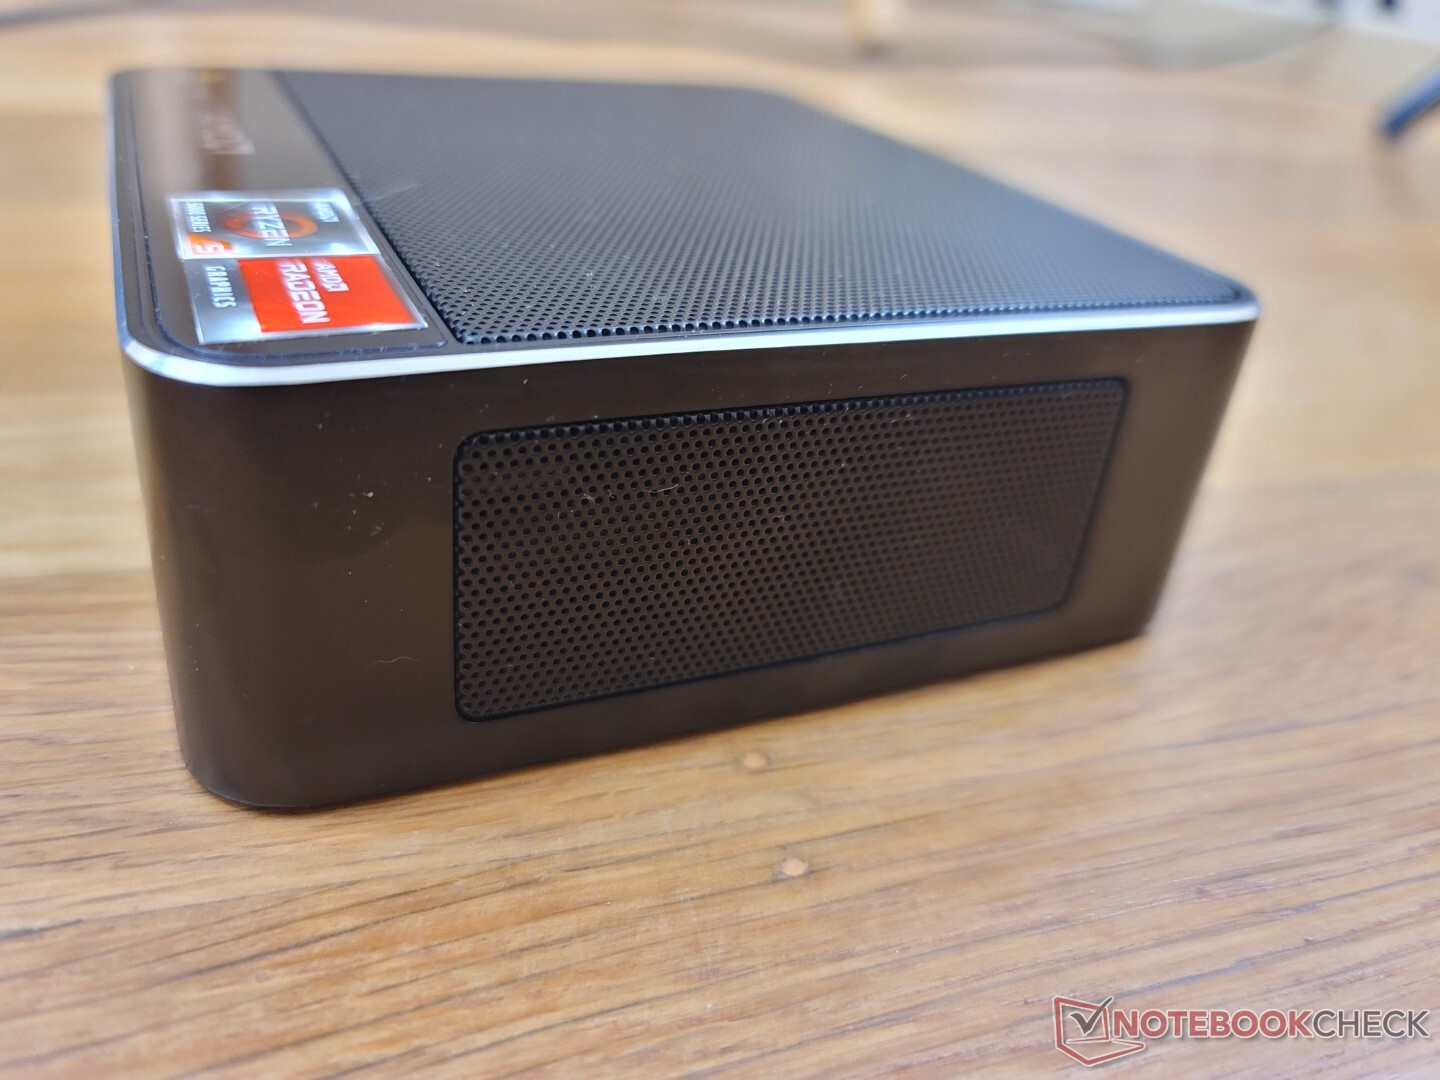
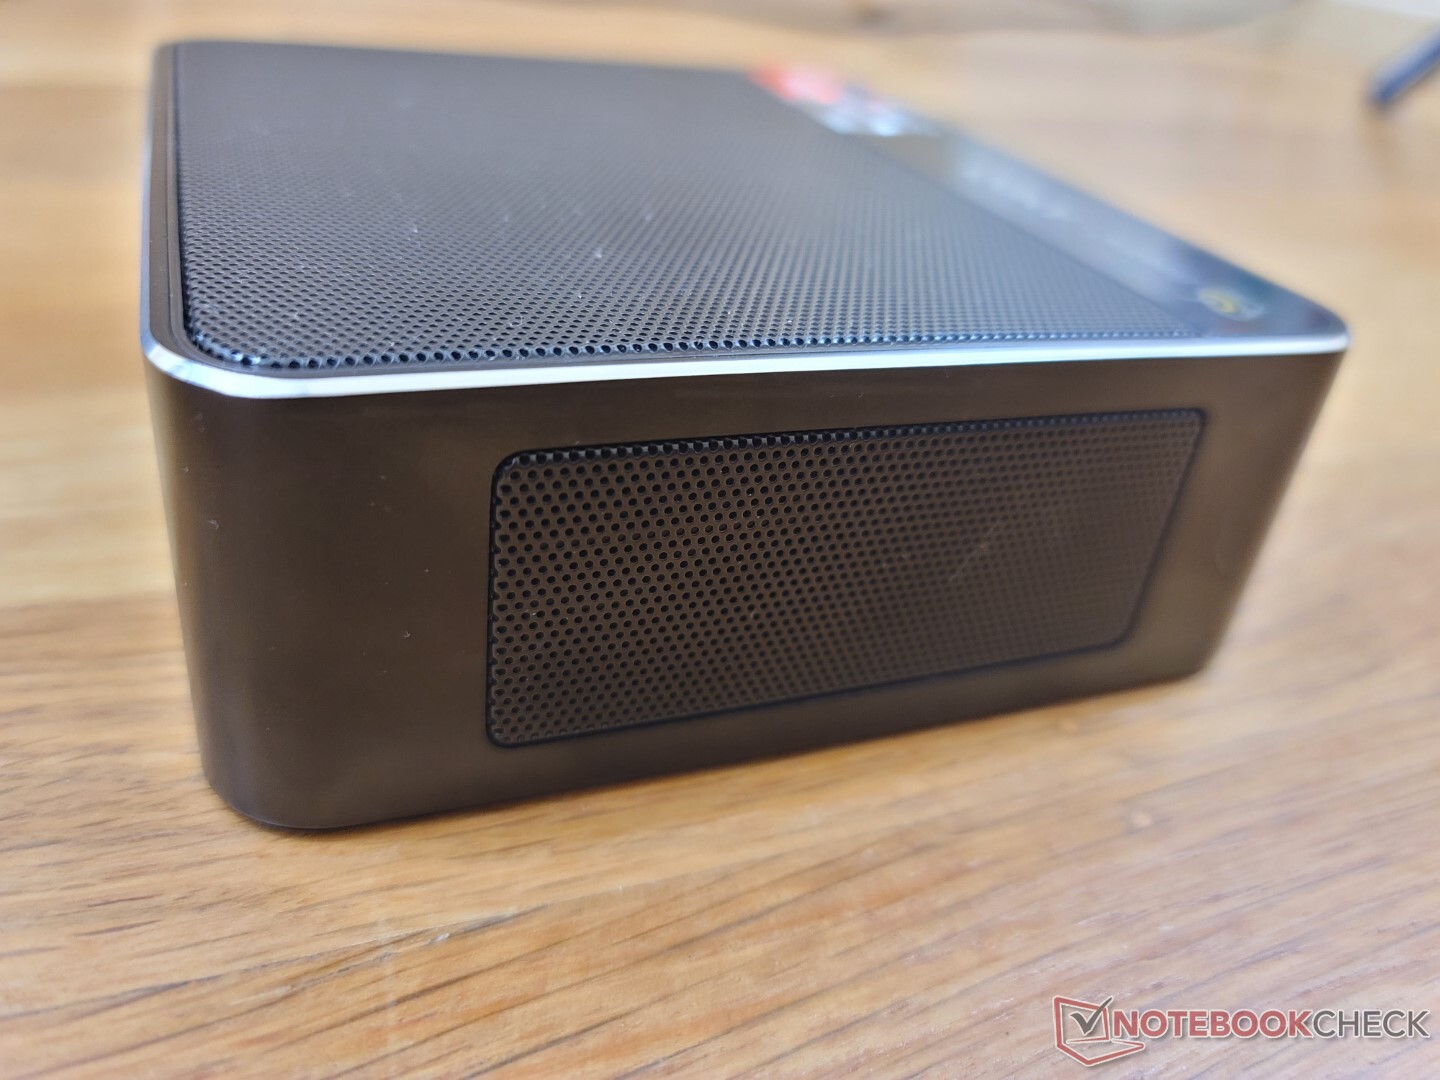
Case
Both the SER4 and SER5 utilize the same chassis skeleton albeit with slightly different superficial markings and colors. On the SER5, the ventilation grilles on the side are black instead of red.
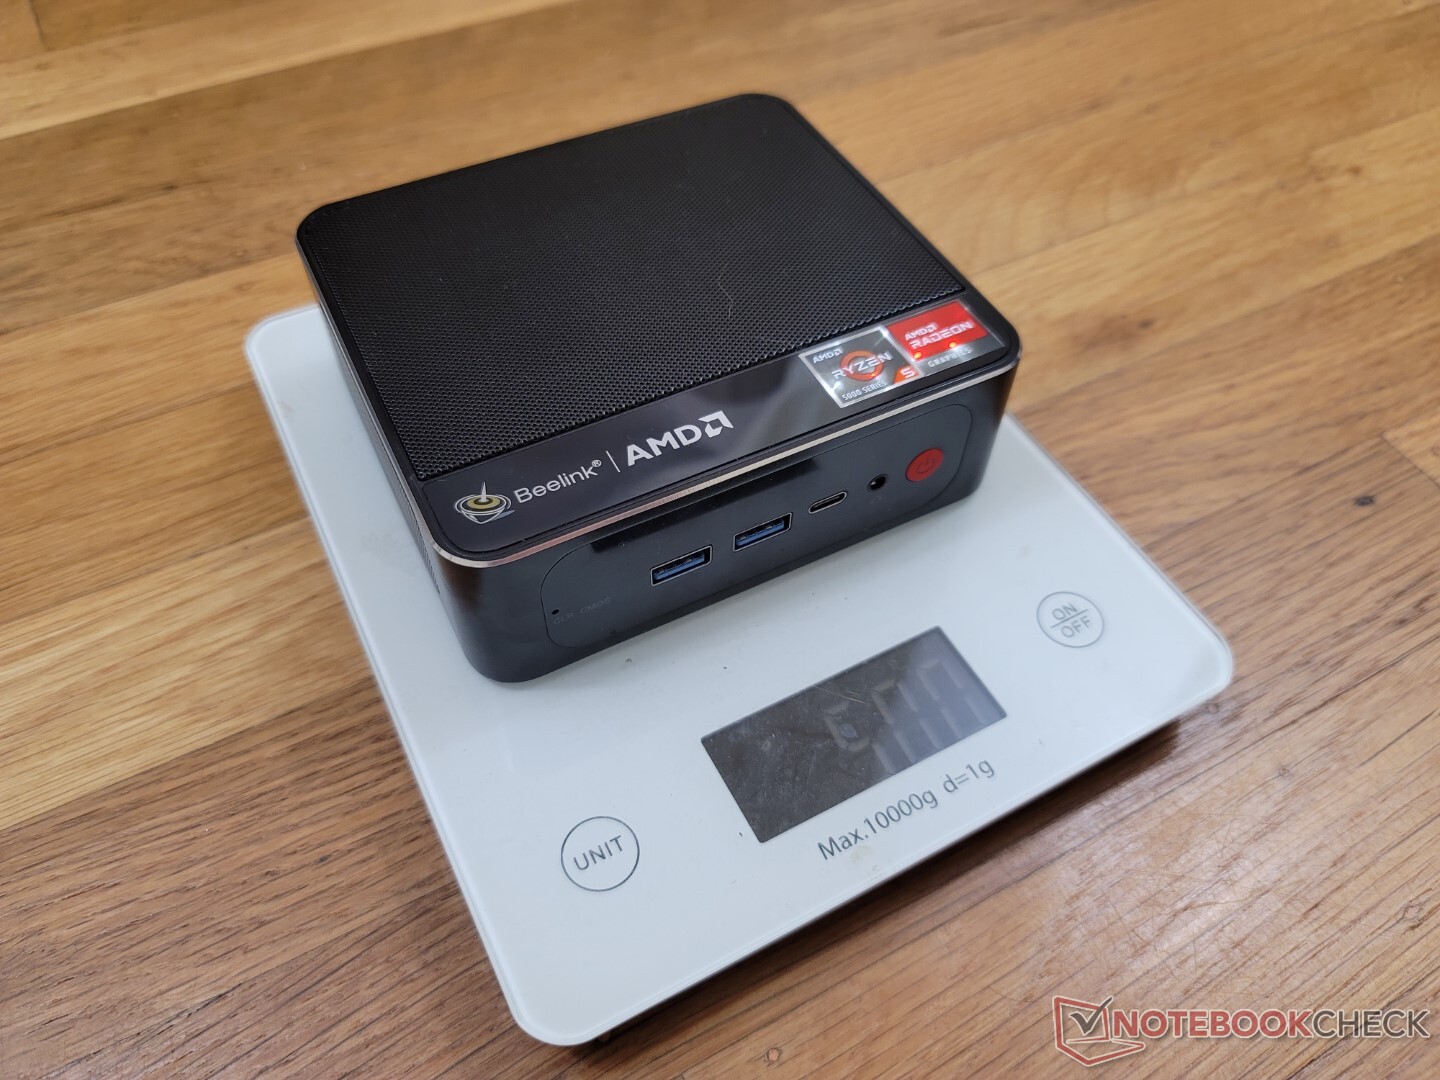
In terms of size, the SER5 is just slightly thicker than the Intel NUC 11TNK. It's just as heavy at about half a kilogram, however.
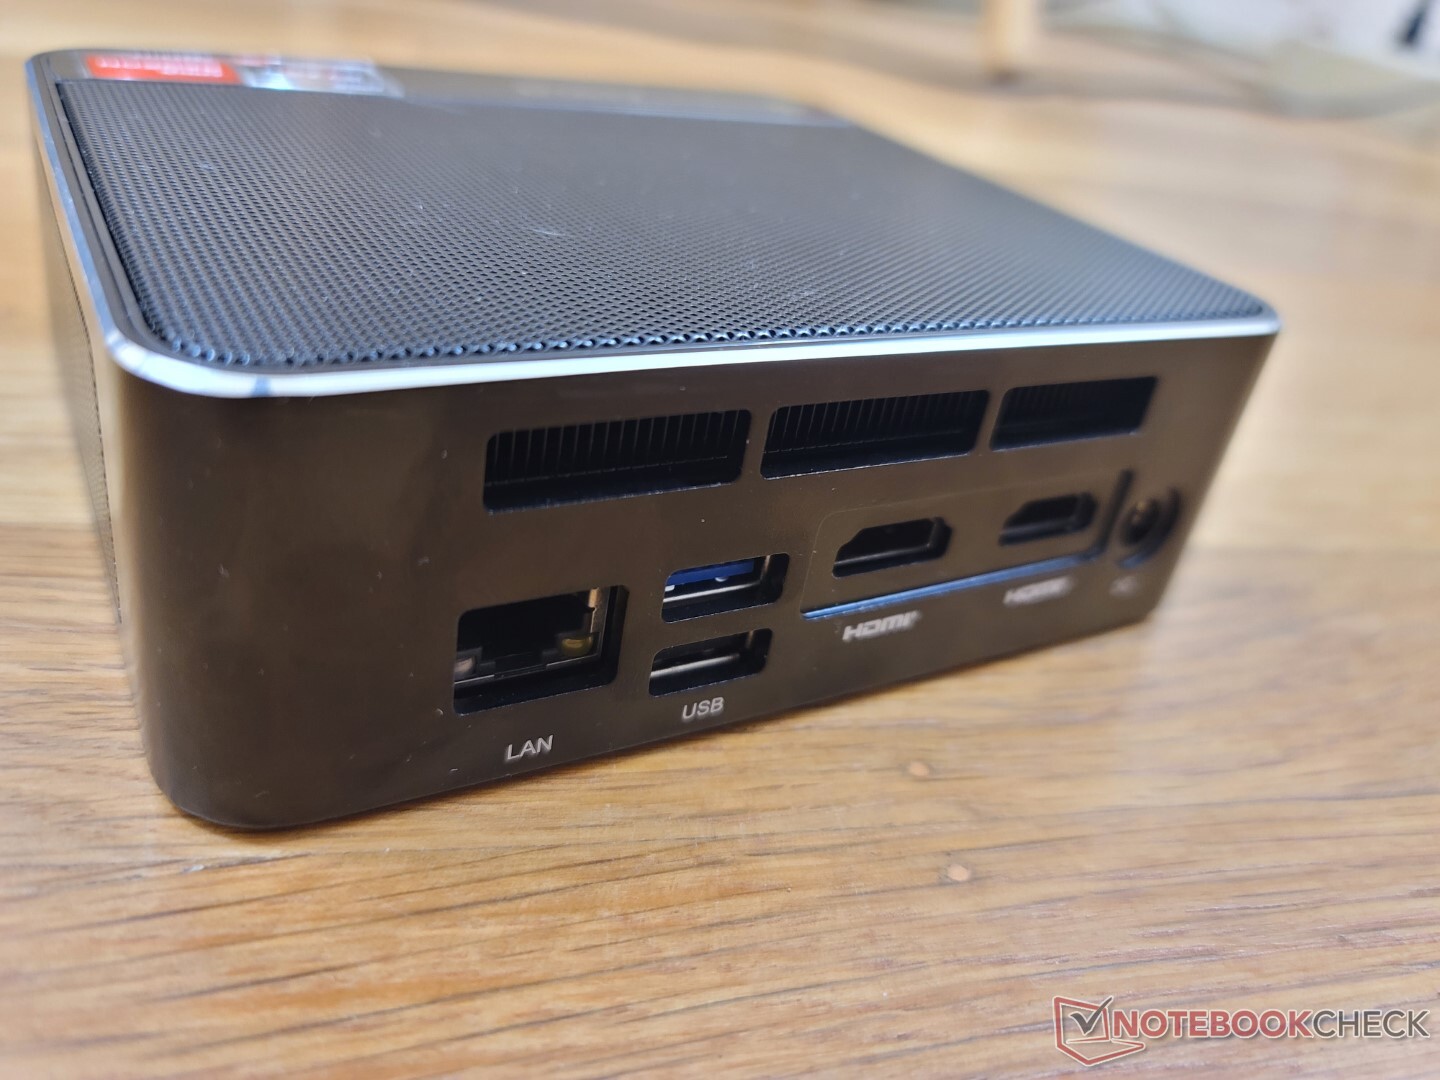
Connectivity
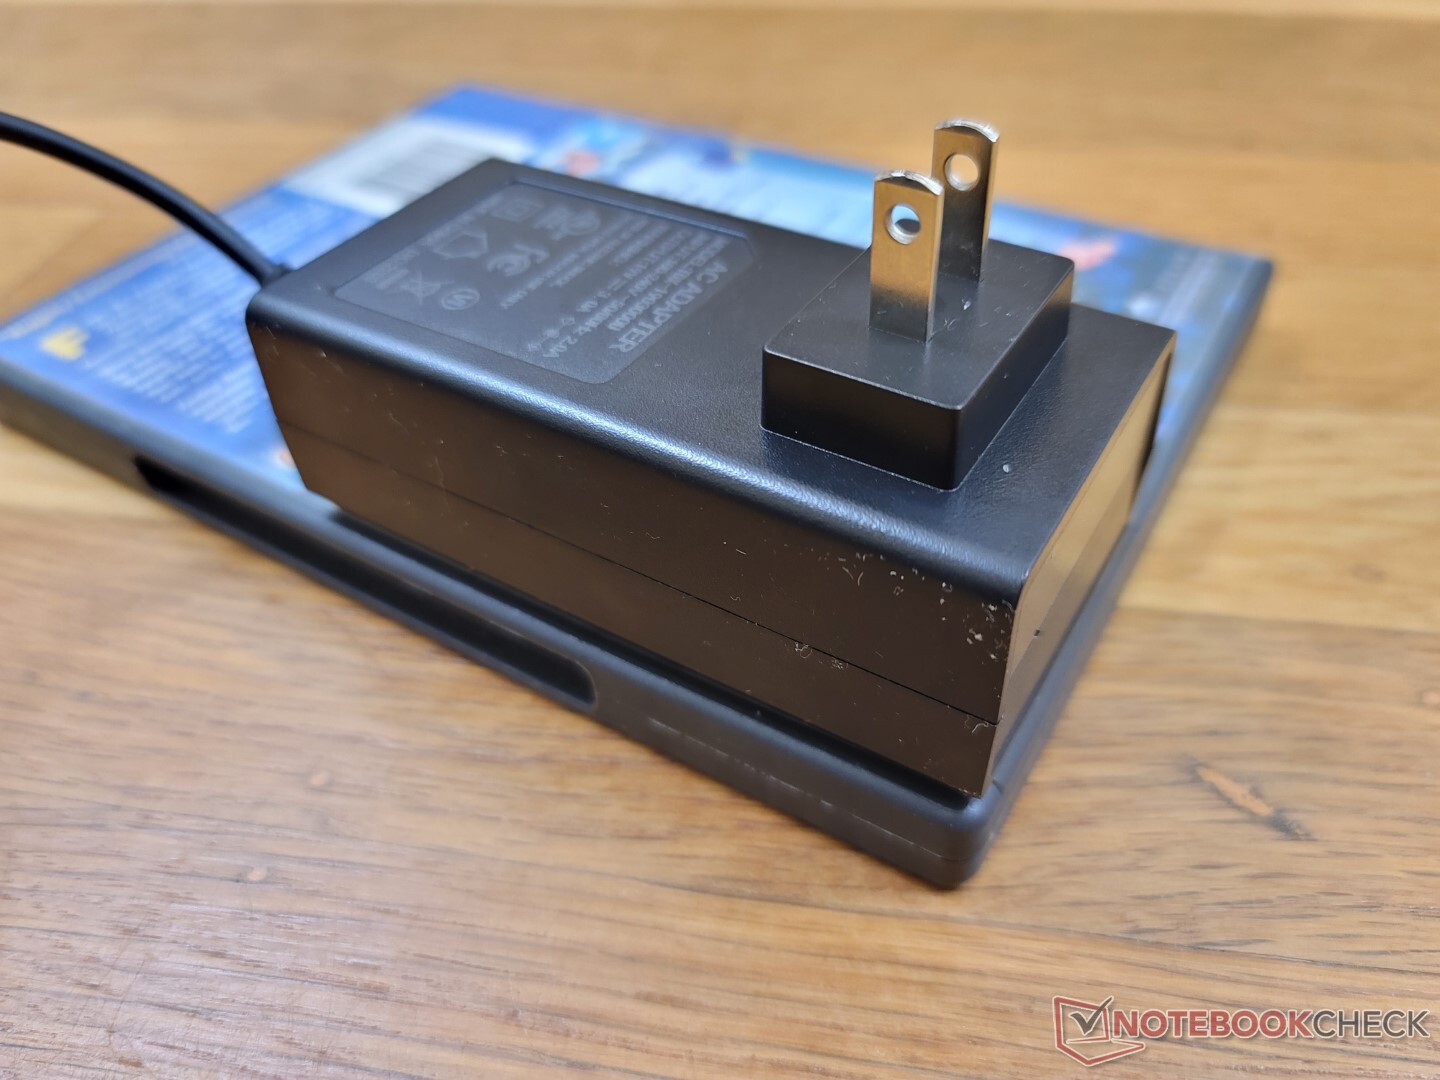
Port options are the same as on the SER4. It's disappointing that Beelink still hasn't moved to USB-C AC adapters as the SER5 relies on a proprietary AC barrel adapter instead. The single USB-C port up front supports DisplayPort 1.4 but not PD-in.
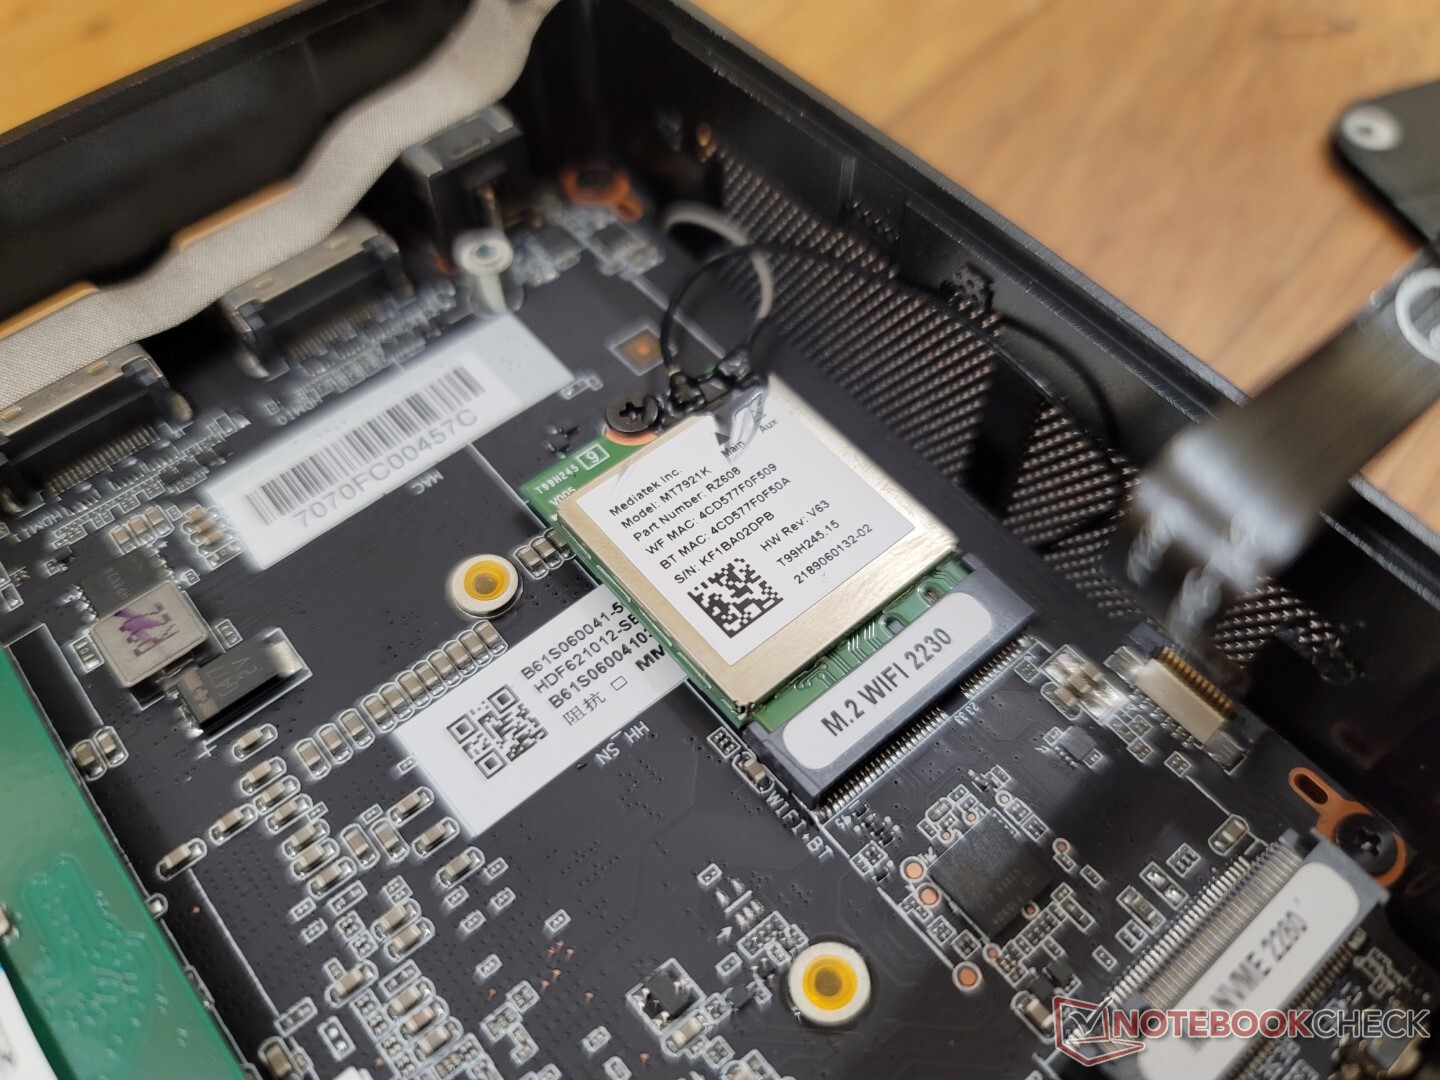
Communication
A MediaTek RZ608 comes standard for Wi-Fi 6E support much like on the Beelink SEi11 Pro. However, performance is still lacking when compared to the common Intel AX200/210 series as shown by the graphs below.
| Networking | |
| iperf3 transmit AX12 | |
| Intel NUC11TNKi5 | |
| Beelink GTR5 | |
| iperf3 receive AX12 | |
| Intel NUC11TNKi5 | |
| Beelink GTR5 | |
| iperf3 receive AXE11000 6GHz | |
| Zotac ZBOX PI336 pico | |
| Beelink SER Pro Ryzen 5 5600H | |
| Beelink SEi11 Pro | |
| iperf3 transmit AXE11000 6GHz | |
| Zotac ZBOX PI336 pico | |
| Beelink SER Pro Ryzen 5 5600H | |
| Beelink SEi11 Pro | |
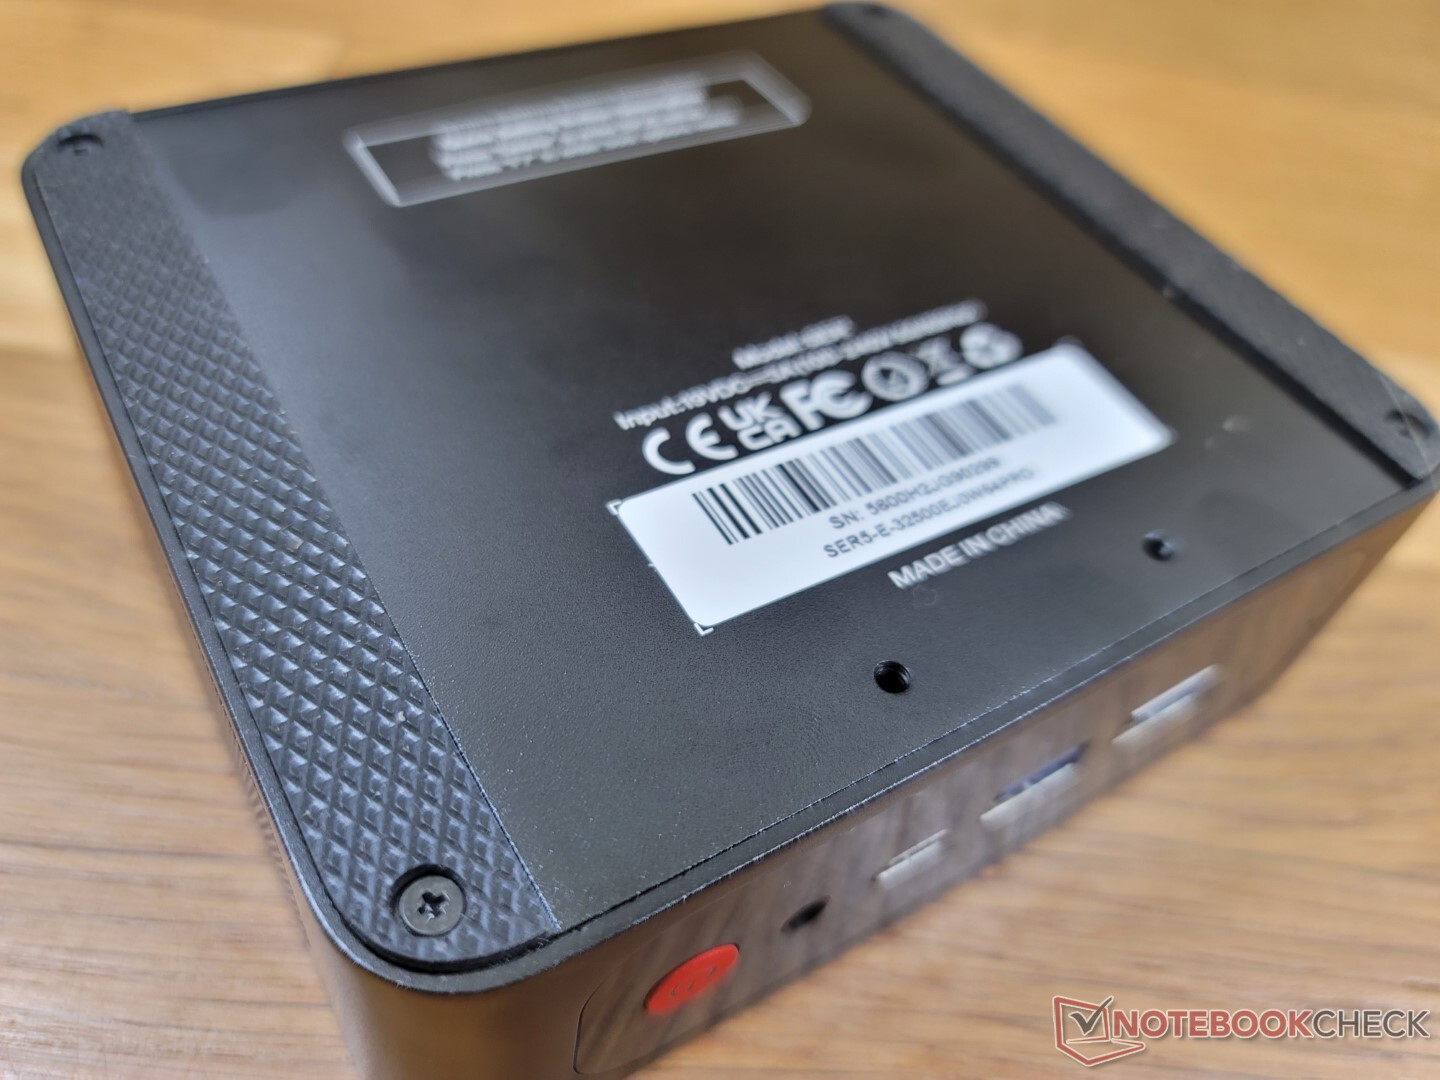
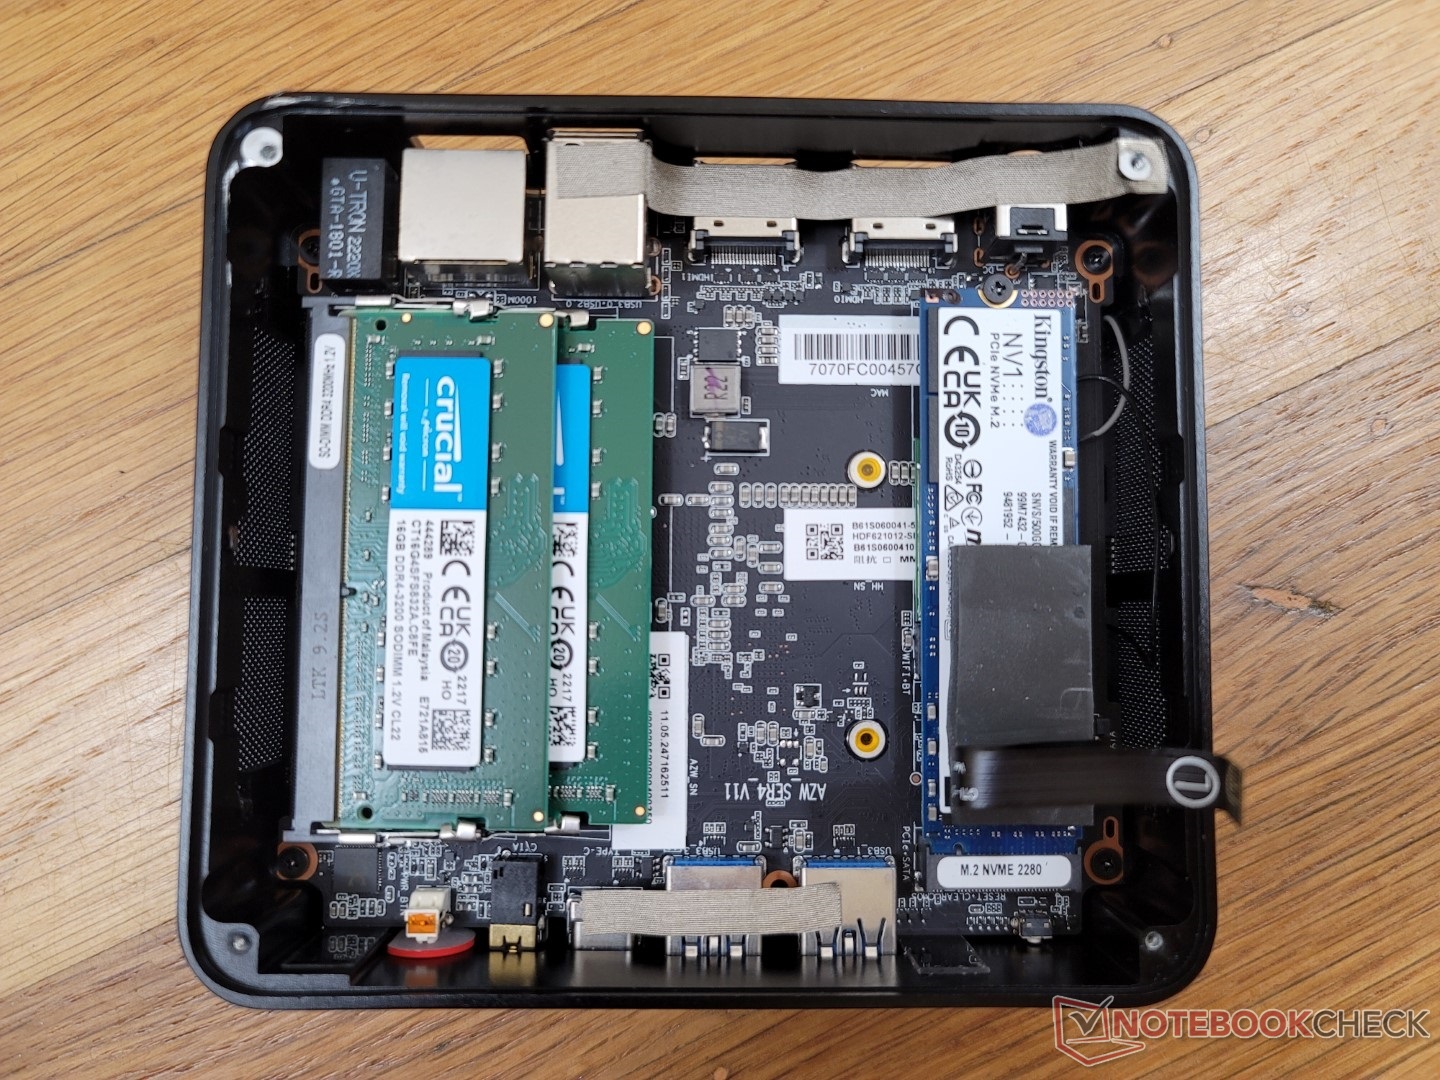
Maintenance
The bottom panel is secured by four Philips screws. These screws are much smaller than the hand twist screws on an Intel NUC and will require a screwdriver to remove. Keep in mind that these screws are quite soft as well and can be easily stripped if not careful.
Accessories and Warranty
The retail box includes a removable VESA mounting bracket, extras screws, user manual, two HDMI cables, and the AC adapter.
The standard one-year limited manufacturer warranty applies if purchased in the US.
Performance
Testing Conditions
We set our unit to Performance mode via Windows prior to running any benchmarks below.
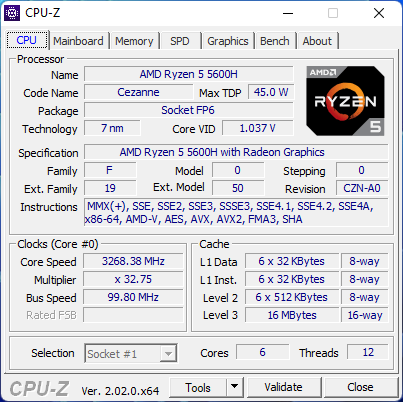
Processor
Multi-thread performance is about 15 percent slower than the average PC in our database equipped with the same Ryzen 5 5600H CPU. Even so, overall performance is still much faster than the common Core i7-1165G7 as found on many Ultrabooks and Intel NUCs.
Cinebench R15 Multi Loop
Cinebench R23: Multi Core | Single Core
Cinebench R15: CPU Multi 64Bit | CPU Single 64Bit
Blender: v2.79 BMW27 CPU
7-Zip 18.03: 7z b 4 | 7z b 4 -mmt1
Geekbench 5.5: Multi-Core | Single-Core
HWBOT x265 Benchmark v2.2: 4k Preset
LibreOffice : 20 Documents To PDF
R Benchmark 2.5: Overall mean
| Cinebench R20 / CPU (Multi Core) | |
| HP Envy 16 h0112nr | |
| SCHENKER XMG Apex 15 NH57E PS | |
| Honor MagicBook 14 2022 | |
| Beelink GTR5 | |
| Average AMD Ryzen 5 5600H (3074 - 4059, n=16) | |
| Beelink SER4 | |
| Beelink SER Pro Ryzen 5 5600H | |
| Intel NUC10i7FNH | |
| Beelink SEi11 Pro | |
| Framework Laptop 13.5 | |
| Intel NUC11TNKi5 | |
| Zotac ZBOX PI336 pico | |
| Cinebench R20 / CPU (Single Core) | |
| HP Envy 16 h0112nr | |
| Honor MagicBook 14 2022 | |
| Framework Laptop 13.5 | |
| Beelink GTR5 | |
| Beelink SEi11 Pro | |
| SCHENKER XMG Apex 15 NH57E PS | |
| Average AMD Ryzen 5 5600H (527 - 538, n=15) | |
| Beelink SER Pro Ryzen 5 5600H | |
| Intel NUC11TNKi5 | |
| Beelink SER4 | |
| Intel NUC10i7FNH | |
| Zotac ZBOX PI336 pico | |
| Cinebench R23 / Multi Core | |
| HP Envy 16 h0112nr | |
| SCHENKER XMG Apex 15 NH57E PS | |
| Honor MagicBook 14 2022 | |
| Beelink GTR5 | |
| Average AMD Ryzen 5 5600H (7945 - 10416, n=13) | |
| Beelink SER4 | |
| Beelink SER Pro Ryzen 5 5600H | |
| Beelink SEi11 Pro | |
| Framework Laptop 13.5 | |
| Intel NUC11TNKi5 | |
| Zotac ZBOX PI336 pico | |
| Cinebench R23 / Single Core | |
| HP Envy 16 h0112nr | |
| Honor MagicBook 14 2022 | |
| Framework Laptop 13.5 | |
| Beelink GTR5 | |
| Beelink SEi11 Pro | |
| SCHENKER XMG Apex 15 NH57E PS | |
| Intel NUC11TNKi5 | |
| Beelink SER Pro Ryzen 5 5600H | |
| Average AMD Ryzen 5 5600H (1316 - 1381, n=13) | |
| Beelink SER4 | |
| Zotac ZBOX PI336 pico | |
| Cinebench R15 / CPU Single 64Bit | |
| HP Envy 16 h0112nr | |
| Beelink GTR5 | |
| Honor MagicBook 14 2022 | |
| SCHENKER XMG Apex 15 NH57E PS | |
| Framework Laptop 13.5 | |
| Average AMD Ryzen 5 5600H (218 - 225, n=14) | |
| Beelink SER Pro Ryzen 5 5600H | |
| Beelink SEi11 Pro | |
| Intel NUC11TNKi5 | |
| Intel NUC10i7FNH | |
| Beelink SER4 | |
| Zotac ZBOX PI336 pico | |
| Geekbench 5.5 / Multi-Core | |
| HP Envy 16 h0112nr | |
| Honor MagicBook 14 2022 | |
| SCHENKER XMG Apex 15 NH57E PS | |
| Beelink GTR5 | |
| Average AMD Ryzen 5 5600H (4990 - 7253, n=14) | |
| Beelink SER4 | |
| Beelink SER Pro Ryzen 5 5600H | |
| Intel NUC10i7FNH | |
| Beelink SEi11 Pro | |
| Intel NUC11TNKi5 | |
| Zotac ZBOX PI336 pico | |
| Geekbench 5.5 / Single-Core | |
| HP Envy 16 h0112nr | |
| Honor MagicBook 14 2022 | |
| Beelink GTR5 | |
| Beelink SEi11 Pro | |
| SCHENKER XMG Apex 15 NH57E PS | |
| Beelink SER Pro Ryzen 5 5600H | |
| Average AMD Ryzen 5 5600H (1365 - 1445, n=14) | |
| Intel NUC11TNKi5 | |
| Intel NUC10i7FNH | |
| Beelink SER4 | |
| Zotac ZBOX PI336 pico | |
| HWBOT x265 Benchmark v2.2 / 4k Preset | |
| SCHENKER XMG Apex 15 NH57E PS | |
| HP Envy 16 h0112nr | |
| Beelink GTR5 | |
| Honor MagicBook 14 2022 | |
| Average AMD Ryzen 5 5600H (9.92 - 13.3, n=14) | |
| Beelink SER Pro Ryzen 5 5600H | |
| Beelink SER4 | |
| Intel NUC10i7FNH | |
| Beelink SEi11 Pro | |
| Framework Laptop 13.5 | |
| Intel NUC11TNKi5 | |
| Zotac ZBOX PI336 pico | |
| LibreOffice / 20 Documents To PDF | |
| Zotac ZBOX PI336 pico | |
| Beelink SER4 | |
| Average AMD Ryzen 5 5600H (52.2 - 81.5, n=14) | |
| SCHENKER XMG Apex 15 NH57E PS | |
| Beelink SER Pro Ryzen 5 5600H | |
| Intel NUC11TNKi5 | |
| Beelink GTR5 | |
| Beelink SEi11 Pro | |
| HP Envy 16 h0112nr | |
| Framework Laptop 13.5 | |
| Honor MagicBook 14 2022 | |
| R Benchmark 2.5 / Overall mean | |
| Zotac ZBOX PI336 pico | |
| Intel NUC10i7FNH | |
| Intel NUC11TNKi5 | |
| Beelink SEi11 Pro | |
| Beelink SER4 | |
| Framework Laptop 13.5 | |
| Average AMD Ryzen 5 5600H (0.526 - 0.596, n=14) | |
| Beelink SER Pro Ryzen 5 5600H | |
| SCHENKER XMG Apex 15 NH57E PS | |
| Honor MagicBook 14 2022 | |
| Beelink GTR5 | |
| HP Envy 16 h0112nr | |
* ... smaller is better
AIDA64: FP32 Ray-Trace | FPU Julia | CPU SHA3 | CPU Queen | FPU SinJulia | FPU Mandel | CPU AES | CPU ZLib | FP64 Ray-Trace | CPU PhotoWorxx
| Performance Rating | |
| Beelink GTR5 | |
| Beelink SER Pro Ryzen 5 5600H | |
| Beelink SEi11 Pro | |
| Intel NUC11TNKi5 | |
| Zotac ZBOX PI336 pico | |
| AIDA64 / FP32 Ray-Trace | |
| Beelink GTR5 | |
| Beelink SER Pro Ryzen 5 5600H | |
| Beelink SEi11 Pro | |
| Intel NUC11TNKi5 | |
| Zotac ZBOX PI336 pico | |
| AIDA64 / FPU Julia | |
| Beelink GTR5 | |
| Beelink SER Pro Ryzen 5 5600H | |
| Beelink SEi11 Pro | |
| Intel NUC11TNKi5 | |
| Zotac ZBOX PI336 pico | |
| AIDA64 / CPU SHA3 | |
| Beelink GTR5 | |
| Beelink SER Pro Ryzen 5 5600H | |
| Beelink SEi11 Pro | |
| Intel NUC11TNKi5 | |
| Zotac ZBOX PI336 pico | |
| AIDA64 / CPU Queen | |
| Beelink GTR5 | |
| Beelink SER Pro Ryzen 5 5600H | |
| Beelink SEi11 Pro | |
| Intel NUC11TNKi5 | |
| Zotac ZBOX PI336 pico | |
| AIDA64 / FPU SinJulia | |
| Beelink GTR5 | |
| Beelink SER Pro Ryzen 5 5600H | |
| Beelink SEi11 Pro | |
| Intel NUC11TNKi5 | |
| Zotac ZBOX PI336 pico | |
| AIDA64 / FPU Mandel | |
| Beelink GTR5 | |
| Beelink SER Pro Ryzen 5 5600H | |
| Beelink SEi11 Pro | |
| Intel NUC11TNKi5 | |
| Zotac ZBOX PI336 pico | |
| AIDA64 / CPU AES | |
| Beelink GTR5 | |
| Beelink SER Pro Ryzen 5 5600H | |
| Beelink SEi11 Pro | |
| Intel NUC11TNKi5 | |
| Zotac ZBOX PI336 pico | |
| AIDA64 / CPU ZLib | |
| Beelink GTR5 | |
| Beelink SER Pro Ryzen 5 5600H | |
| Intel NUC11TNKi5 | |
| Beelink SEi11 Pro | |
| Zotac ZBOX PI336 pico | |
| AIDA64 / FP64 Ray-Trace | |
| Beelink GTR5 | |
| Beelink SER Pro Ryzen 5 5600H | |
| Beelink SEi11 Pro | |
| Intel NUC11TNKi5 | |
| Zotac ZBOX PI336 pico | |
| AIDA64 / CPU PhotoWorxx | |
| Beelink SEi11 Pro | |
| Beelink GTR5 | |
| Beelink SER Pro Ryzen 5 5600H | |
| Intel NUC11TNKi5 | |
| Zotac ZBOX PI336 pico | |
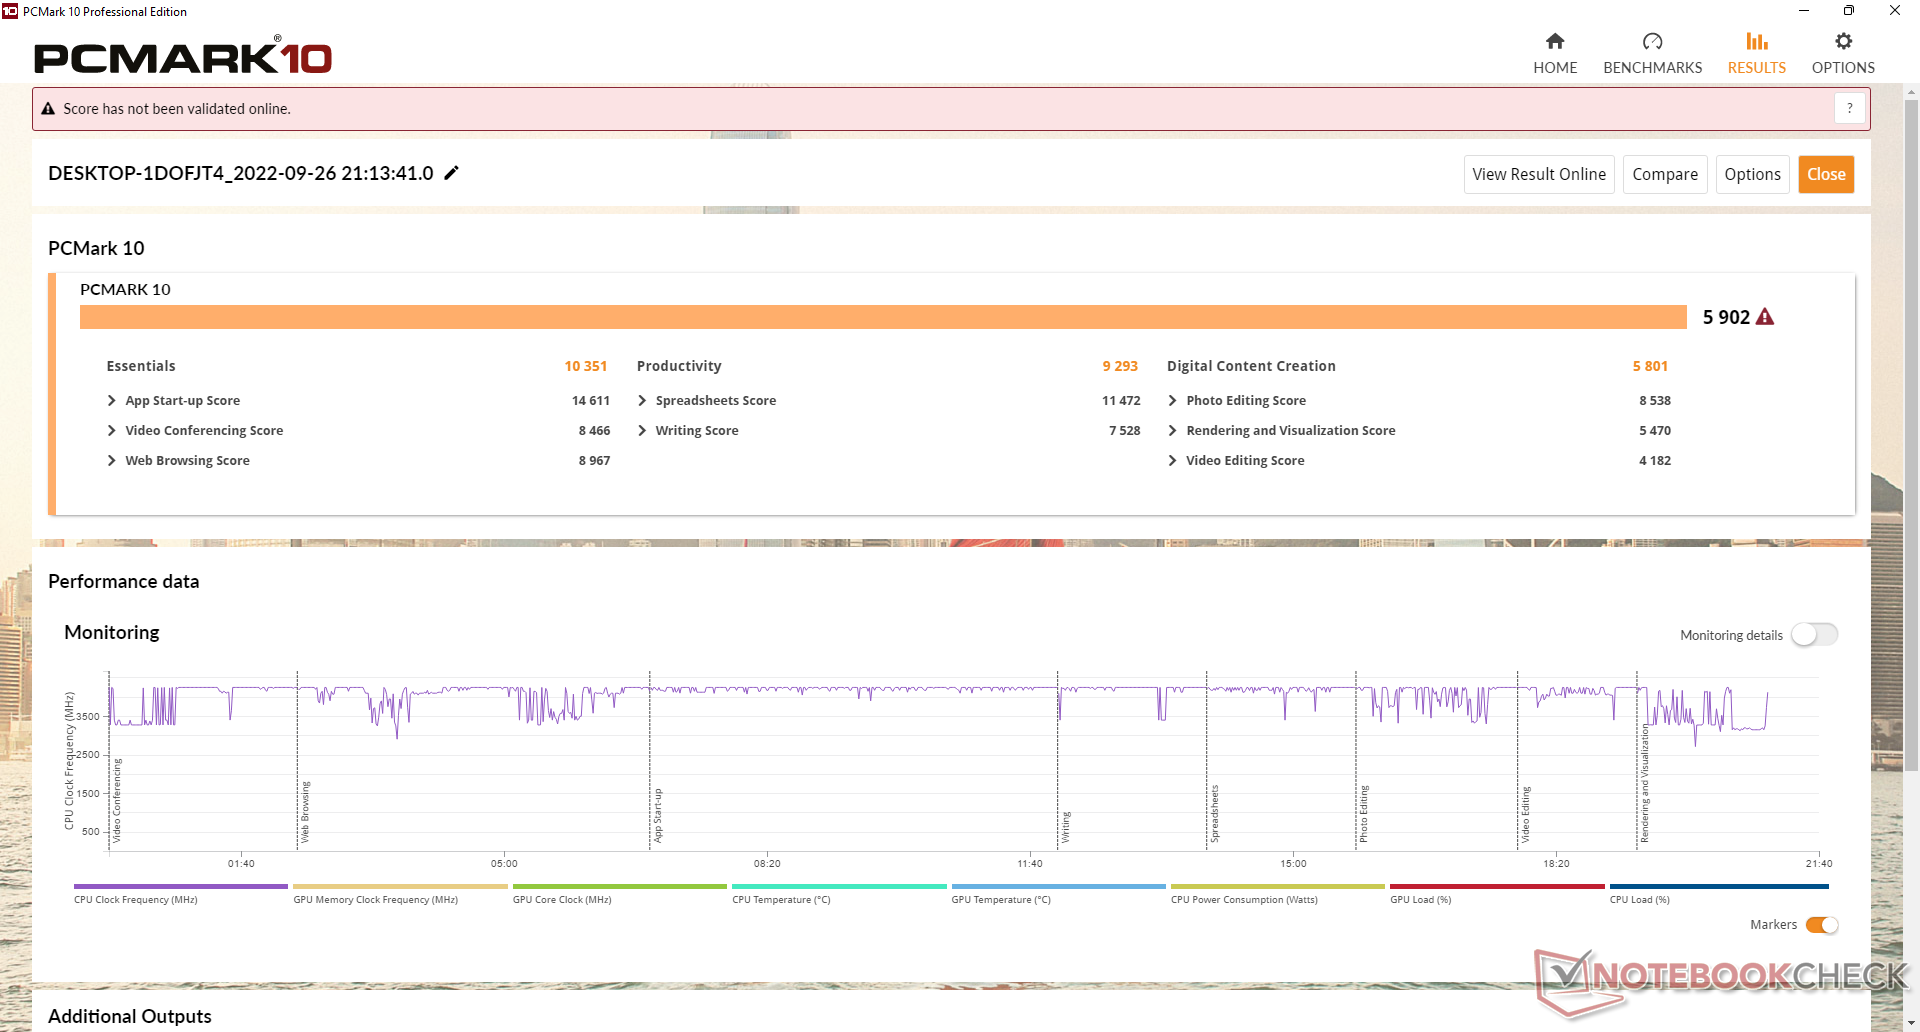
System Performance
PCMark 10 results are where we expect them to be when compared to other Ryzen 5 5600H laptops or mini PCs except in the Digital Content Creation subtest where GPU performance matters most. This is because many laptops with this same processor typically ship with faster discrete graphics instead.
CrossMark: Overall | Productivity | Creativity | Responsiveness
| PCMark 10 / Score | |
| Beelink GTR5 | |
| Average AMD Ryzen 5 5600H (5309 - 7091, n=14) | |
| Beelink SER Pro Ryzen 5 5600H | |
| Beelink SEi11 Pro | |
| Intel NUC11TNKi5 | |
| Intel NUC10i7FNH | |
| PCMark 10 / Essentials | |
| Beelink GTR5 | |
| Beelink SER Pro Ryzen 5 5600H | |
| Beelink SEi11 Pro | |
| Average AMD Ryzen 5 5600H (9326 - 10506, n=14) | |
| Intel NUC10i7FNH | |
| Intel NUC11TNKi5 | |
| PCMark 10 / Productivity | |
| Beelink GTR5 | |
| Beelink SER Pro Ryzen 5 5600H | |
| Average AMD Ryzen 5 5600H (7975 - 9642, n=14) | |
| Beelink SEi11 Pro | |
| Intel NUC10i7FNH | |
| Intel NUC11TNKi5 | |
| PCMark 10 / Digital Content Creation | |
| Average AMD Ryzen 5 5600H (4921 - 9907, n=14) | |
| Beelink GTR5 | |
| Beelink SER Pro Ryzen 5 5600H | |
| Beelink SEi11 Pro | |
| Intel NUC11TNKi5 | |
| Intel NUC10i7FNH | |
| CrossMark / Overall | |
| Beelink GTR5 | |
| Beelink SEi11 Pro | |
| Beelink SER Pro Ryzen 5 5600H | |
| Average AMD Ryzen 5 5600H (1157 - 1353, n=7) | |
| CrossMark / Productivity | |
| Beelink GTR5 | |
| Beelink SEi11 Pro | |
| Beelink SER Pro Ryzen 5 5600H | |
| Average AMD Ryzen 5 5600H (1217 - 1384, n=7) | |
| CrossMark / Creativity | |
| Beelink GTR5 | |
| Average AMD Ryzen 5 5600H (1184 - 1377, n=7) | |
| Beelink SER Pro Ryzen 5 5600H | |
| Beelink SEi11 Pro | |
| CrossMark / Responsiveness | |
| Beelink SEi11 Pro | |
| Beelink GTR5 | |
| Beelink SER Pro Ryzen 5 5600H | |
| Average AMD Ryzen 5 5600H (926 - 1225, n=7) | |
| PCMark 10 Score | 5902 points | |
Help | ||
| AIDA64 / Memory Copy | |
| Beelink GTR5 | |
| Beelink SER Pro Ryzen 5 5600H | |
| Beelink SEi11 Pro | |
| Average AMD Ryzen 5 5600H (20549 - 42141, n=14) | |
| Intel NUC11TNKi5 | |
| Zotac ZBOX PI336 pico | |
| AIDA64 / Memory Read | |
| Beelink SER Pro Ryzen 5 5600H | |
| Beelink GTR5 | |
| Beelink SEi11 Pro | |
| Average AMD Ryzen 5 5600H (22917 - 47595, n=14) | |
| Intel NUC11TNKi5 | |
| Zotac ZBOX PI336 pico | |
| AIDA64 / Memory Write | |
| Beelink SEi11 Pro | |
| Beelink SER Pro Ryzen 5 5600H | |
| Beelink GTR5 | |
| Average AMD Ryzen 5 5600H (20226 - 44872, n=14) | |
| Intel NUC11TNKi5 | |
| Zotac ZBOX PI336 pico | |
| AIDA64 / Memory Latency | |
| Intel NUC11TNKi5 | |
| Beelink SEi11 Pro | |
| Beelink SER Pro Ryzen 5 5600H | |
| Beelink GTR5 | |
| Average AMD Ryzen 5 5600H (75 - 89.1, n=14) | |
| Zotac ZBOX PI336 pico | |
* ... smaller is better
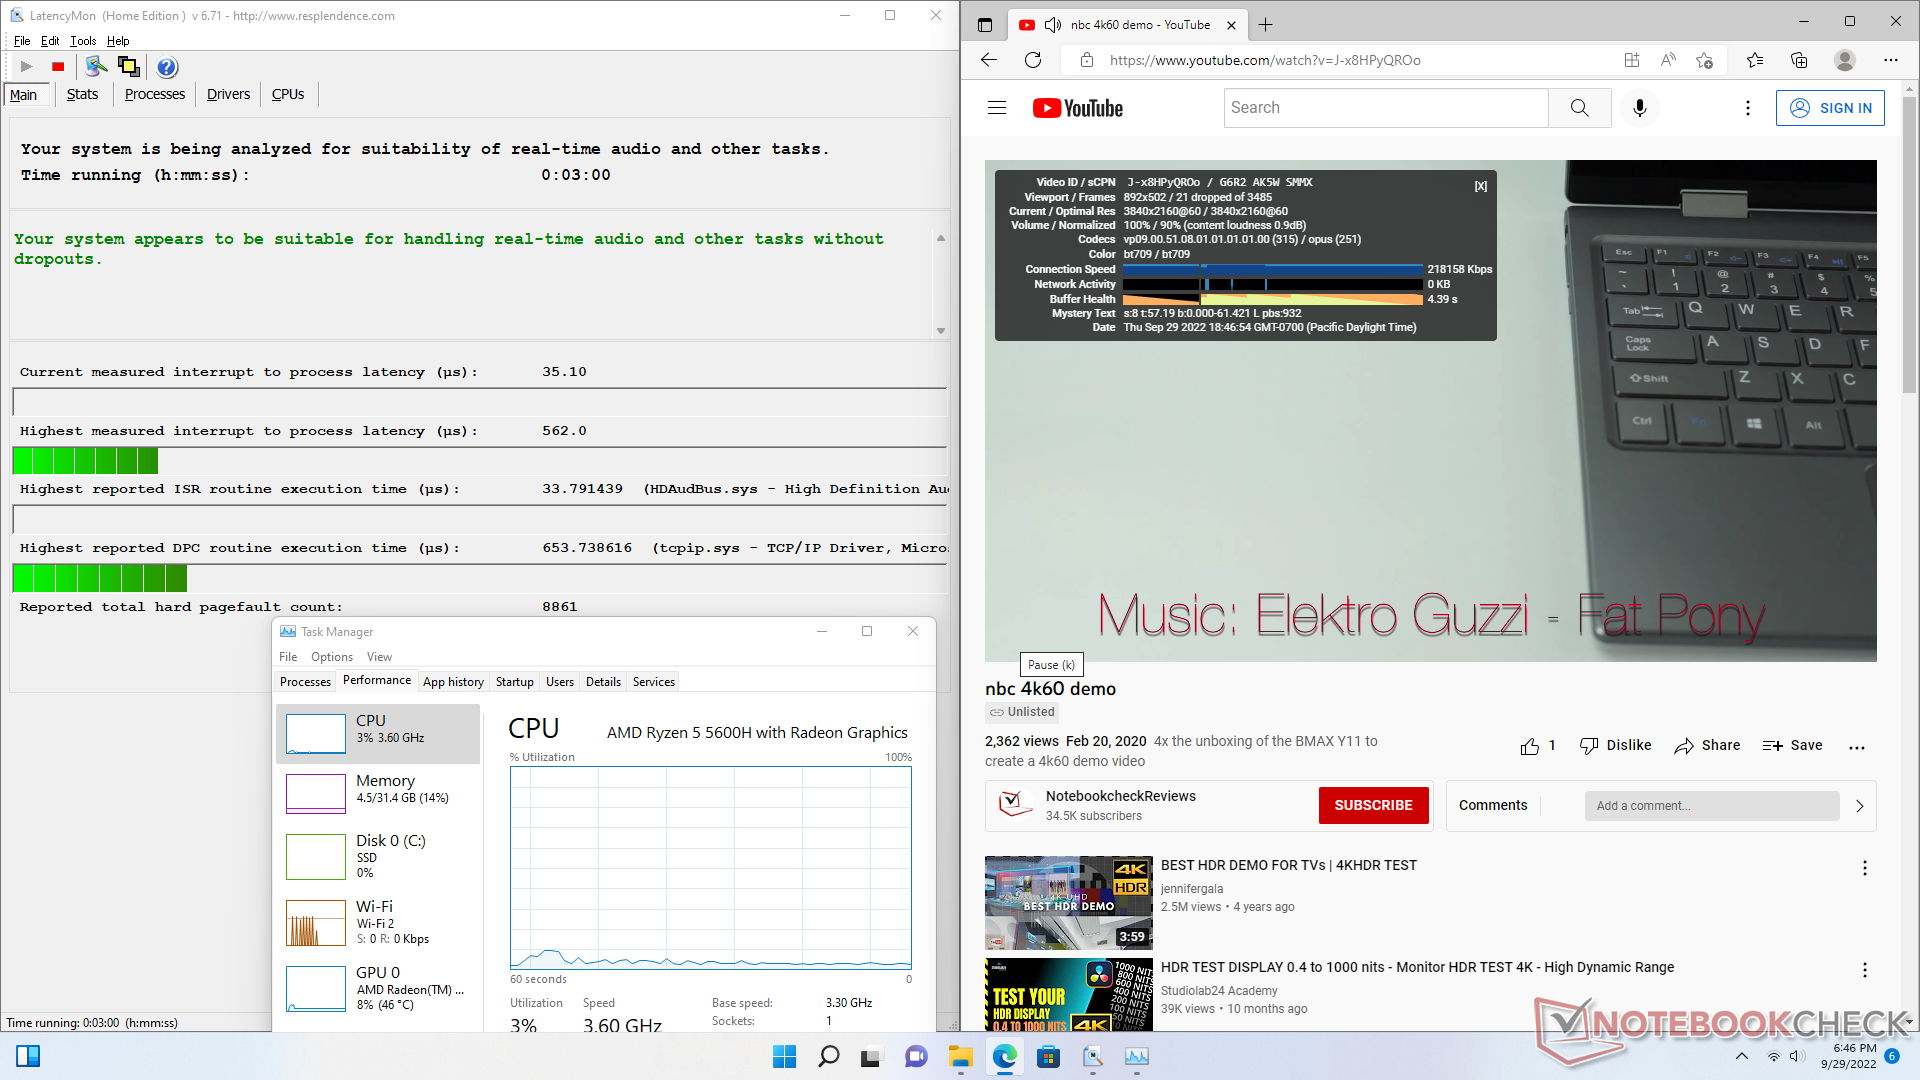
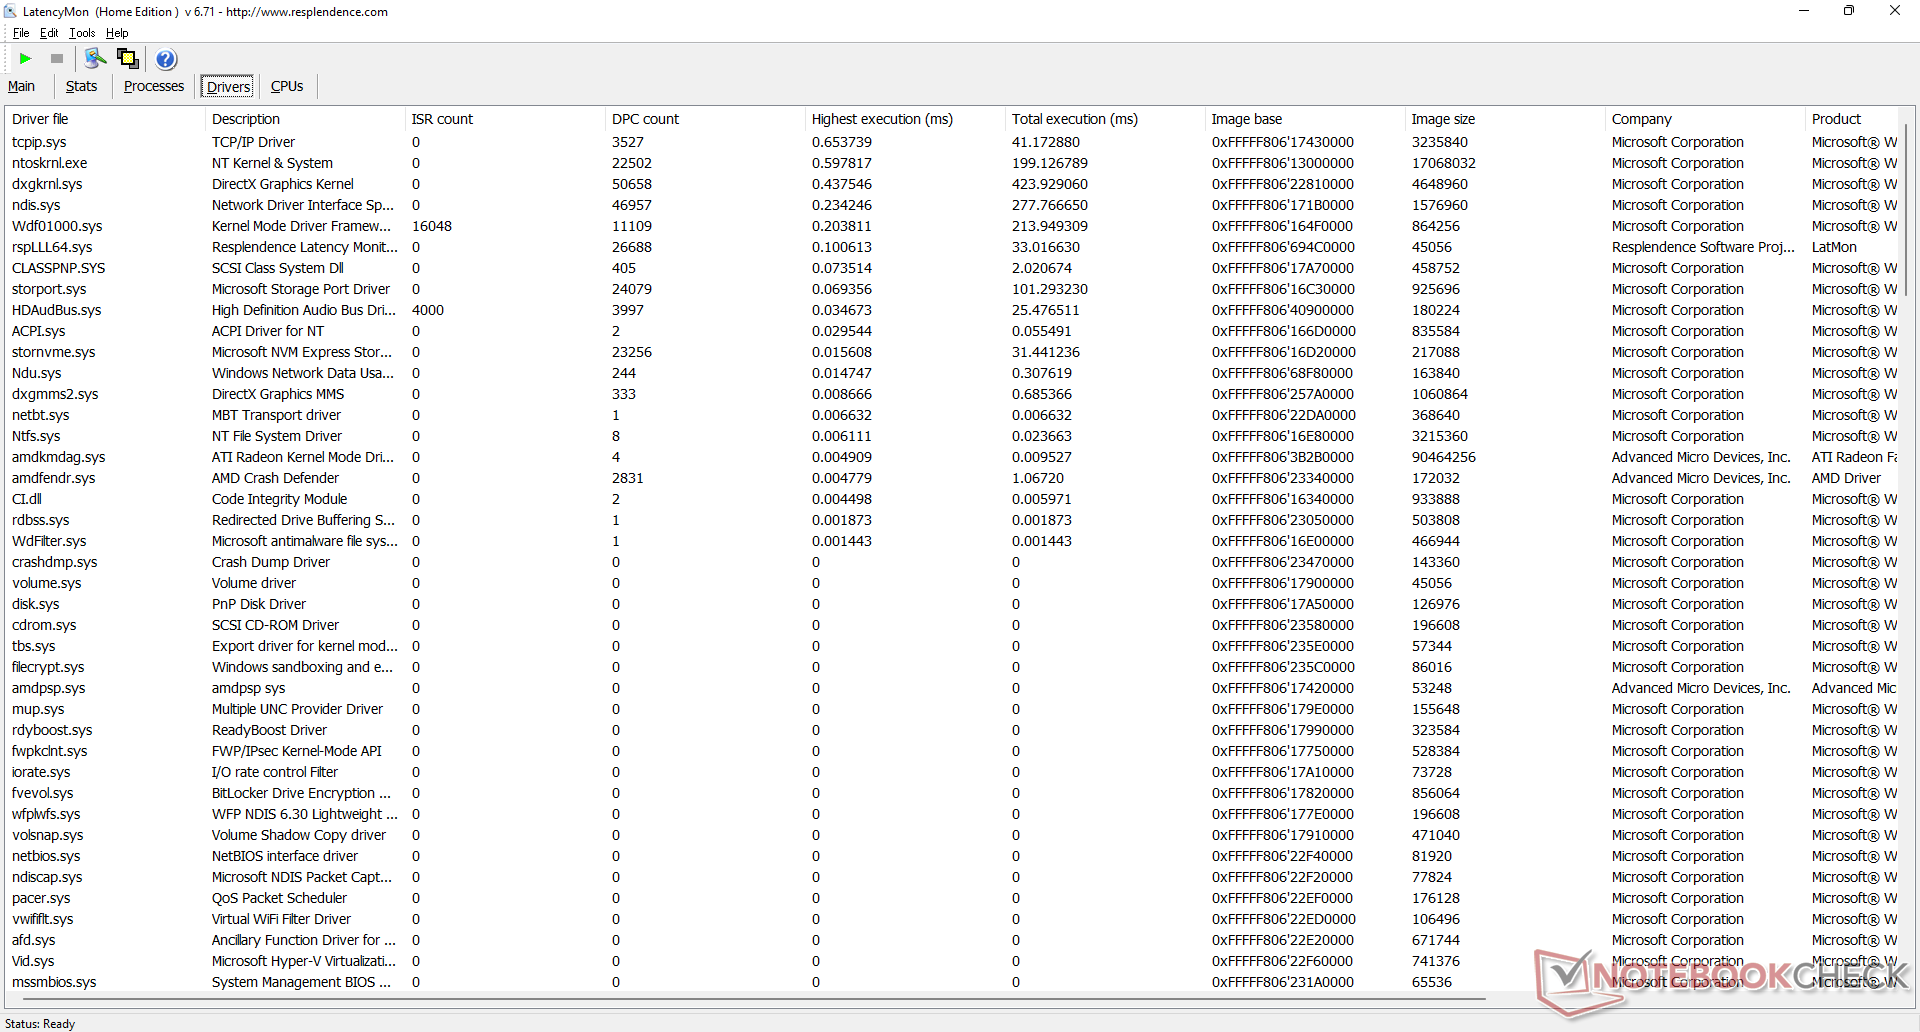
DPC Latency
LatencyMon shows no major DPC issues when opening multiple browser tabs on our homepage. Unfortunately, 4K video playback at 60 FPS is imperfect with 21 dropped frames during our minute-long video.
| DPC Latencies / LatencyMon - interrupt to process latency (max), Web, Youtube, Prime95 | |
| Zotac ZBOX PI336 pico | |
| Beelink SER Pro Ryzen 5 5600H | |
| Intel NUC11TNKi5 | |
| Beelink SEi11 Pro | |
| Beelink GTR5 | |
* ... smaller is better
Storage Devices
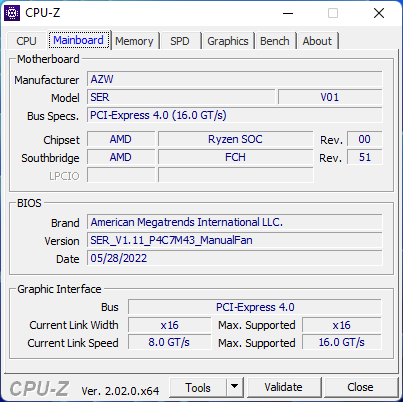
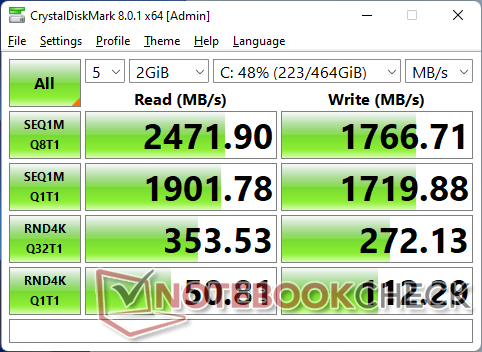
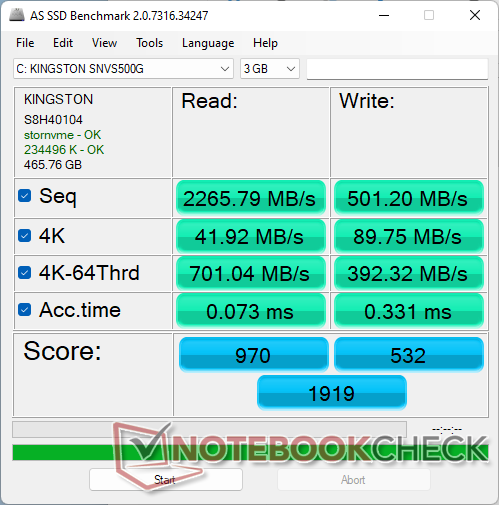
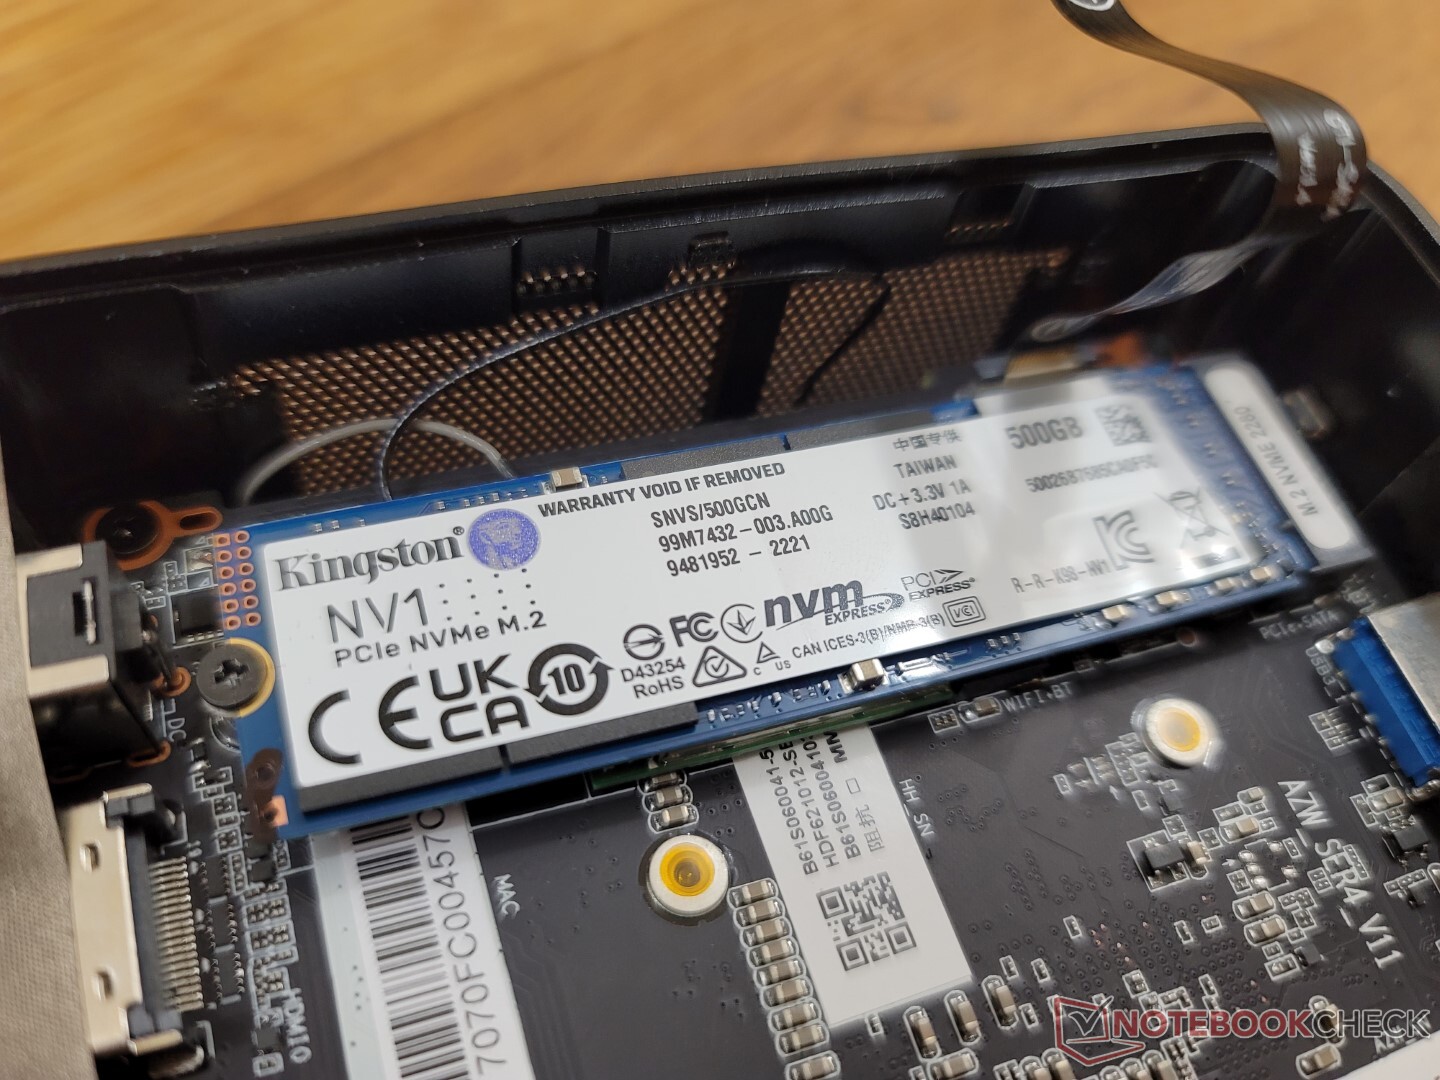
NVMe speeds are limited to PCIe3 x4 whereas most newer Intel NUC models fully support PCIe4 x4. PCIe3 is more than enough for most users, however, and so the cut corner here isn't significant. Our midrange 500 GB Kingston NV1 SSD is able to sustain its maximum ~2500 MB/s read rates without any thermal issues.

| Drive Performance Rating - Percent | |
| Beelink SER Pro Ryzen 5 5600H -11! | |
| Beelink GTR5 | |
| Beelink SEi11 Pro | |
| Intel NUC10i7FNH | |
| Intel NUC11TNKi5 | |
| Zotac ZBOX PI336 pico | |
* ... smaller is better
Disk Throttling: DiskSpd Read Loop, Queue Depth 8
GPU Performance
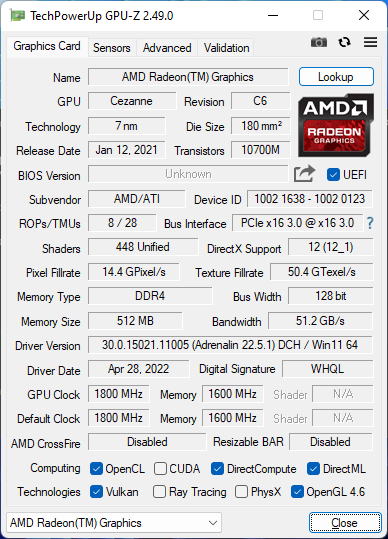
Graphics performance is much faster than most other laptops or mini PCs with the same integrated Radeon RX Vega 7 GPU by 30 to 35 percent because such products typically pair the GPU with slower Ryzen U-series CPUs or single-channel RAM only. The Ryzen 5 5600H is less of a bottleneck to the GPU and frame rates benefit as a result. It's still no gaming machine, however.
The Iris Xe 96 EUs commonly found on most 11th gen Core i7 Intel laptops or mini PCs is still about 10 to 15 percent faster.
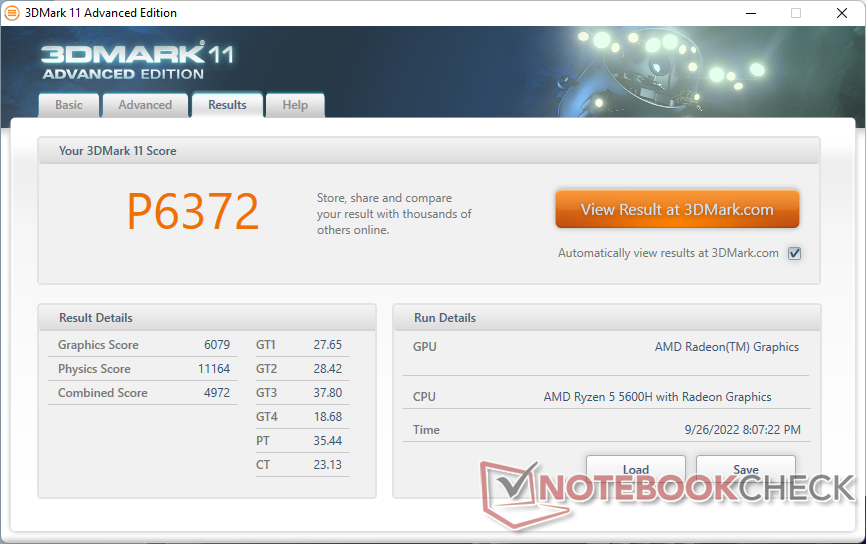
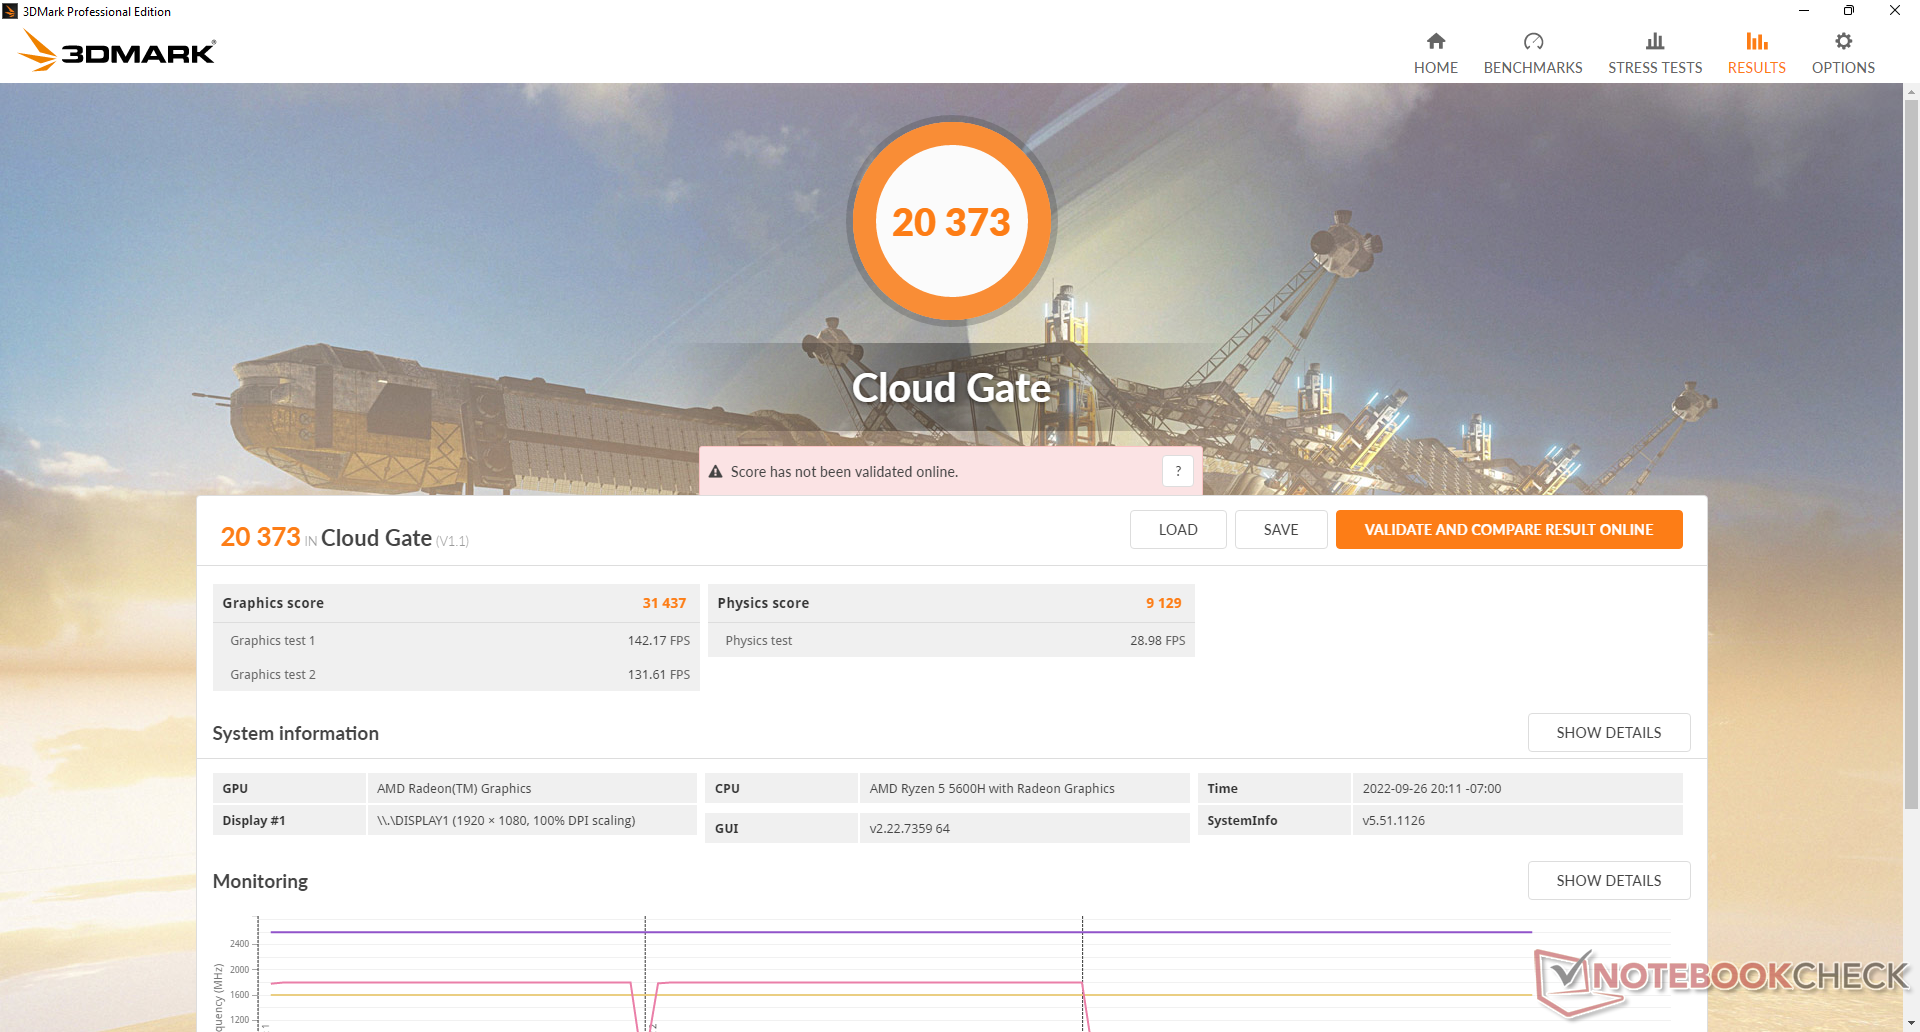
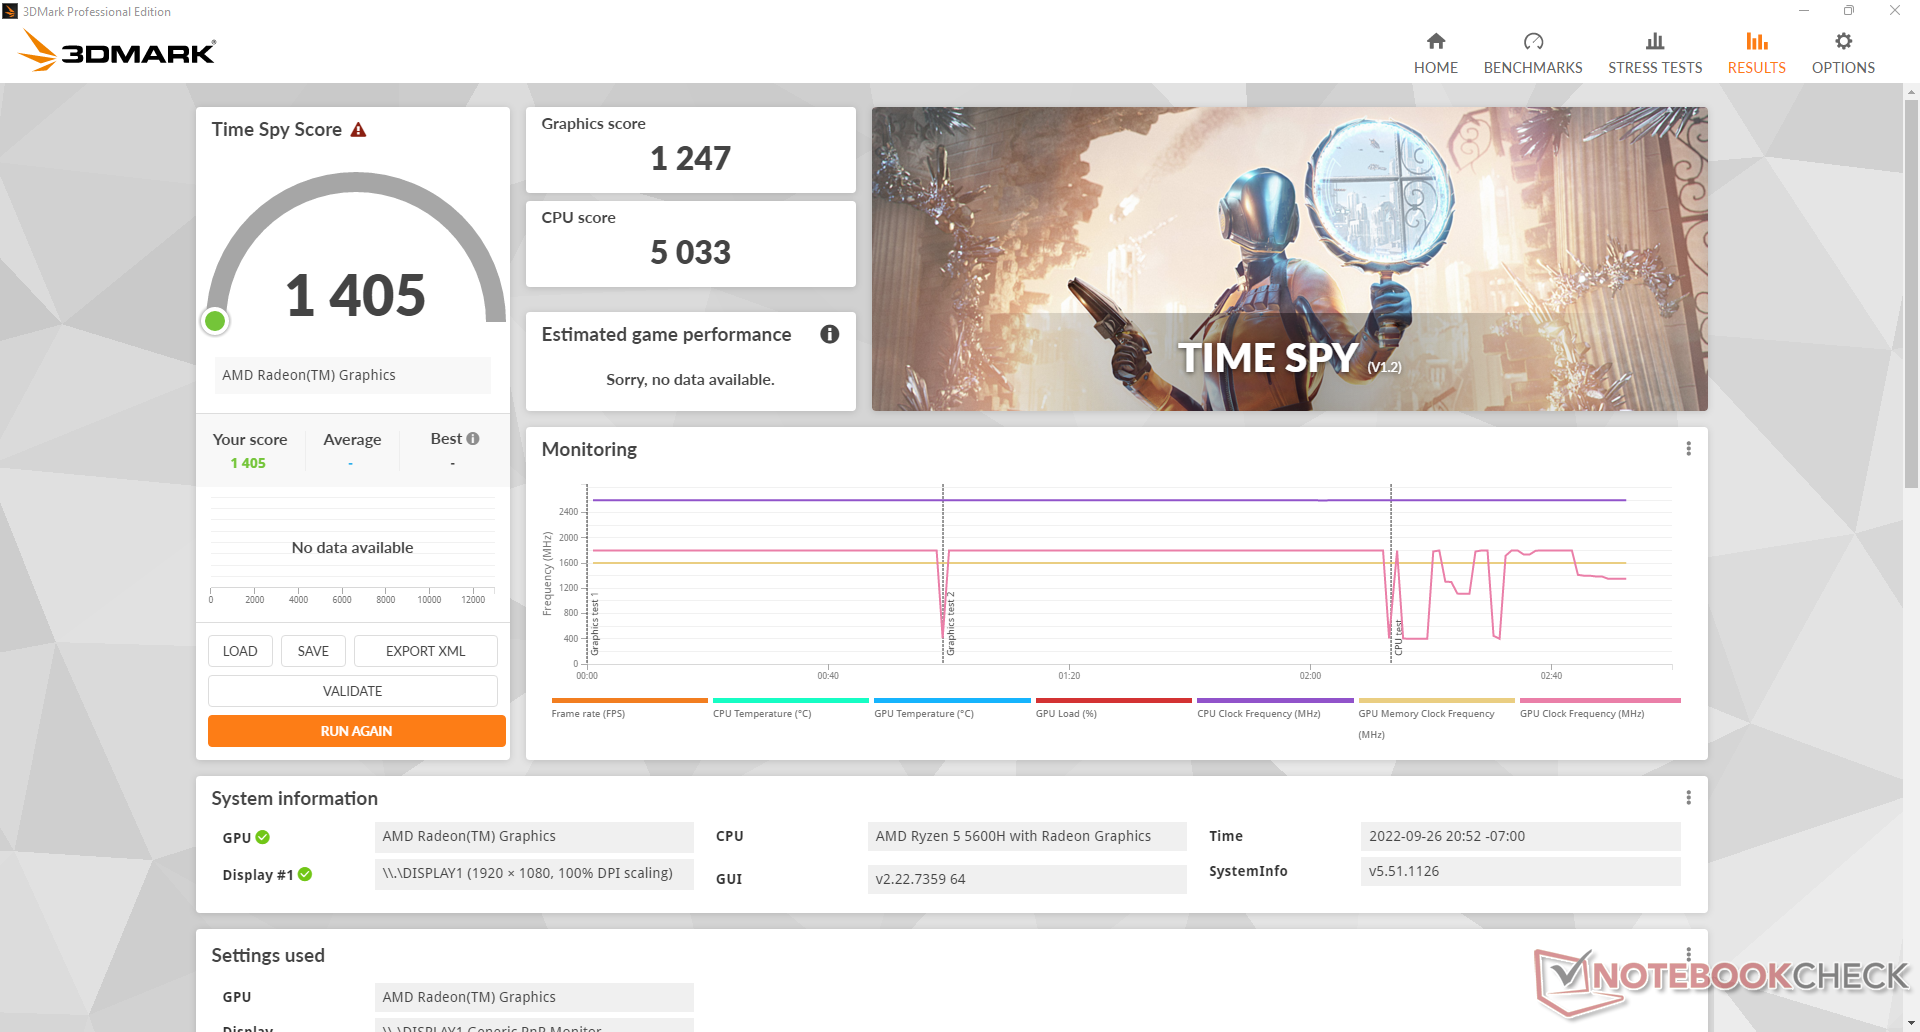
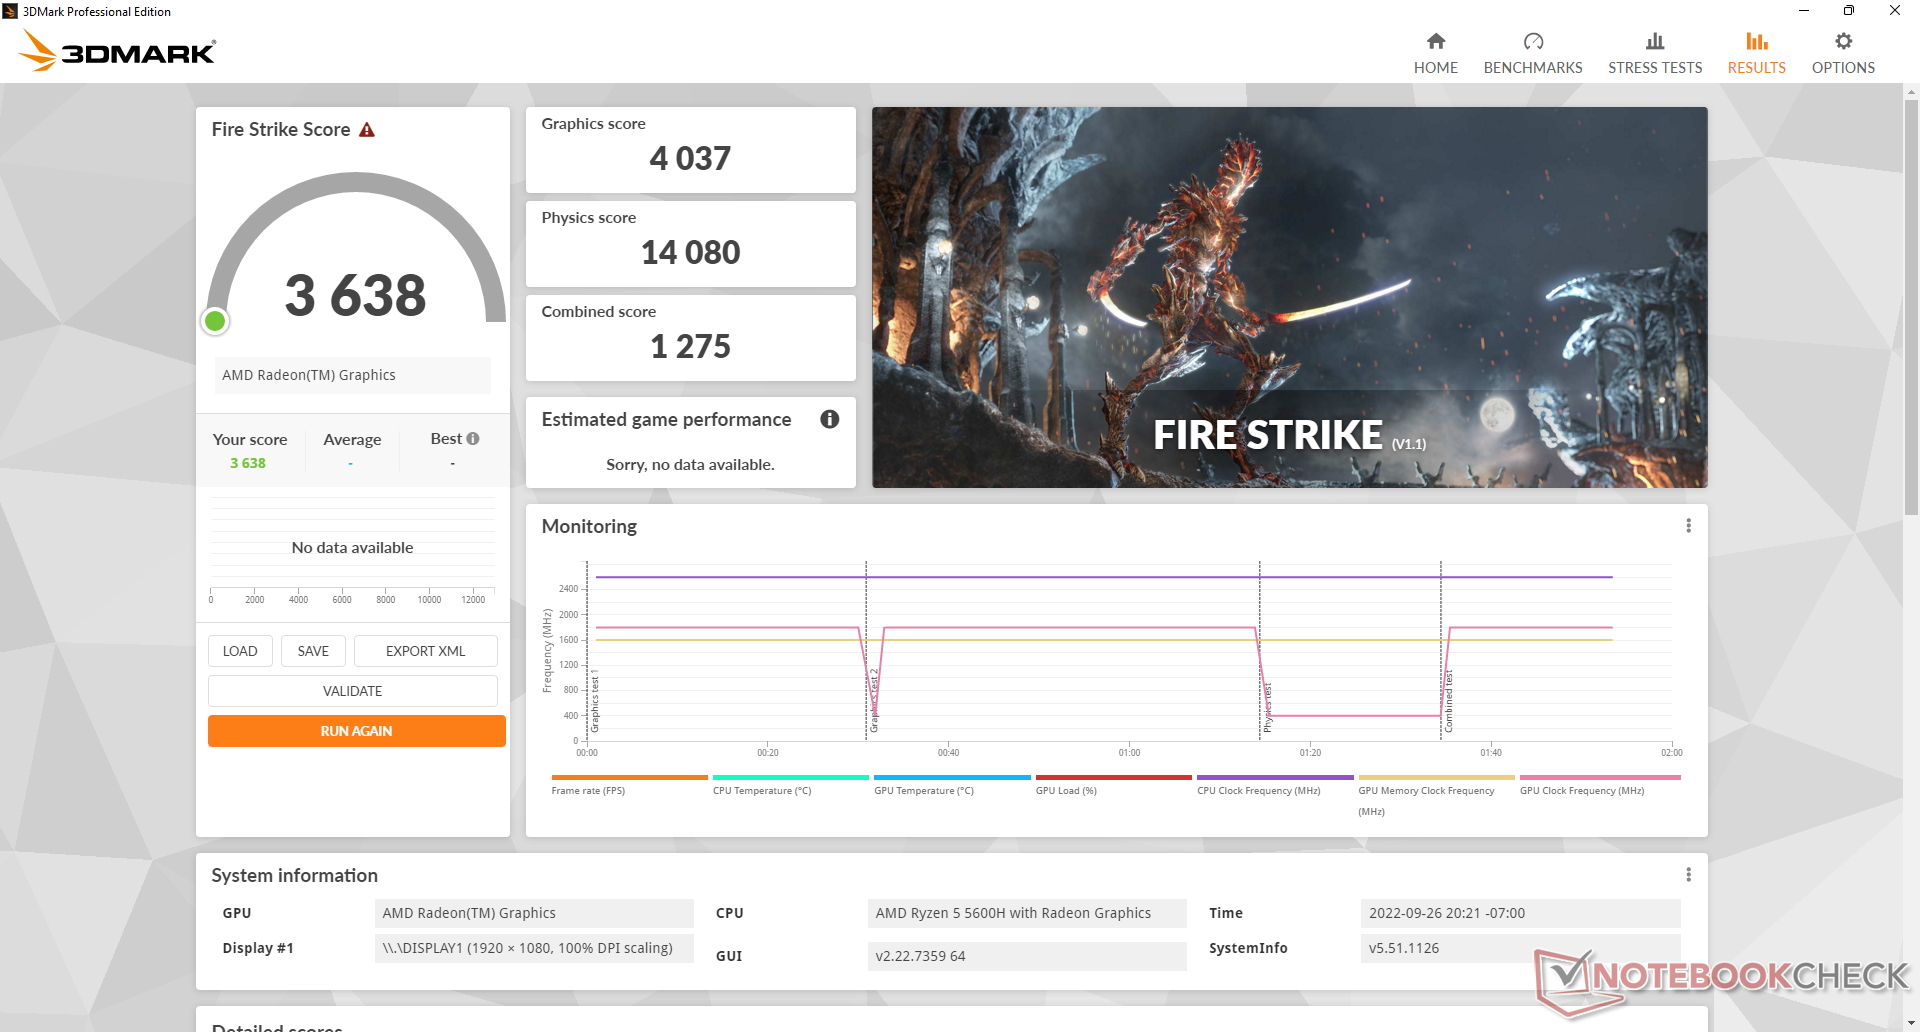
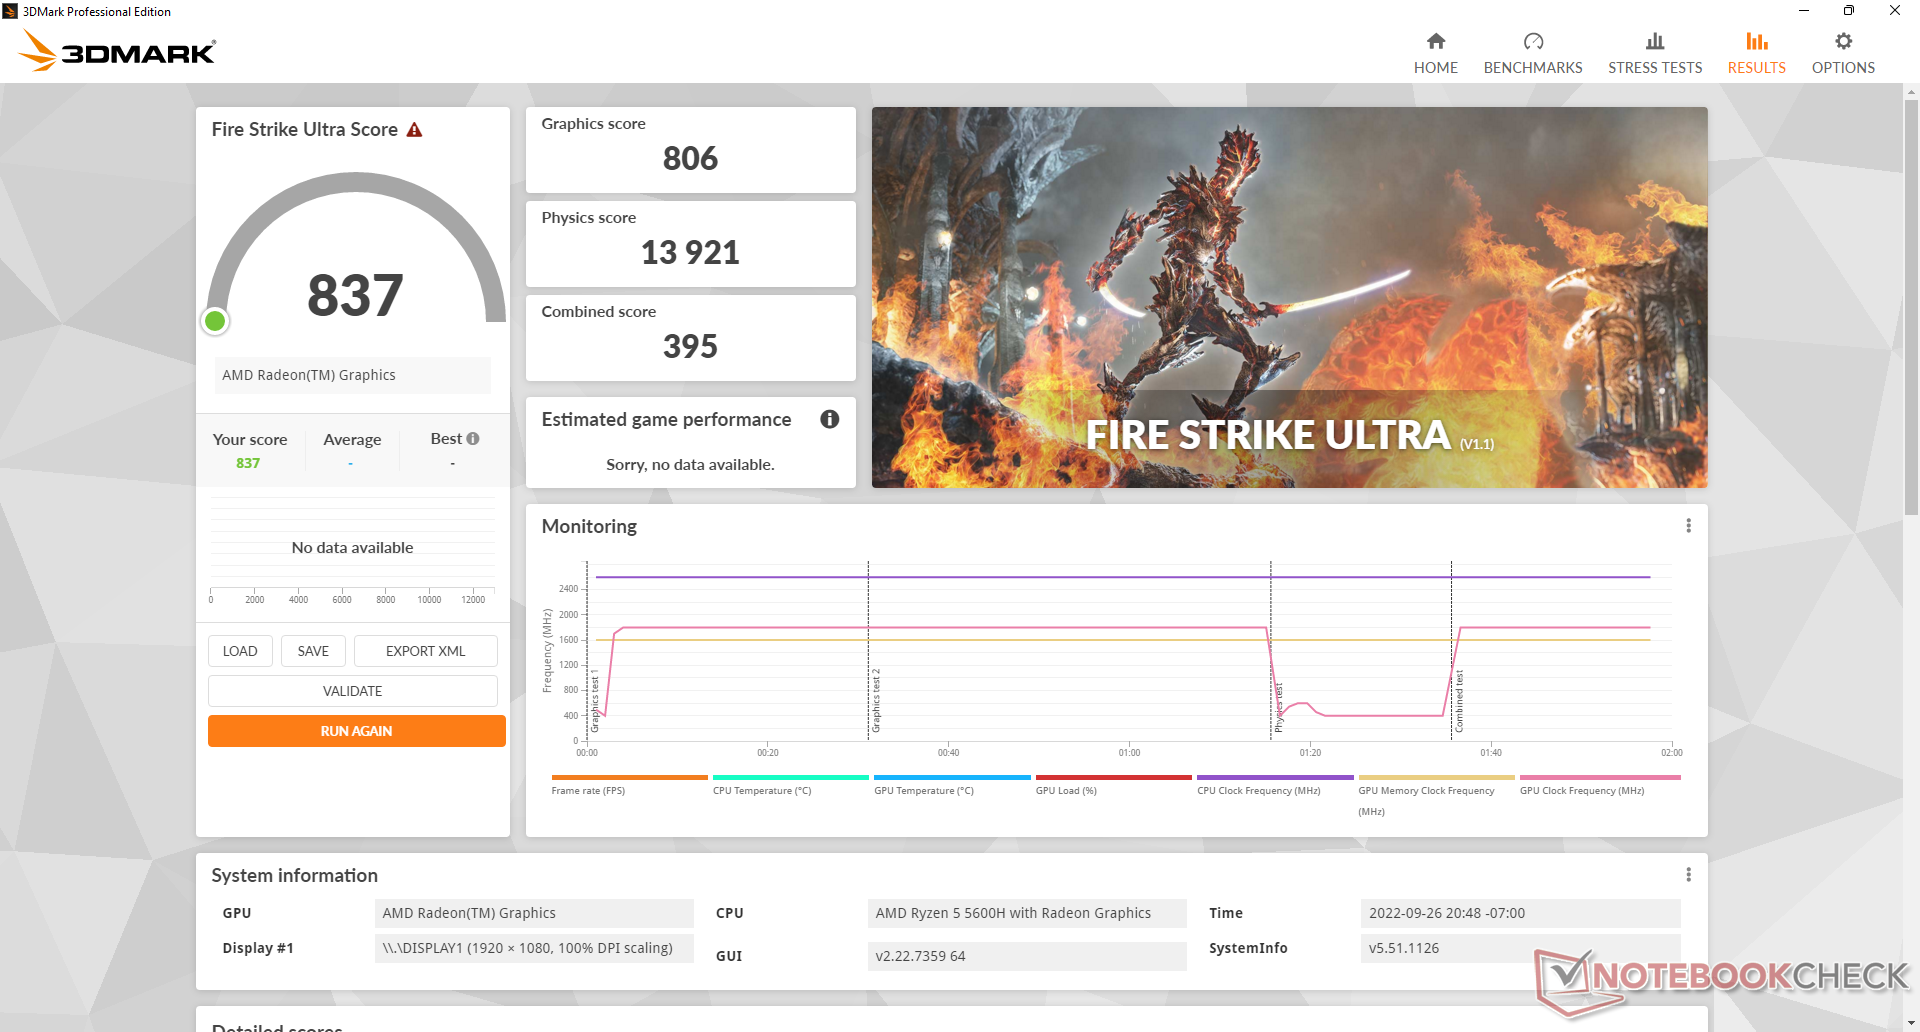
| 3DMark 11 Performance | 6372 points | |
| 3DMark Cloud Gate Standard Score | 20373 points | |
| 3DMark Fire Strike Score | 3638 points | |
| 3DMark Time Spy Score | 1405 points | |
Help | ||
| Blender - v3.3 Classroom CPU | |
| Average of class Mini PC (132 - 4297, n=108, last 2 years) | |
| Beelink SER Pro Ryzen 5 5600H | |
* ... smaller is better
| The Witcher 3 | |
| 1024x768 Low Graphics & Postprocessing | |
| Intel NUC11PHKi7C | |
| Honor MagicBook 14 2022 | |
| Lenovo Yoga 7-14ARB G7 | |
| Beelink SEi11 Pro | |
| Beelink GTR5 | |
| Beelink SER Pro Ryzen 5 5600H | |
| Beelink SER4 | |
| Intel NUC11TNKi5 | |
| Average AMD Radeon RX Vega 7 (25.5 - 105.8, n=50) | |
| 1366x768 Medium Graphics & Postprocessing | |
| Intel NUC11PHKi7C | |
| Honor MagicBook 14 2022 | |
| Lenovo Yoga 7-14ARB G7 | |
| Beelink GTR5 | |
| Beelink SEi11 Pro | |
| Beelink SER Pro Ryzen 5 5600H | |
| Beelink SER4 | |
| Average AMD Radeon RX Vega 7 (9.74 - 81.3, n=37) | |
| 1920x1080 High Graphics & Postprocessing (Nvidia HairWorks Off) | |
| Intel NUC11PHKi7C | |
| Honor MagicBook 14 2022 | |
| Lenovo Yoga 7-14ARB G7 | |
| Beelink SEi11 Pro | |
| Beelink GTR5 | |
| Beelink SER Pro Ryzen 5 5600H | |
| Beelink SER4 | |
| Average AMD Radeon RX Vega 7 (8.96 - 26.2, n=49) | |
| 1920x1080 Ultra Graphics & Postprocessing (HBAO+) | |
| Intel NUC11PHKi7C | |
| Honor MagicBook 14 2022 | |
| Lenovo Yoga 7-14ARB G7 | |
| Beelink GTR5 | |
| Beelink SER Pro Ryzen 5 5600H | |
| Beelink SER4 | |
| Beelink SEi11 Pro | |
| Average AMD Radeon RX Vega 7 (6.5 - 15.8, n=42) | |
Frame rates are unfortunately not as steady as we had hoped. When idling on Witcher 3 at low 720p settings, frame rates would sometimes drop to 60 FPS or even 19 FPS for seemingly no reason as shown by the graph below. Poor handling of background activity is likely to blame for the interruption in frame rates.
Witcher 3 FPS Chart
| low | med. | high | ultra | |
|---|---|---|---|---|
| GTA V (2015) | 132.9 | 117.6 | 32.2 | 14.5 |
| The Witcher 3 (2015) | 79.2 | 48.7 | 25.1 | 15.8 |
| Dota 2 Reborn (2015) | 137.5 | 103.1 | 59.3 | 56.3 |
| Final Fantasy XV Benchmark (2018) | 41.1 | 20.3 | 14.3 | |
| X-Plane 11.11 (2018) | 53.4 | 40.3 | 35.7 | |
| Strange Brigade (2018) | 95.3 | 36 | 30.1 | 25.5 |
| Cyberpunk 2077 1.6 (2022) | 20.9 | 16.2 | 11.4 |
Emissions
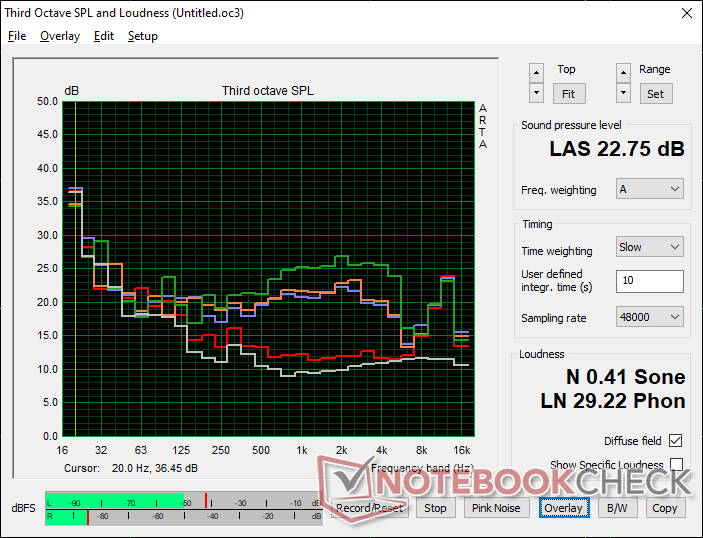
System Noise
Our test unit suffers from electronic noise or coil whine. Thus, we're able to record a noise of 26.1 dB(A) against a silent background of 22.8 dB(A) even when idling on desktop with no running applications. Fan noise would hover around the 28.7 dB(A) range during typical loads like web browsing or video streaming which is quieter than the NUC11TNK.
Fan noise ranges between 32 and 37 dB(A) when running more demanding loads like games which is again quieter than the NUC11TNK and the faster Beelink GTR5. This is a quiet mini PC relative to the performance you get.
Noise Level
| Idle |
| 26.1 / 26.1 / 28.7 dB(A) |
| Load |
| 32.3 / 36.4 dB(A) |
 | ||
30 dB silent 40 dB(A) audible 50 dB(A) loud |
||
min: | ||
| Beelink SER Pro Ryzen 5 5600H Vega 7, R5 5600H, Kingston NV1 SNVS/500GCN | Beelink SEi11 Pro Iris Xe G7 96EUs, i5-11320H, Kingston NV1 SNVS/500GCN | Beelink GTR5 Vega 8, R9 5900HX, Kingston NV1 SNVS/500GCN | Intel NUC11TNKi5 Iris Xe G7 80EUs, i5-1135G7, Transcend M.2 SSD 430S TS512GMTS430S | Beelink SEi8 Iris Plus Graphics 655, i3-8109U, Intel SSD 660p SSDPEKNW512G8 | Beelink SER4 Vega 8, R7 4800U, Intel SSD 660p SSDPEKNW512G8 | |
|---|---|---|---|---|---|---|
| Noise | 1% | -24% | -23% | -7% | -18% | |
| off / environment * | 22.8 | 22.8 -0% | 23.1 -1% | 24.8 -9% | 24.5 -7% | 23.4 -3% |
| Idle Minimum * | 26.1 | 24.7 5% | 34.2 -31% | 35.6 -36% | 26.5 -2% | 33.2 -27% |
| Idle Average * | 26.1 | 24.7 5% | 34.2 -31% | 35.6 -36% | 26.5 -2% | 33.2 -27% |
| Idle Maximum * | 28.7 | 25.3 12% | 34.2 -19% | 35.6 -24% | 31.1 -8% | 33.2 -16% |
| Load Average * | 32.3 | 33.2 -3% | 44.6 -38% | 36.2 -12% | 37.7 -17% | 38.6 -20% |
| Witcher 3 ultra * | 32.8 | 34.5 -5% | 41.4 -26% | 38 -16% | 39.2 -20% | |
| Load Maximum * | 36.4 | 37.8 -4% | 45.1 -24% | 47.6 -31% | 37.5 -3% | 40.8 -12% |
* ... smaller is better
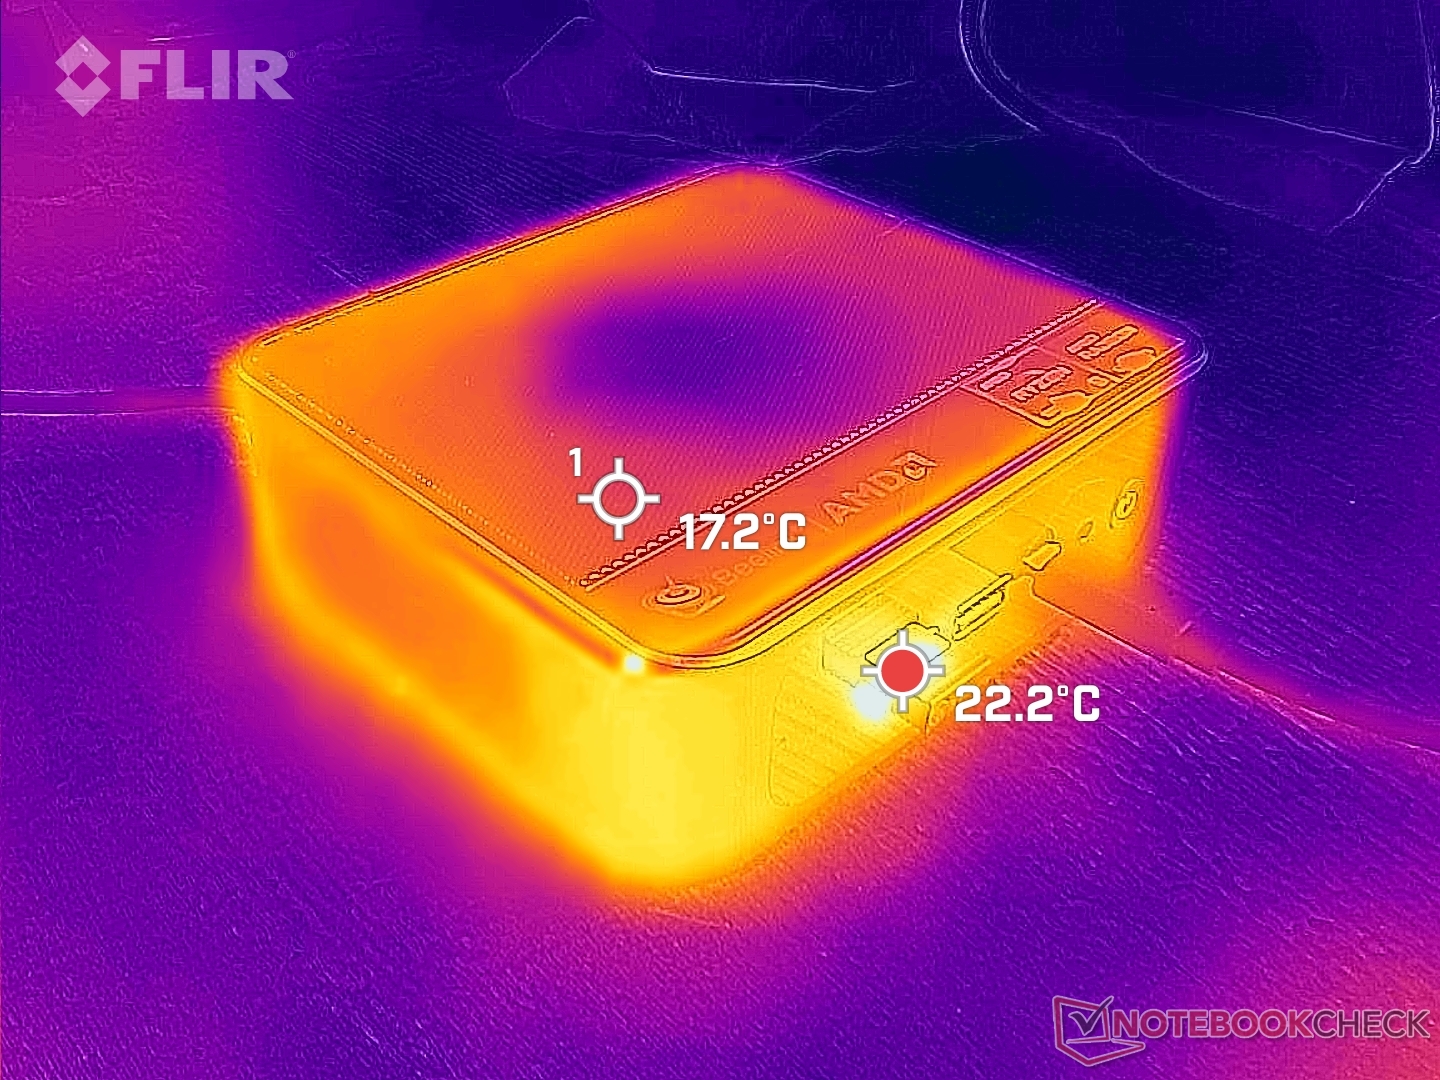
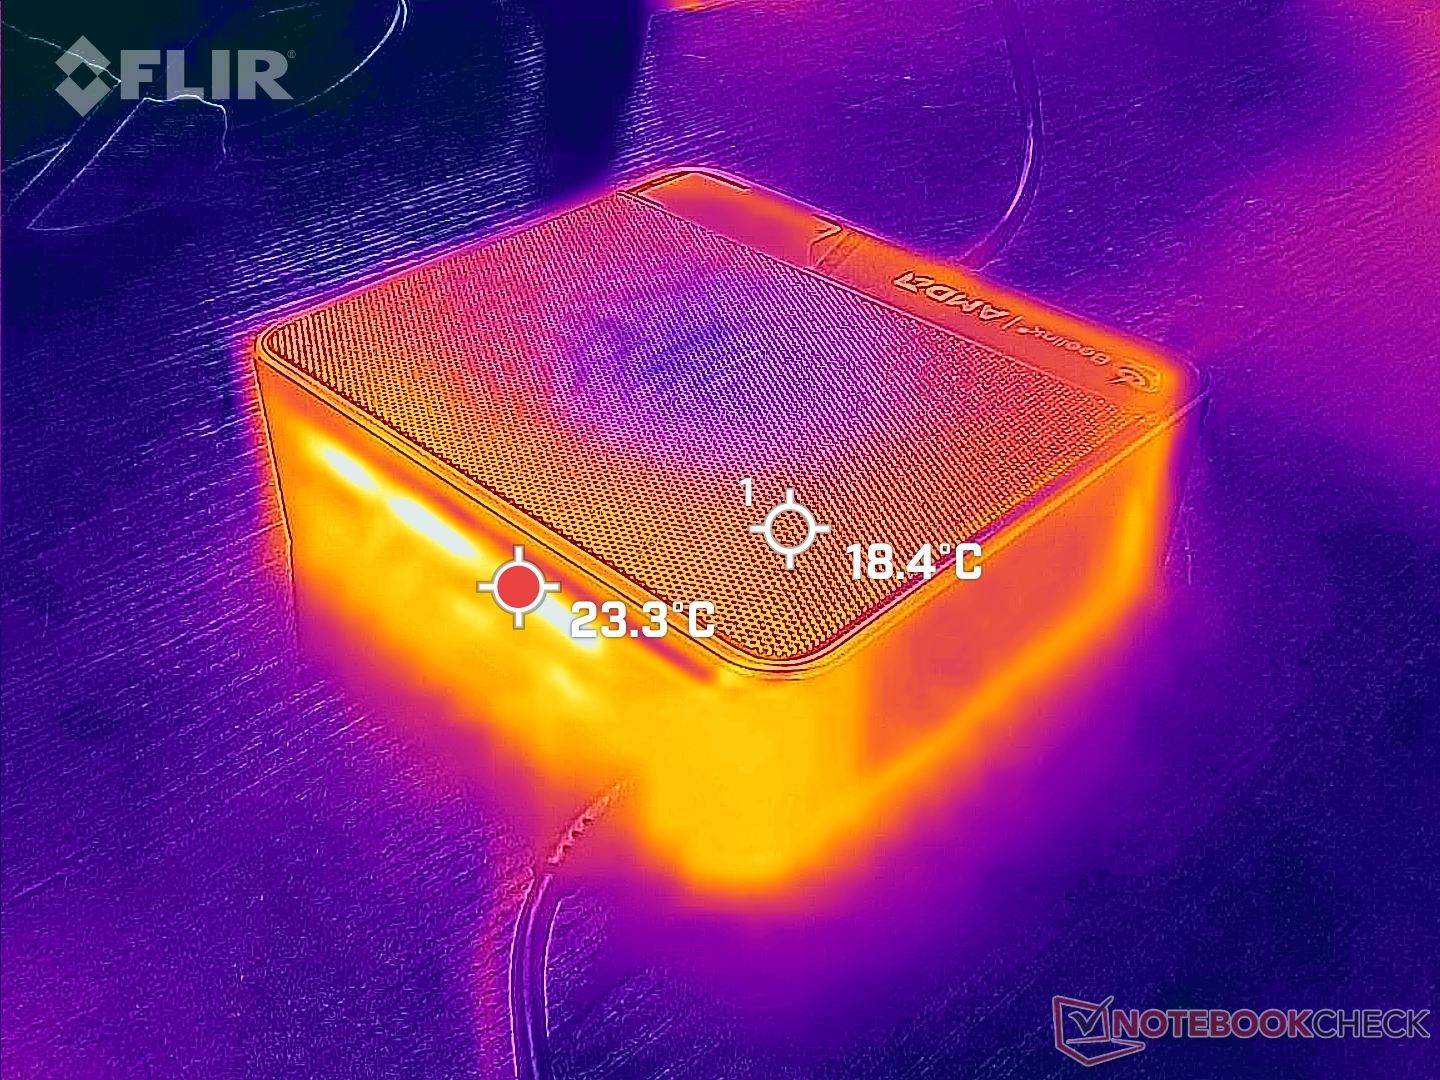
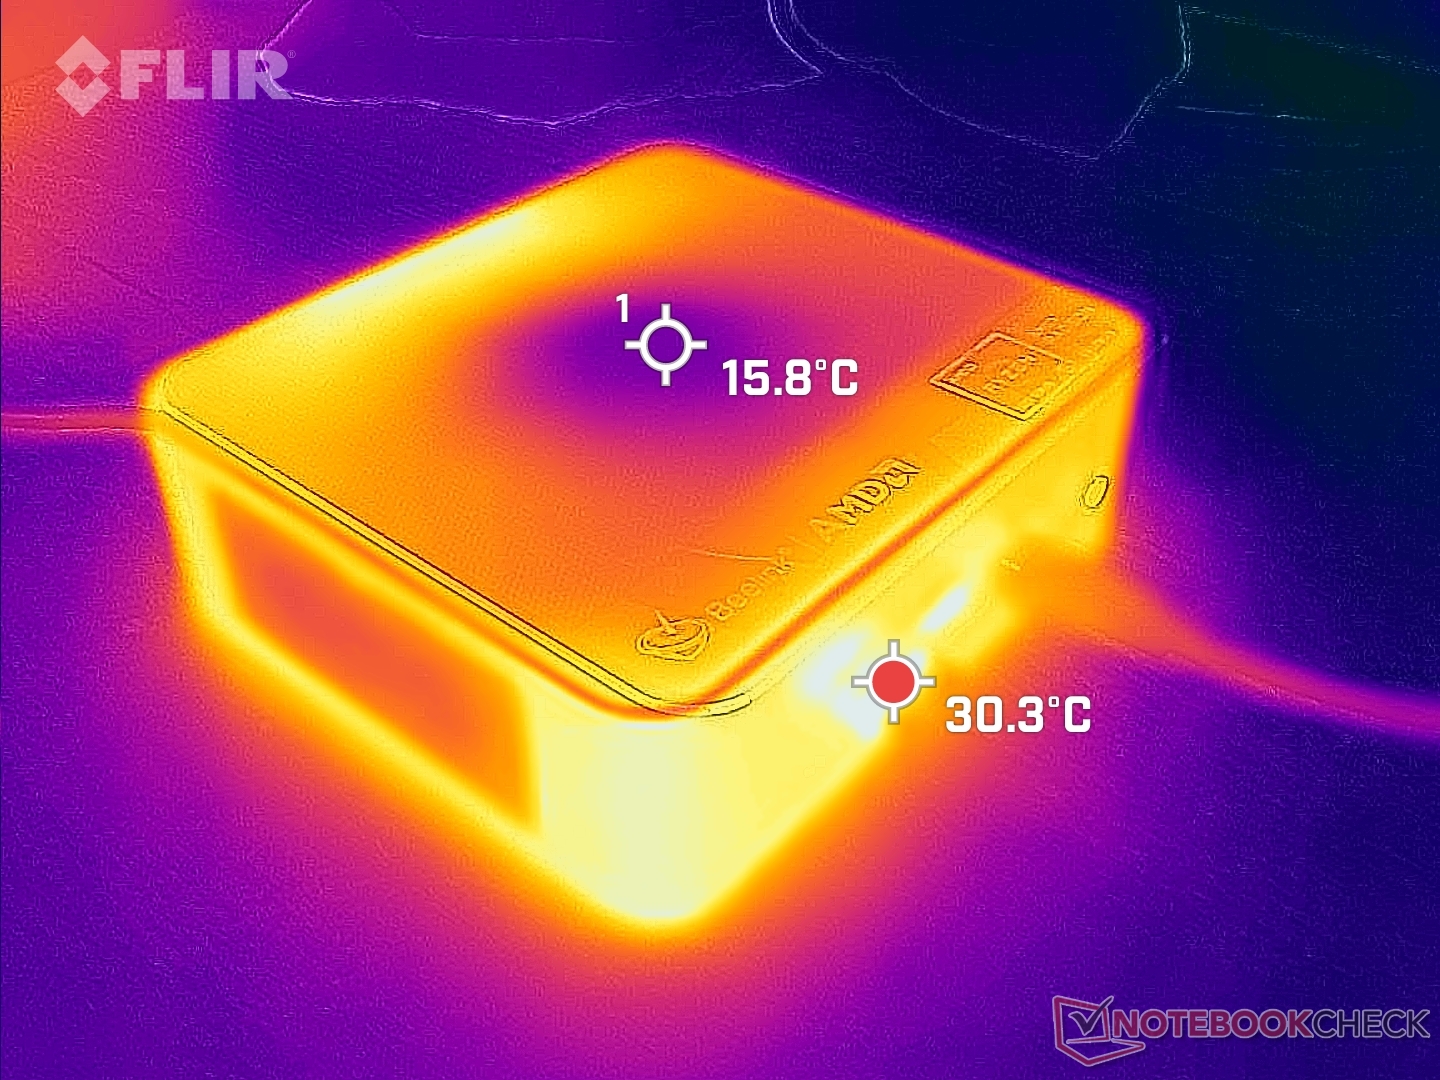
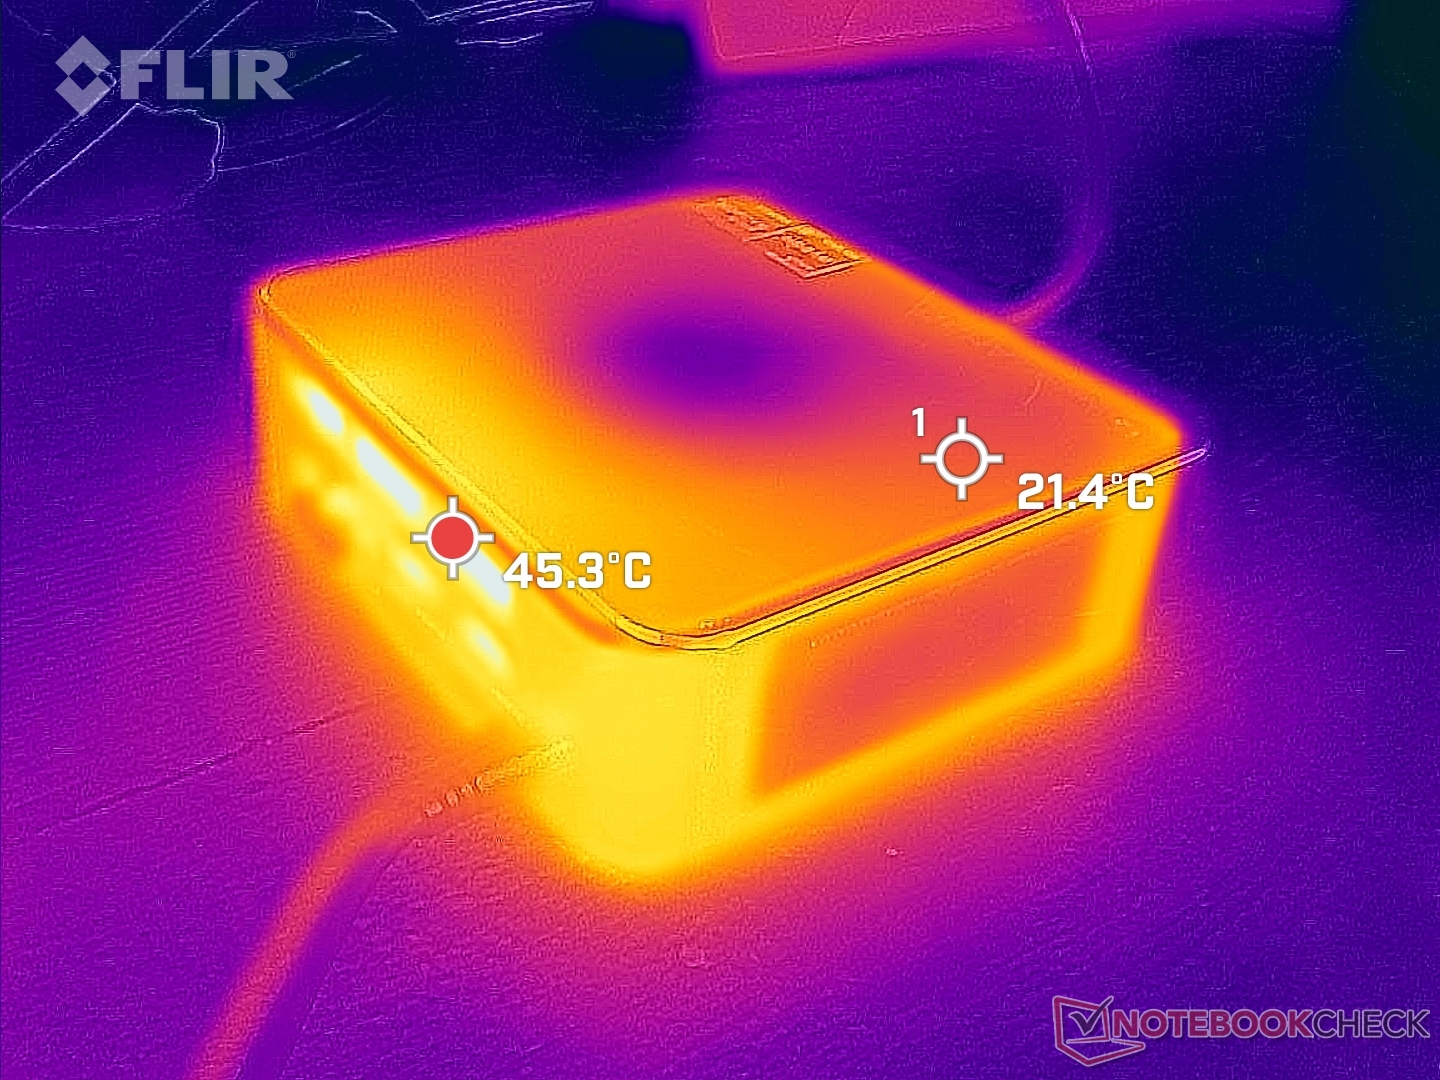
Temperature
Cool air enters from the top and waste heat exits from the rear. You're going to want to keep the top clear of any books, papers, or other obstructions for optimal cooling as a result.
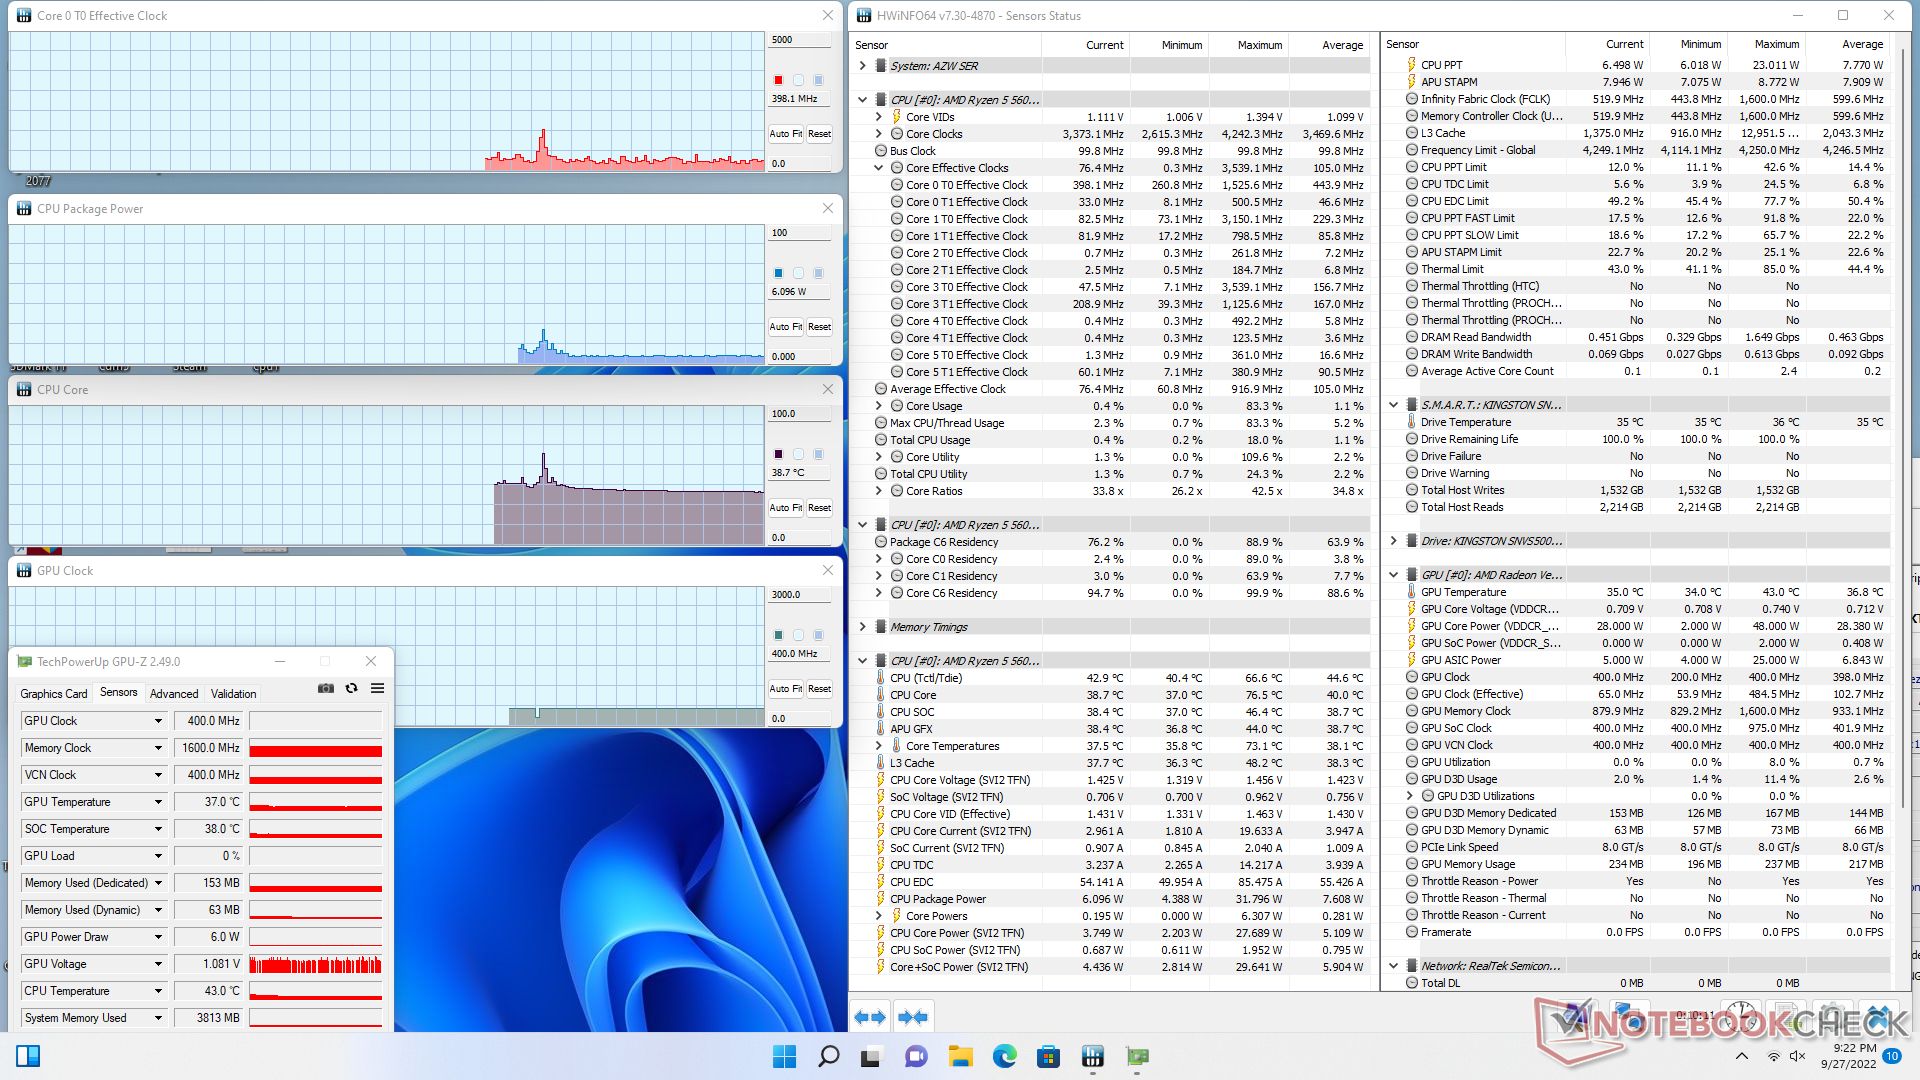
Stress Test
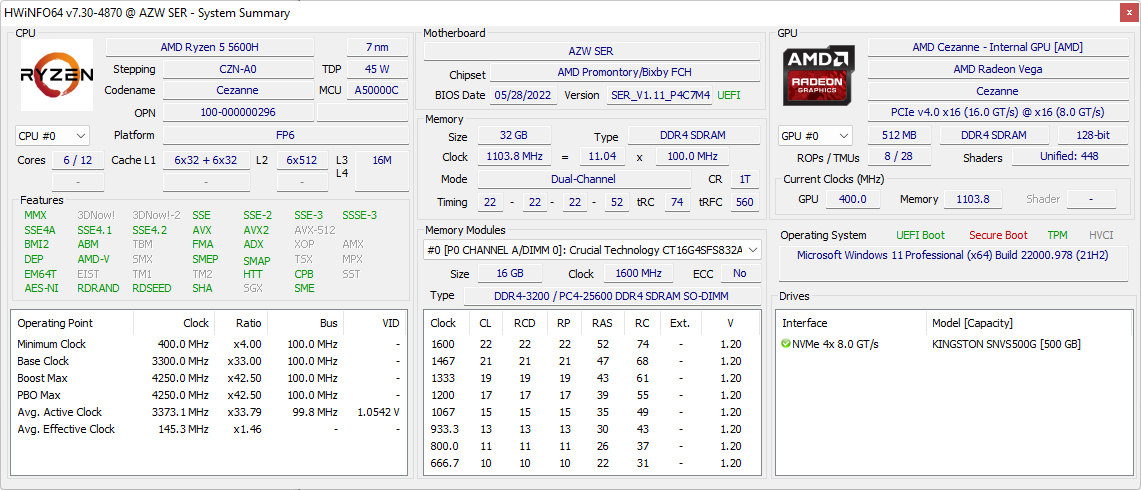
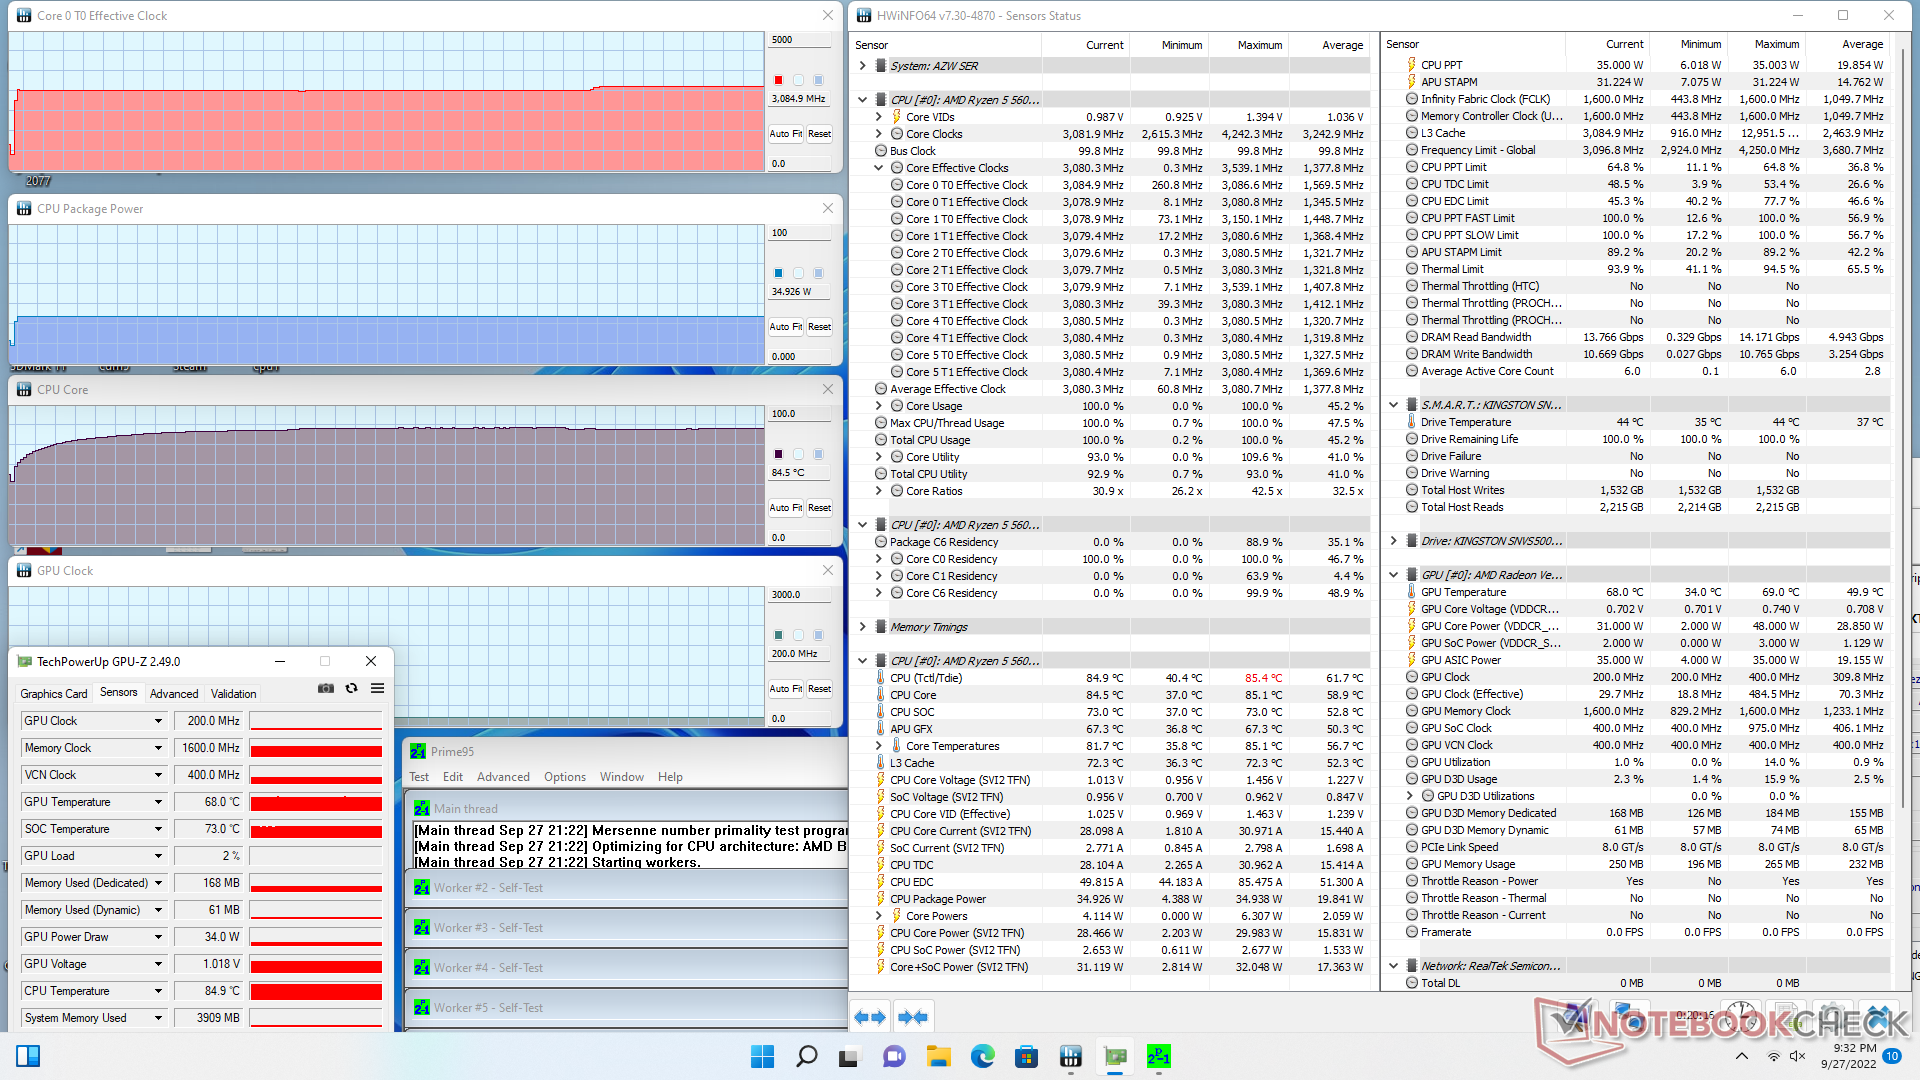
CPU clock rates and board power draw would stabilize at 3.0 GHz and 35 W, respectively, when initiating Prime95. 35 W is at the lower-end of the spectrum for the Ryzen 5 5600H and so it's a bit disappointing to not see higher TDP targets on the SER5. Core temperature is already quite high at 85 C which may explain the low 35 W rating.
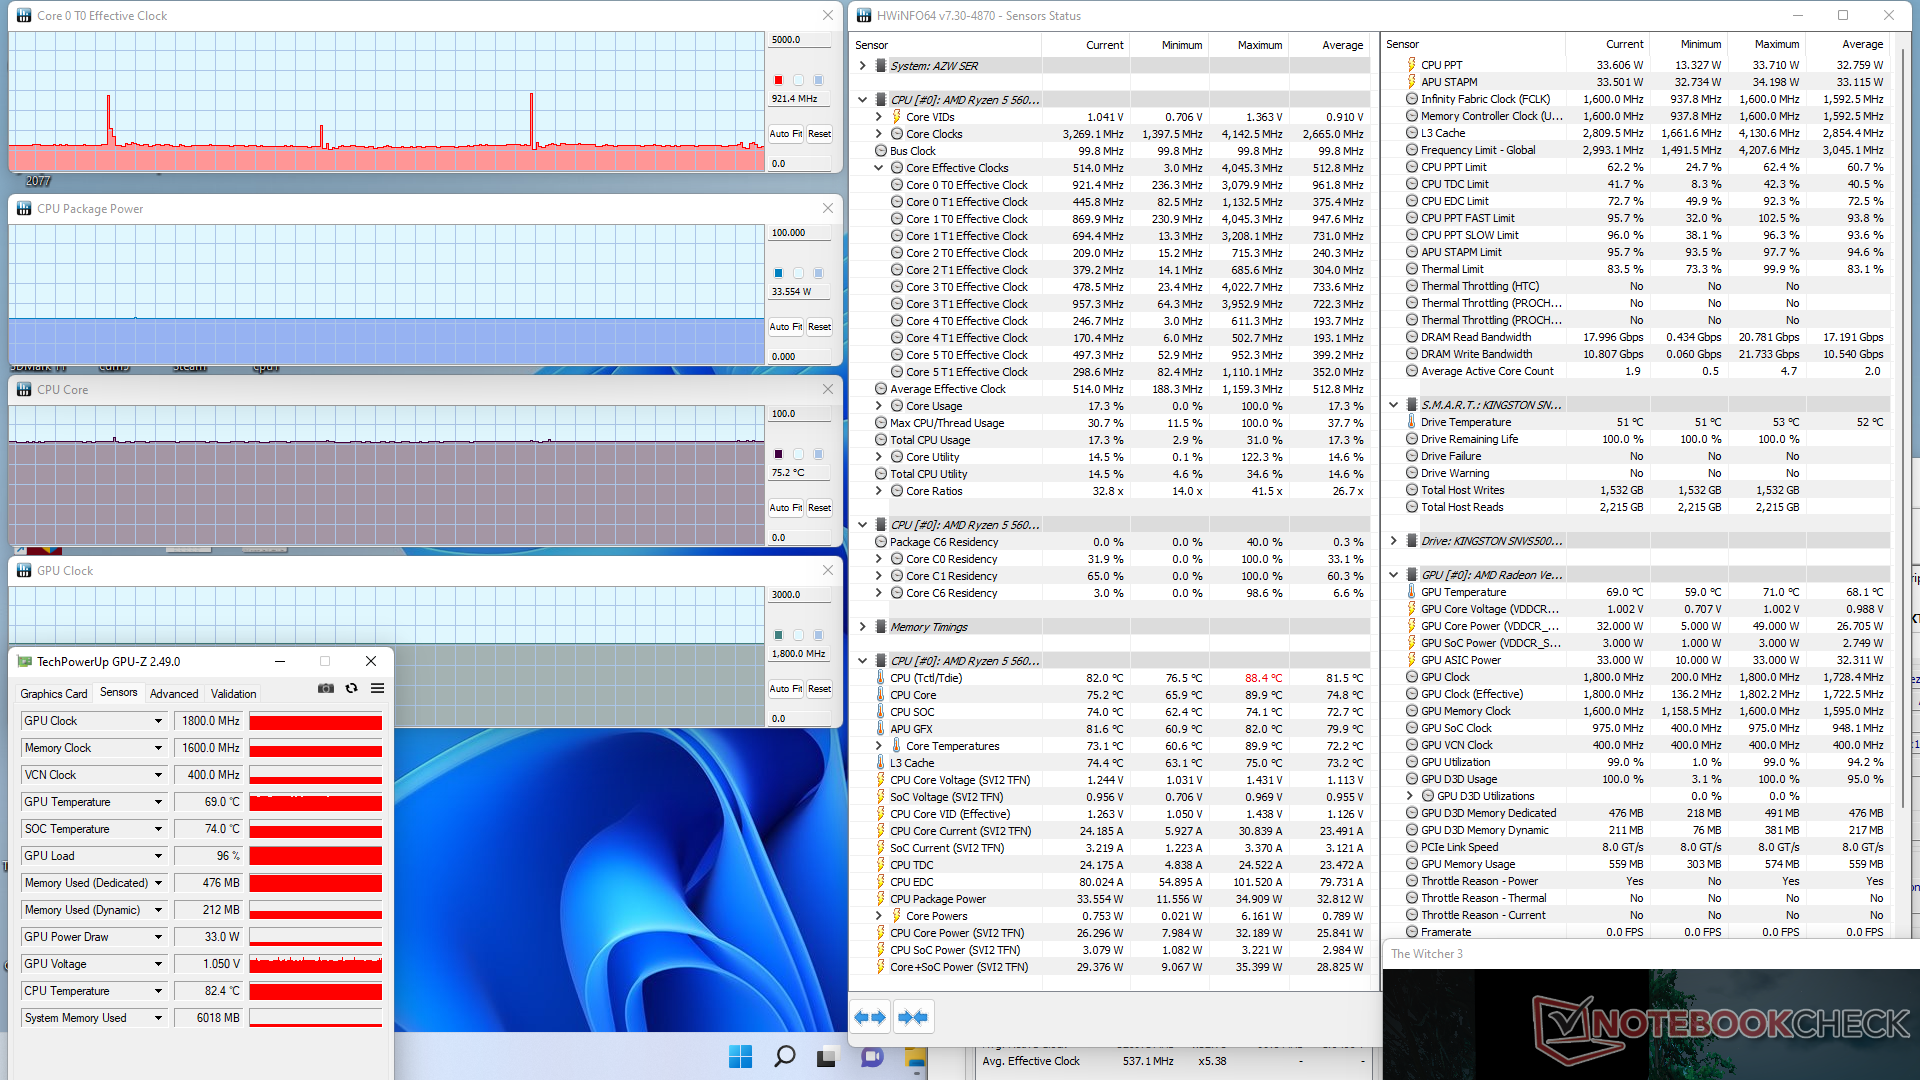
Running Witcher 3 would result in a core temperature of 75 C compared to 57 C on the Intel NUC11PAQ. The Beelink system runs a little warmer than the Intel in most conditions.
| CPU Clock (GHz) | GPU Clock (MHz) | Average CPU Temperature (°C) | |
| System Idle | -- | -- | 39 |
| Prime95 Stress | 3.0 | -- | 85 |
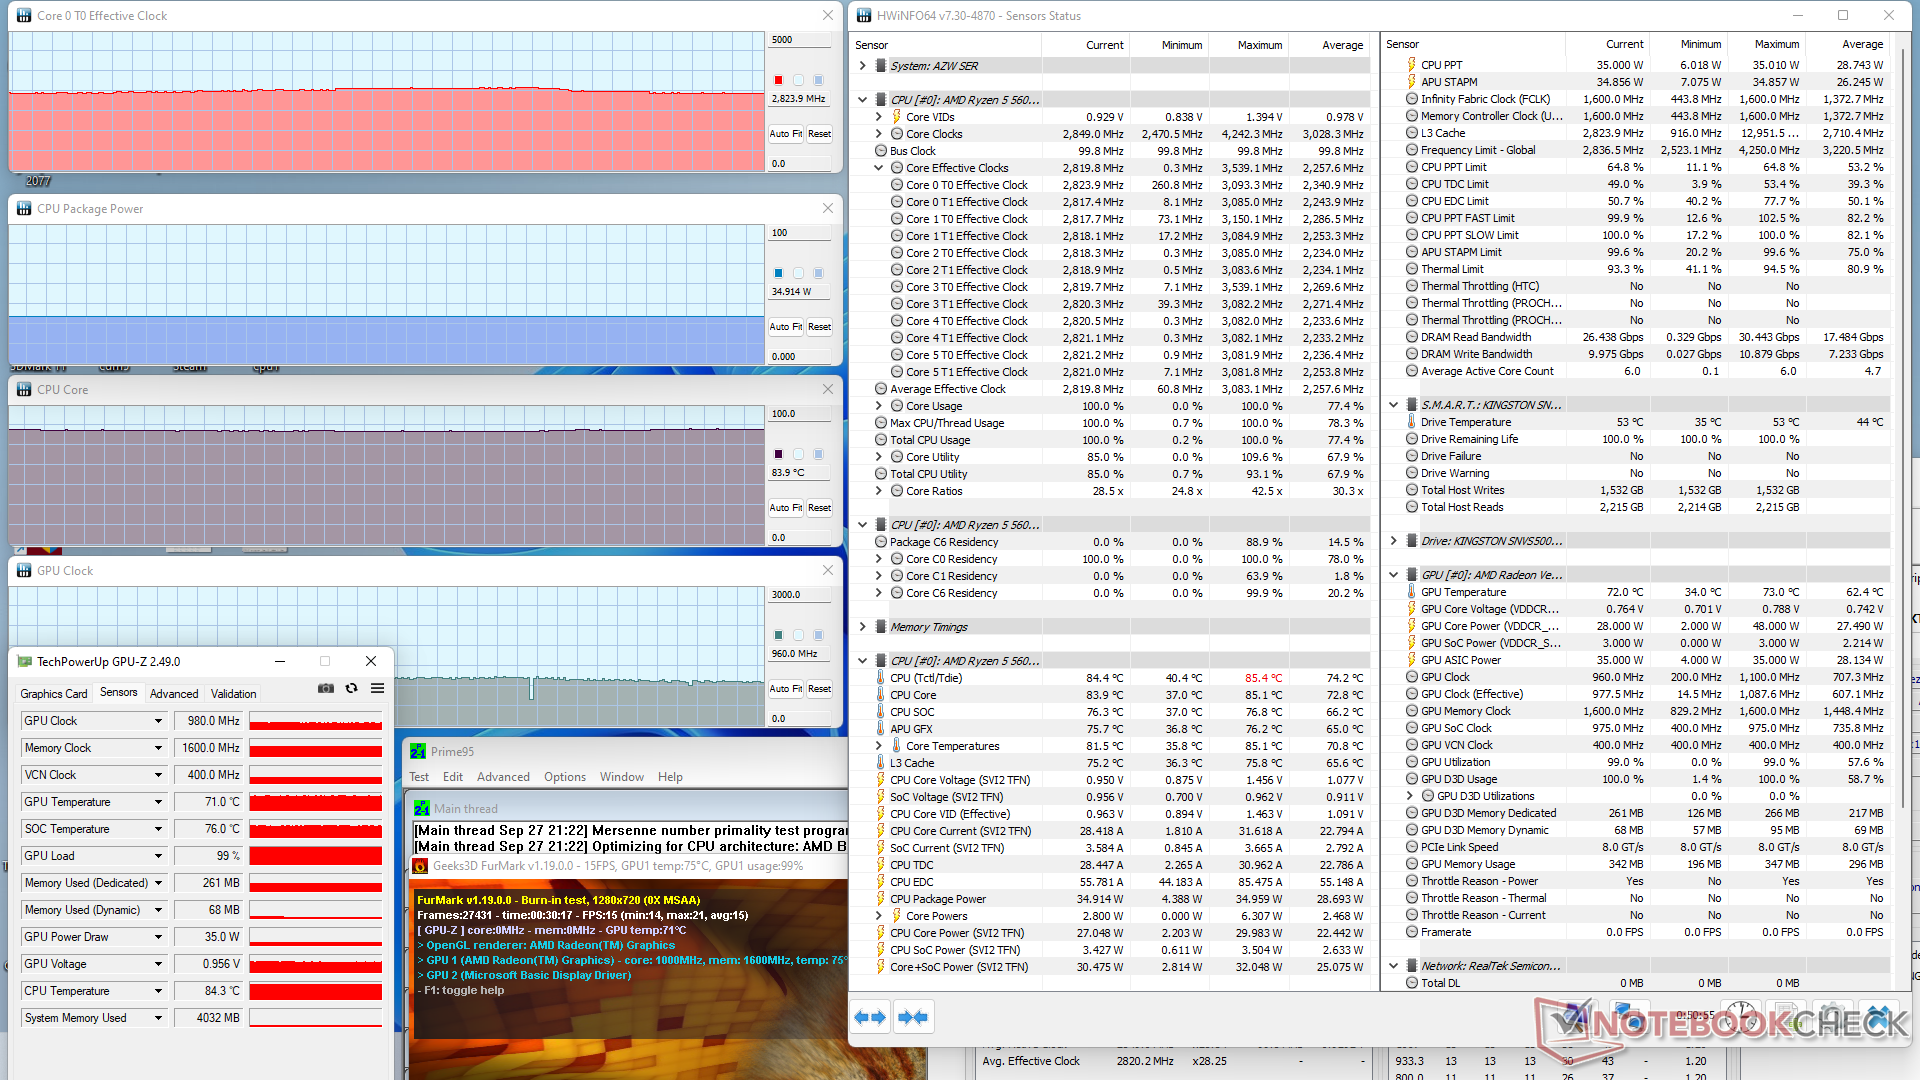
| Prime95 + FurMark Stress | 2.8 | 980 | 84 |
| Witcher 3 Stress | ~0.9 | 1800 | 75 |
Energy Management
Power Consumption
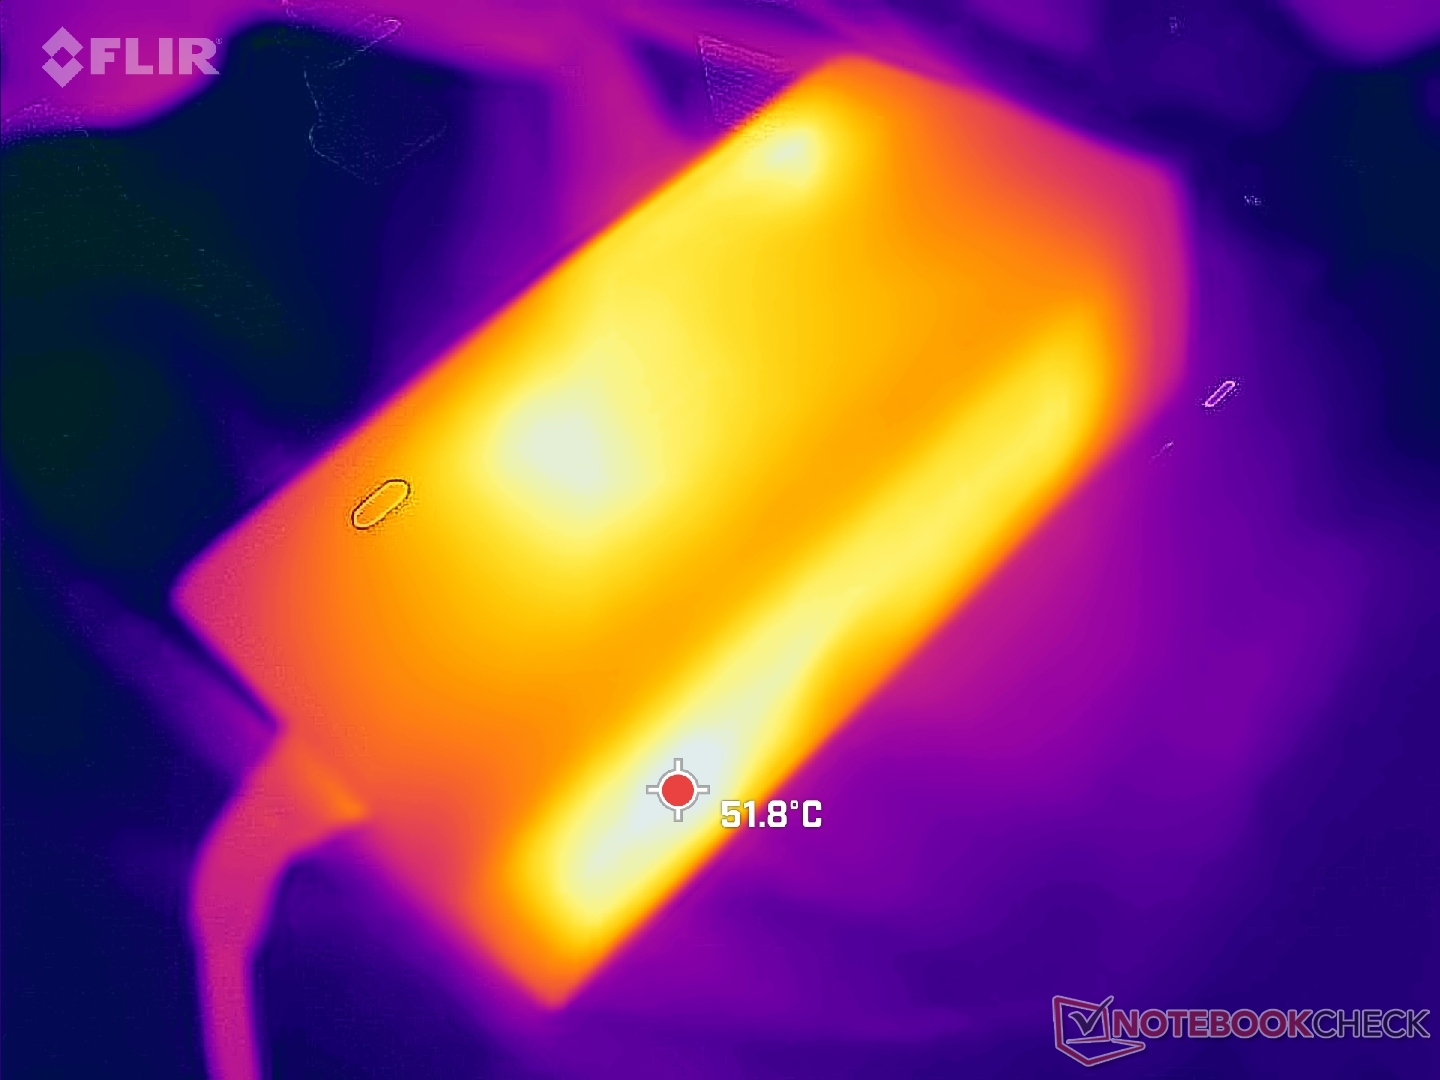
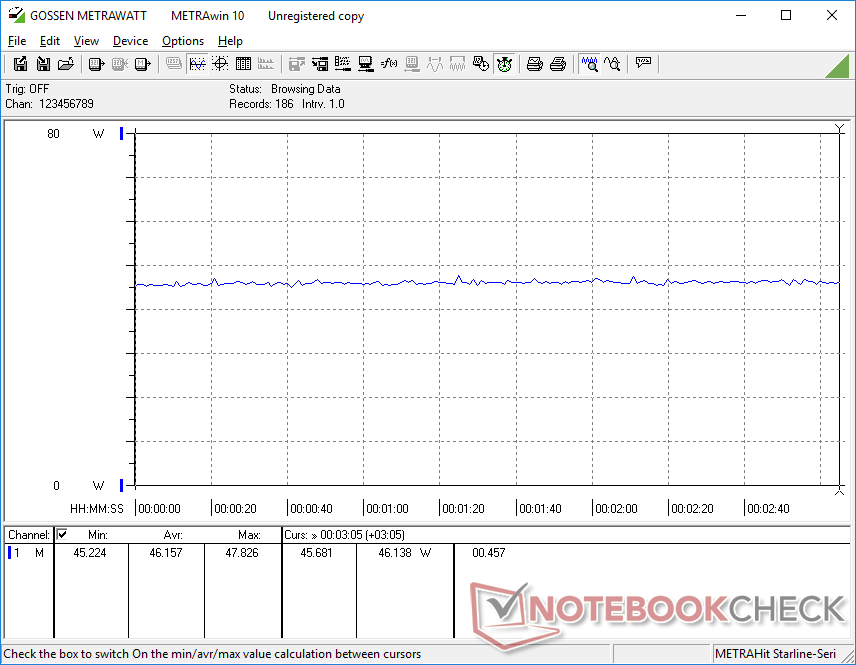
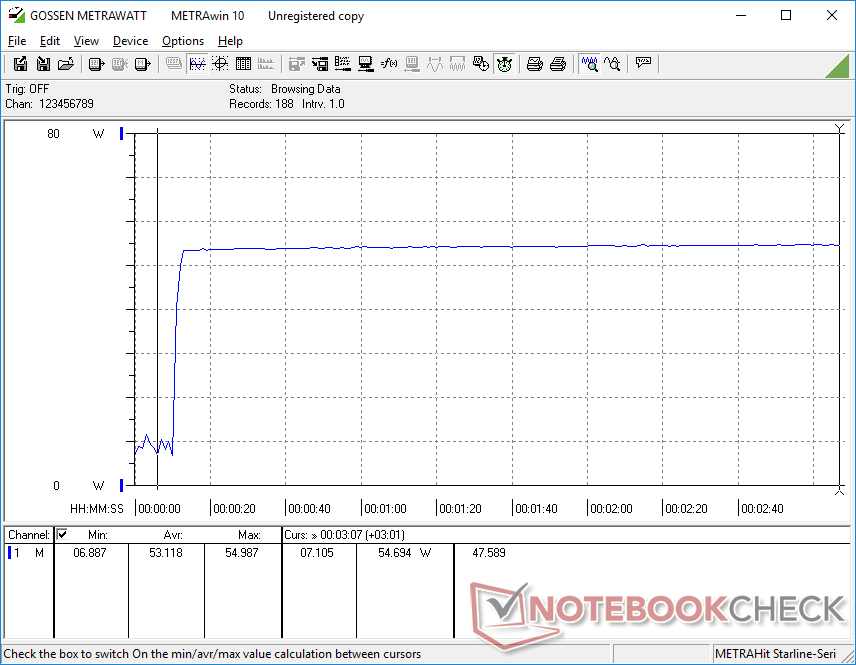
Power consumption is generally higher than models running on Ryzen U series or Core U series CPUs since our Ryzen H series CPU targets comparatively higher TDP levels. The Intel NUC11 with the Core i5-1135G7, for example, would demand between 40 and 44 W when gaming compared to 46 to 50 W on our Beelink. Performance-per-watt is still better with the Ryzen 5 5600H especially in terms of multi-thread CPU performance.
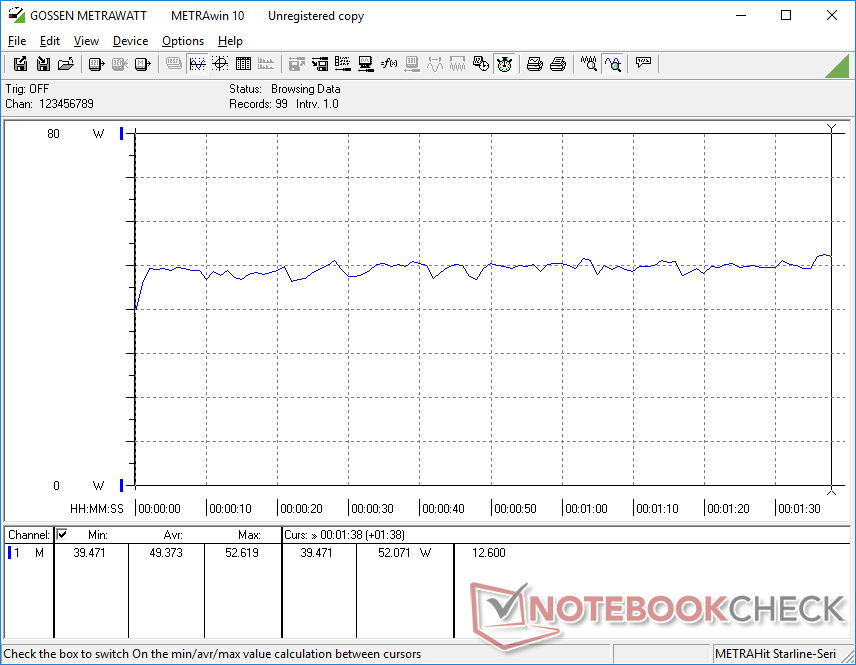
We're able to record a maximum draw of 50.2 W from the small-medium (~10 x 4.9 x 3.3 cm) 57 W wall wart AC adapter when the CPU is at 100 percent utilization. We suspect that this can go even higher if multiple USB devices or external USB-C monitors are connected.

| Off / Standby | |
| Idle | |
| Load |
|
Key:
min: | |
| Beelink SER Pro Ryzen 5 5600H R5 5600H, Vega 7, Kingston NV1 SNVS/500GCN, , x, | Beelink SEi11 Pro i5-11320H, Iris Xe G7 96EUs, Kingston NV1 SNVS/500GCN, , x, | Beelink GTR5 R9 5900HX, Vega 8, Kingston NV1 SNVS/500GCN, , x, | Intel NUC11TNKi5 i5-1135G7, Iris Xe G7 80EUs, Transcend M.2 SSD 430S TS512GMTS430S, , x, | Beelink SEi8 i3-8109U, Iris Plus Graphics 655, Intel SSD 660p SSDPEKNW512G8, , x, | Beelink SER4 R7 4800U, Vega 8, Intel SSD 660p SSDPEKNW512G8, , x, | |
|---|---|---|---|---|---|---|
| Power Consumption | -30% | -28% | -41% | -2% | 32% | |
| Idle Minimum * | 5.4 | 9.8 -81% | 6.2 -15% | 11.5 -113% | 7.5 -39% | 4.1 24% |
| Idle Average * | 8.2 | 10.3 -26% | 8.9 -9% | 12.4 -51% | 7.6 7% | 4.1 50% |
| Idle Maximum * | 8.3 | 10.5 -27% | 9 -8% | 12.9 -55% | 9.2 -11% | 4.6 45% |
| Load Average * | 49.3 | 54.2 -10% | 66.8 -35% | 40.7 17% | 41.1 17% | 35.6 28% |
| Witcher 3 ultra * | 46.1 | 53.1 -15% | 62.6 -36% | 43.9 5% | 35.6 23% | |
| Load Maximum * | 50.2 | 59 -18% | 81.6 -63% | 73.5 -46% | 41.4 18% | 39.9 21% |
* ... smaller is better
Power Consumption Witcher 3 / Stresstest
Power Consumption external Monitor
Pros
Cons
Verdict — Another Excellent Alternative To The Intel NUC11
For about $450 USD, the Beelink SER5 Pro comes fully loaded with 16 GB RAM, 500 GB of storage, and a licensed copy of Windows 11 Pro. In contrast, an Intel NUC11PAHi7 equipped with the same storage and RAM capacity currently retails for almost $900. The SER5 is even able to offer faster processor performance than the Intel and many of the same upgradeable options including SODIMM and dual storage. If you're looking to save a few hundred dollars, then the Beelink should be high on your list of considerations.
The Beelink SER5 Pro is hundreds of dollars cheaper than an Intel NUC of similar performance. Businesses may still prefer the reliability of NUC, but most home users will want to consider the more affordable Beelink.
There are a number of cut corners, but none are all that impactful to the core user experience. When compared to the Intel NUC, the SER5 Pro lacks Thunderbolt, an anti-theft lock, PCIe4 SSD support, a three-year manufacturer warranty, and a stronger chassis skeleton. The NUC can still be the better investment if such features are important to you, but the price savings are otherwise substantial.
Price and Availability
The Beelink SER5 is now available on Amazon for just under $400 USD.
More articles related to this device
Beelink SER Pro Ryzen 5 5600H (SER Series)Related Articles


Price comparison
