

Beelink SER4 mini PC review: AMD Zen 2 is still giving Intel NUC a run for its money
The SER4 directly succeeds last year's SER3 by swapping out the older Zen+ CPU for a newer Zen 2 one. In particular, the SER4 utilizes the very fast and relatively uncommon Ryzen 7 4800U which is unfortunately in very few other products.
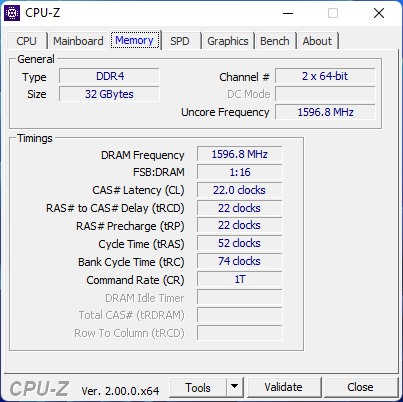
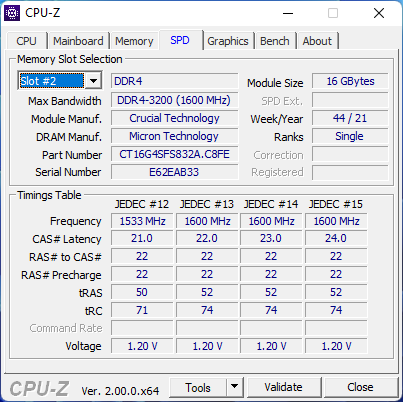
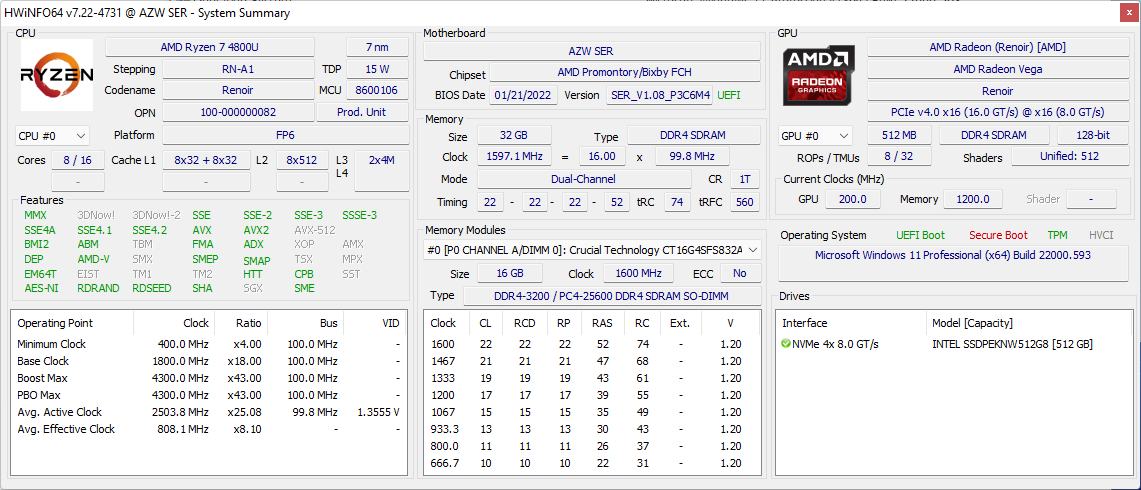
Our configuration as reviewed comes with the Ryzen 7 4800U CPU, 32 GB of DDR4-3200 RAM, and a 512 GB NVMe SSD for $650 USD. A lesser SKU with half the RAM is available for $50 less. Users interested in an Intel version should look at the Beelink SEI series instead. The SER4 competes directly with the Intel NUC series as well as other mini PCs powered by U-series CPUs.
More Beelink reviews:
Potential Competitors in Comparison
Rating | Date | Model | Weight | Height | Size | Resolution | Price |
|---|---|---|---|---|---|---|---|
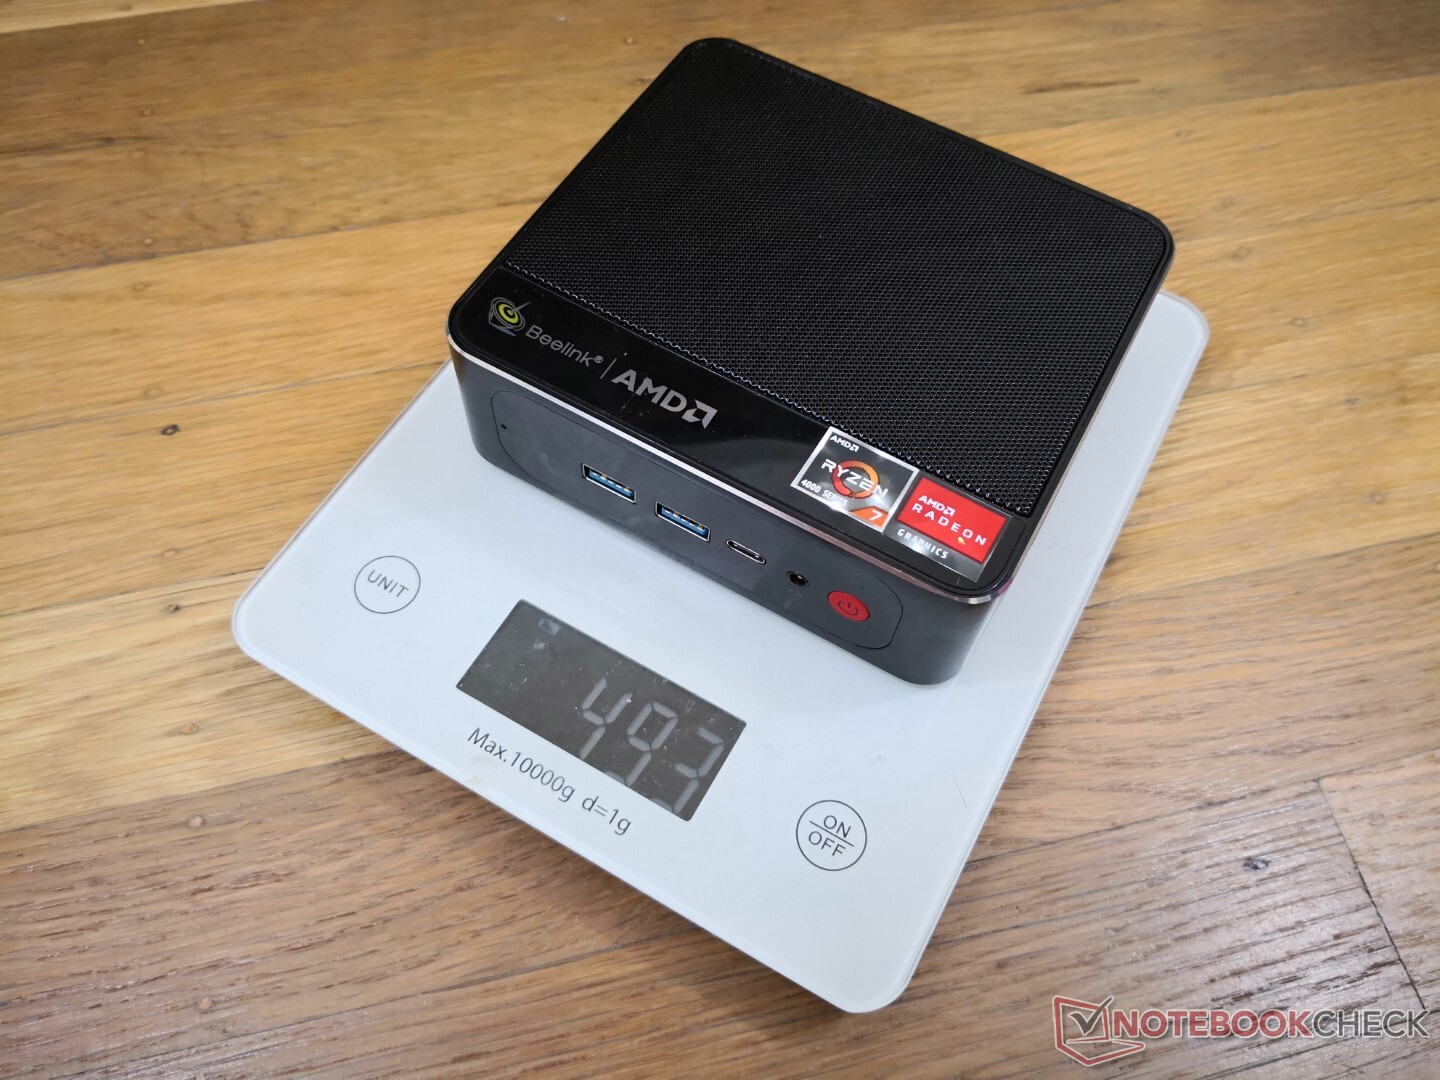
v (old) | 04 / 2022 | Beelink SER4 R7 4800U, Vega 8 | 494 g | 40 mm | x | ||
v (old) | 02 / 2022 | GMK NucBox 3 Celeron J4125, UHD Graphics 600 | 410 g | 32.5 mm | x | ||
v (old) | 01 / 2022 | Beelink GTR5 R9 5900HX, Vega 8 | 686 g | 39 mm | x | ||
v (old) | 02 / 2021 | Intel NUC11PAQi7 i7-1165G7, Iris Xe G7 96EUs | 647 g | 56 mm | x | ||
v (old) | 11 / 2021 | Beelink SER3 R7 3750H, Vega 10 | 492 g | 40 mm | x | ||
v (old) | 02 / 2020 | Intel NUC10i5FNK i5-10210U, UHD Graphics 620 | 493 g | 36 mm | 0.00" | 0x0 |
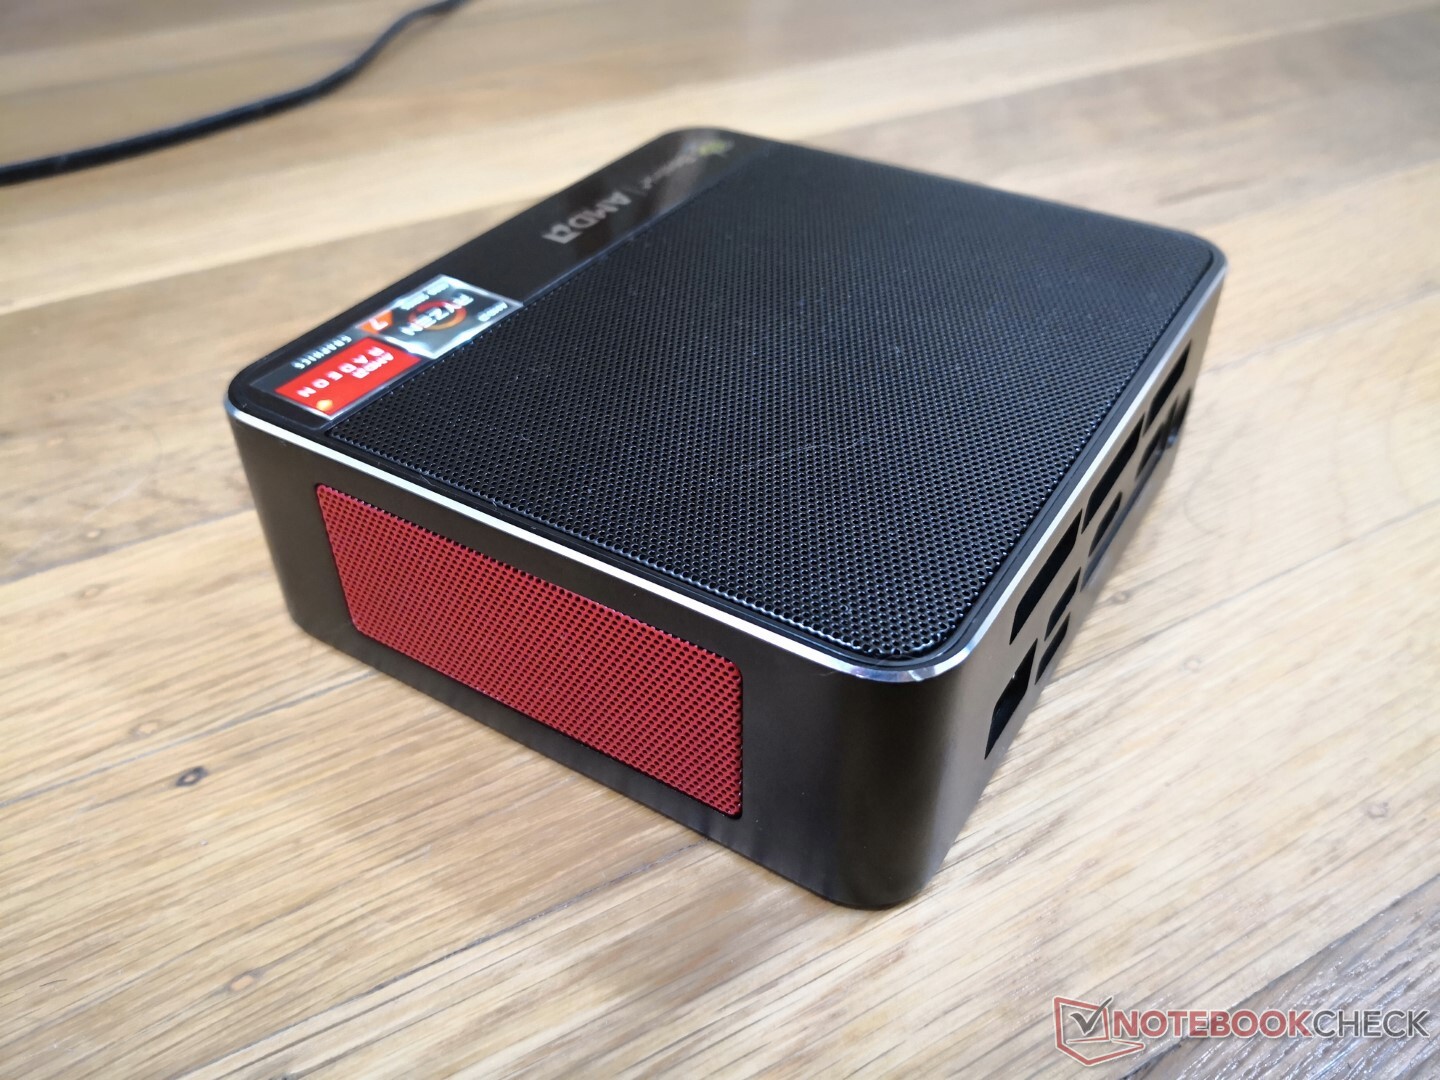
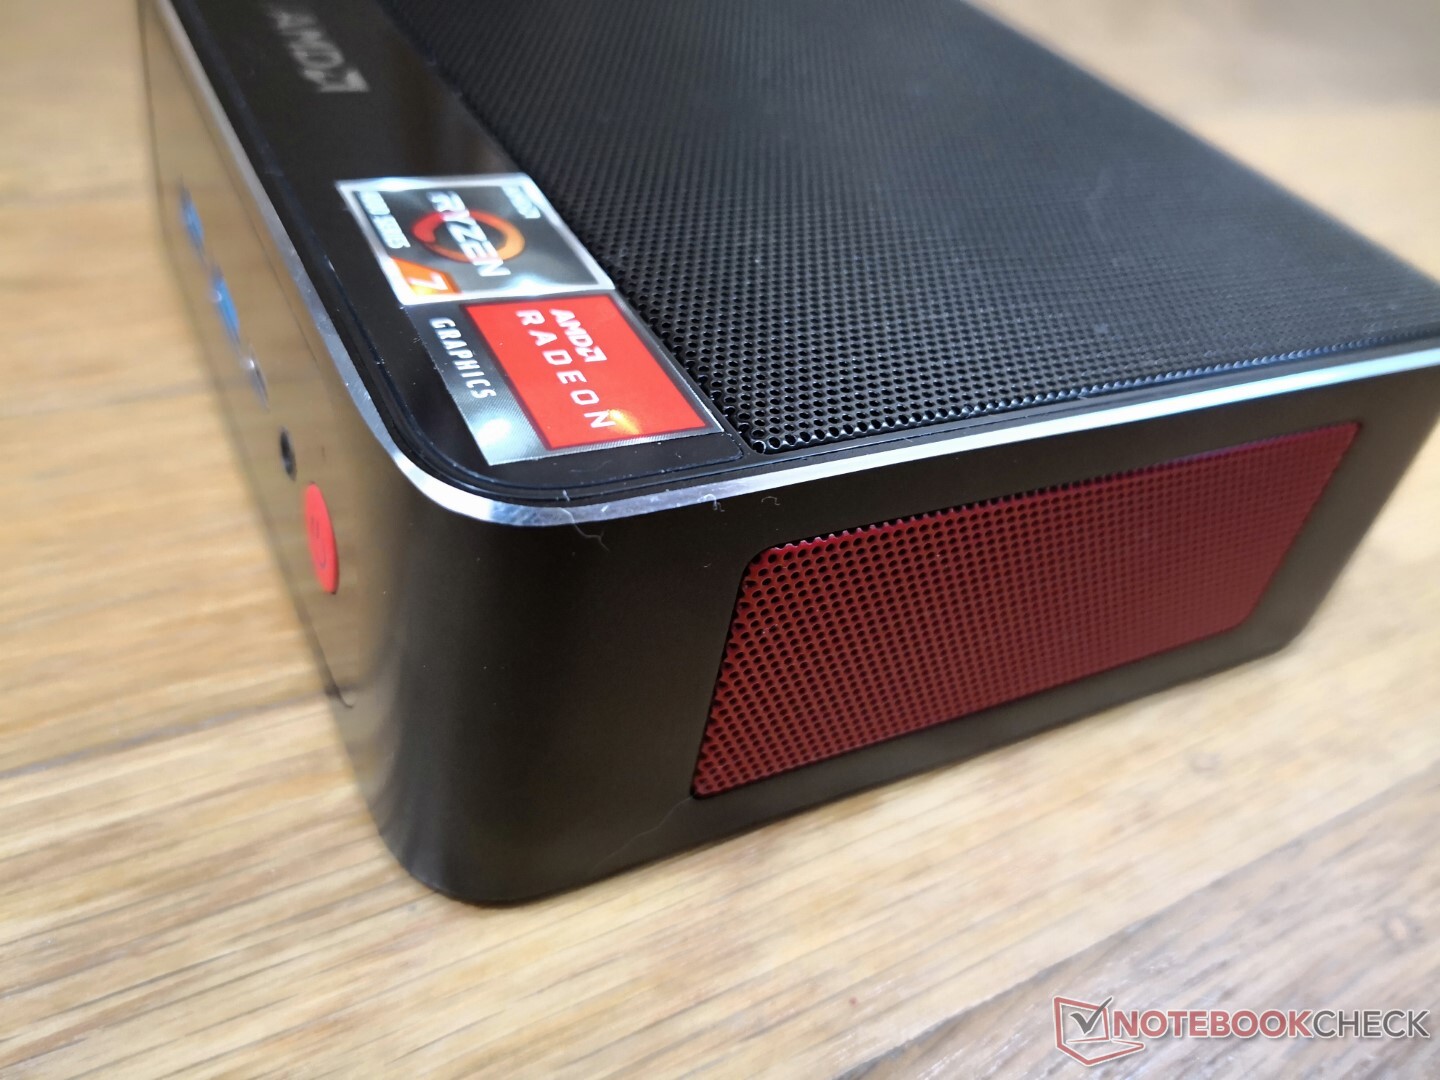
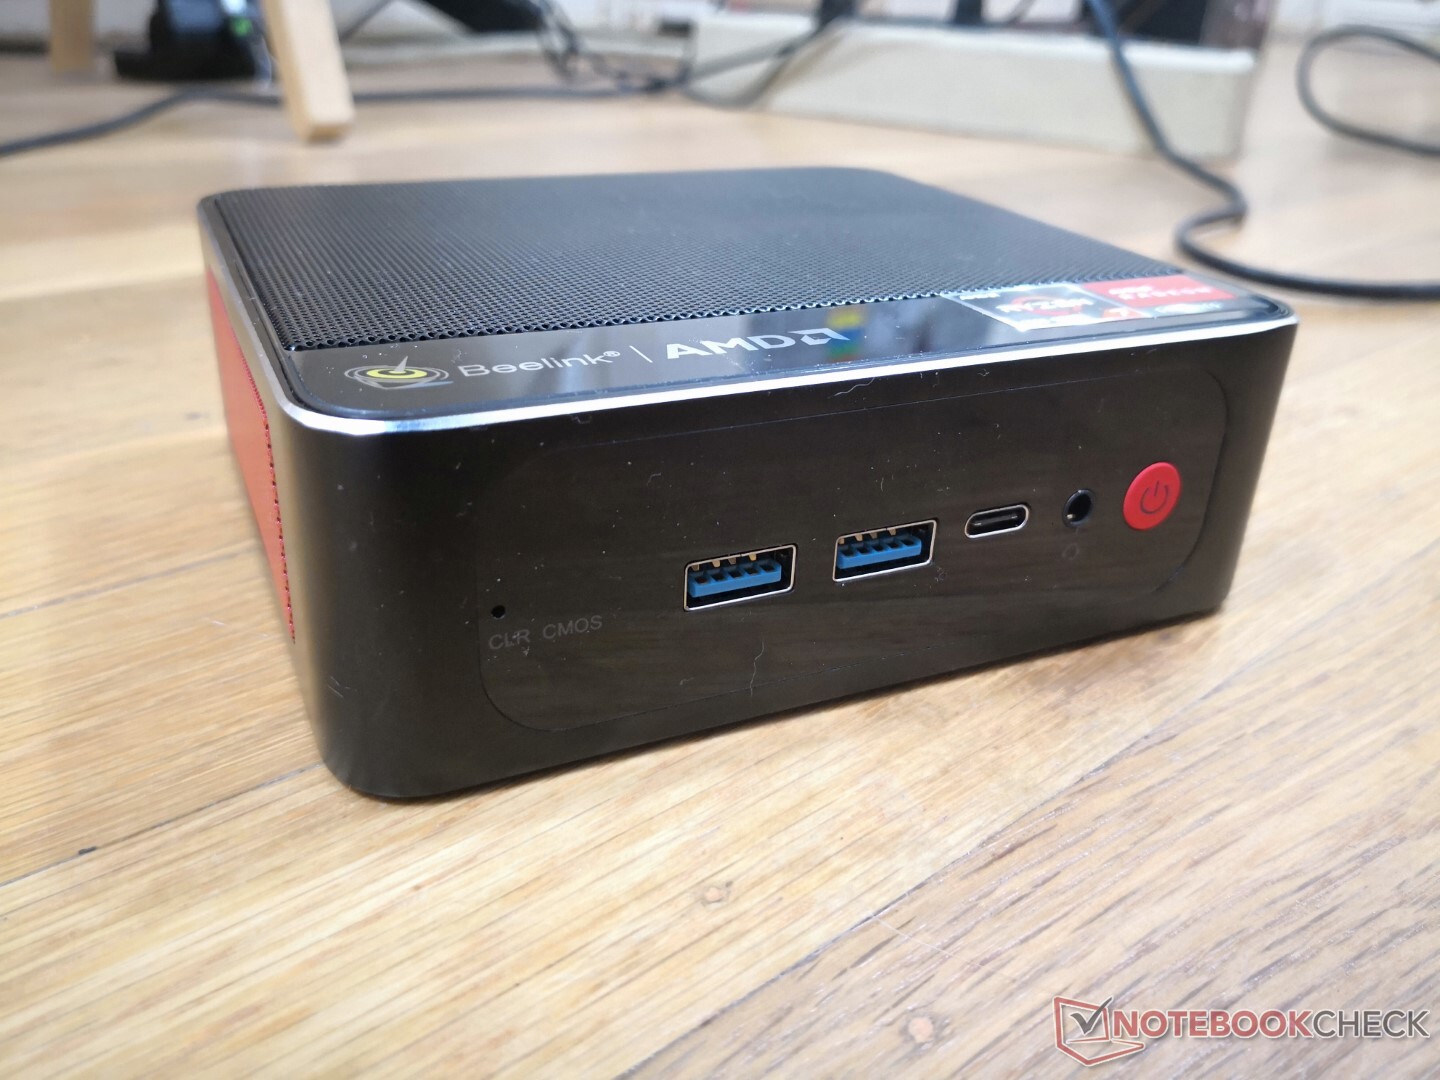
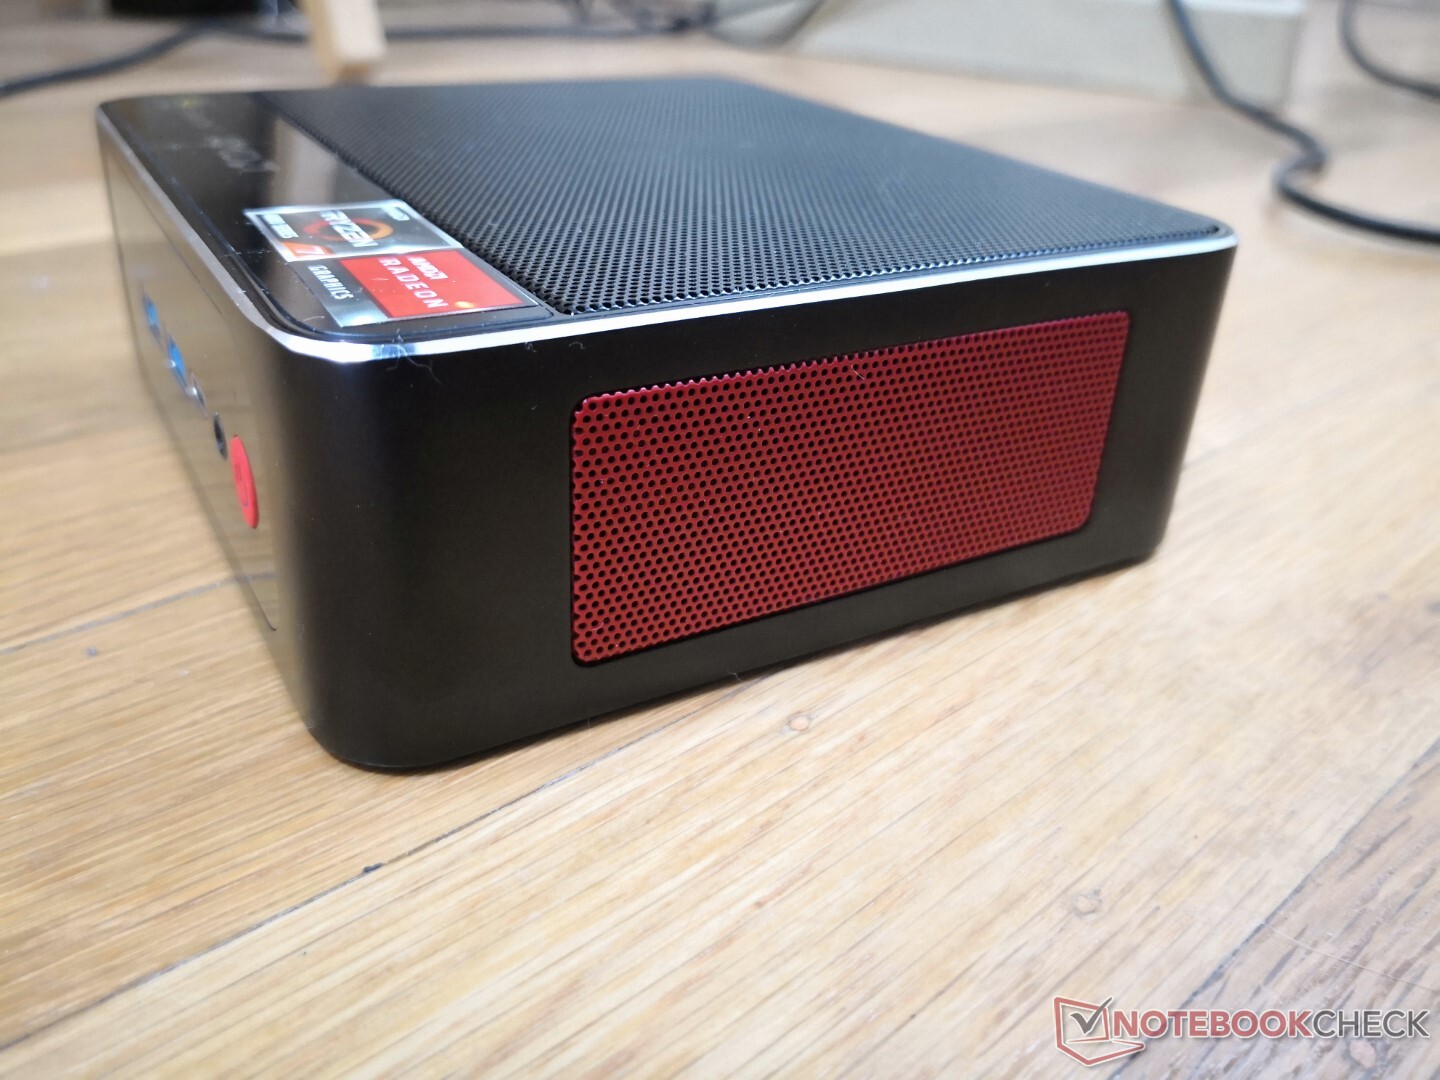
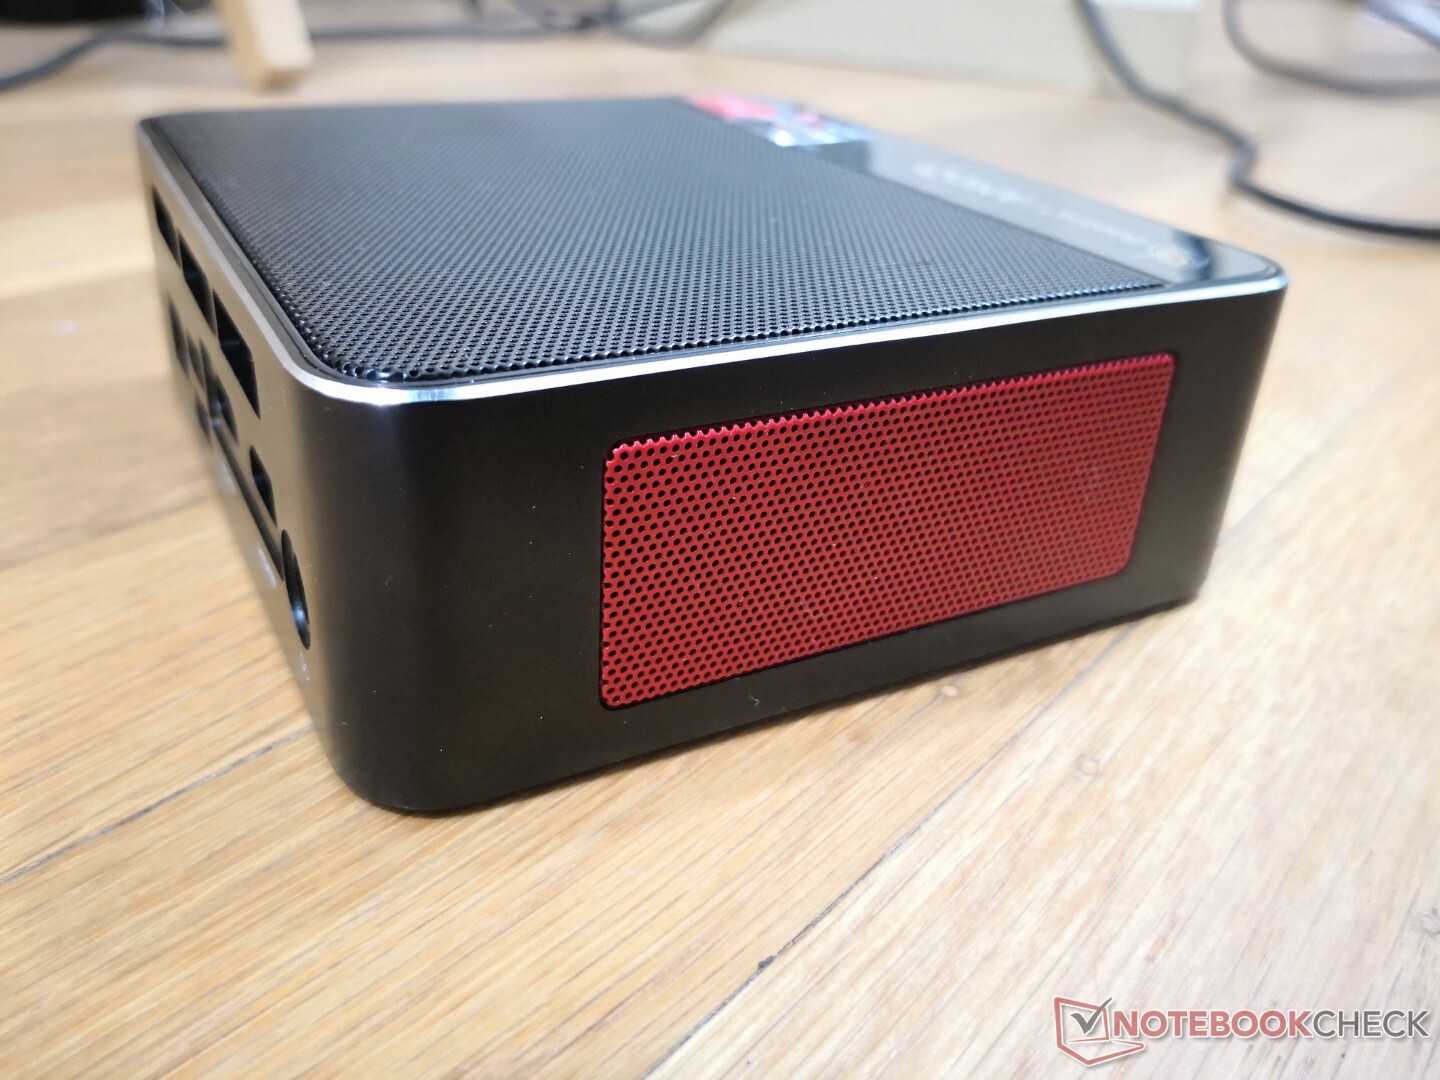
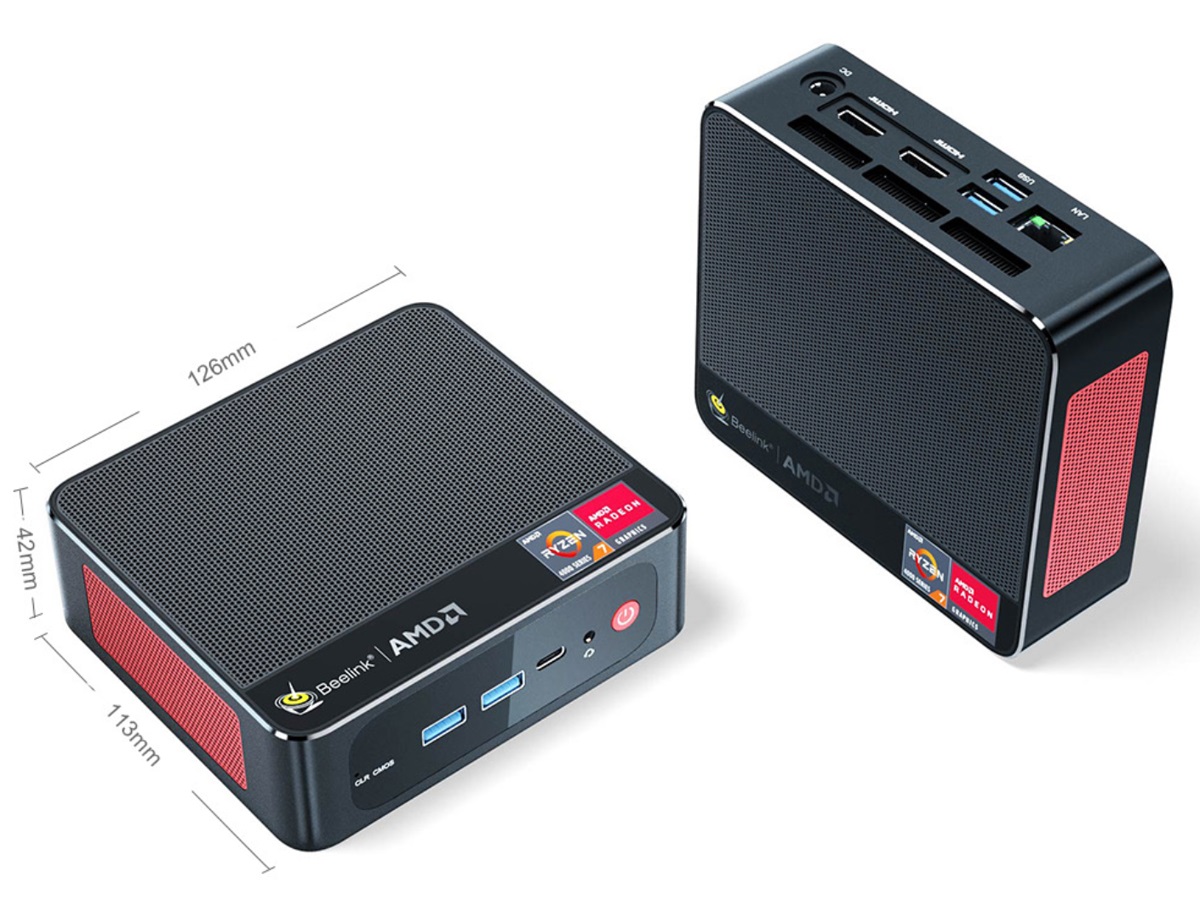
Case — Lots Of Ventilation Grilles
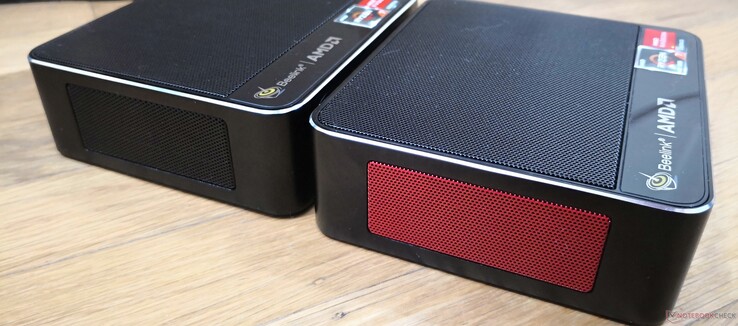
The SER4 utilizes the same chassis as the SER3 but with a superficial change. More specifically, the grilles along the sides of the unit are now red instead of black as a tribute to the AMD CPU inside.
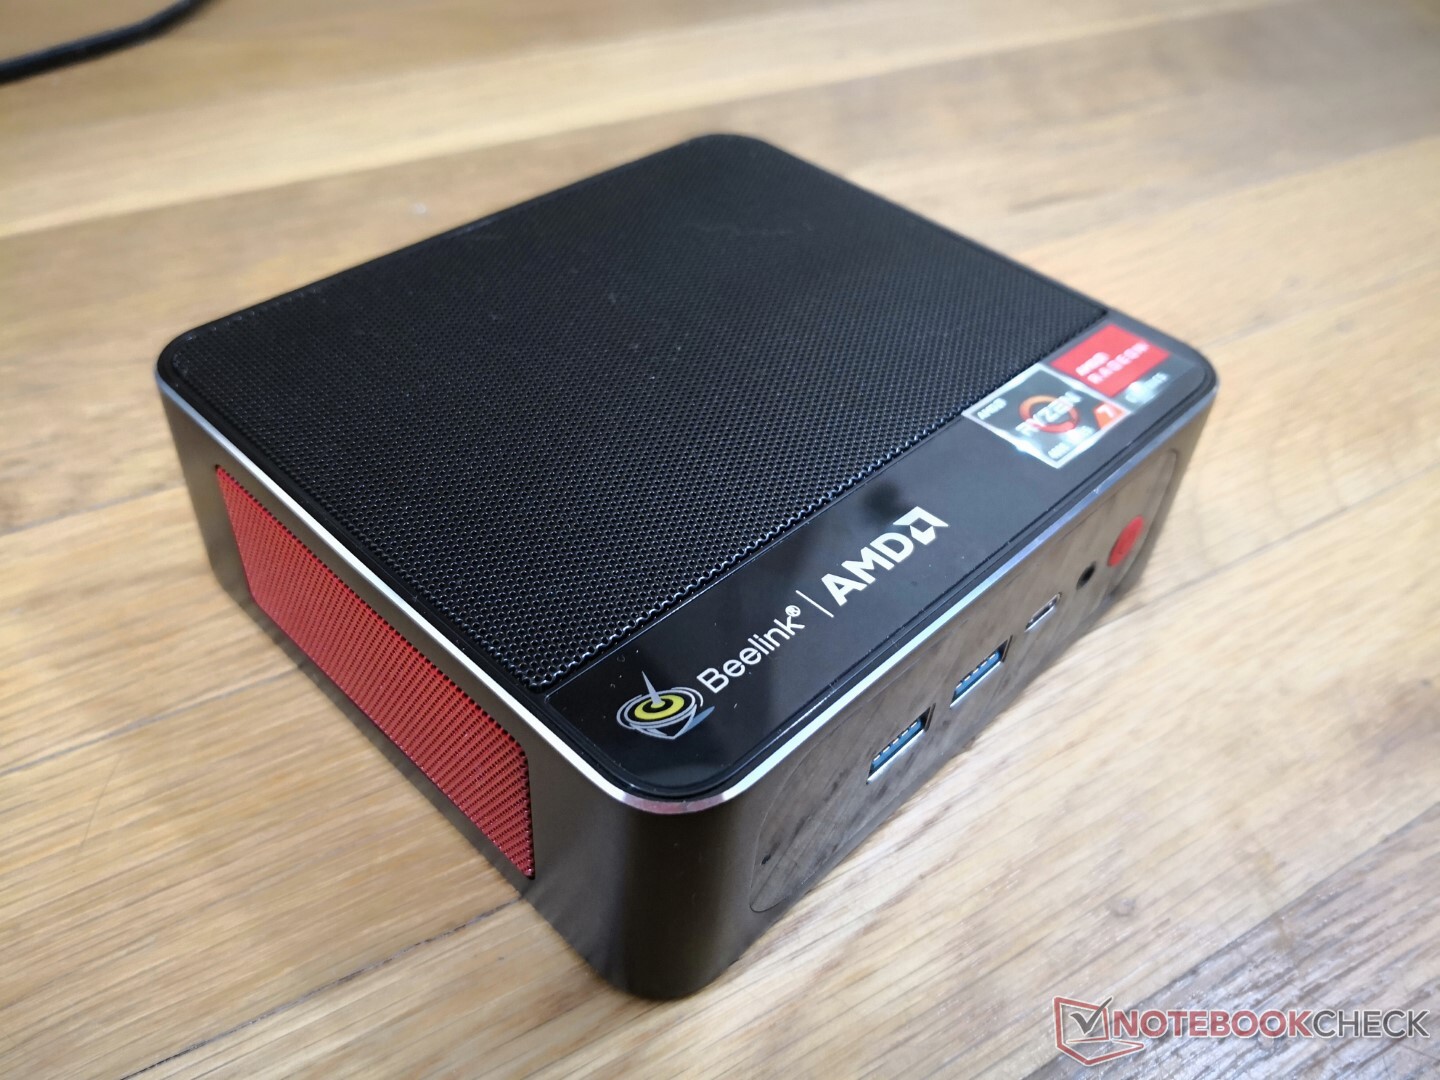
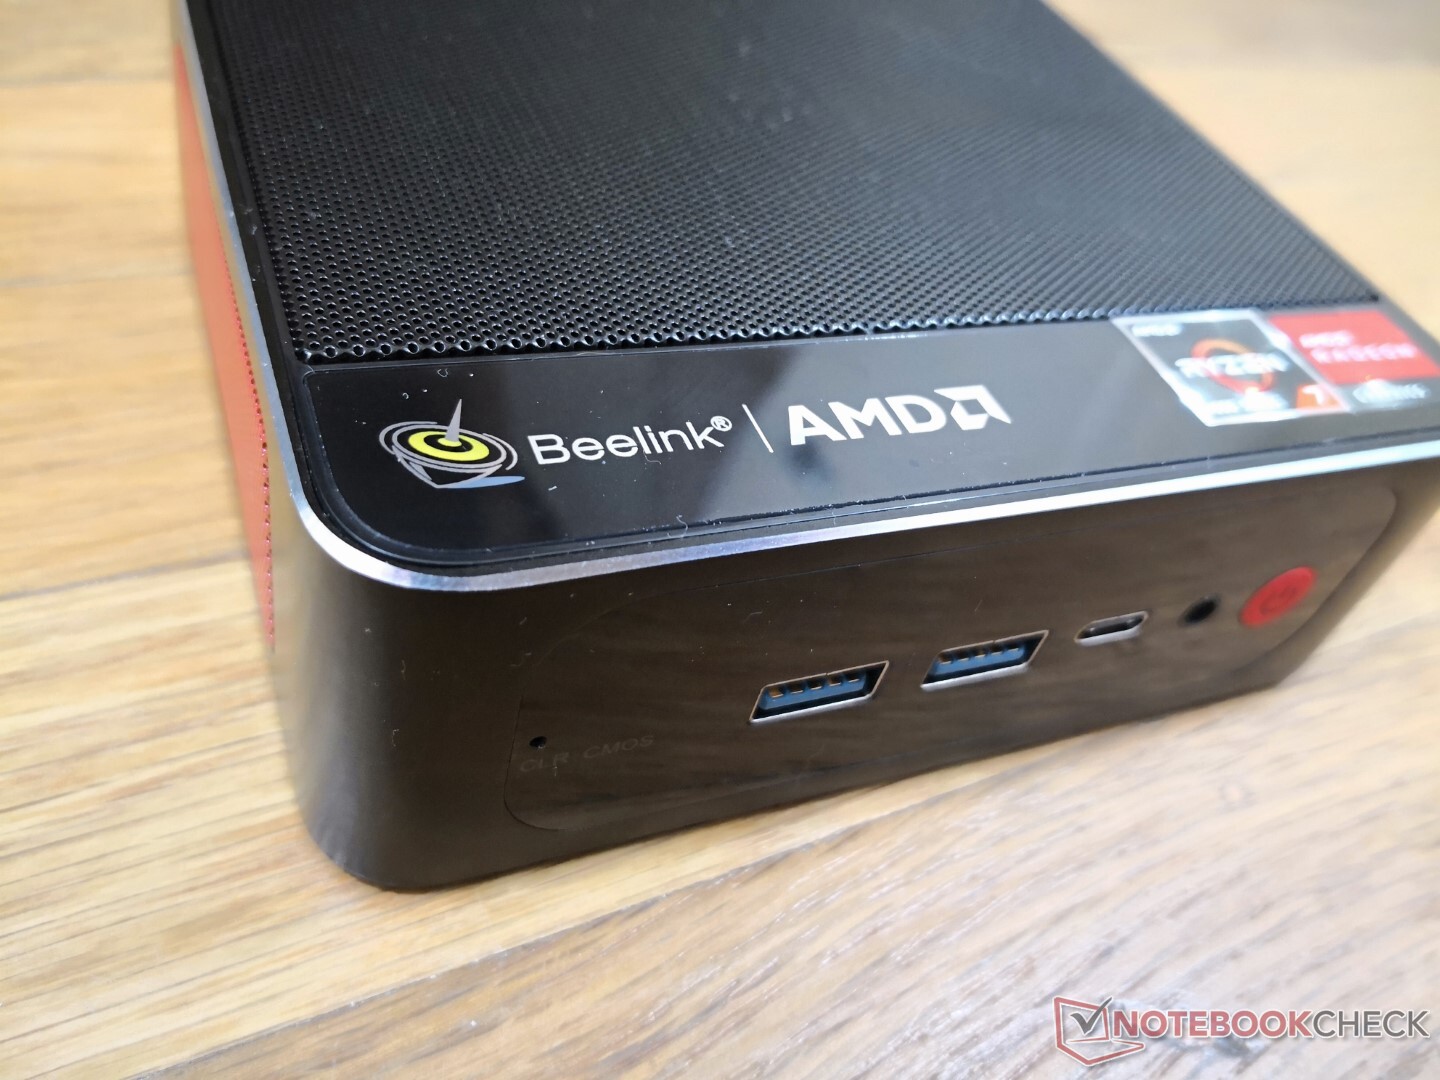
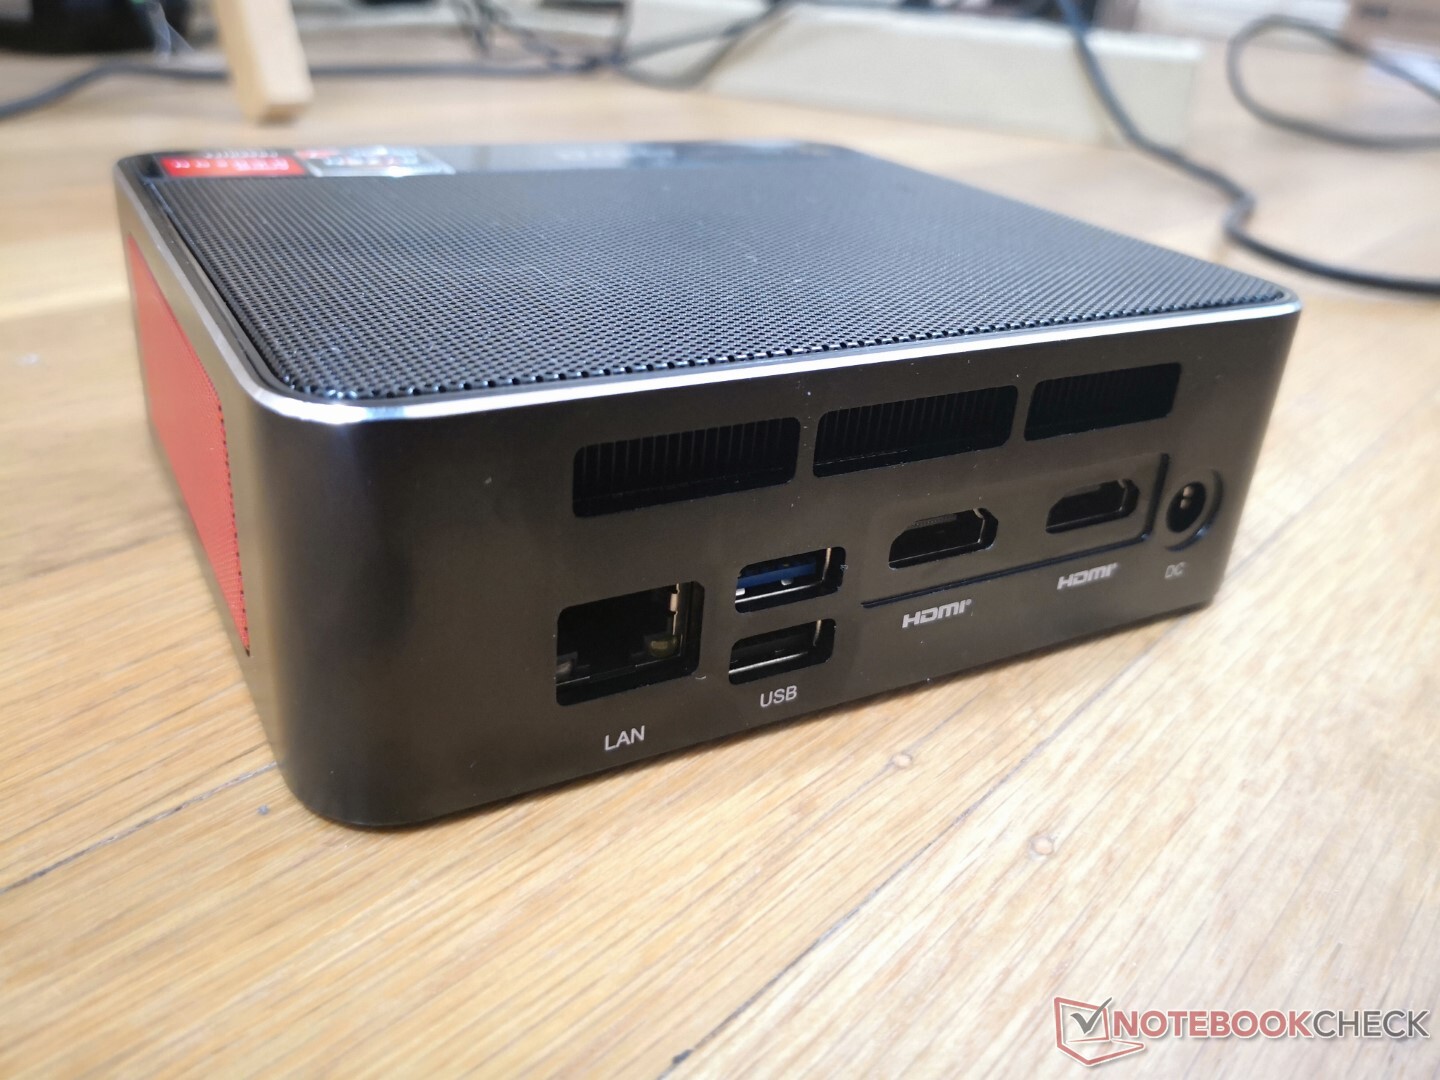
Connectivity — No Thunderbolt Support
Port options are identical to what was offered on the SER3. Note that it's possible to power on the SER4 with certain USB-C AC adapters should owners lose the proprietary barrel AC adapter cable that comes in the box.
Communication
| Networking | |
| iperf3 transmit AX12 | |
| Beelink SER4 | |
| Beelink GTR5 | |
| Intel NUC11PAQi7 | |
| Beelink SER3 | |
| GMK NucBox 3 | |
| iperf3 receive AX12 | |
| Beelink SER4 | |
| Intel NUC11PAQi7 | |
| Beelink GTR5 | |
| GMK NucBox 3 | |
| Beelink SER3 | |
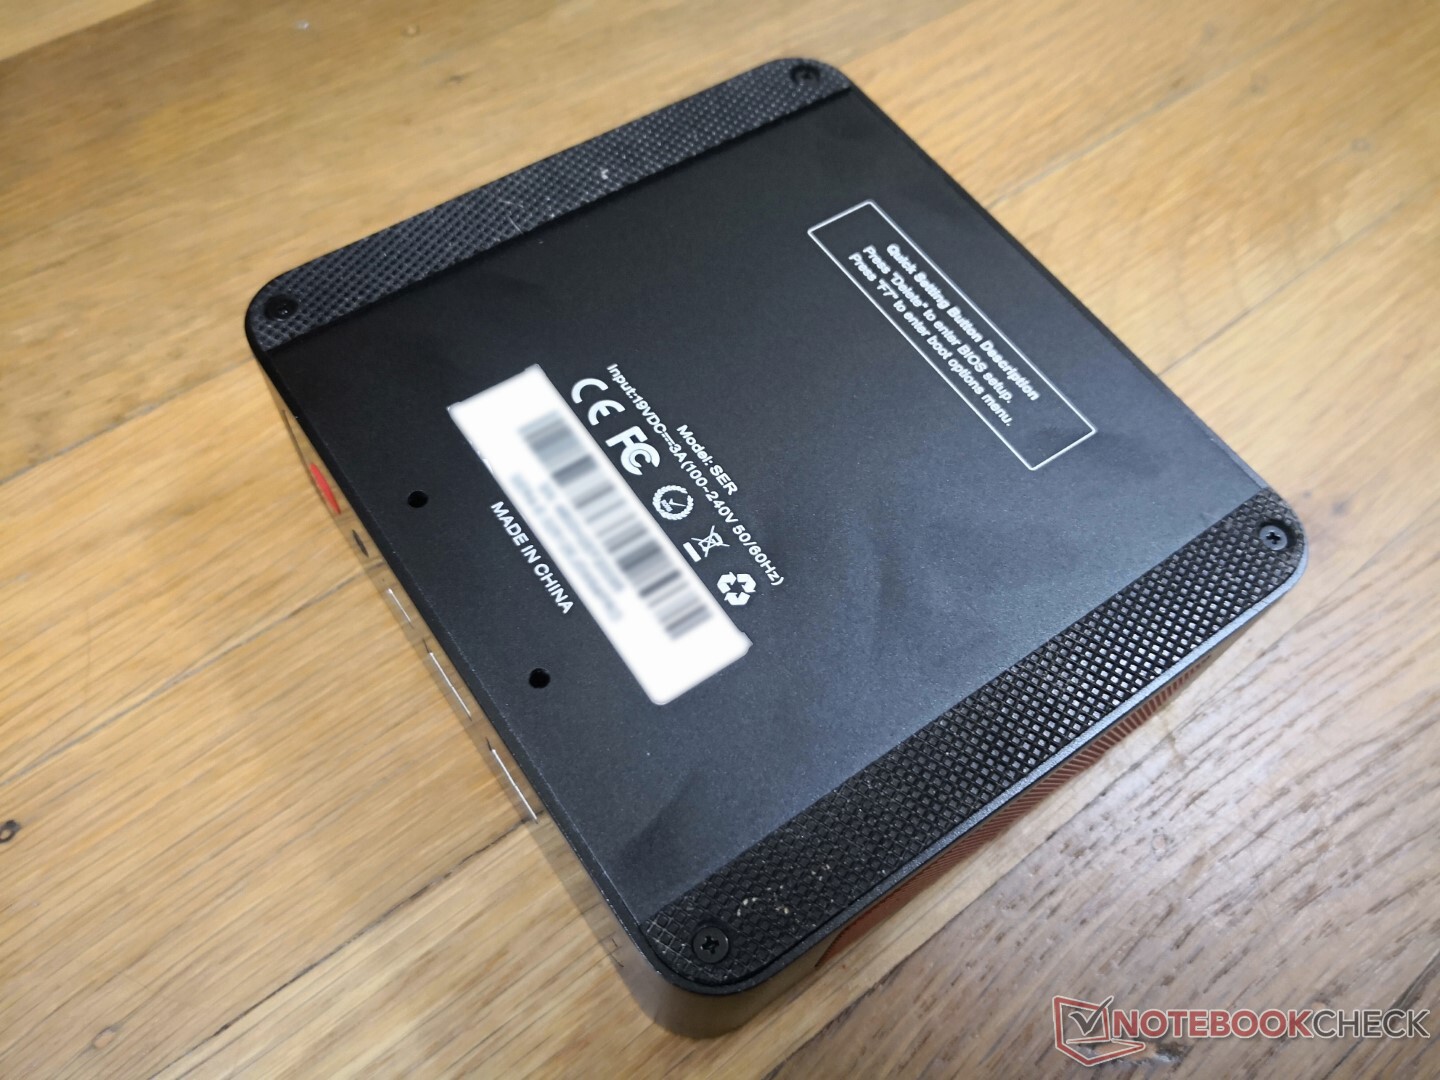
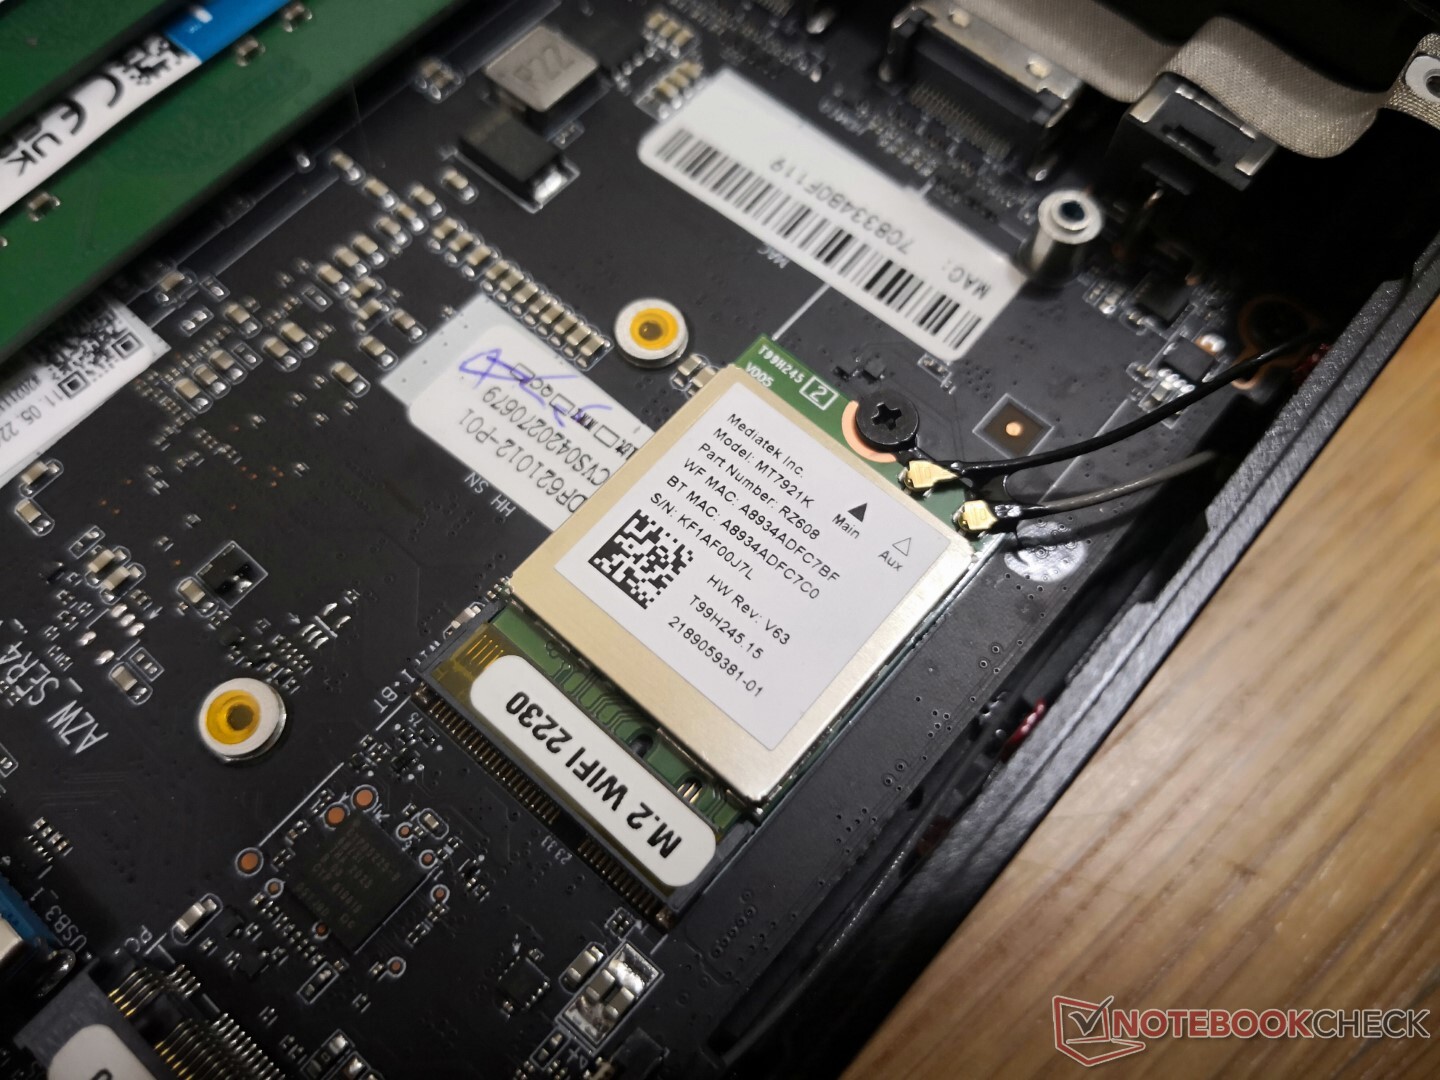
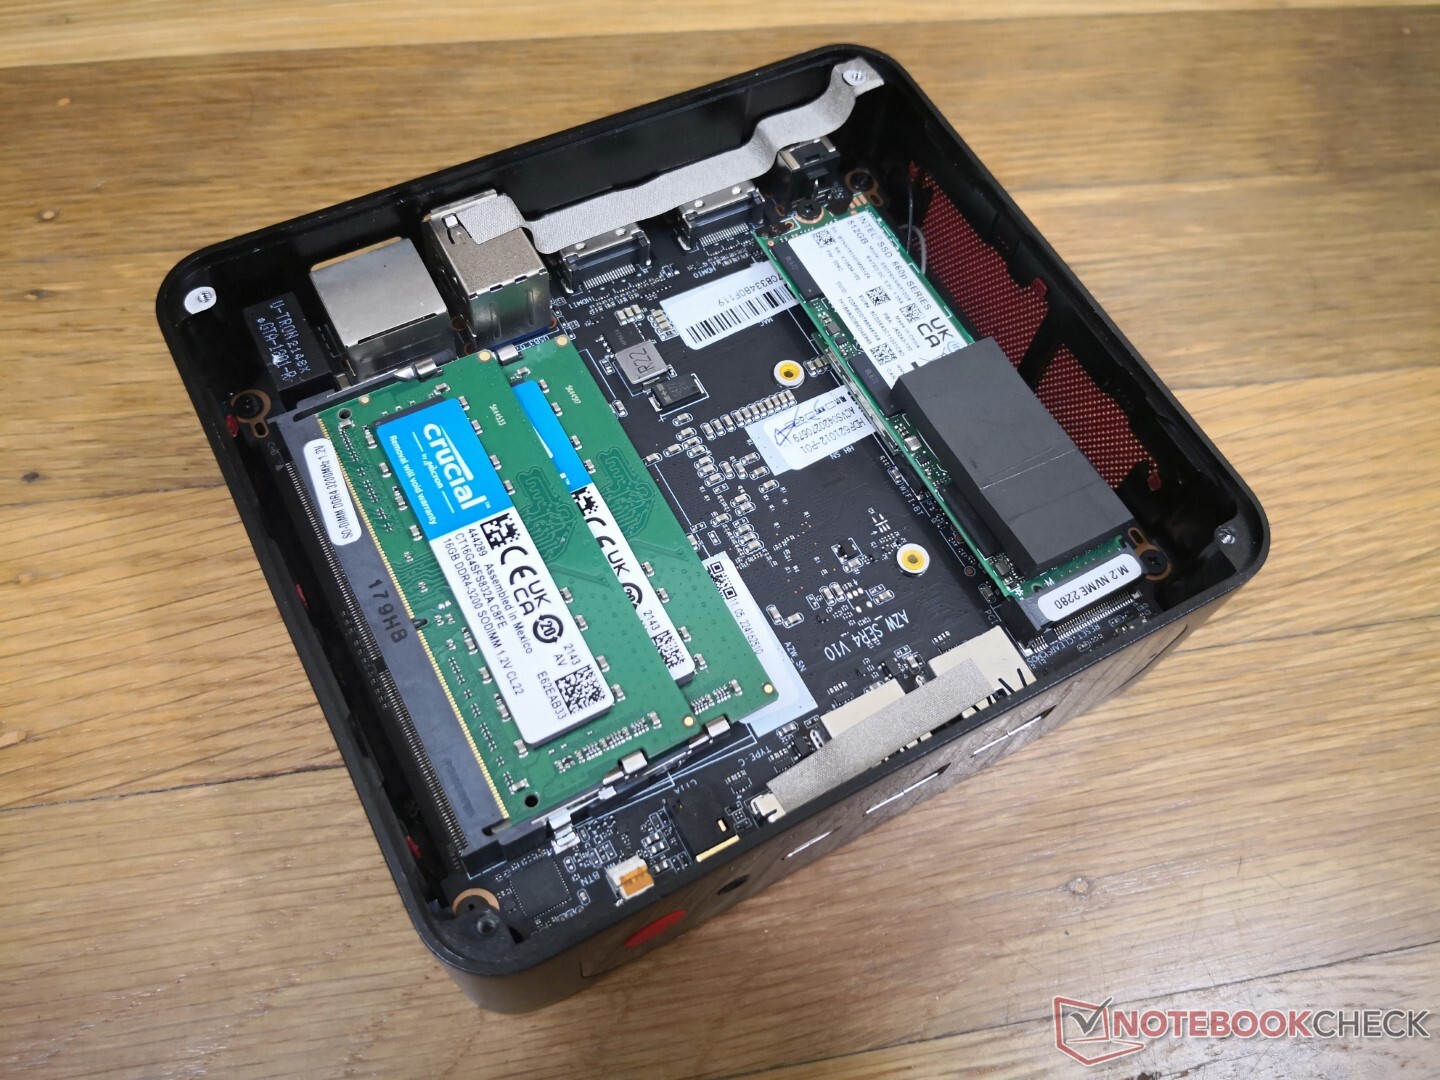
Maintenance
The bottom panel is secured by four Philips screws much like on the SER3. However, the panel on our SER4 unit was stuck and difficult to remove even after unscrewing all the screws. We recommend attaching the mounting plate as an anchor to more easily grip and pull out the bottom plate.
Interestingly, the BIOS battery is missing on the SER4 whereas it was present on our SER3. It's possible that the manufacturer relocated the battery to the other side of the motherboard for this generation.
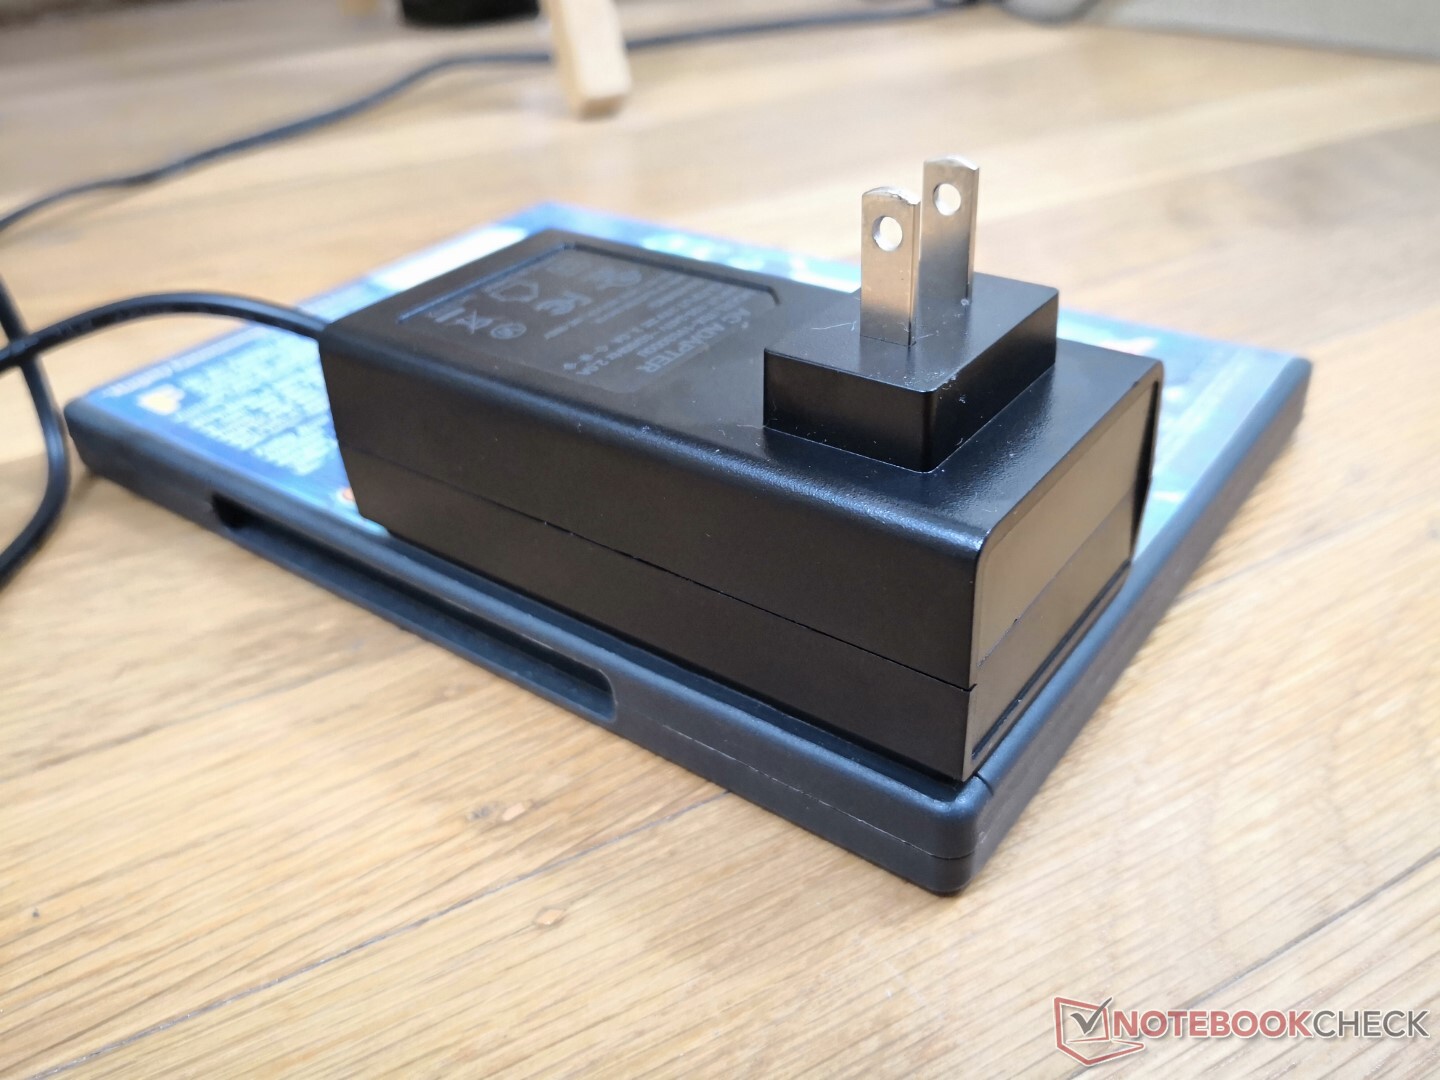
Accessories and Warranty
The retail box includes a removable wall-mounted VESA bracket, AC adapter, two short HDMI cables, and a manual. The standard one-year limited manufacturer warranty applies compared to three years on most Intel NUC systems.
Performance — Faster Than Most U-Series Mini PCs
Testing Conditions
Our unit was set to Performance mode via Windows prior to running any performance benchmarks below.
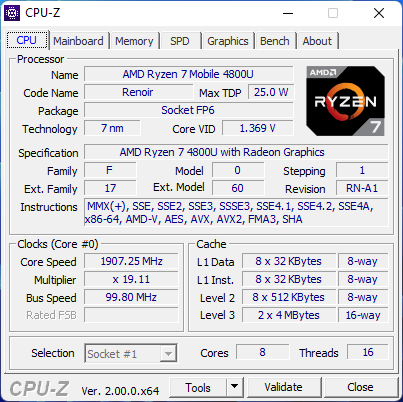
Processor — 8-Core 16-Thread U-Series CPU
CPU performance is one of the fastest of any mini PC powered by a U-series CPU and a major upgrade over the older Ryzen 7-3750H in the SER3. The system exhibits no major throttling behavior as well as exemplified by our CineBench R15 xT loop test results below. This actually allows the Ryzen 7 4800U in our Beelink to outperform the newer Ryzen 7 5800U in the ThinkPad 13s.
Single-thread performance is mediocre but still very good overall with results that are close to the Core i5-1135G7.
Cinebench R15 Multi Loop
Cinebench R23: Multi Core | Single Core
Cinebench R15: CPU Multi 64Bit | CPU Single 64Bit
Blender: v2.79 BMW27 CPU
7-Zip 18.03: 7z b 4 | 7z b 4 -mmt1
Geekbench 5.5: Multi-Core | Single-Core
HWBOT x265 Benchmark v2.2: 4k Preset
LibreOffice : 20 Documents To PDF
R Benchmark 2.5: Overall mean
| Cinebench R20 / CPU (Multi Core) | |
| Beelink GTR5 | |
| Beelink SER4 | |
| Average AMD Ryzen 7 4800U (2943 - 3306, n=4) | |
| Lenovo ThinkBook 13s G3 20YA0005GE | |
| Intel NUC11PAQi7 | |
| Intel NUC11TNKi5 | |
| Intel NUC10i5FNK | |
| Beelink SER3 | |
| Infinix INBook X2 | |
| GMK NucBox 3 | |
| Cinebench R20 / CPU (Single Core) | |
| Intel NUC11PAQi7 | |
| Beelink GTR5 | |
| Lenovo ThinkBook 13s G3 20YA0005GE | |
| Intel NUC11TNKi5 | |
| Beelink SER4 | |
| Average AMD Ryzen 7 4800U (474 - 488, n=4) | |
| Intel NUC10i5FNK | |
| Infinix INBook X2 | |
| Beelink SER3 | |
| GMK NucBox 3 | |
| Cinebench R23 / Multi Core | |
| Beelink GTR5 | |
| Average AMD Ryzen 7 4800U (7558 - 9762, n=3) | |
| Beelink SER4 | |
| Lenovo ThinkBook 13s G3 20YA0005GE | |
| Intel NUC11PAQi7 | |
| Intel NUC11TNKi5 | |
| Beelink SER3 | |
| Infinix INBook X2 | |
| GMK NucBox 3 | |
| Cinebench R23 / Single Core | |
| Beelink GTR5 | |
| Lenovo ThinkBook 13s G3 20YA0005GE | |
| Intel NUC11TNKi5 | |
| Beelink SER4 | |
| Average AMD Ryzen 7 4800U (1231 - 1240, n=3) | |
| Infinix INBook X2 | |
| Beelink SER3 | |
| GMK NucBox 3 | |
| Cinebench R15 / CPU Multi 64Bit | |
| Beelink GTR5 | |
| Lenovo ThinkBook 13s G3 20YA0005GE | |
| Lenovo ThinkBook 13s G3 20YA0005GE | |
| Average AMD Ryzen 7 4800U (1281 - 1639, n=3) | |
| Beelink SER4 | |
| Intel NUC11PAQi7 | |
| Intel NUC11TNKi5 | |
| Intel NUC10i5FNK | |
| Beelink SER3 | |
| Infinix INBook X2 | |
| GMK NucBox 3 | |
| Cinebench R15 / CPU Single 64Bit | |
| Beelink GTR5 | |
| Intel NUC11PAQi7 | |
| Lenovo ThinkBook 13s G3 20YA0005GE | |
| Intel NUC11TNKi5 | |
| Beelink SER4 | |
| Average AMD Ryzen 7 4800U (182 - 187, n=3) | |
| Intel NUC10i5FNK | |
| Infinix INBook X2 | |
| Beelink SER3 | |
| GMK NucBox 3 | |
| Blender / v2.79 BMW27 CPU | |
| GMK NucBox 3 | |
| Infinix INBook X2 | |
| Beelink SER3 | |
| Intel NUC11TNKi5 | |
| Intel NUC10i5FNK | |
| Intel NUC11PAQi7 | |
| Lenovo ThinkBook 13s G3 20YA0005GE | |
| Average AMD Ryzen 7 4800U (322 - 374, n=3) | |
| Beelink SER4 | |
| Beelink GTR5 | |
| 7-Zip 18.03 / 7z b 4 | |
| Beelink GTR5 | |
| Average AMD Ryzen 7 4800U (38654 - 44804, n=3) | |
| Beelink SER4 | |
| Lenovo ThinkBook 13s G3 20YA0005GE | |
| Intel NUC11PAQi7 | |
| Intel NUC11TNKi5 | |
| Intel NUC10i5FNK | |
| Beelink SER3 | |
| Infinix INBook X2 | |
| GMK NucBox 3 | |
| 7-Zip 18.03 / 7z b 4 -mmt1 | |
| Beelink GTR5 | |
| Intel NUC11PAQi7 | |
| Lenovo ThinkBook 13s G3 20YA0005GE | |
| Intel NUC11TNKi5 | |
| Beelink SER4 | |
| Average AMD Ryzen 7 4800U (4420 - 4603, n=3) | |
| Intel NUC10i5FNK | |
| Beelink SER3 | |
| Infinix INBook X2 | |
| GMK NucBox 3 | |
| Geekbench 5.5 / Multi-Core | |
| Beelink GTR5 | |
| Lenovo ThinkBook 13s G3 20YA0005GE | |
| Beelink SER4 | |
| Average AMD Ryzen 7 4800U (5798 - 6950, n=4) | |
| Intel NUC11PAQi7 | |
| Intel NUC11TNKi5 | |
| Intel NUC10i5FNK | |
| Infinix INBook X2 | |
| GMK NucBox 3 | |
| Geekbench 5.5 / Single-Core | |
| Beelink GTR5 | |
| Intel NUC11PAQi7 | |
| Lenovo ThinkBook 13s G3 20YA0005GE | |
| Intel NUC11TNKi5 | |
| Beelink SER4 | |
| Infinix INBook X2 | |
| Average AMD Ryzen 7 4800U (1150 - 1192, n=4) | |
| Intel NUC10i5FNK | |
| GMK NucBox 3 | |
| HWBOT x265 Benchmark v2.2 / 4k Preset | |
| Beelink GTR5 | |
| Beelink SER4 | |
| Average AMD Ryzen 7 4800U (9.48 - 10.8, n=3) | |
| Lenovo ThinkBook 13s G3 20YA0005GE | |
| Intel NUC11PAQi7 | |
| Intel NUC11TNKi5 | |
| Intel NUC10i5FNK | |
| Infinix INBook X2 | |
| Beelink SER3 | |
| GMK NucBox 3 | |
| LibreOffice / 20 Documents To PDF | |
| GMK NucBox 3 | |
| Beelink SER3 | |
| Infinix INBook X2 | |
| Beelink SER4 | |
| Average AMD Ryzen 7 4800U (57.8 - 62.6, n=3) | |
| Intel NUC11TNKi5 | |
| Lenovo ThinkBook 13s G3 20YA0005GE | |
| Beelink GTR5 | |
| Intel NUC11PAQi7 | |
| R Benchmark 2.5 / Overall mean | |
| GMK NucBox 3 | |
| Infinix INBook X2 | |
| Beelink SER3 | |
| Intel NUC10i5FNK | |
| Intel NUC11TNKi5 | |
| Average AMD Ryzen 7 4800U (0.576 - 0.613, n=3) | |
| Beelink SER4 | |
| Intel NUC11PAQi7 | |
| Lenovo ThinkBook 13s G3 20YA0005GE | |
| Beelink GTR5 | |
* ... smaller is better
AIDA64: FP32 Ray-Trace | FPU Julia | CPU SHA3 | CPU Queen | FPU SinJulia | FPU Mandel | CPU AES | CPU ZLib | FP64 Ray-Trace | CPU PhotoWorxx
| Performance rating | |
| Beelink GTR5 | |
| Beelink SER4 | |
| Average AMD Ryzen 7 4800U | |
| Beelink SER3 | |
| GMK NucBox 3 | |
| AIDA64 / FP32 Ray-Trace | |
| Beelink GTR5 | |
| Beelink SER4 | |
| Average AMD Ryzen 7 4800U (9268 - 10046, n=2) | |
| Beelink SER3 | |
| GMK NucBox 3 | |
| AIDA64 / FPU Julia | |
| Beelink GTR5 | |
| Beelink SER4 | |
| Average AMD Ryzen 7 4800U (53257 - 56388, n=2) | |
| Beelink SER3 | |
| GMK NucBox 3 | |
| AIDA64 / CPU SHA3 | |
| Beelink GTR5 | |
| Beelink SER4 | |
| Average AMD Ryzen 7 4800U (1732 - 1840, n=2) | |
| Beelink SER3 | |
| GMK NucBox 3 | |
| AIDA64 / CPU Queen | |
| Beelink GTR5 | |
| Beelink SER4 | |
| Average AMD Ryzen 7 4800U (77333 - 78511, n=2) | |
| Beelink SER3 | |
| GMK NucBox 3 | |
| AIDA64 / FPU SinJulia | |
| Beelink GTR5 | |
| Beelink SER4 | |
| Average AMD Ryzen 7 4800U (11293 - 11799, n=2) | |
| Beelink SER3 | |
| GMK NucBox 3 | |
| AIDA64 / FPU Mandel | |
| Beelink GTR5 | |
| Beelink SER4 | |
| Average AMD Ryzen 7 4800U (27938 - 28667, n=2) | |
| Beelink SER3 | |
| GMK NucBox 3 | |
| AIDA64 / CPU AES | |
| Beelink GTR5 | |
| Beelink SER4 | |
| Average AMD Ryzen 7 4800U (52147 - 54686, n=2) | |
| Beelink SER3 | |
| GMK NucBox 3 | |
| AIDA64 / CPU ZLib | |
| Beelink GTR5 | |
| Beelink SER4 | |
| Average AMD Ryzen 7 4800U (580 - 593, n=2) | |
| Beelink SER3 | |
| GMK NucBox 3 | |
| AIDA64 / FP64 Ray-Trace | |
| Beelink GTR5 | |
| Beelink SER4 | |
| Average AMD Ryzen 7 4800U (4877 - 5555, n=2) | |
| Beelink SER3 | |
| GMK NucBox 3 | |
| AIDA64 / CPU PhotoWorxx | |
| Beelink SER4 | |
| Average AMD Ryzen 7 4800U (22818 - 24254, n=2) | |
| Beelink GTR5 | |
| Beelink SER3 | |
| GMK NucBox 3 | |
System Performance
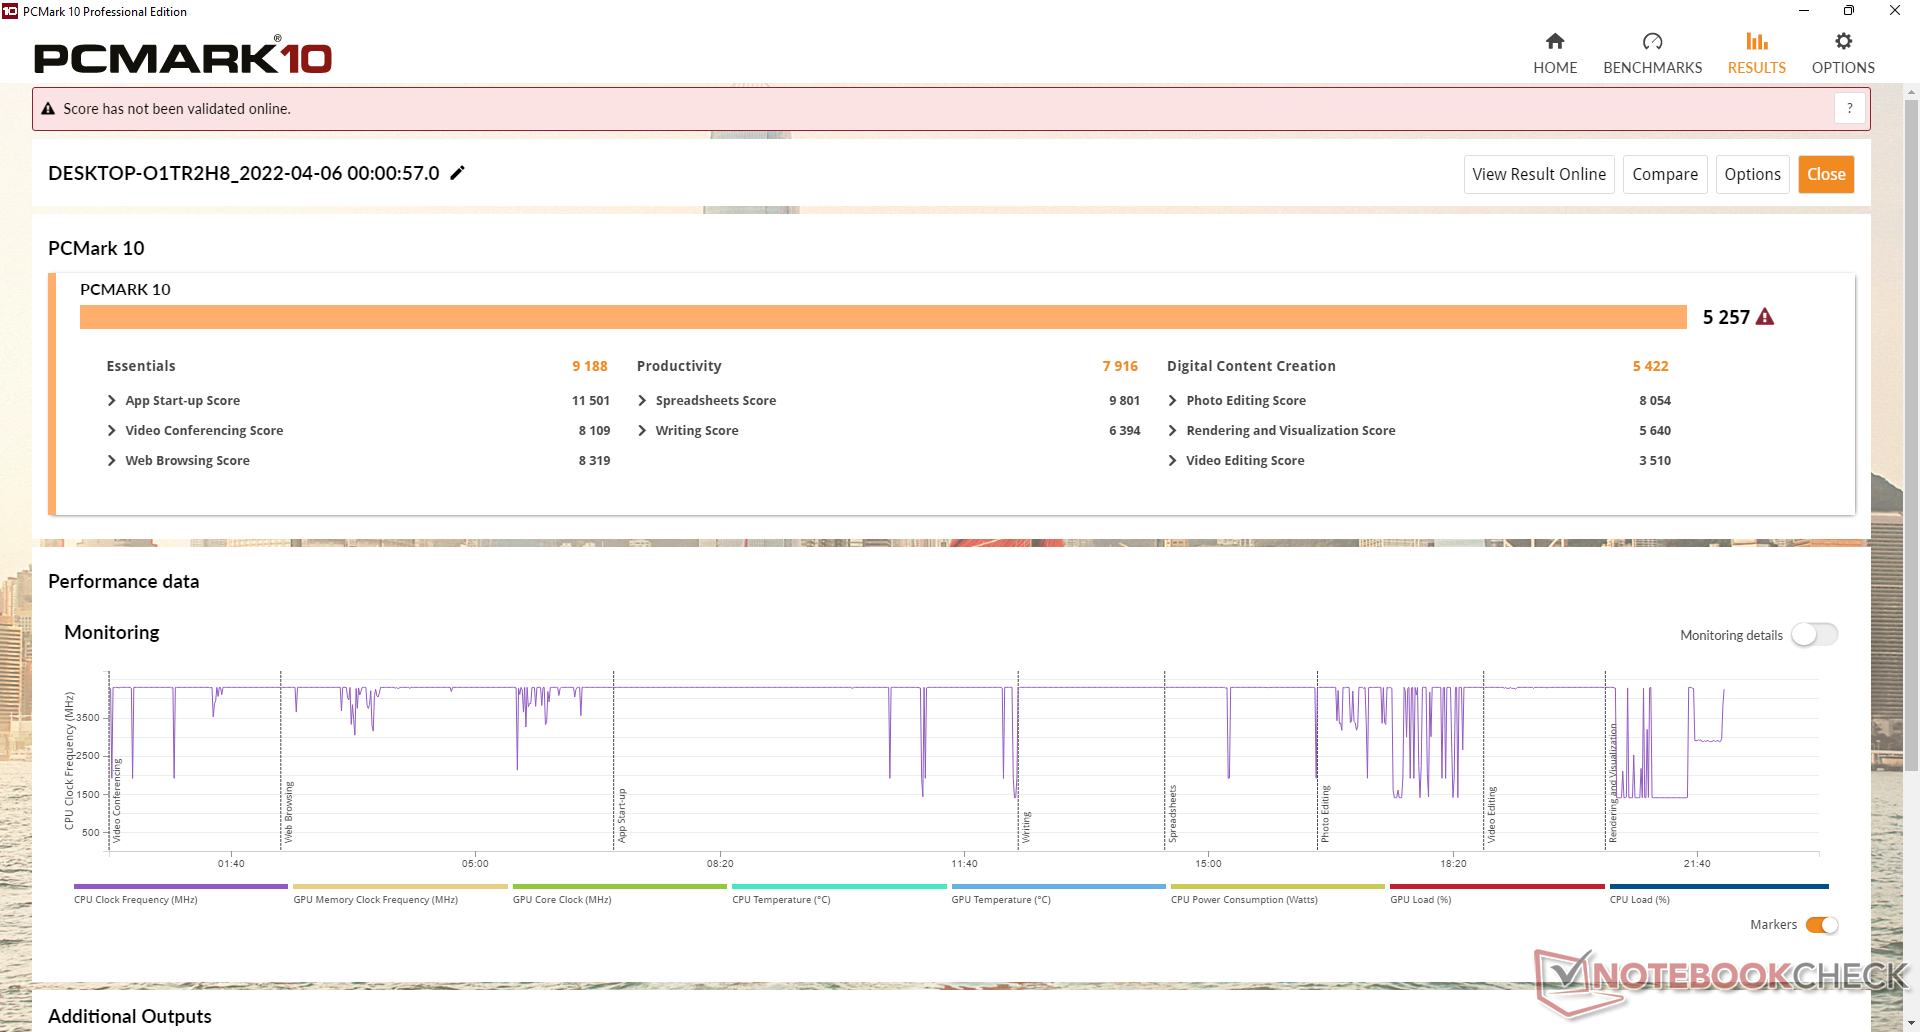
PCMark 10 results are on par if not slightly higher than the Intel NUC 11 running on an 11th gen Core i7-1165G7. We suspect that the Intel model could have scored even higher, however, had our Intel test unit not been limited to single-channel memory.
CrossMark: Overall | Productivity | Creativity | Responsiveness
| PCMark 10 / Score | |
| Beelink GTR5 | |
| Average AMD Ryzen 7 4800U, AMD Radeon RX Vega 8 (Ryzen 4000/5000) (5233 - 5383, n=3) | |
| Beelink SER4 | |
| Intel NUC11PAQi7 | |
| Intel NUC10i5FNK | |
| Beelink SER3 | |
| GMK NucBox 3 | |
| PCMark 10 / Essentials | |
| Beelink GTR5 | |
| Intel NUC11PAQi7 | |
| Average AMD Ryzen 7 4800U, AMD Radeon RX Vega 8 (Ryzen 4000/5000) (9188 - 9637, n=3) | |
| Beelink SER4 | |
| Intel NUC10i5FNK | |
| Beelink SER3 | |
| GMK NucBox 3 | |
| PCMark 10 / Productivity | |
| Beelink GTR5 | |
| Beelink SER4 | |
| Average AMD Ryzen 7 4800U, AMD Radeon RX Vega 8 (Ryzen 4000/5000) (7631 - 8091, n=3) | |
| Intel NUC11PAQi7 | |
| Intel NUC10i5FNK | |
| Beelink SER3 | |
| GMK NucBox 3 | |
| PCMark 10 / Digital Content Creation | |
| Beelink GTR5 | |
| Average AMD Ryzen 7 4800U, AMD Radeon RX Vega 8 (Ryzen 4000/5000) (5123 - 5758, n=3) | |
| Beelink SER4 | |
| Intel NUC11PAQi7 | |
| Beelink SER3 | |
| Intel NUC10i5FNK | |
| GMK NucBox 3 | |
| CrossMark / Overall | |
| Beelink GTR5 | |
| CrossMark / Productivity | |
| Beelink GTR5 | |
| CrossMark / Creativity | |
| Beelink GTR5 | |
| CrossMark / Responsiveness | |
| Beelink GTR5 | |
| PCMark 10 Score | 5257 points | |
Help | ||
| AIDA64 / Memory Copy | |
| Beelink GTR5 | |
| Average AMD Ryzen 7 4800U (37086 - 40961, n=2) | |
| Beelink SER4 | |
| Beelink SER3 | |
| GMK NucBox 3 | |
| AIDA64 / Memory Read | |
| Beelink GTR5 | |
| Average AMD Ryzen 7 4800U (44706 - 46406, n=2) | |
| Beelink SER4 | |
| Beelink SER3 | |
| GMK NucBox 3 | |
| AIDA64 / Memory Write | |
| Beelink SER4 | |
| Average AMD Ryzen 7 4800U (42240 - 43768, n=2) | |
| Beelink GTR5 | |
| Beelink SER3 | |
| GMK NucBox 3 | |
| AIDA64 / Memory Latency | |
| Average AMD Ryzen 7 4800U (94.7 - 115, n=2) | |
| Beelink SER3 | |
| Beelink SER4 | |
| GMK NucBox 3 | |
| Beelink GTR5 | |
* ... smaller is better
DPC Latency
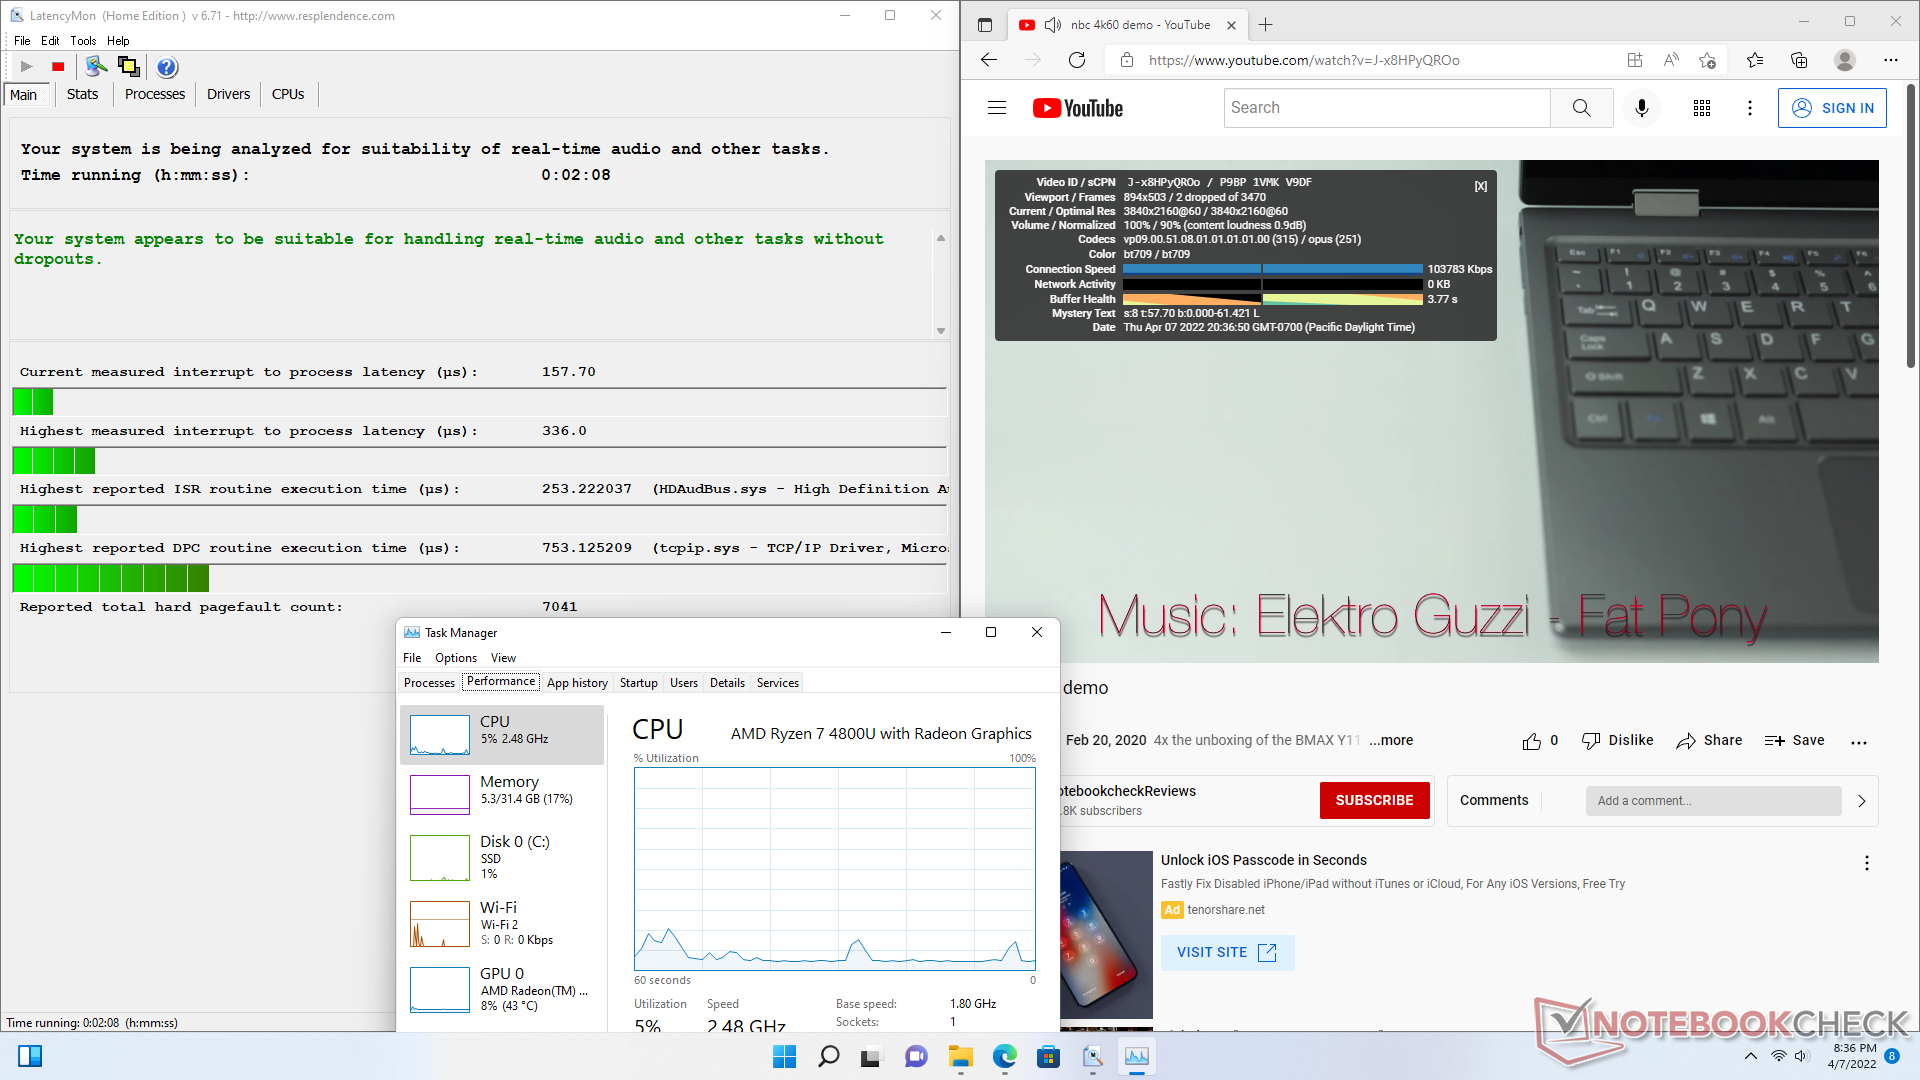
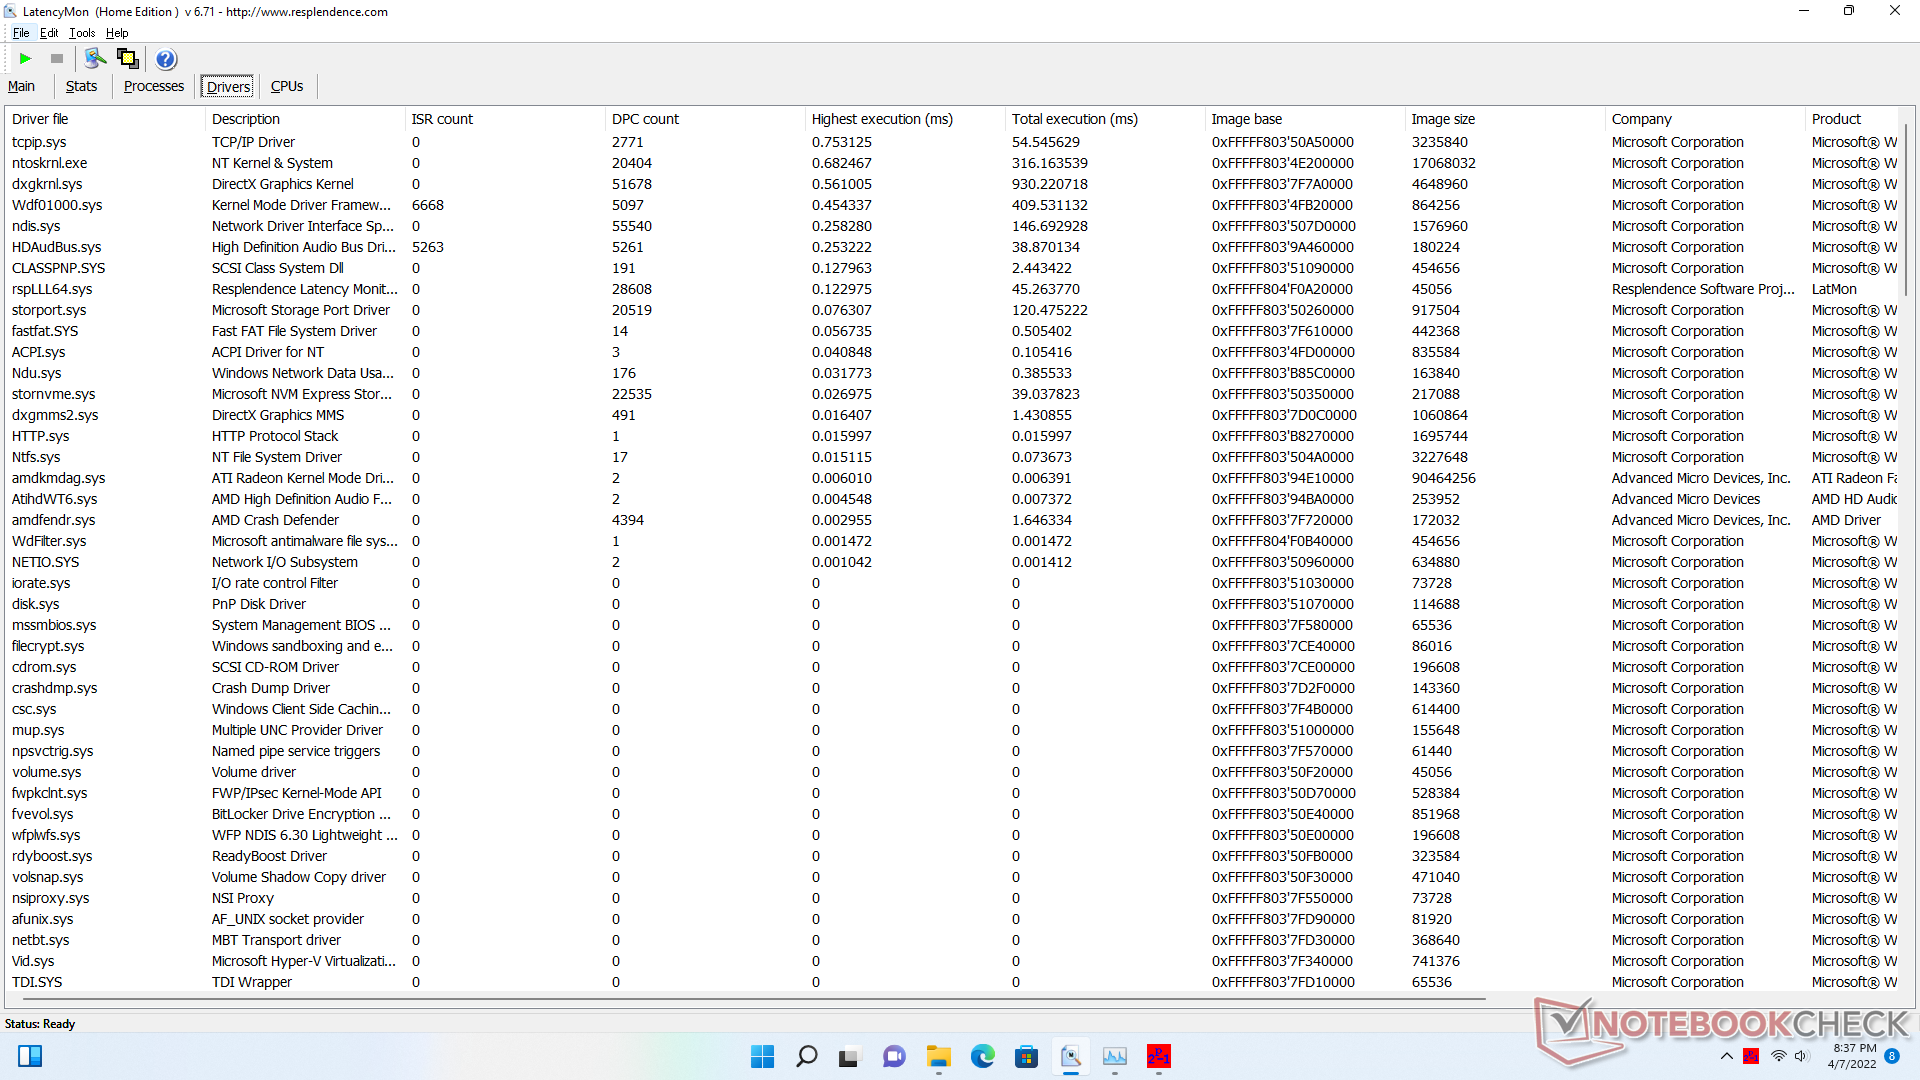
LatencyMon reveals no DPC issues when opening multiple browser tabs on our homepage. 4K video playback at 60 FPS is nearly perfect with just 2 dropped frames during our minute-long video.
| DPC Latencies / LatencyMon - interrupt to process latency (max), Web, Youtube, Prime95 | |
| GMK NucBox 3 | |
| Beelink SER3 | |
| Intel NUC11PAQi7 | |
| Beelink SER4 | |
| Beelink GTR5 | |
* ... smaller is better
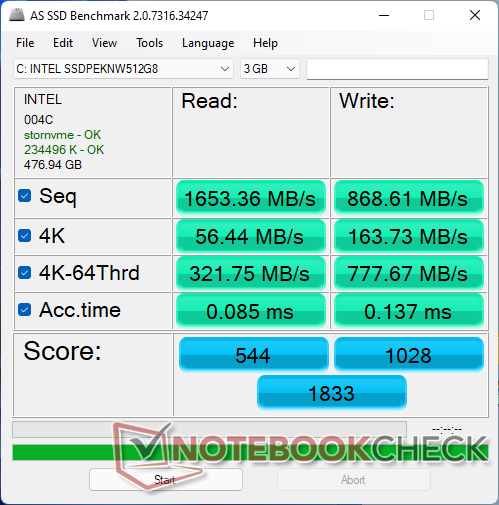
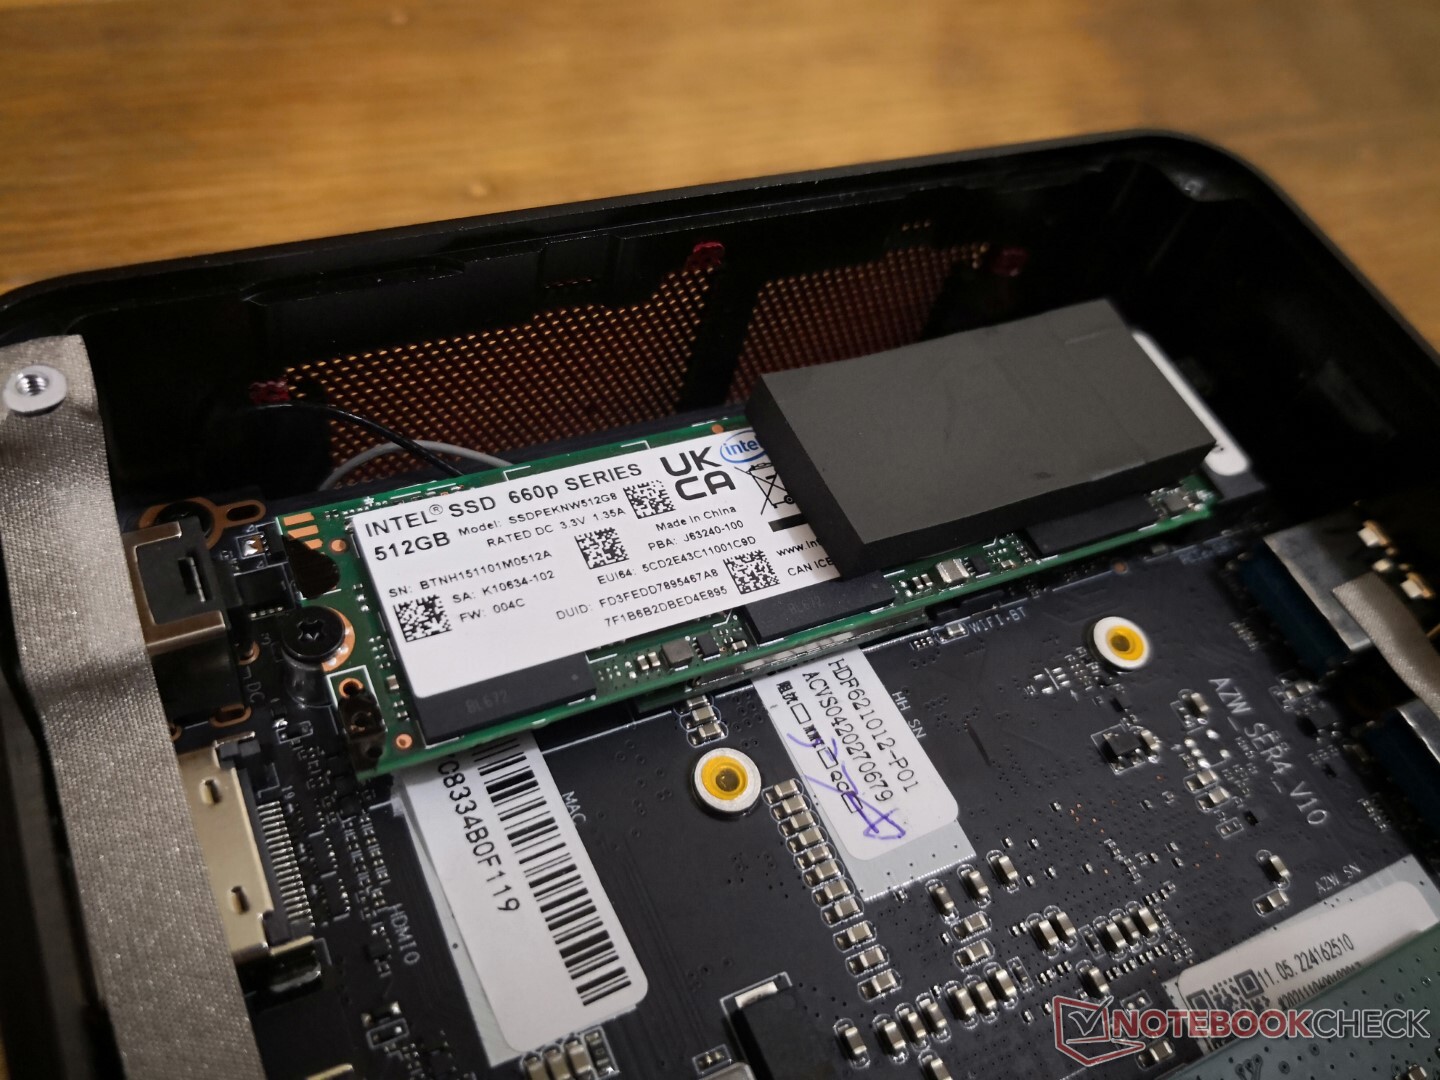
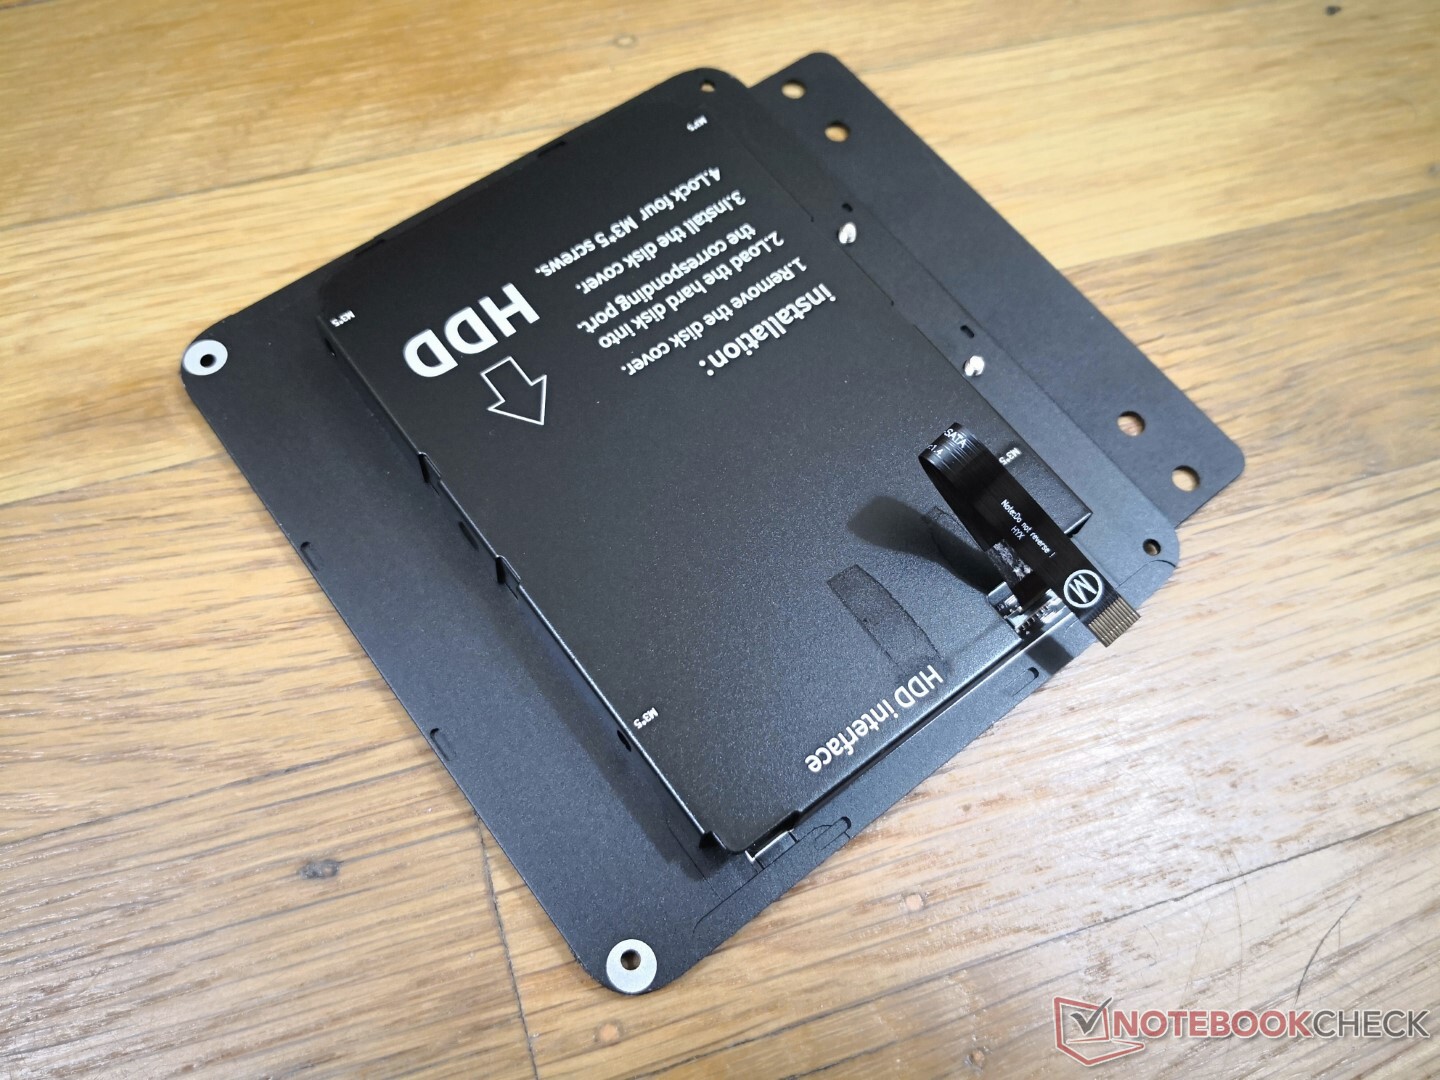
Storage Devices — PCIe3 x4 + 2.5-inch SATA III
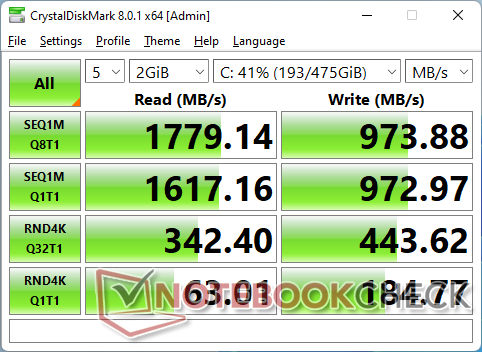
Our test unit includes a 512 GB Intel SSD 660p which is a budget PCIe3 x4 NVMe SSD. Sequential read rates top out at only around 1400 MB/s compared to >3000 MB/s or >7000 MB/s on higher-end PCIe3 or PCIe4 drives, respectively. For the target audience, however, the Intel 660p will be sufficient.

| Drive Performance rating - Percent | |
| Intel NUC11PAQi7 | |
| Beelink GTR5 | |
| Beelink SER4 | |
| Beelink SER3 | |
| Intel NUC10i5FNK | |
| GMK NucBox 3 | |
* ... smaller is better
Disk Throttling: DiskSpd Read Loop, Queue Depth 8
GPU Performance — Neck To Neck With The Iris Xe 80 EUs
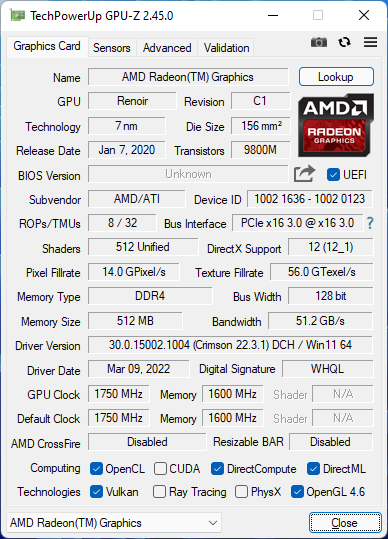
The integrated Radeon Vega 8 GPU is still very good despite it being a generation or two old. 3DMark results are about 20 to 30 percent slower than the competing Iris Xe 96 EUs running on dual-channel RAM or about 5 to 20 percent faster if said Intel GPU was running on single-channel RAM instead. Expecting over 30 FPS in low 1080p or 720p settings is not unreasonable depending on the title.
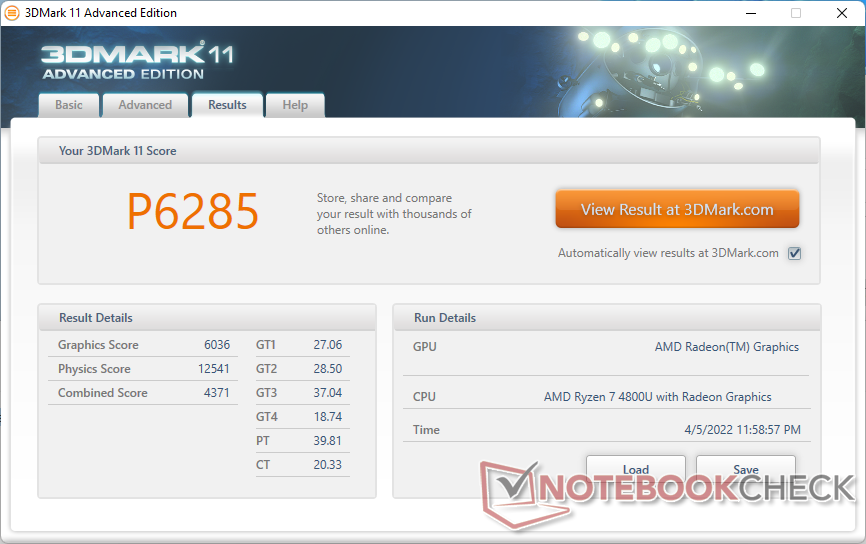
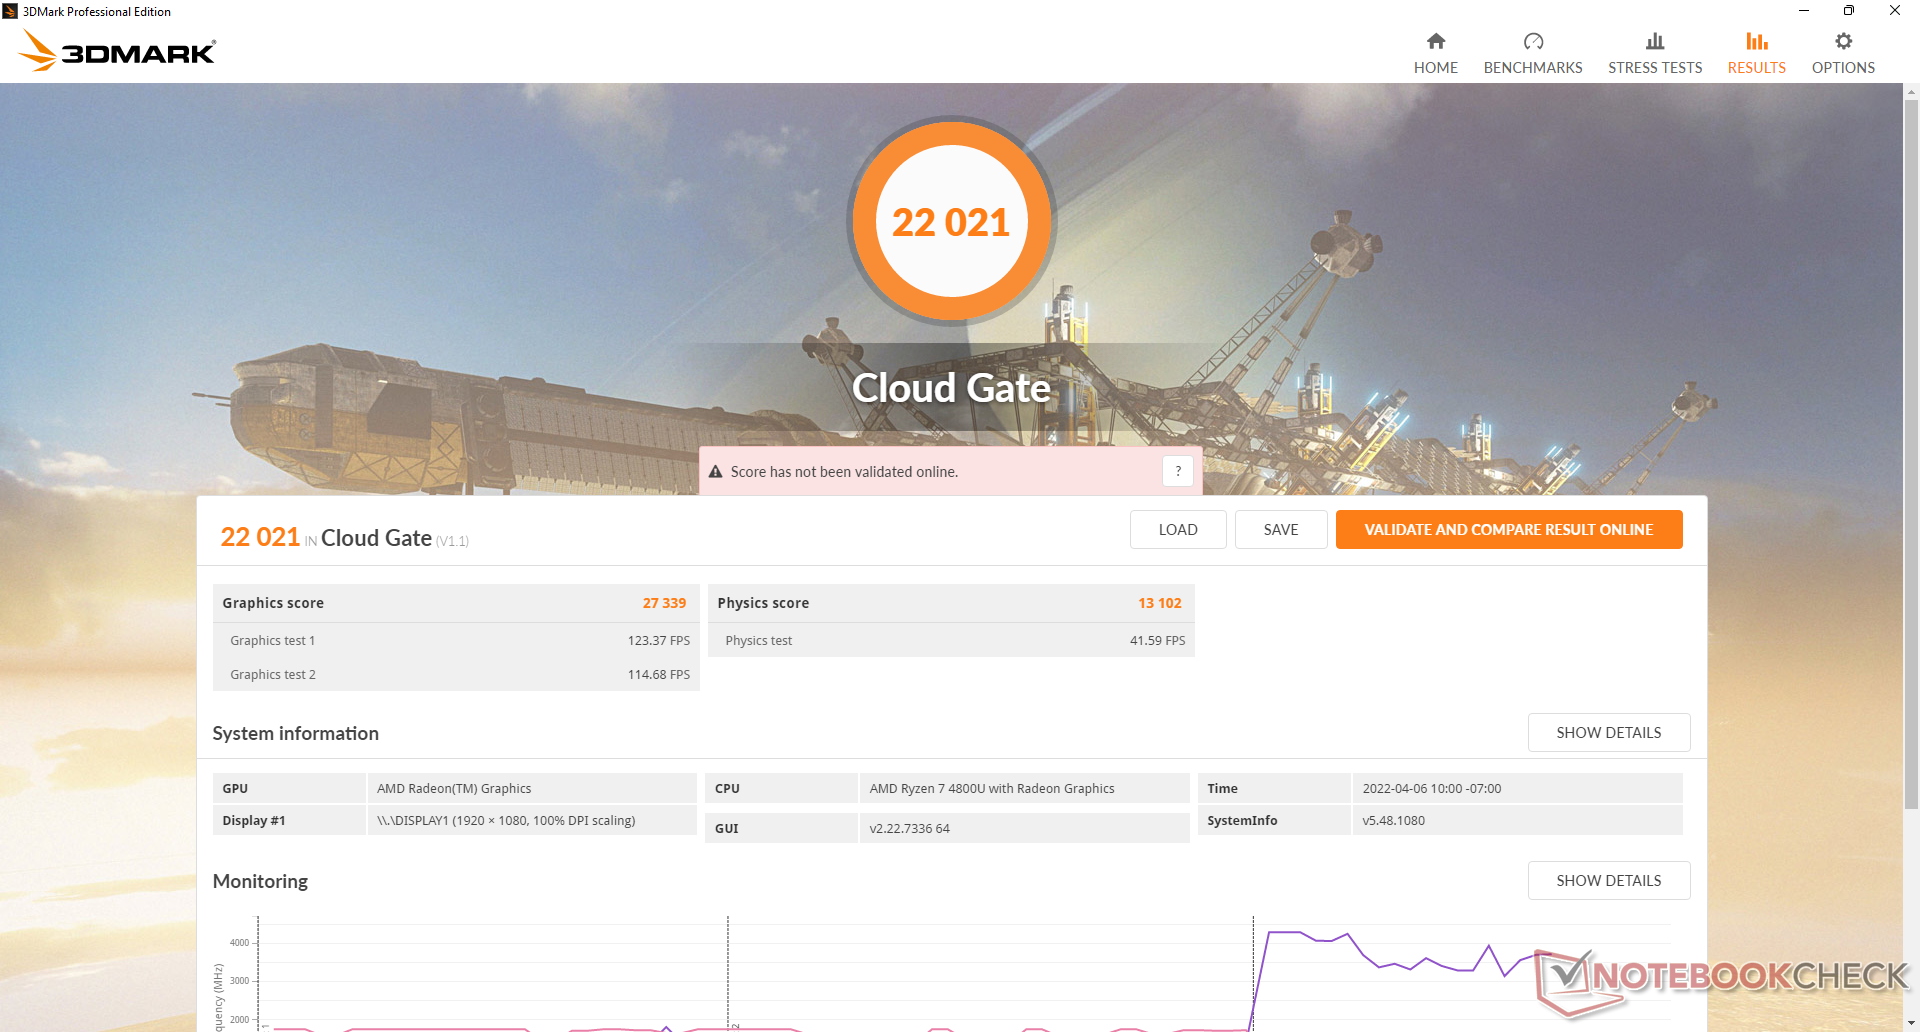
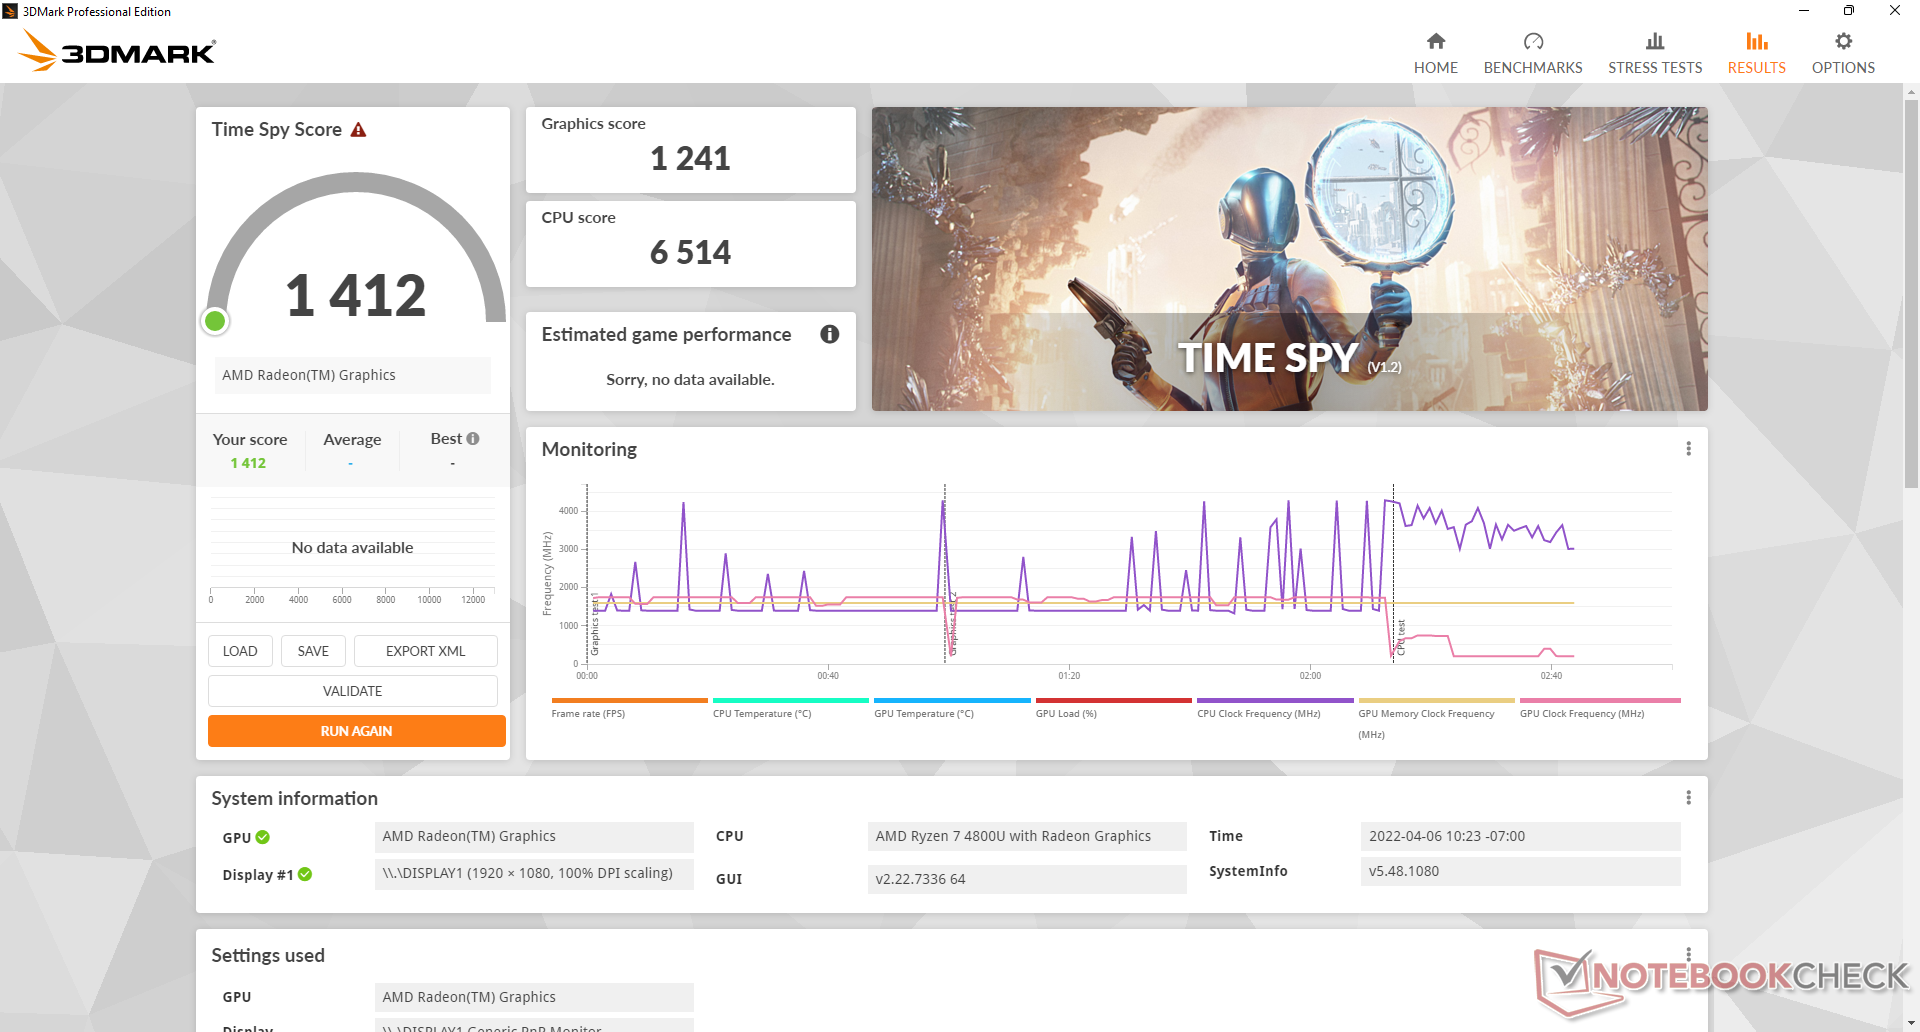
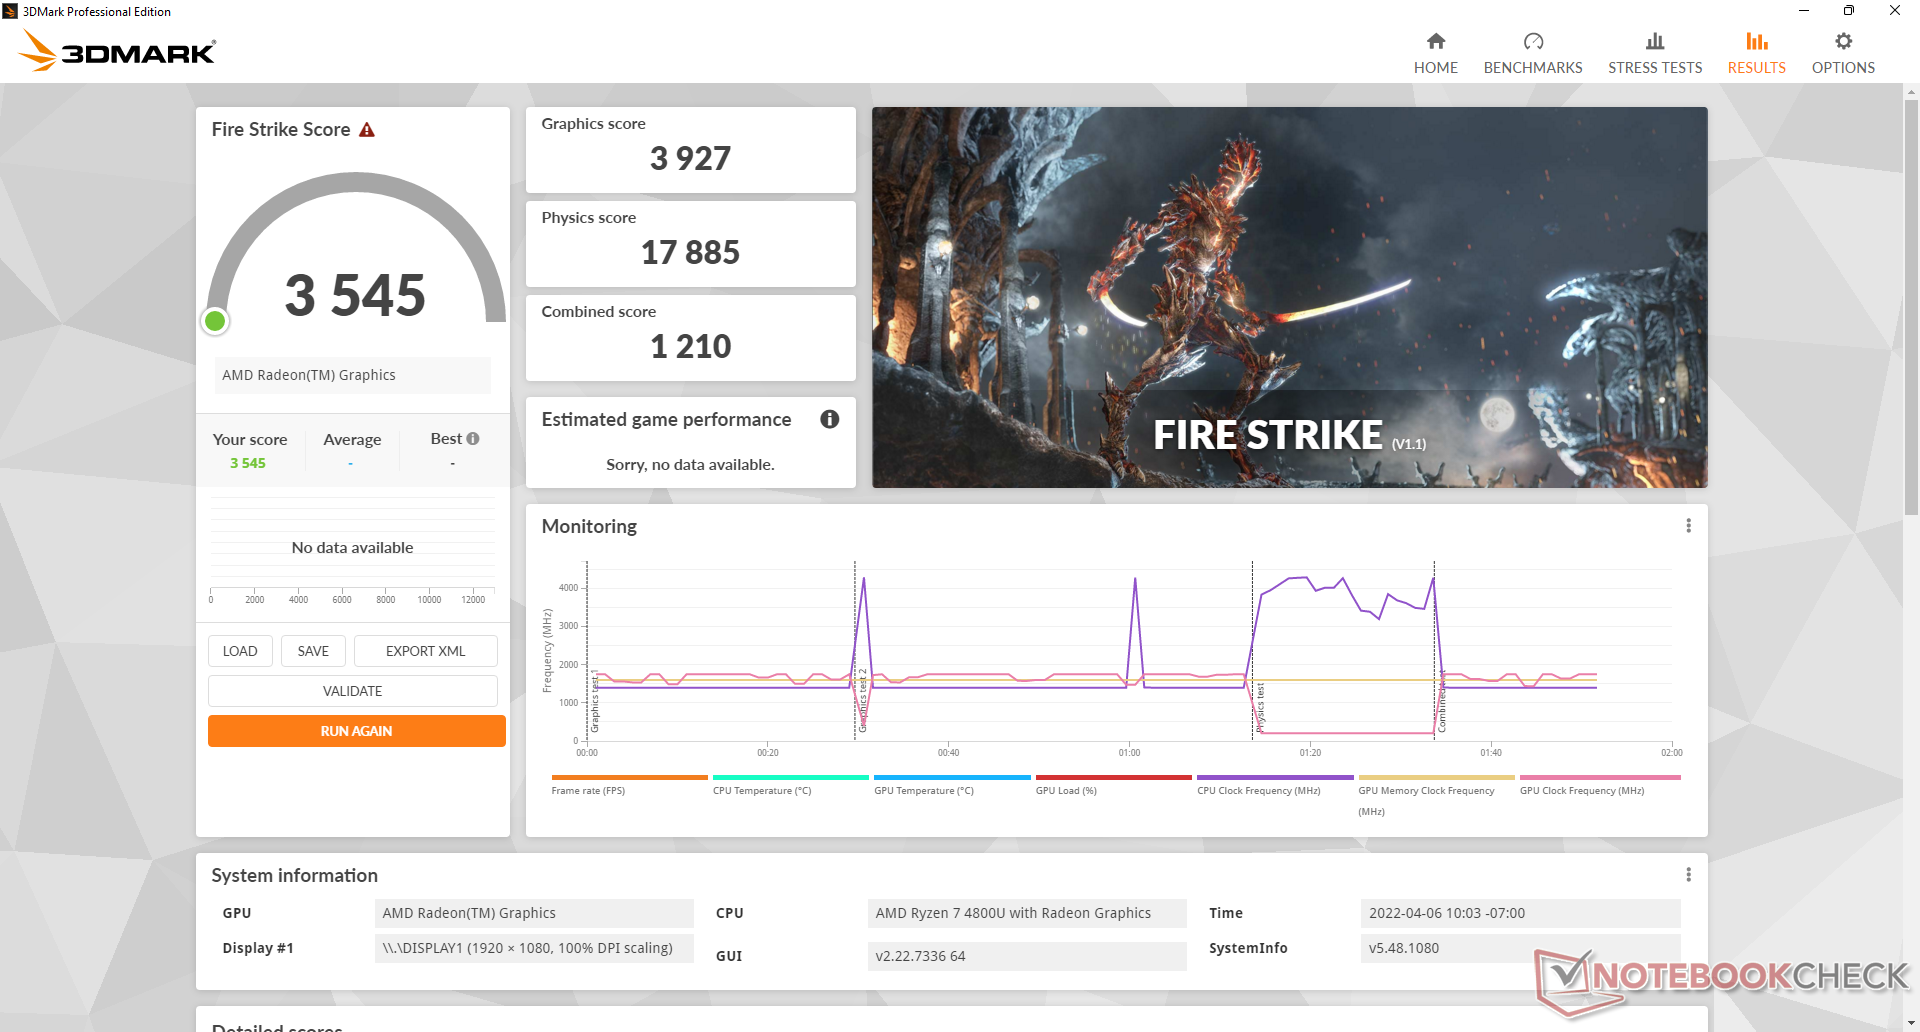
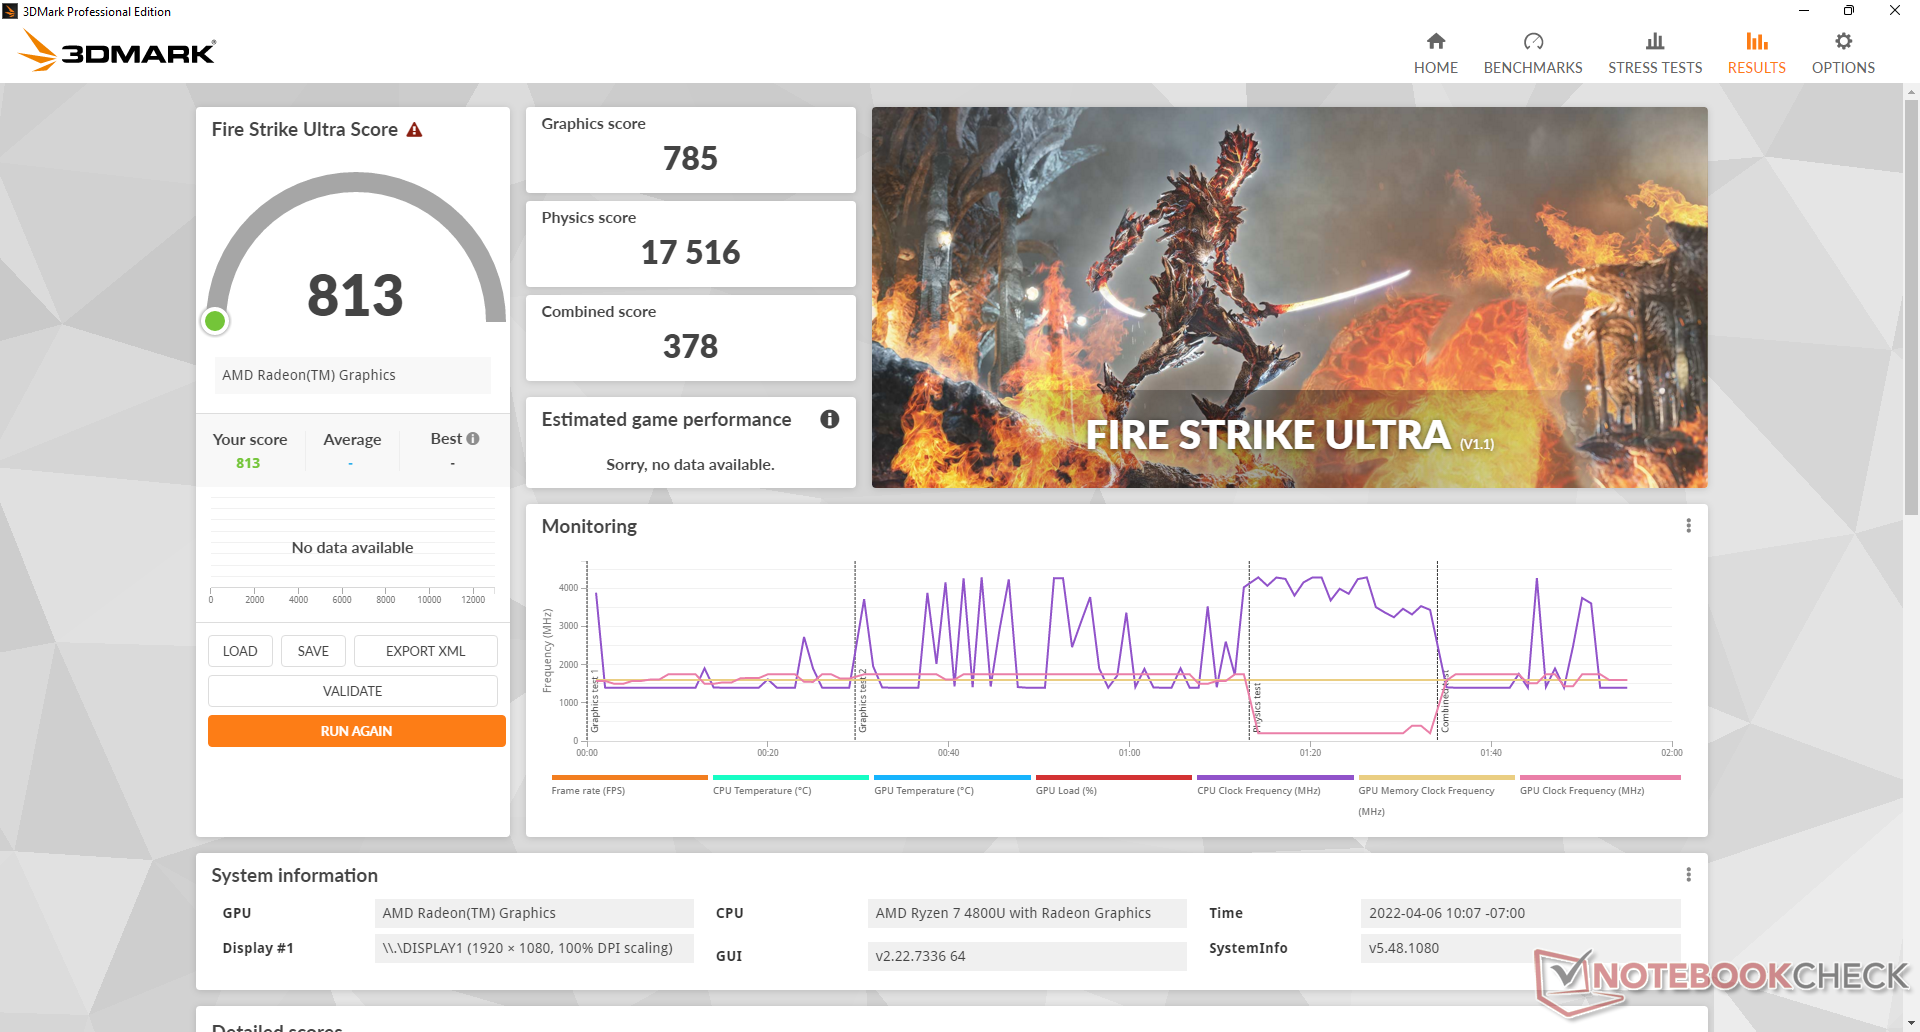
| 3DMark 11 Performance | 6285 points | |
| 3DMark Cloud Gate Standard Score | 22021 points | |
| 3DMark Fire Strike Score | 3545 points | |
| 3DMark Time Spy Score | 1412 points | |
Help | ||
| The Witcher 3 | |
| 1024x768 Low Graphics & Postprocessing | |
| Samsung Galaxy Book Pro 15 NP950XDB-KC5US | |
| Beelink GTR5 | |
| Intel NUC11PAQi7 | |
| Average AMD Radeon RX Vega 8 (Ryzen 4000/5000) (27.2 - 89, n=47) | |
| Beelink SER4 | |
| Beelink SER3 | |
| 1366x768 Medium Graphics & Postprocessing | |
| Samsung Galaxy Book Pro 15 NP950XDB-KC5US | |
| Beelink GTR5 | |
| Beelink SER4 | |
| Intel NUC11PAQi7 | |
| Average AMD Radeon RX Vega 8 (Ryzen 4000/5000) (19.6 - 55.2, n=35) | |
| Beelink SER3 | |
| 1920x1080 High Graphics & Postprocessing (Nvidia HairWorks Off) | |
| Samsung Galaxy Book Pro 15 NP950XDB-KC5US | |
| Beelink GTR5 | |
| Beelink SER4 | |
| Intel NUC11PAQi7 | |
| Average AMD Radeon RX Vega 8 (Ryzen 4000/5000) (8.7 - 26.8, n=46) | |
| Beelink SER3 | |
| 1920x1080 Ultra Graphics & Postprocessing (HBAO+) | |
| Beelink GTR5 | |
| Samsung Galaxy Book Pro 15 NP950XDB-KC5US | |
| Beelink SER4 | |
| Average AMD Radeon RX Vega 8 (Ryzen 4000/5000) (7.07 - 17.6, n=49) | |
| Intel NUC11PAQi7 | |
| Beelink SER3 | |
Witcher 3 FPS Chart
| low | med. | high | ultra | |
|---|---|---|---|---|
| GTA V (2015) | 110 | 98.3 | 29.6 | 13.4 |
| The Witcher 3 (2015) | 64.2 | 45.2 | 22.6 | 14.3 |
| Dota 2 Reborn (2015) | 103 | 83.3 | 53.1 | 51.1 |
| Final Fantasy XV Benchmark (2018) | 37.3 | 19.2 | 13.8 | |
| X-Plane 11.11 (2018) | 41.1 | 33.2 | 29.5 | |
| Far Cry 5 (2018) | 46 | 22 | 20 | 19 |
| Strange Brigade (2018) | 82.3 | 33.3 | 28.1 | 24 |
Emissions
System Noise — Annoying Pulsing Behavior
Fan noise is perhaps the worst aspect of the SER4. Though not nearly as loud as the Ryzen 9 H-powered GTR5, the SER4 is still very loud for a U-series mini PC. Idling on desktop, for example, is enough to cause a fan noise of 33.2 dB(A) against a silent background of 23.4 dB(A). Low processing loads like web browsing or video streaming may annoyingly cause the fan to fluctuate between 33 and 39 dB(A). In contrast, the Intel NUC 11 is able to remain quieter or even near silent for longer periods.
Fan noise can be as loud as 40 dB(A) when running gaming loads compared to just 34 dB(A) on the NUC 11.
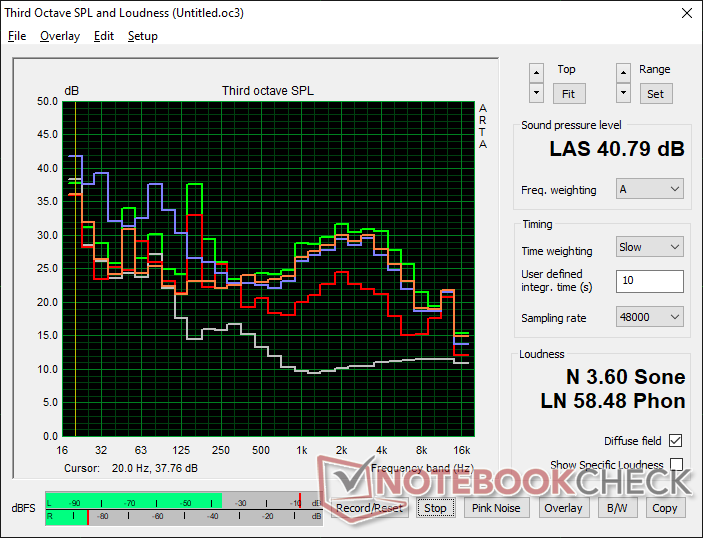
Noise level
| Idle |
| 33.2 / 33.2 / 33.2 dB(A) |
| Load |
| 38.6 / 40.8 dB(A) |
 | ||
30 dB silent 40 dB(A) audible 50 dB(A) loud |
||
min: | ||
| Beelink SER4 Vega 8, R7 4800U, Intel SSD 660p SSDPEKNW512G8 | Beelink GTR5 Vega 8, R9 5900HX, Kingston NV1 SNVS/500GCN | Intel NUC11PAQi7 Iris Xe G7 96EUs, i7-1165G7, Samsung SSD 980 Pro 500GB MZ-V8P500BW | Beelink SER3 Vega 10, R7 3750H, GSemi AZW GSDFN512TS3F1OGCX | |
|---|---|---|---|---|
| Noise | -6% | 8% | 11% | |
| off / environment * (dB) | 23.4 | 23.1 1% | 25.6 -9% | 23.4 -0% |
| Idle Minimum * (dB) | 33.2 | 34.2 -3% | 25.6 23% | 23.4 30% |
| Idle Average * (dB) | 33.2 | 34.2 -3% | 25.6 23% | 23.4 30% |
| Idle Maximum * (dB) | 33.2 | 34.2 -3% | 25.6 23% | 29.4 11% |
| Load Average * (dB) | 38.6 | 44.6 -16% | 33.6 13% | 35.2 9% |
| Witcher 3 ultra * (dB) | 39.2 | 41.4 -6% | 33.6 14% | 37.2 5% |
| Load Maximum * (dB) | 40.8 | 45.1 -11% | 54.5 -34% | 43.3 -6% |
* ... smaller is better
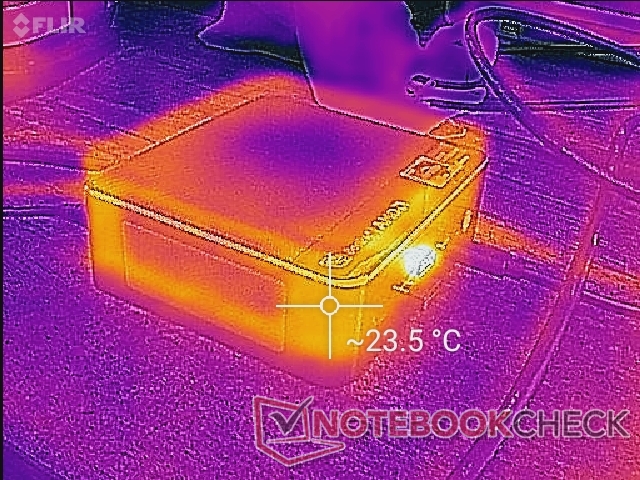
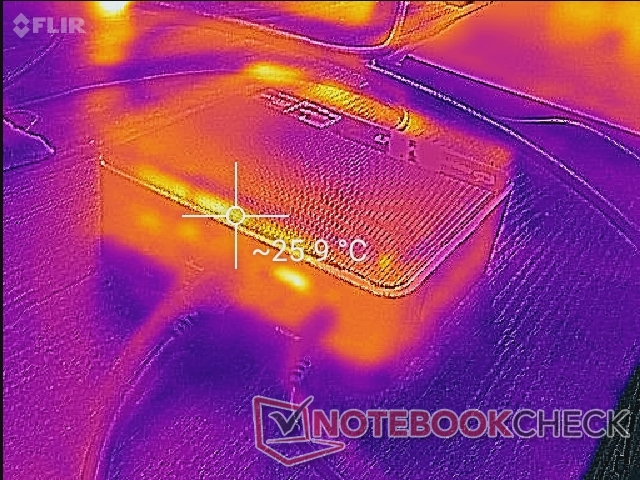
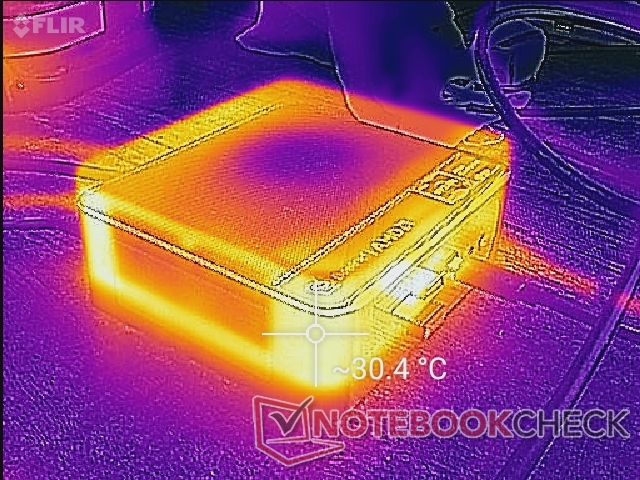
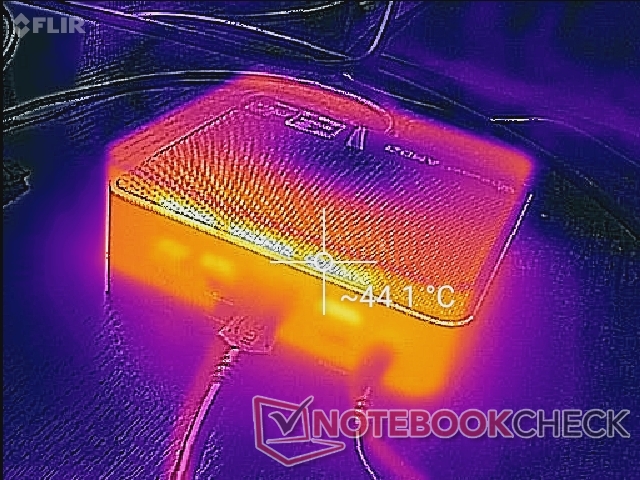
Temperature — Keep That Top Clear
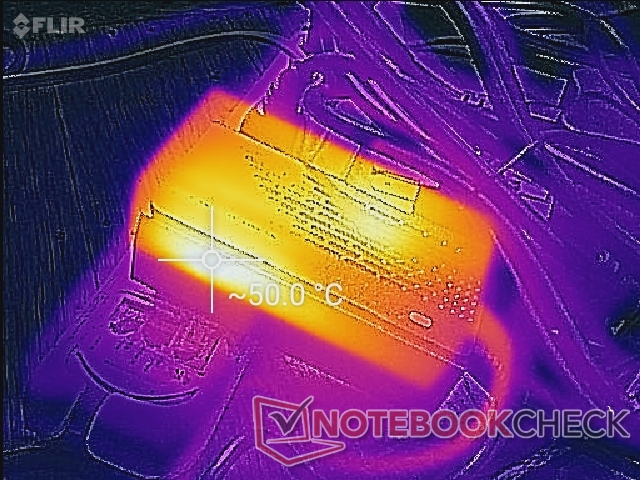
Surface temperatures are not an issue. The unit has ventilation grilles on four of its six sides for airflow. Cool air enters from the top surface and so it's not recommended to place any papers or books on top of the unit.
Stress Test
When stressed under Prime95, the CPU would boost to 2.8 GHz indefinitely and at a stable SoC temperature of 64 C. Running this same test on the Intel NUC11PAQi7 would result in a warmer core temperature of up to 79 C. Clock rates remain stable and with no cycling behavior when gaming as well.
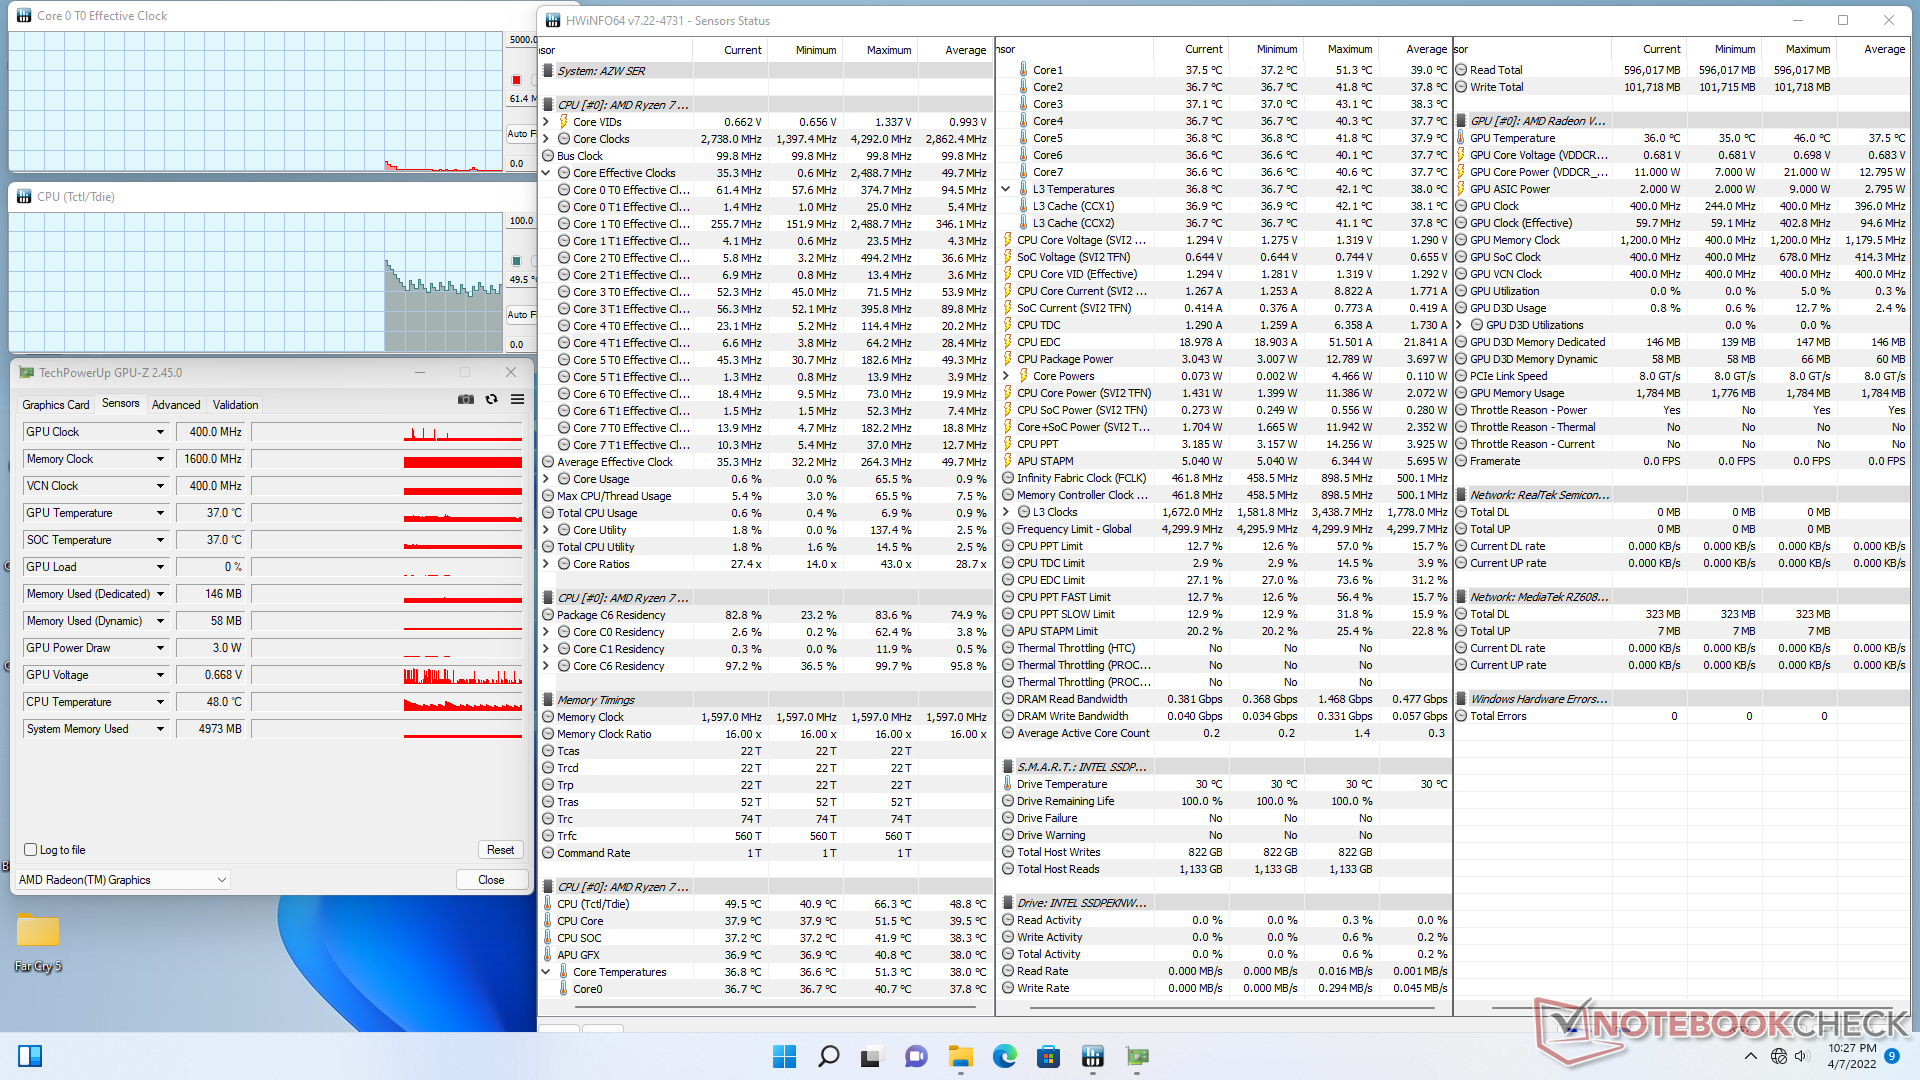
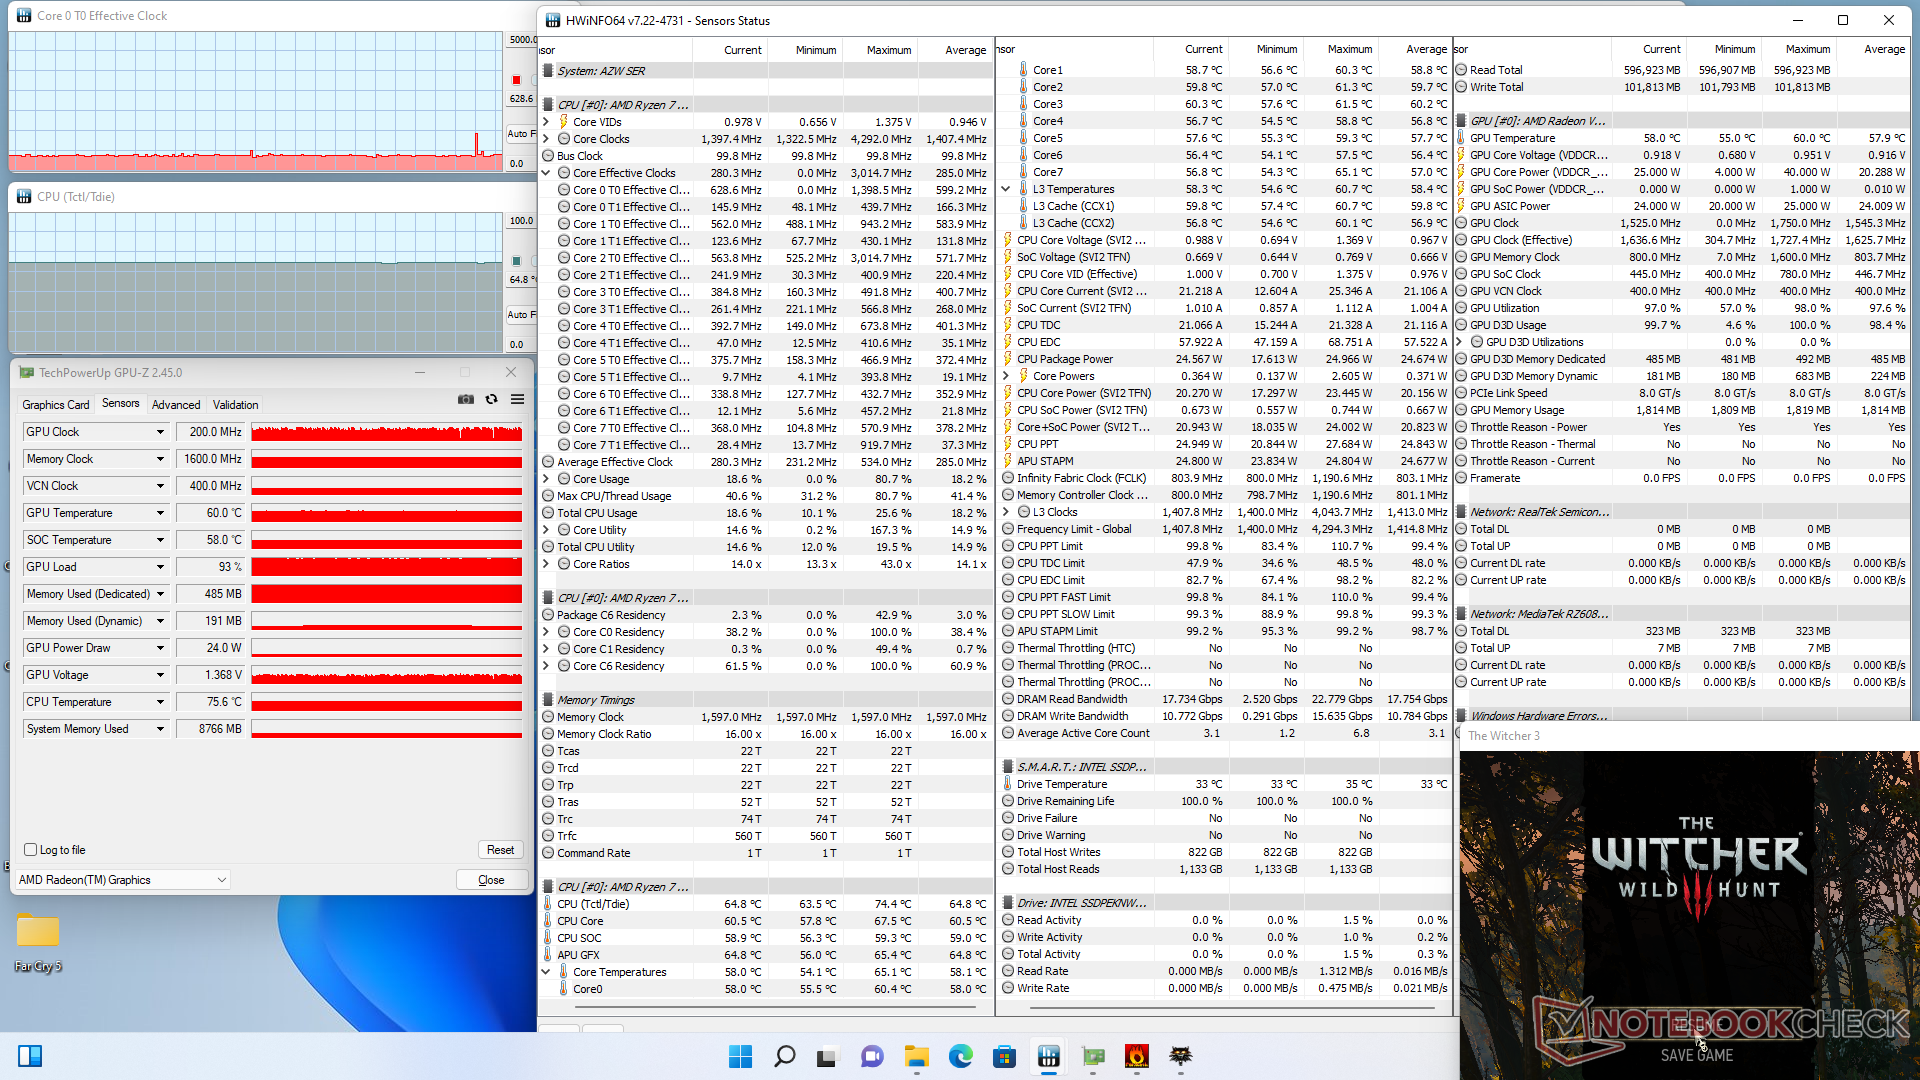
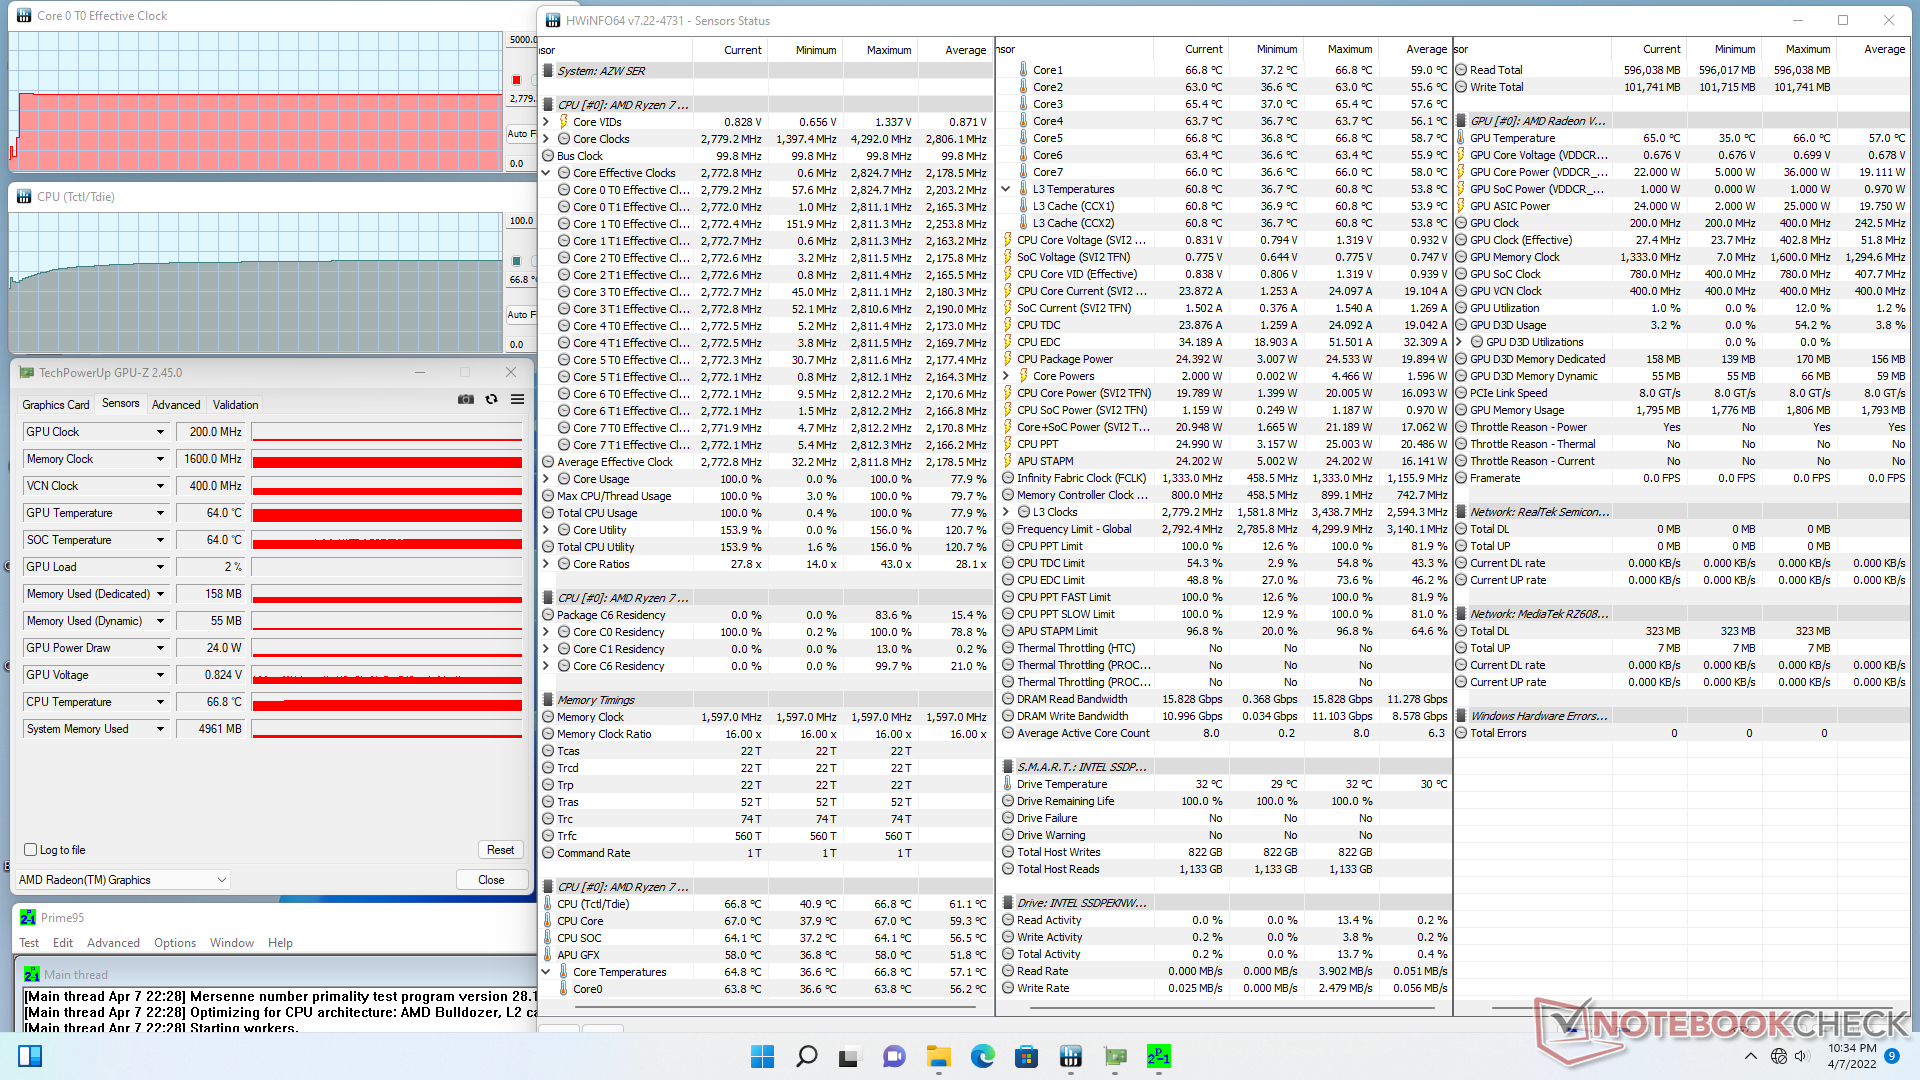
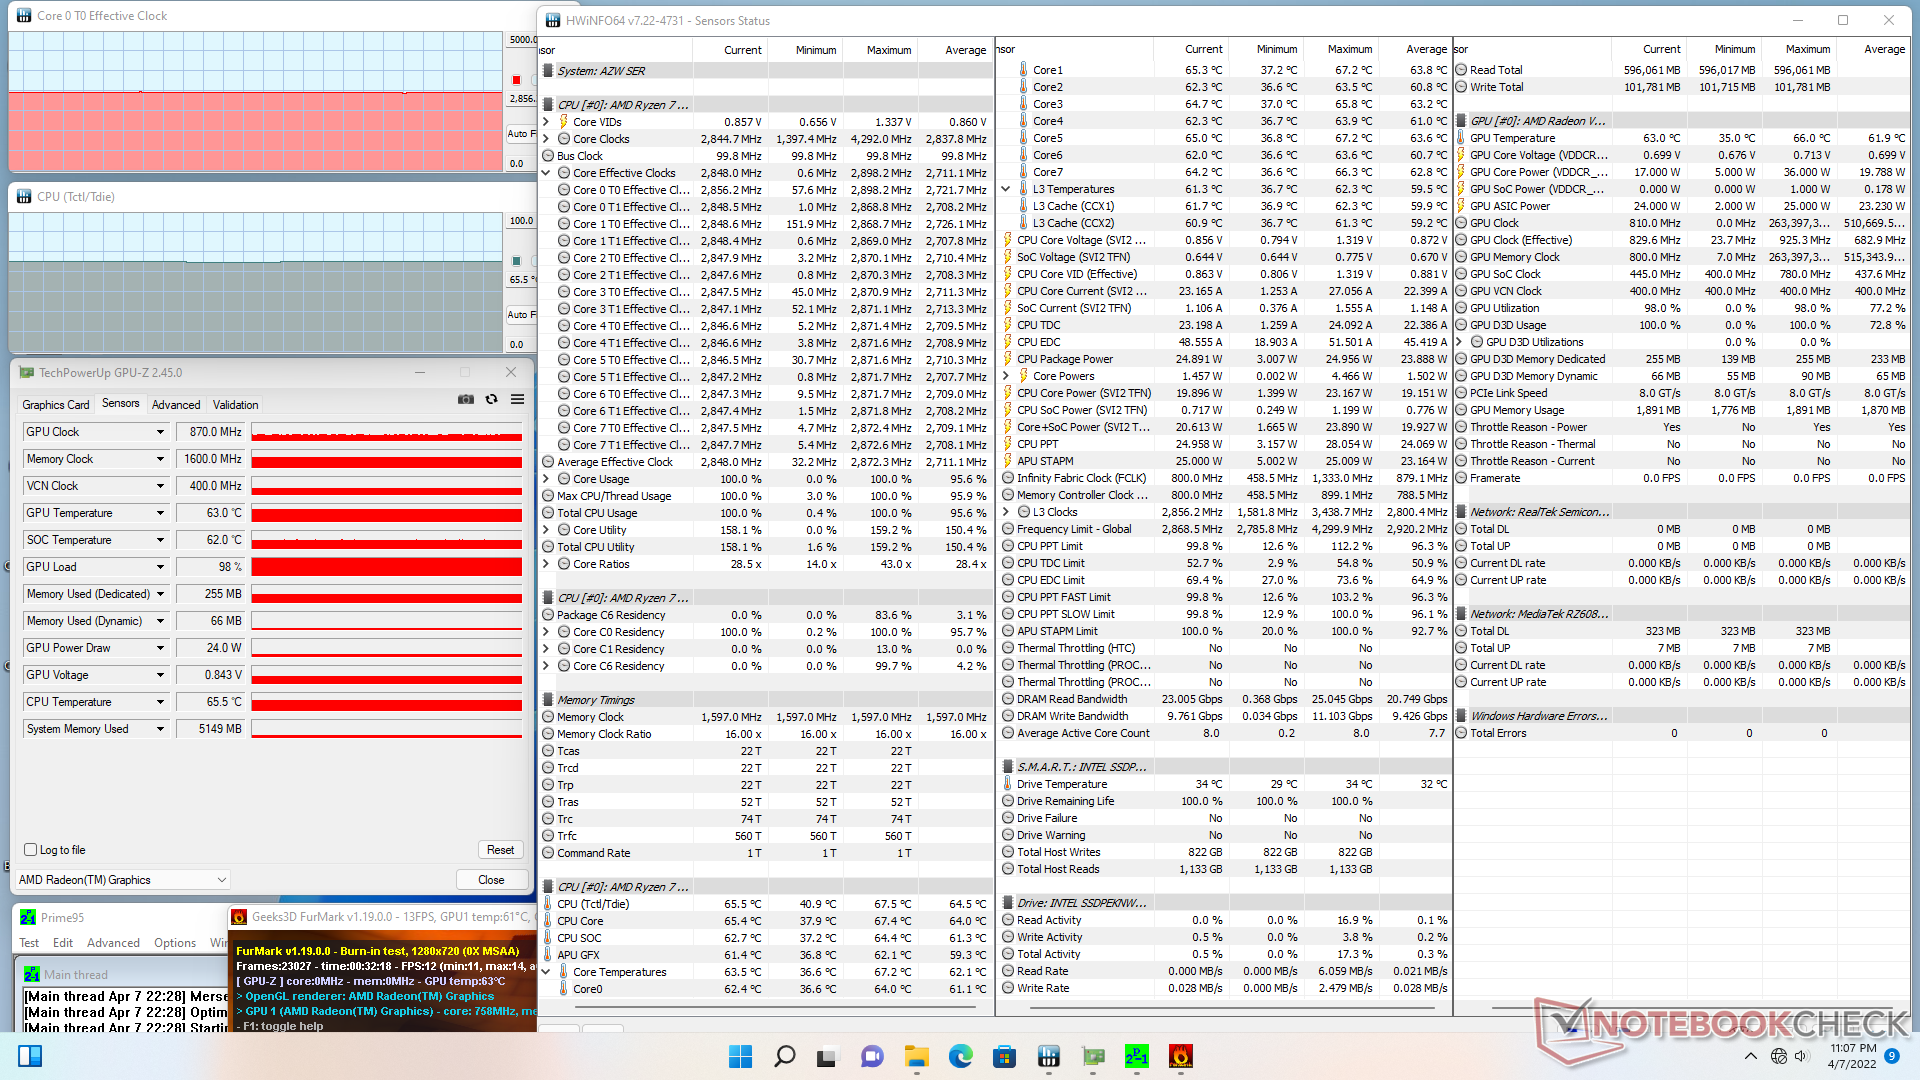
| CPU Clock (GHz) | GPU Clock (MHz) | Average CPU Temperature SoC (°C) | |
| System Idle | -- | -- | 37 |
| Prime95 Stress | 2.8 | -- | 64 |
| Prime95 + FurMark Stress | 2.9 | 870 | 62 |
| Witcher 3 Stress | 0.6 | 1525 | 58 |
Energy Management
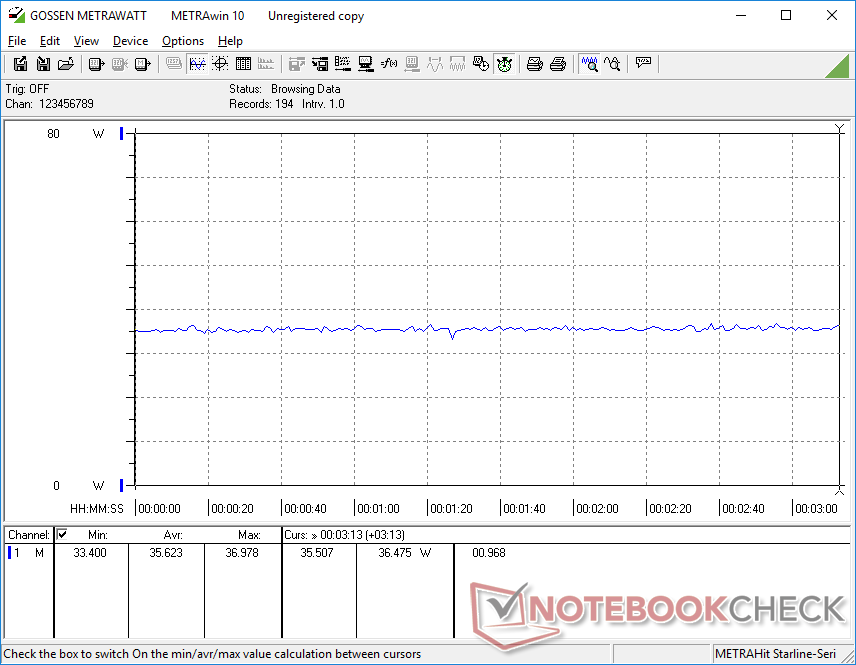
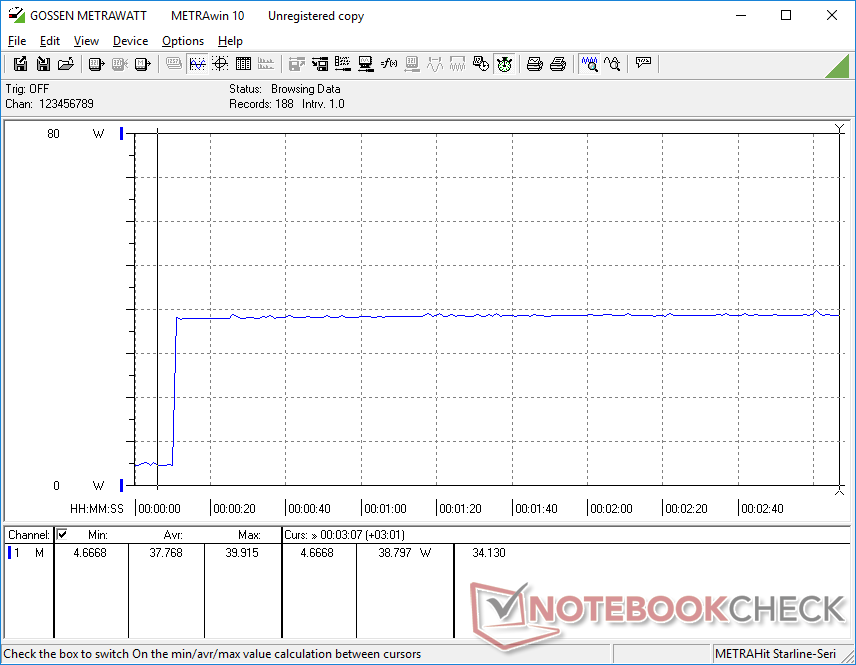
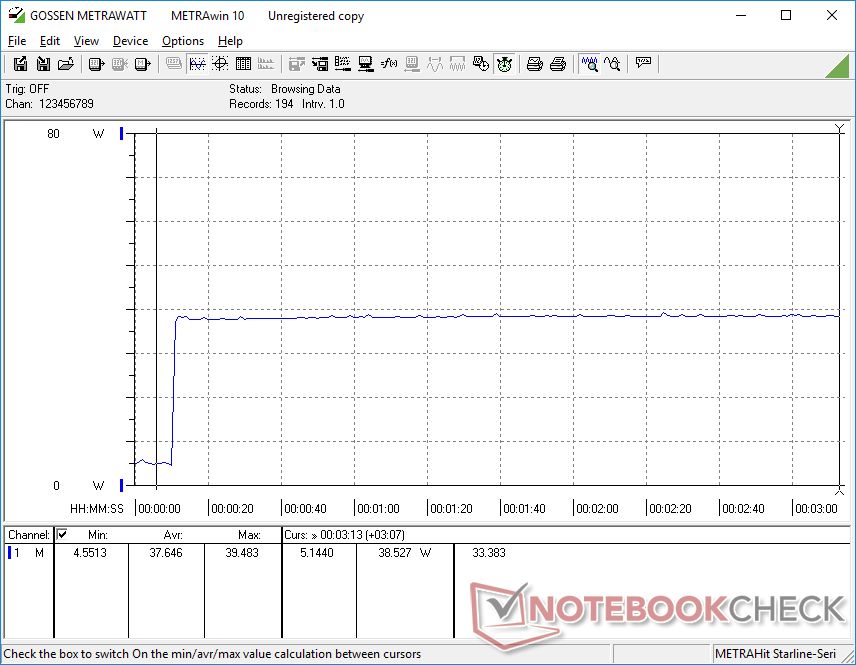
Power Consumption
The SER4 demands about as much power as the Intel NUC11PAQi7 despite all their performance differences. In other words, the Beelink system offers higher CPU performance-per-watt but lower GPU performance-per-watt when compared to the Core i7-1165G7 NUC.
We're able to record a maximum draw of 49 W from the small ())(() 57 W wall wart AC adapter when running Prime95 and FurMark simultaneously. This can be bumped even higher if connecting additional USB devices like monitors or smartphones.

| Off / Standby | |
| Idle | |
| Load |
|
Key:
min: | |
| Beelink SER4 R7 4800U, Vega 8, Intel SSD 660p SSDPEKNW512G8, , x, | GMK NucBox 3 Celeron J4125, UHD Graphics 600, Netac S535N8/256GYN, , x, | Beelink GTR5 R9 5900HX, Vega 8, Kingston NV1 SNVS/500GCN, , x, | Intel NUC11PAQi7 i7-1165G7, Iris Xe G7 96EUs, Samsung SSD 980 Pro 500GB MZ-V8P500BW, , x, | Beelink SER3 R7 3750H, Vega 10, GSemi AZW GSDFN512TS3F1OGCX, , x, | Intel NUC10i5FNK i5-10210U, UHD Graphics 620, Kingston RBUSNS8154P3256GJ1, , 0x0, 0" | |
|---|---|---|---|---|---|---|
| Power Consumption | 36% | -89% | -34% | -50% | -165% | |
| Idle Minimum * (Watt) | 4.1 | 3 27% | 6.2 -51% | 5.6 -37% | 7 -71% | |
| Idle Average * (Watt) | 4.1 | 3.1 24% | 8.9 -117% | 5.6 -37% | 9.1 -122% | 15.7 -283% |
| Idle Maximum * (Watt) | 4.6 | 3.6 22% | 9 -96% | 6 -30% | 9.7 -111% | |
| Load Average * (Watt) | 35.6 | 11.1 69% | 66.8 -88% | 31.4 12% | 29.5 17% | |
| Witcher 3 ultra * (Watt) | 35.6 | 62.6 -76% | 39 -10% | 32.5 9% | ||
| Load Maximum * (Watt) | 39.9 | 25.4 36% | 81.6 -105% | 80.5 -102% | 48.7 -22% | 58.6 -47% |
* ... smaller is better
Power Consumption Witcher 3 / Stresstest
{
Pros
Cons
Verdict — High Performance-Per-Dollar
For $600 USD on Amazon, users are getting the Ryzen 7 4800U CPU with 16 GB RAM, a Windows 11 Pro license, and a 512 GB SSD. In contrast, a barebones Intel NUC 11 with the Core i7-1165G7 is retailing for just over $700 USD with no OS, RAM, or storage. The SER4 offers faster multi-thread CPU performance at a significantly lower price than the Intel option which is its most notable trait.
The SER4 has made the SER3 obsolete. Its Ryzen 7 4800U processor is no slouch with speeds rivaling any Core U-powered Intel NUC 11 option.
The most noticeable disadvantage of the SER4 is its louder fan noise than the Intel NUC. We experienced this on many other Beelink mini PCs as well and the SER4 continues this trend. Smaller disadvantages include the slightly slower graphics performance compared to the Iris Xe 96 EUs, one-year base warranty instead of three, PCIe3 SSD support instead of PCIe4, no Thunderbolt support, and a less developed BIOS UI than an Intel NUC. If these drawbacks aren't major concerns, then the SER4 is a strong recommendation as an Intel NUC alternative.
Price and Availability
Price comparison
