Beelink SEi11 mini PC Review: Cheaper than an Intel NUC 11 but just as fast

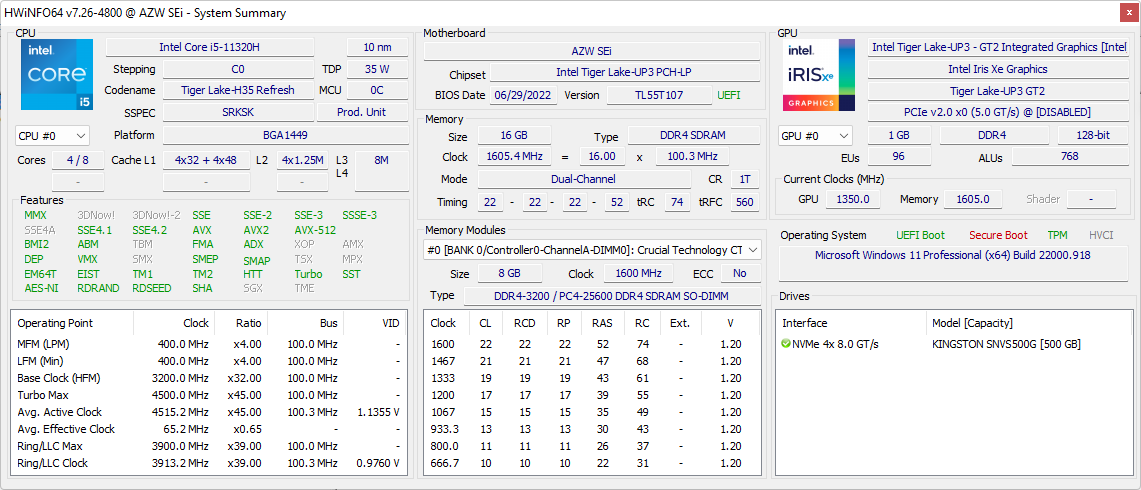
Unlike the Beelink GTI 11, the SEi11 is powered by an Intel Core H-series CPU instead of the Core U series. There is only one configuration available at the moment with the 11th gen Tiger Lake-H Core i5-11320H, 16 GB of RAM, and 500 GB NVMe SSD for approximately $450 USD.
The SEi11 competes directly with the Intel NUC series such as the NUC11PAQ or NUC11TNK.
More Beelink reviews:
Potential Competitors in Comparison
Rating | Date | Model | Weight | Height | Size | Resolution | Price |
|---|---|---|---|---|---|---|---|
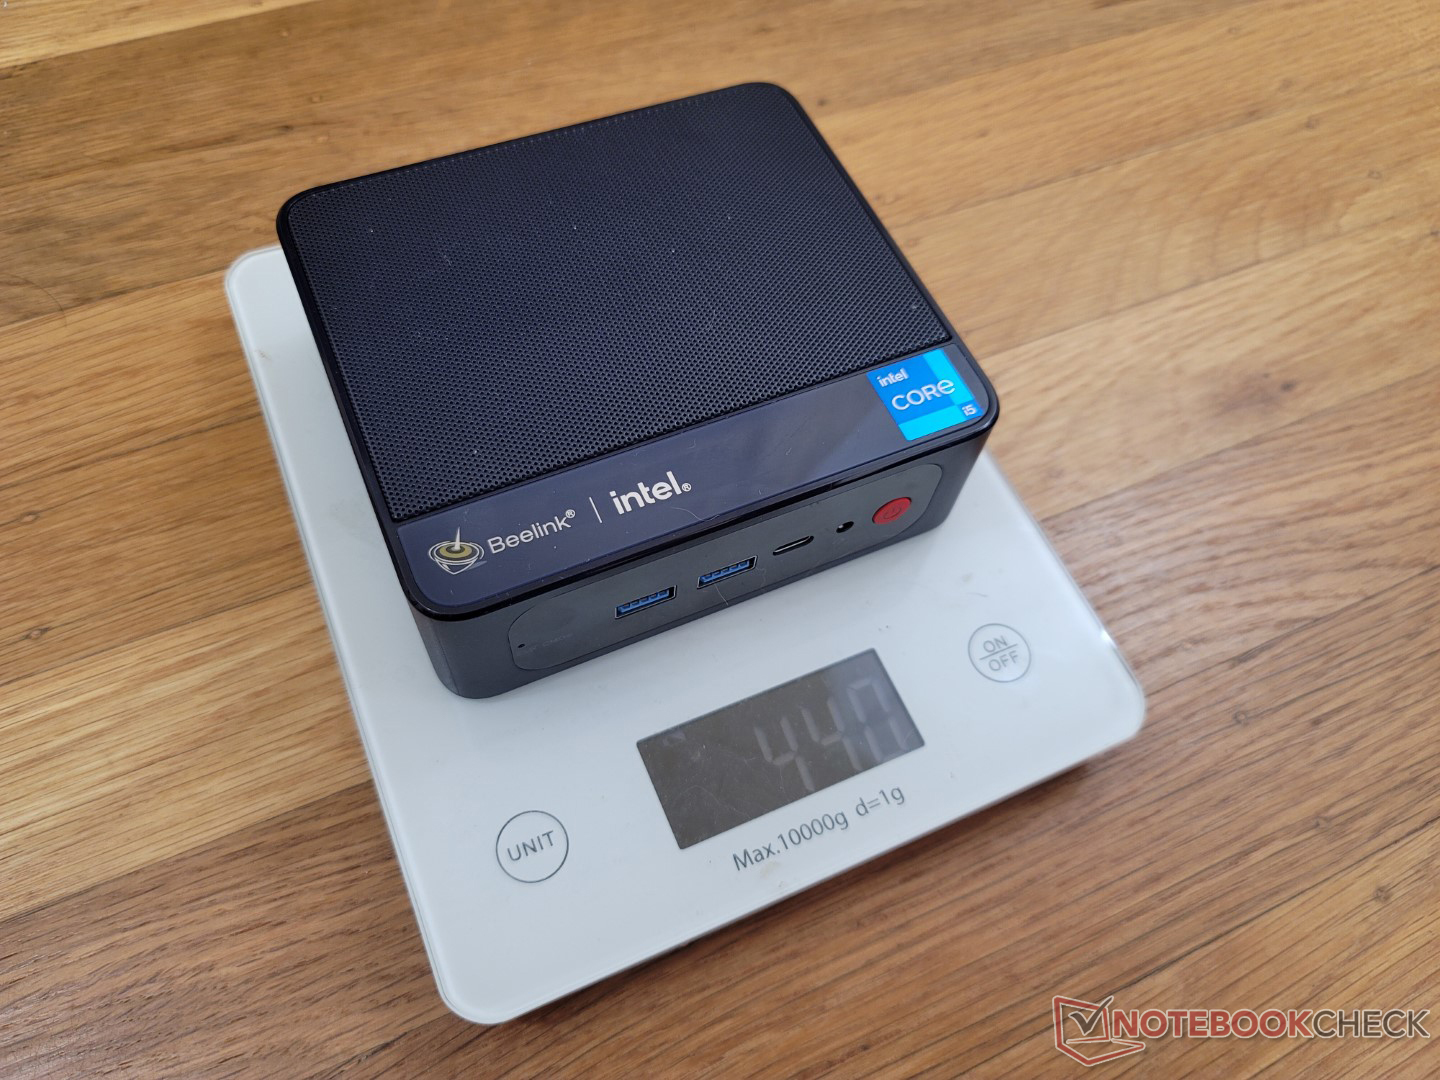
v (old) | 09 / 2022 | Beelink SEi11 Pro i5-11320H, Iris Xe G7 96EUs | 440 g | 40 mm | x | ||
v (old) | 01 / 2022 | Beelink GTR5 R9 5900HX, Vega 8 | 686 g | 39 mm | x | ||
v (old) | 12 / 2021 | Beelink GTI 11 i5-1135G7, Iris Xe G7 80EUs | 638 g | 39 mm | x | ||
v (old) | 04 / 2022 | Beelink SER4 R7 4800U, Vega 8 | 494 g | 40 mm | x | ||
v (old) | 04 / 2021 | Intel NUC11TNKi5 i5-1135G7, Iris Xe G7 80EUs | 504 g | 37 mm | x |
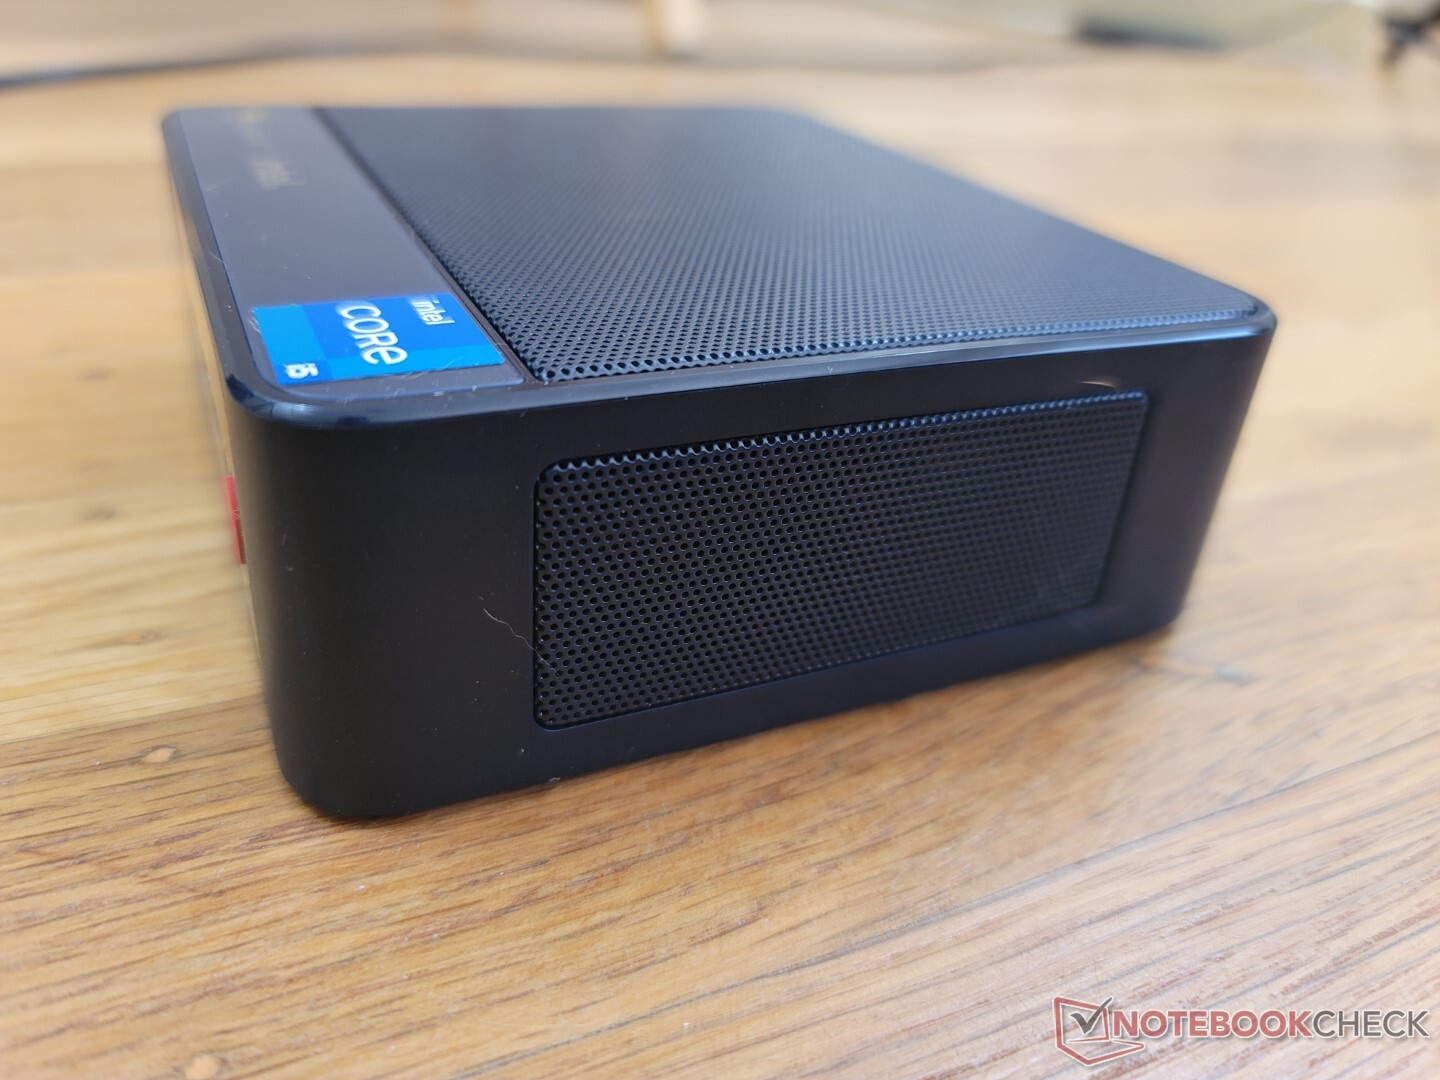
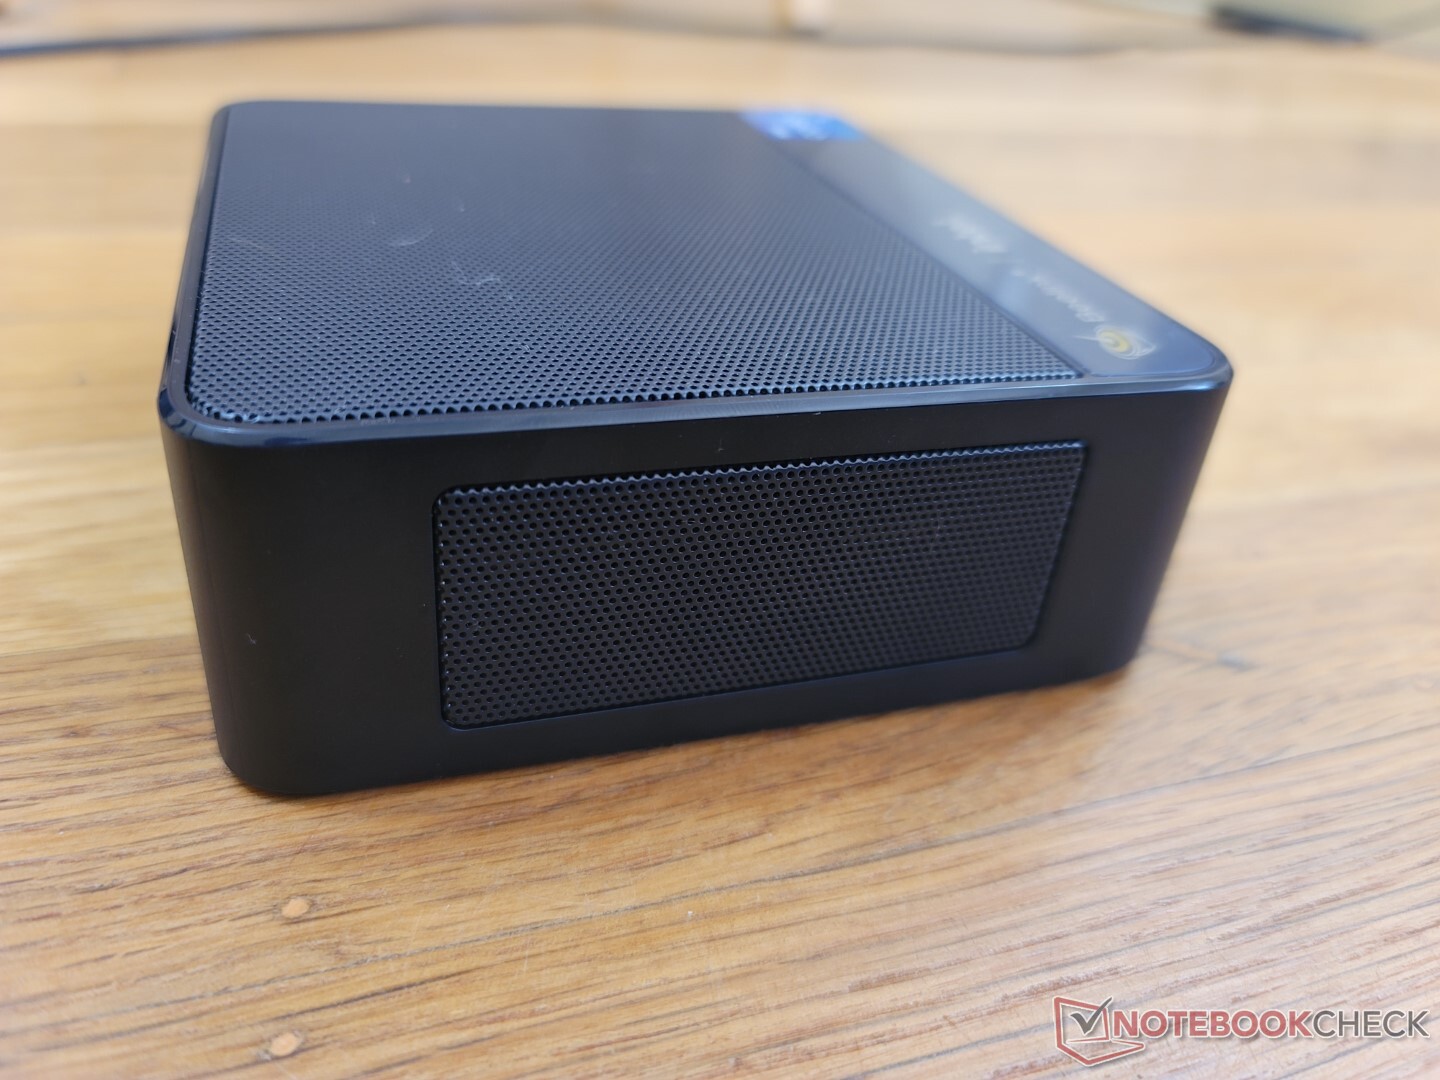
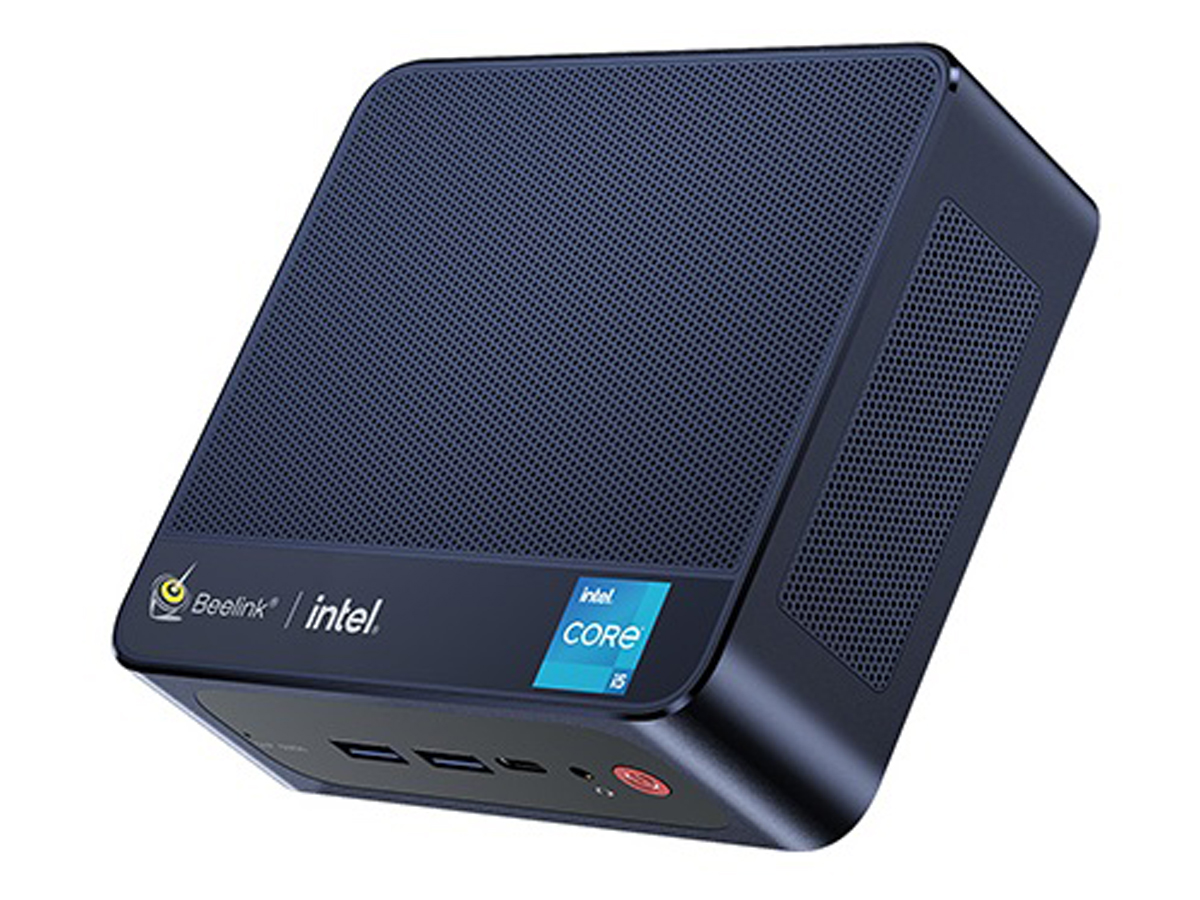
Case
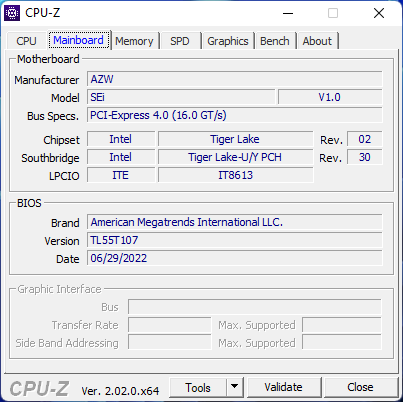
The chassis is essentially the Intel version of the AMD-powered Beelink SER4. Dimensions and build are almost exactly alike, but the SEi11 is approximately 50 grams lighter likely due to some minor internal changes. Visually, the unit lacks the red-colored mesh on the sides and the chrome-cut edges and corners present on the SER4.
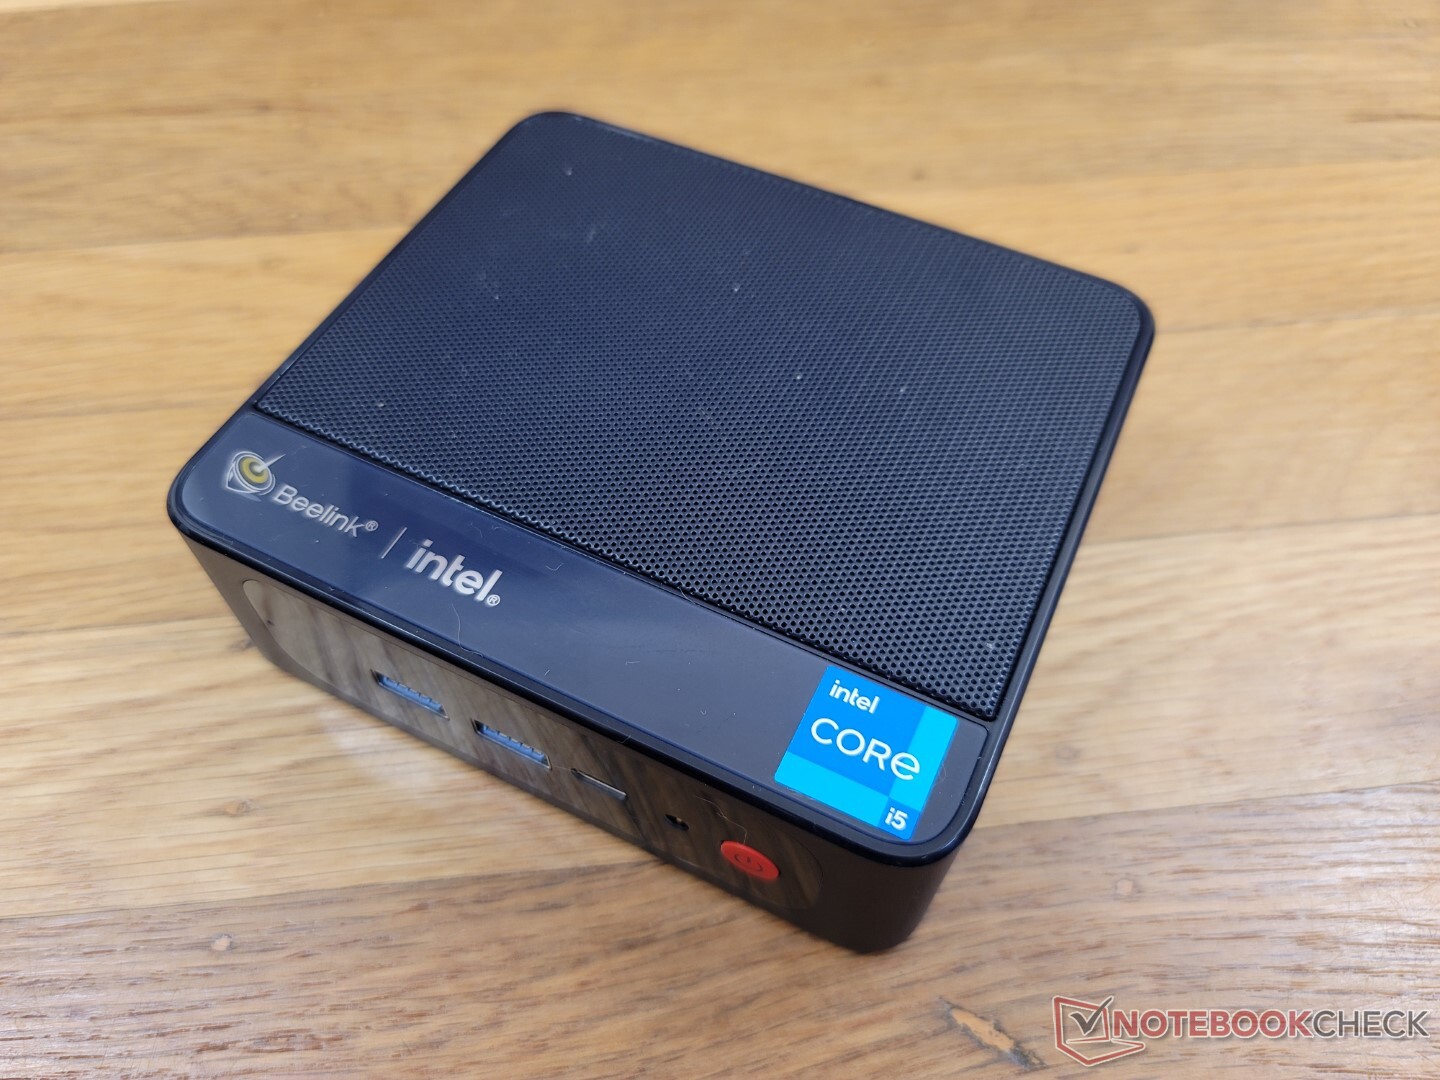
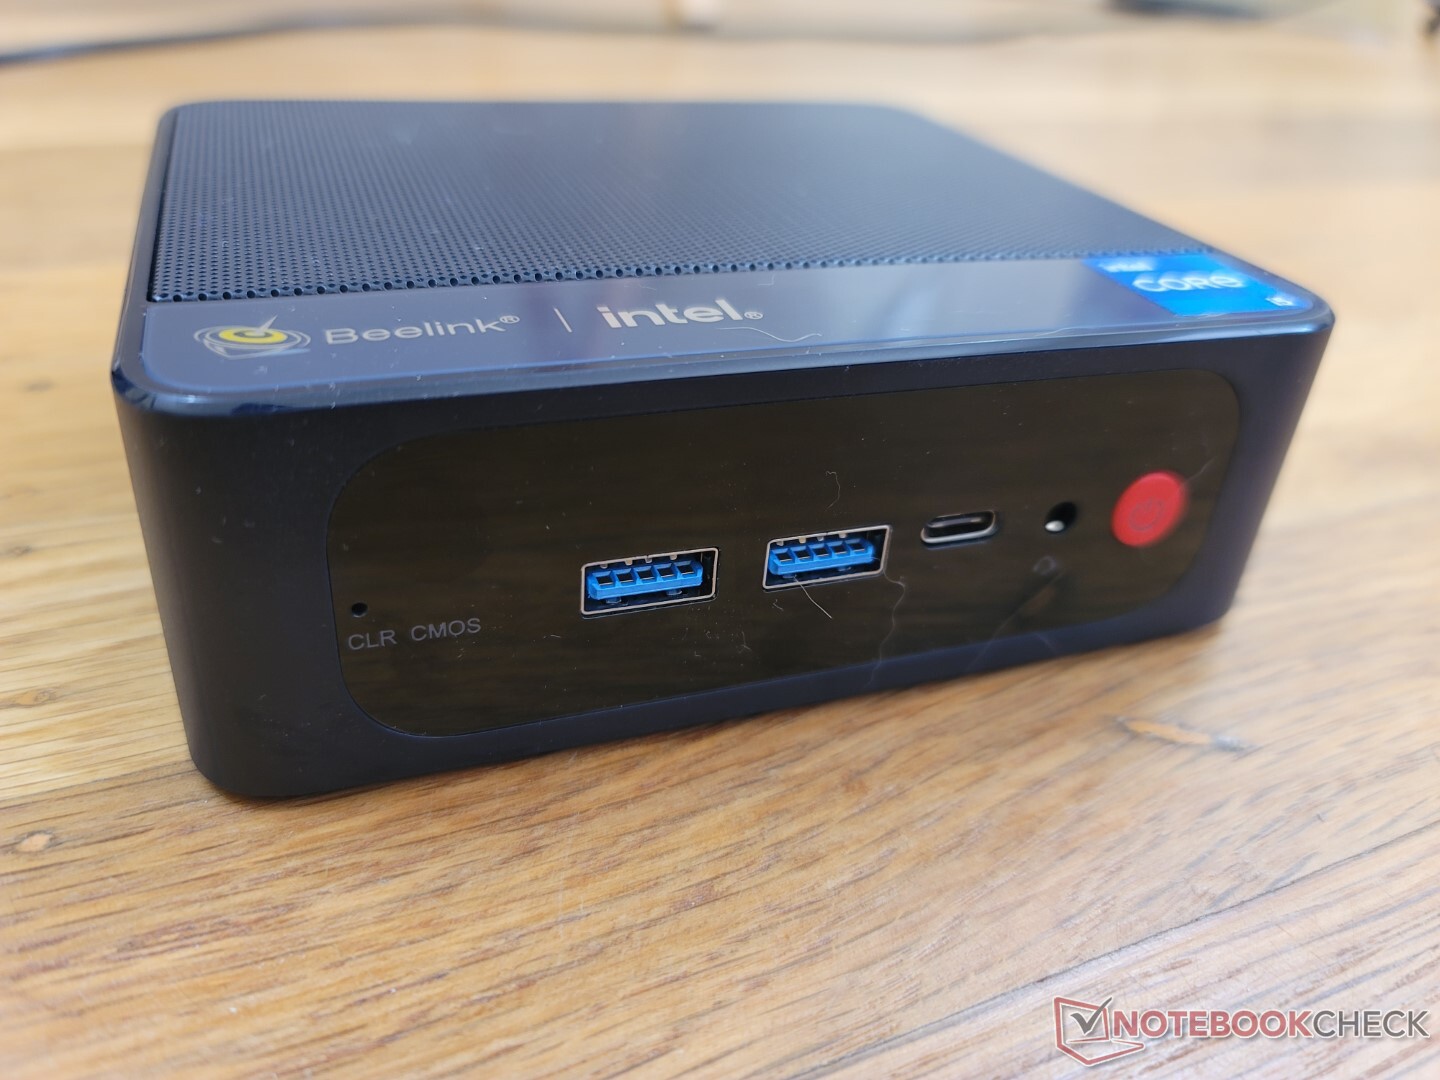
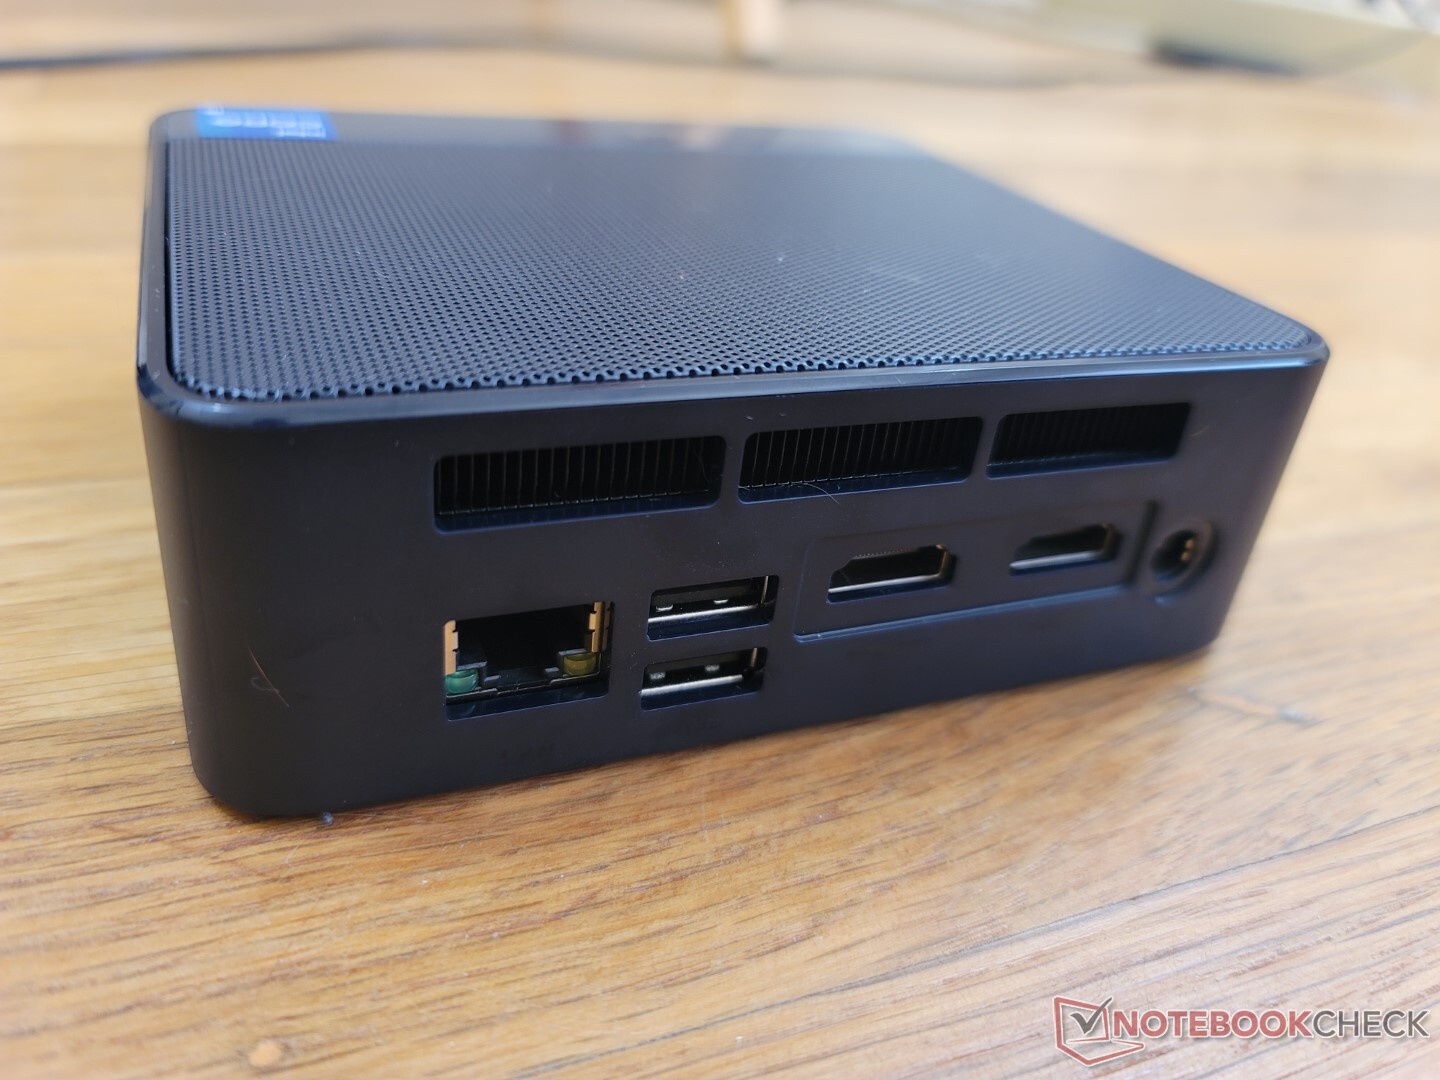
Connectivity
Port options and positioning are identical to the SER4. Keep in mind that the USB-C port does not support DisplayPort or Power Delivery and so it is useful only for data or charging of external devices. We attempted to connect USB-C external monitors and USB-C power adapters, but none would work with the SEi11.
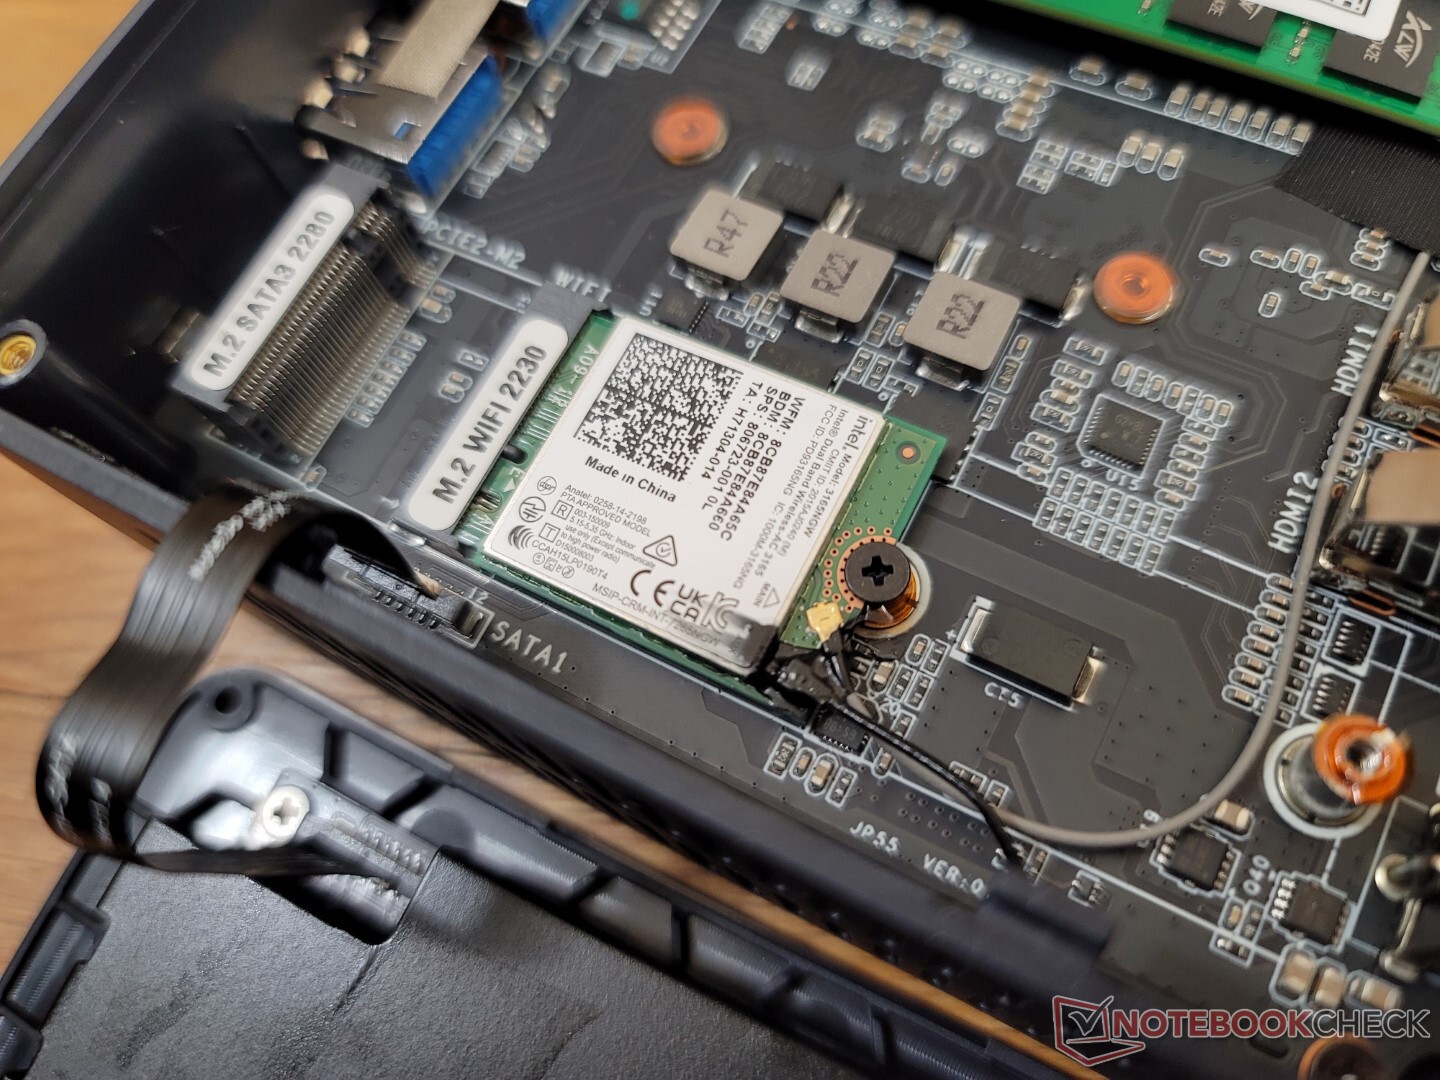
Communication
The unit ships with the relatively new MediaTek RZ608 for Wi-Fi 6E and Bluetooth 5.2 connectivity. Unfortunately, the module is not as reliable or as fast as the usual Intel AX solutions. When paired to our 6 GHz network, transfer rates top out at only ~750 Mbps compared to almost twice that of an Intel AX201 or AX210. Furthermore, the system would have issues detecting our 6 GHz network in the first place.
| Networking | |
| iperf3 transmit AX12 | |
| Intel NUC11TNKi5 | |
| Beelink GTI 11 | |
| Beelink SER4 | |
| Beelink GTR5 | |
| iperf3 receive AX12 | |
| Intel NUC11TNKi5 | |
| Beelink GTI 11 | |
| Beelink SER4 | |
| Beelink GTR5 | |
| iperf3 receive AXE11000 6GHz | |
| Beelink SEi11 Pro | |
| iperf3 transmit AXE11000 6GHz | |
| Beelink SEi11 Pro | |
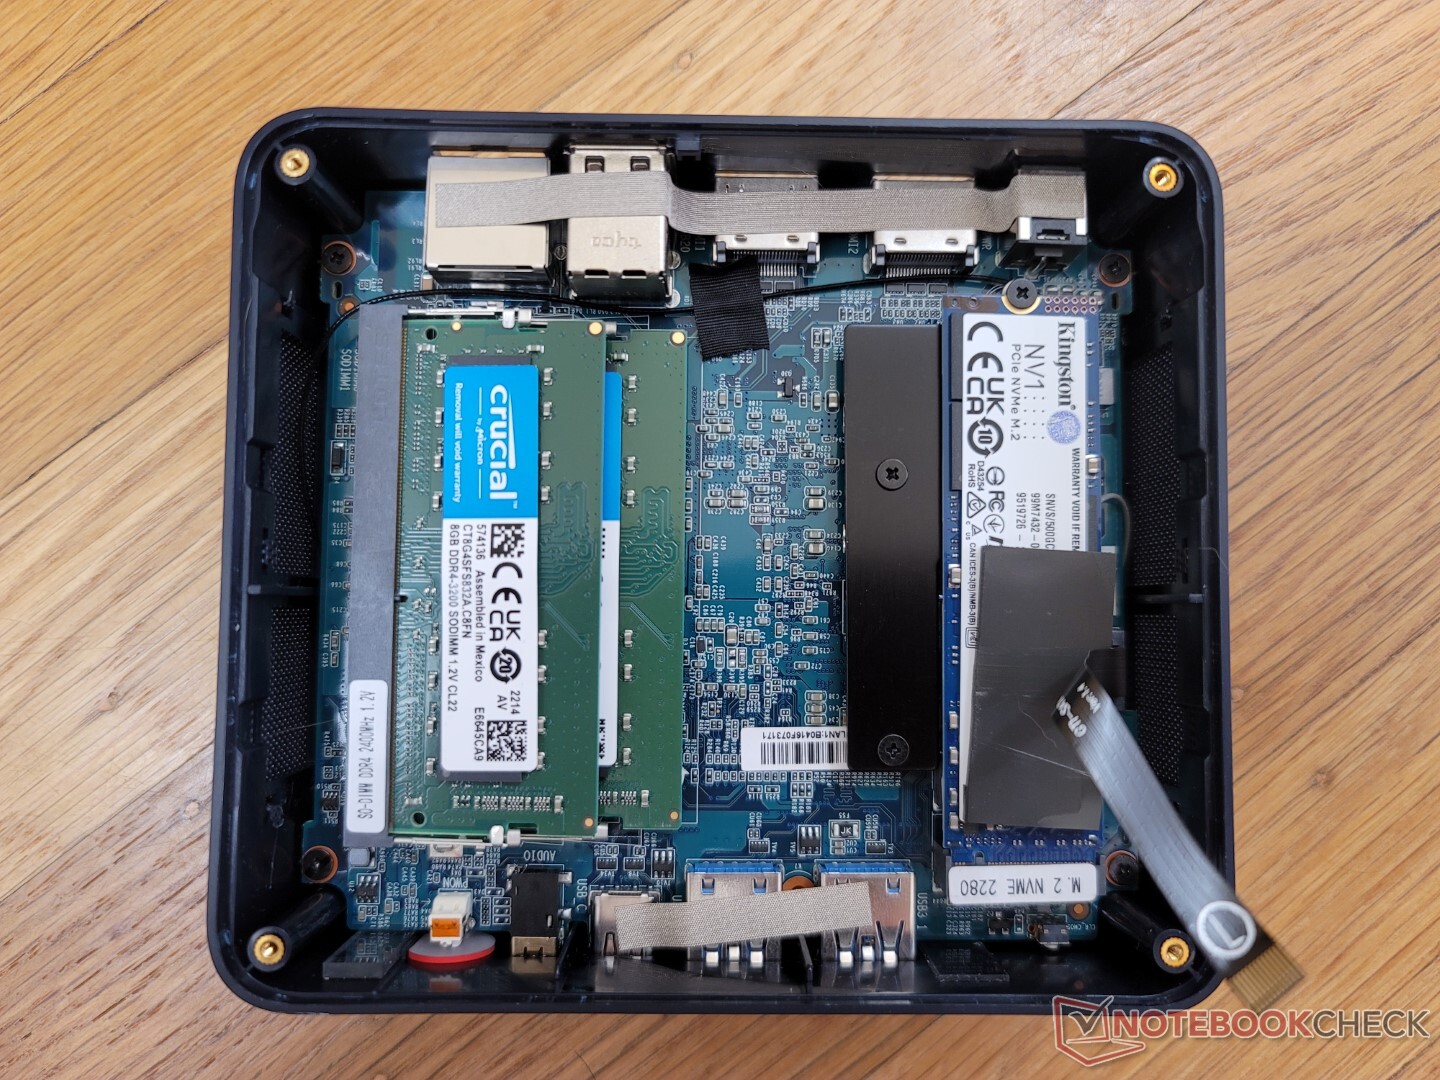
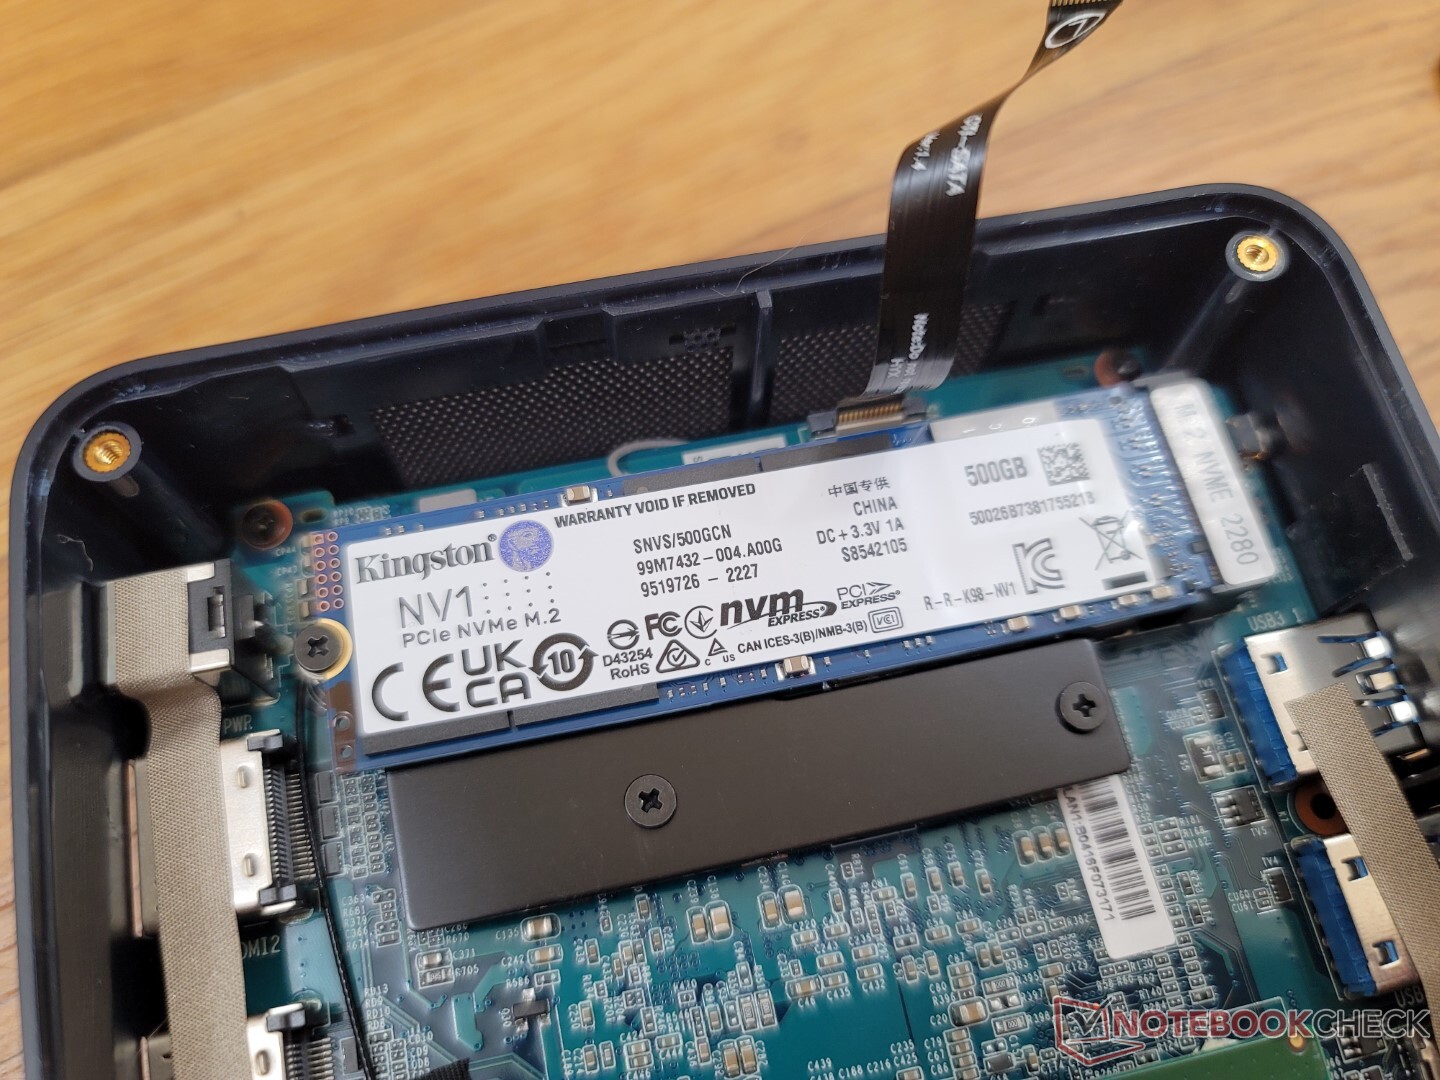
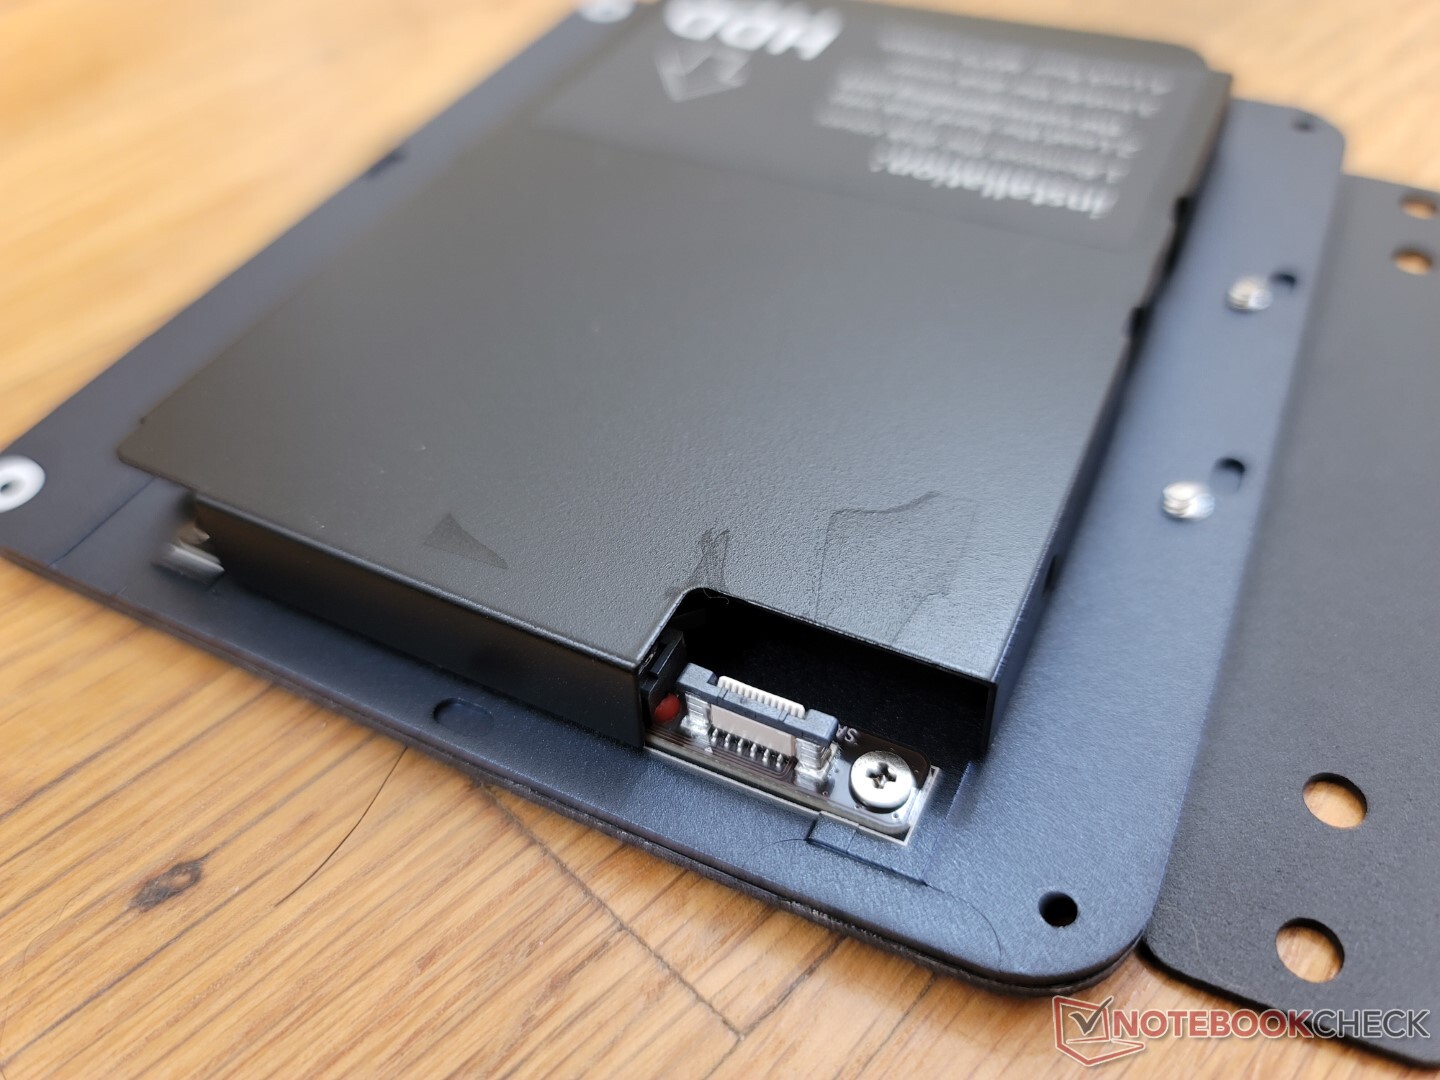
Maintenance
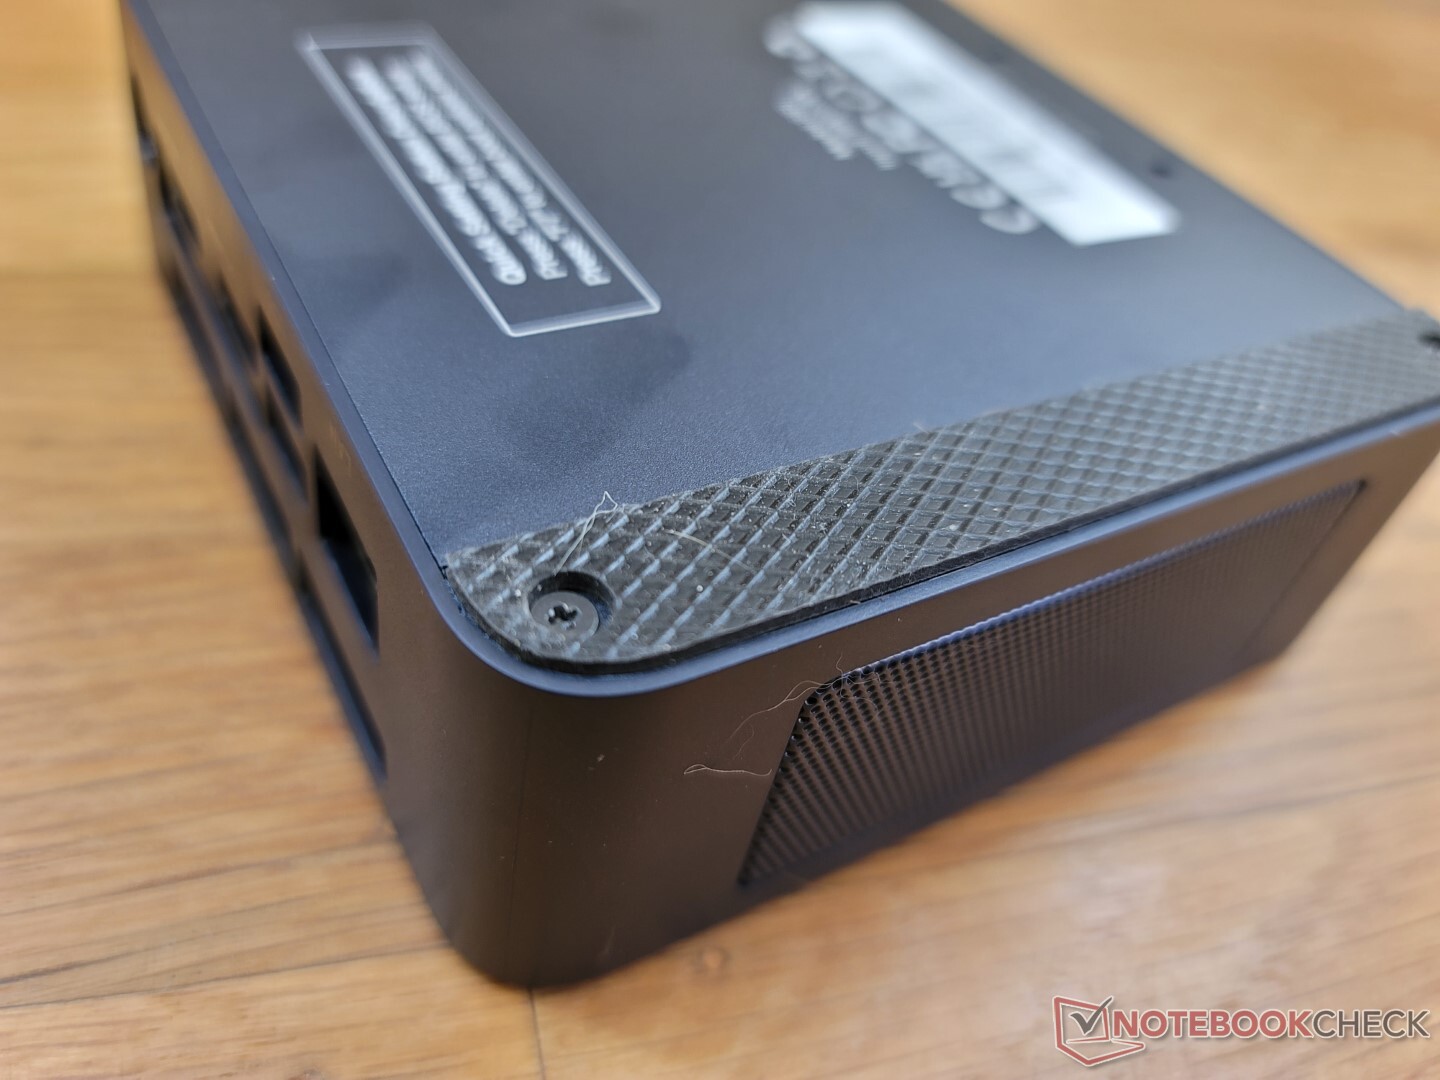
The bottom panel is secured by 4 Philips screws. To actually remove it, however, we recommend attaching the VESA mounting bracket so it can be used as a handle to pull out the flat plate.
Users have direct access to the M.2 2280 SSD slot, 2.5-inch SATA III bay, WLAN module, and 2x DDR4 SODIMM slots.
Accessories and Warranty
The retail box includes 2x HDMI cables, AC adapter, paperwork, VESA mounting bracket, and extra screws. A one-year limited manufacturer warranty applies if purchased in the US. In comparison, Intel NUC models typically come with a three-year warranty as standard.
Performance
Testing Conditions
We set our unit to Performance mode via Windows prior to running any benchmarks below. There is no pre-installed control center-style application for adjusting processor performance.
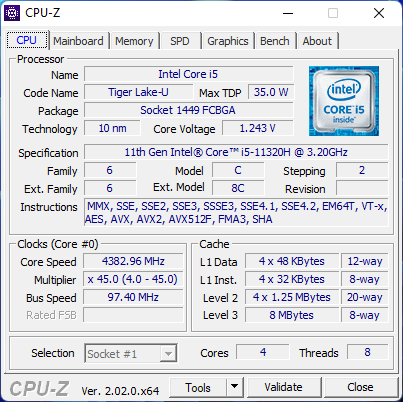
Processor
The Core i5-11320H is an uncommon CPU as most other PCs powered by Tiger Lake-H CPUs typically utilize the Core i5-11300H instead. The i5-11320H performs essentially the same for all intents and purposes. It has slight clock rate differences on paper that have no impact in most applications based on our observations with the Beelink.
Cinebench R15 Multi Loop
Cinebench R23: Multi Core | Single Core
Cinebench R15: CPU Multi 64Bit | CPU Single 64Bit
Blender: v2.79 BMW27 CPU
7-Zip 18.03: 7z b 4 | 7z b 4 -mmt1
Geekbench 5.5: Multi-Core | Single-Core
HWBOT x265 Benchmark v2.2: 4k Preset
LibreOffice : 20 Documents To PDF
R Benchmark 2.5: Overall mean
* ... smaller is better
AIDA64: FP32 Ray-Trace | FPU Julia | CPU SHA3 | CPU Queen | FPU SinJulia | FPU Mandel | CPU AES | CPU ZLib | FP64 Ray-Trace | CPU PhotoWorxx
| Performance rating | |
| Beelink GTR5 | |
| Beelink SER4 | |
| Beelink GTI 11 | |
| Average Intel Core i5-11320H | |
| Beelink SEi11 Pro | |
| Intel NUC11TNKi5 | |
| AIDA64 / FP32 Ray-Trace | |
| Beelink GTR5 | |
| Beelink SER4 | |
| Beelink GTI 11 | |
| Beelink SEi11 Pro | |
| Average Intel Core i5-11320H (6369 - 7489, n=4) | |
| Intel NUC11TNKi5 | |
| AIDA64 / FPU Julia | |
| Beelink GTR5 | |
| Beelink SER4 | |
| Beelink GTI 11 | |
| Beelink SEi11 Pro | |
| Average Intel Core i5-11320H (27391 - 31637, n=4) | |
| Intel NUC11TNKi5 | |
| AIDA64 / CPU SHA3 | |
| Beelink GTR5 | |
| Beelink GTI 11 | |
| Beelink SEi11 Pro | |
| Average Intel Core i5-11320H (1847 - 2099, n=4) | |
| Intel NUC11TNKi5 | |
| Beelink SER4 | |
| AIDA64 / CPU Queen | |
| Beelink GTR5 | |
| Beelink SER4 | |
| Average Intel Core i5-11320H (43565 - 52477, n=4) | |
| Beelink SEi11 Pro | |
| Beelink GTI 11 | |
| Intel NUC11TNKi5 | |
| AIDA64 / FPU SinJulia | |
| Beelink GTR5 | |
| Beelink SER4 | |
| Beelink SEi11 Pro | |
| Average Intel Core i5-11320H (4381 - 5011, n=4) | |
| Intel NUC11TNKi5 | |
| Beelink GTI 11 | |
| AIDA64 / FPU Mandel | |
| Beelink GTR5 | |
| Beelink SER4 | |
| Beelink GTI 11 | |
| Beelink SEi11 Pro | |
| Average Intel Core i5-11320H (16659 - 18770, n=4) | |
| Intel NUC11TNKi5 | |
| AIDA64 / CPU AES | |
| Beelink GTR5 | |
| Beelink SEi11 Pro | |
| Average Intel Core i5-11320H (59851 - 76500, n=4) | |
| Beelink GTI 11 | |
| Intel NUC11TNKi5 | |
| Beelink SER4 | |
| AIDA64 / CPU ZLib | |
| Beelink GTR5 | |
| Beelink SER4 | |
| Intel NUC11TNKi5 | |
| Beelink GTI 11 | |
| Beelink SEi11 Pro | |
| Average Intel Core i5-11320H (330 - 410, n=4) | |
| AIDA64 / FP64 Ray-Trace | |
| Beelink GTR5 | |
| Beelink SER4 | |
| Beelink GTI 11 | |
| Beelink SEi11 Pro | |
| Average Intel Core i5-11320H (3536 - 4021, n=4) | |
| Intel NUC11TNKi5 | |
| AIDA64 / CPU PhotoWorxx | |
| Beelink GTI 11 | |
| Average Intel Core i5-11320H (25964 - 36644, n=4) | |
| Beelink SEi11 Pro | |
| Beelink SER4 | |
| Beelink GTR5 | |
| Intel NUC11TNKi5 | |
System Performance
CrossMark: Overall | Productivity | Creativity | Responsiveness
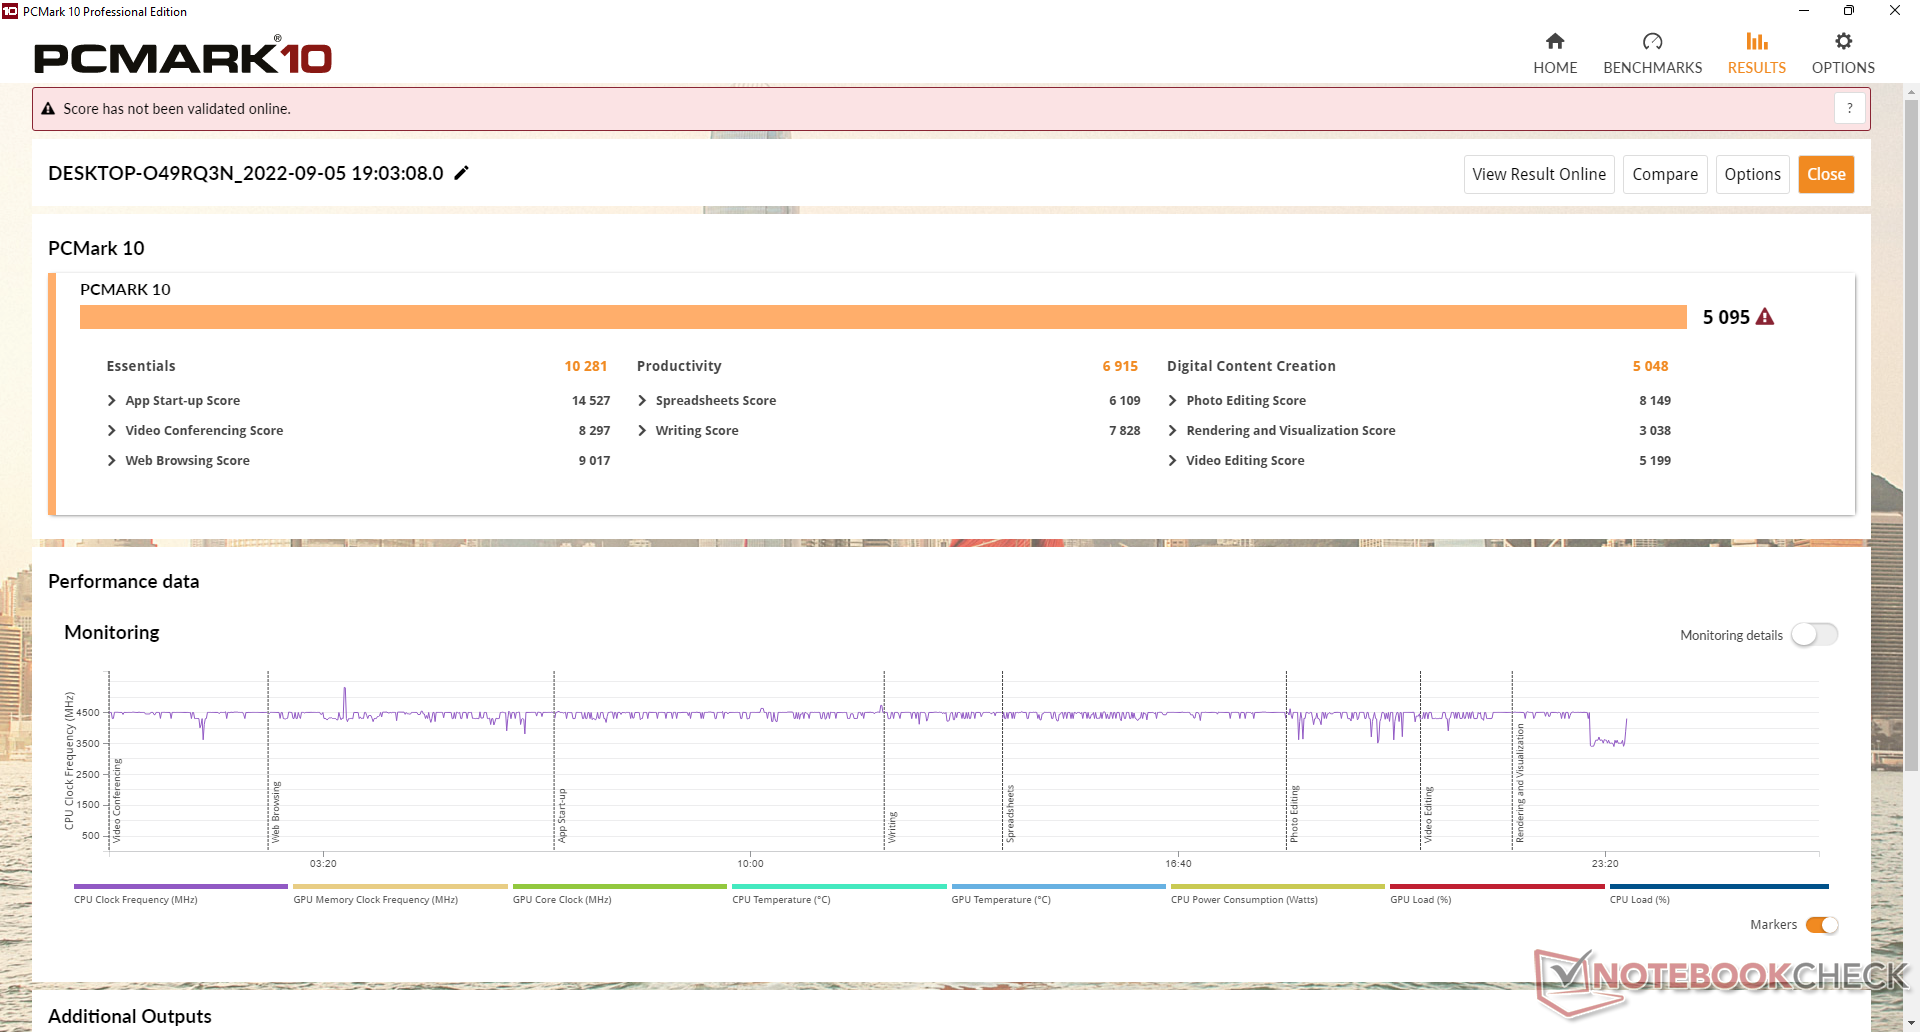
| PCMark 10 / Score | |
| Beelink GTR5 | |
| Beelink SER4 | |
| Average Intel Core i5-11320H, Intel Iris Xe Graphics G7 96EUs (5095 - 5302, n=3) | |
| Beelink SEi11 Pro | |
| Beelink GTI 11 | |
| Intel NUC11TNKi5 | |
| PCMark 10 / Essentials | |
| Beelink GTR5 | |
| Beelink SEi11 Pro | |
| Average Intel Core i5-11320H, Intel Iris Xe Graphics G7 96EUs (9556 - 10558, n=3) | |
| Beelink GTI 11 | |
| Beelink SER4 | |
| Intel NUC11TNKi5 | |
| PCMark 10 / Productivity | |
| Beelink GTR5 | |
| Beelink SER4 | |
| Beelink SEi11 Pro | |
| Average Intel Core i5-11320H, Intel Iris Xe Graphics G7 96EUs (6832 - 6963, n=3) | |
| Beelink GTI 11 | |
| Intel NUC11TNKi5 | |
| PCMark 10 / Digital Content Creation | |
| Beelink GTR5 | |
| Beelink SER4 | |
| Average Intel Core i5-11320H, Intel Iris Xe Graphics G7 96EUs (5048 - 5615, n=3) | |
| Beelink GTI 11 | |
| Beelink SEi11 Pro | |
| Intel NUC11TNKi5 | |
| CrossMark / Overall | |
| Beelink GTR5 | |
| Beelink SEi11 Pro | |
| Average Intel Core i5-11320H, Intel Iris Xe Graphics G7 96EUs (1300 - 1371, n=3) | |
| CrossMark / Productivity | |
| Beelink GTR5 | |
| Beelink SEi11 Pro | |
| Average Intel Core i5-11320H, Intel Iris Xe Graphics G7 96EUs (1376 - 1456, n=3) | |
| CrossMark / Creativity | |
| Beelink GTR5 | |
| Beelink SEi11 Pro | |
| Average Intel Core i5-11320H, Intel Iris Xe Graphics G7 96EUs (1241 - 1256, n=3) | |
| CrossMark / Responsiveness | |
| Average Intel Core i5-11320H, Intel Iris Xe Graphics G7 96EUs (1260 - 1494, n=3) | |
| Beelink SEi11 Pro | |
| Beelink GTR5 | |
| PCMark 10 Score | 5095 points | |
Help | ||
| AIDA64 / Memory Copy | |
| Average Intel Core i5-11320H (41106 - 55961, n=4) | |
| Beelink GTR5 | |
| Beelink SEi11 Pro | |
| Beelink GTI 11 | |
| Beelink SER4 | |
| Intel NUC11TNKi5 | |
| AIDA64 / Memory Read | |
| Average Intel Core i5-11320H (46516 - 52799, n=4) | |
| Beelink GTR5 | |
| Beelink GTI 11 | |
| Beelink SEi11 Pro | |
| Beelink SER4 | |
| Intel NUC11TNKi5 | |
| AIDA64 / Memory Write | |
| Average Intel Core i5-11320H (46760 - 63323, n=4) | |
| Beelink SEi11 Pro | |
| Beelink GTI 11 | |
| Beelink SER4 | |
| Beelink GTR5 | |
| Intel NUC11TNKi5 | |
| AIDA64 / Memory Latency | |
| Beelink SER4 | |
| Average Intel Core i5-11320H (77.6 - 114.1, n=4) | |
| Intel NUC11TNKi5 | |
| Beelink SEi11 Pro | |
| Beelink GTR5 | |
| Beelink GTI 11 | |
* ... smaller is better
DPC Latency
LatencyMon shows no DPC issues when opening multiple browser tabs on our homepage or when running Prime95 stress. Unfortunately, 4K playback at 60 FPS is imperfect with 31 dropped frames during our minute-long video test.
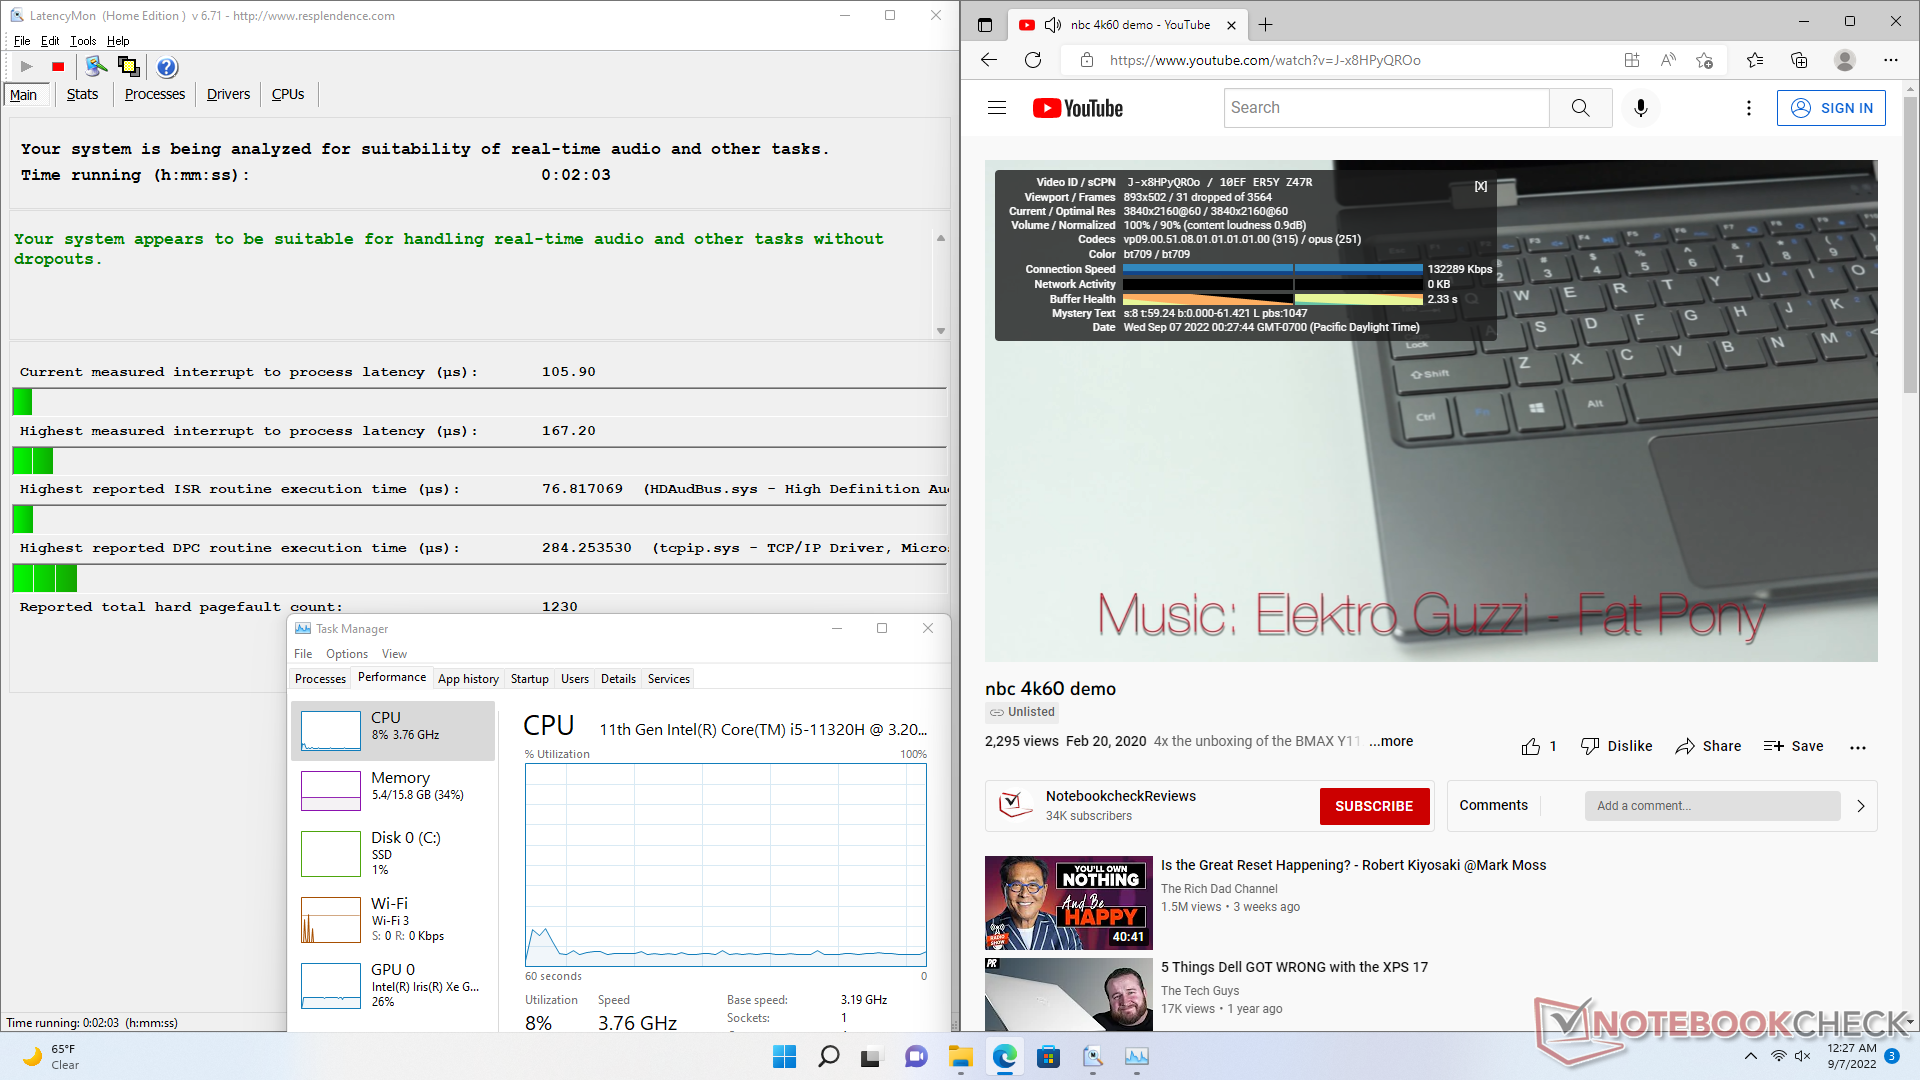
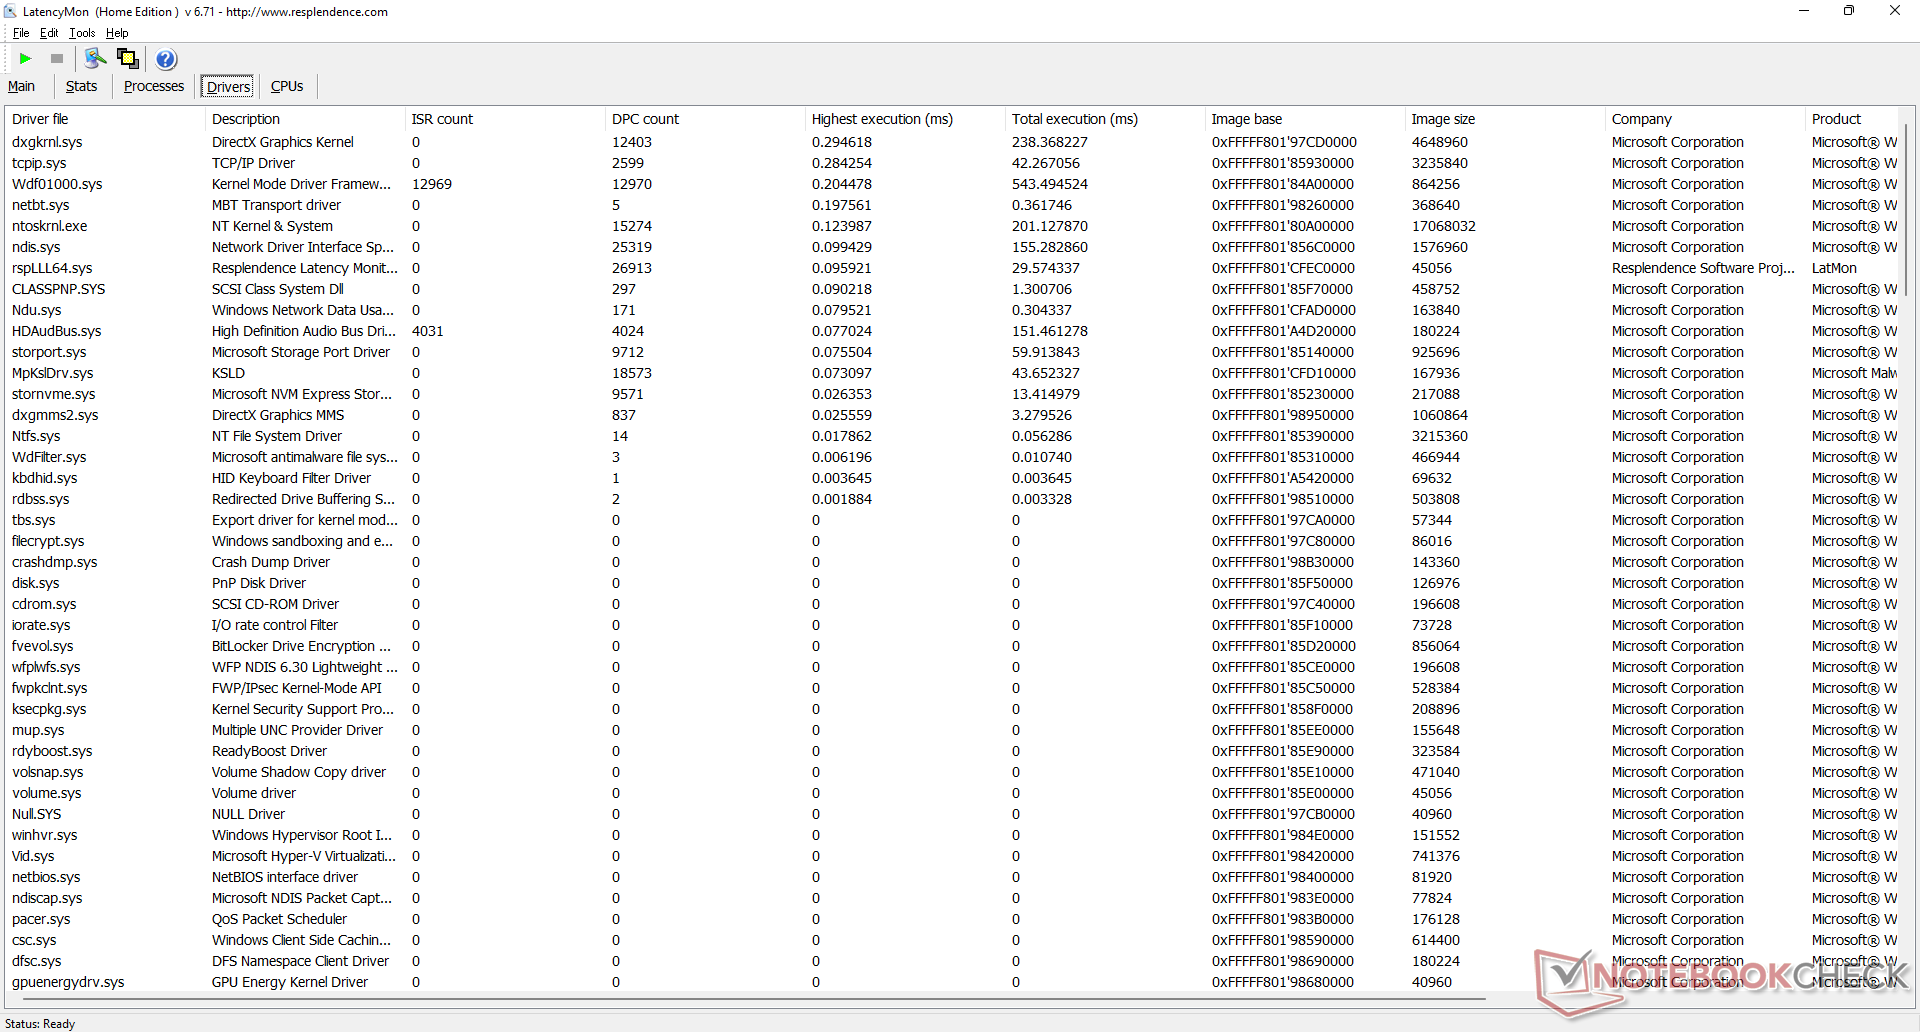
| DPC Latencies / LatencyMon - interrupt to process latency (max), Web, Youtube, Prime95 | |
| Intel NUC11TNKi5 | |
| Beelink SER4 | |
| Beelink GTI 11 | |
| Beelink SEi11 Pro | |
| Beelink GTR5 | |
* ... smaller is better
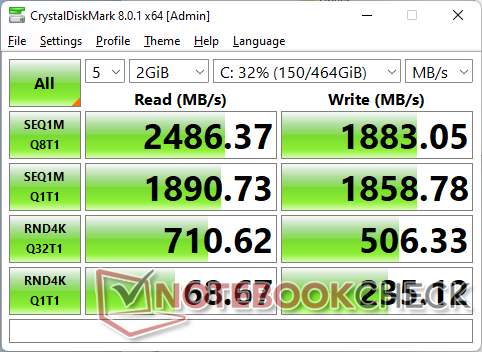
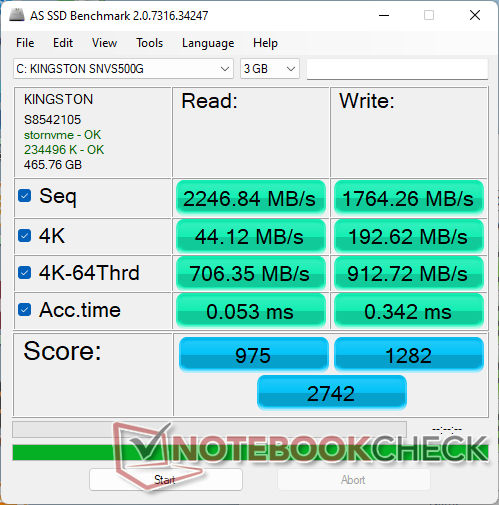
Storage Devices
The SEi11 Pro ships with the same Kingston NV1 SBVS500GCN M.2 SSD as found on the GTR5. This is a midrange PCIe3 x4 drive with sequential read rates of around 2300 MB/s compared to >3000 MB/s on a Samsung PM981a.

| Drive Performance rating - Percent | |
| Beelink GTI 11 | |
| Beelink GTR5 | |
| Beelink SEi11 Pro | |
| Beelink SER4 | |
| Intel NUC11TNKi5 | |
* ... smaller is better
Disk Throttling: DiskSpd Read Loop, Queue Depth 8
GPU Performance
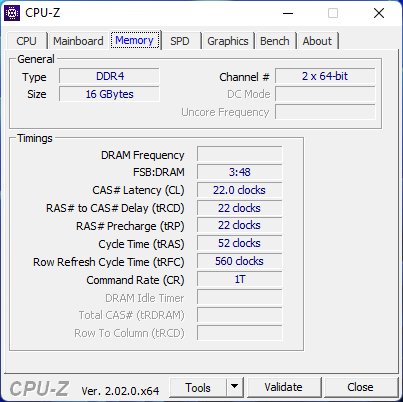
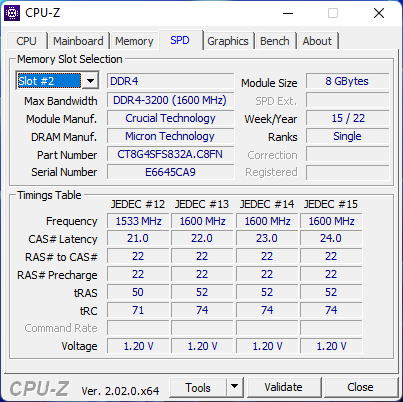
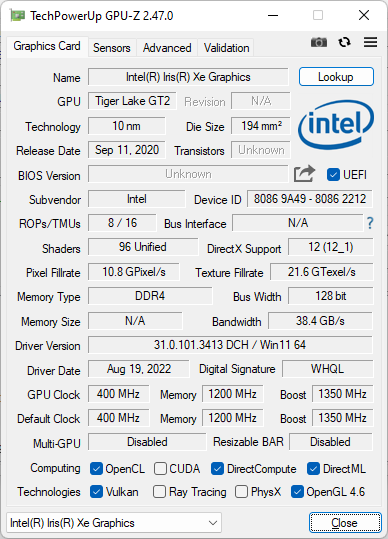
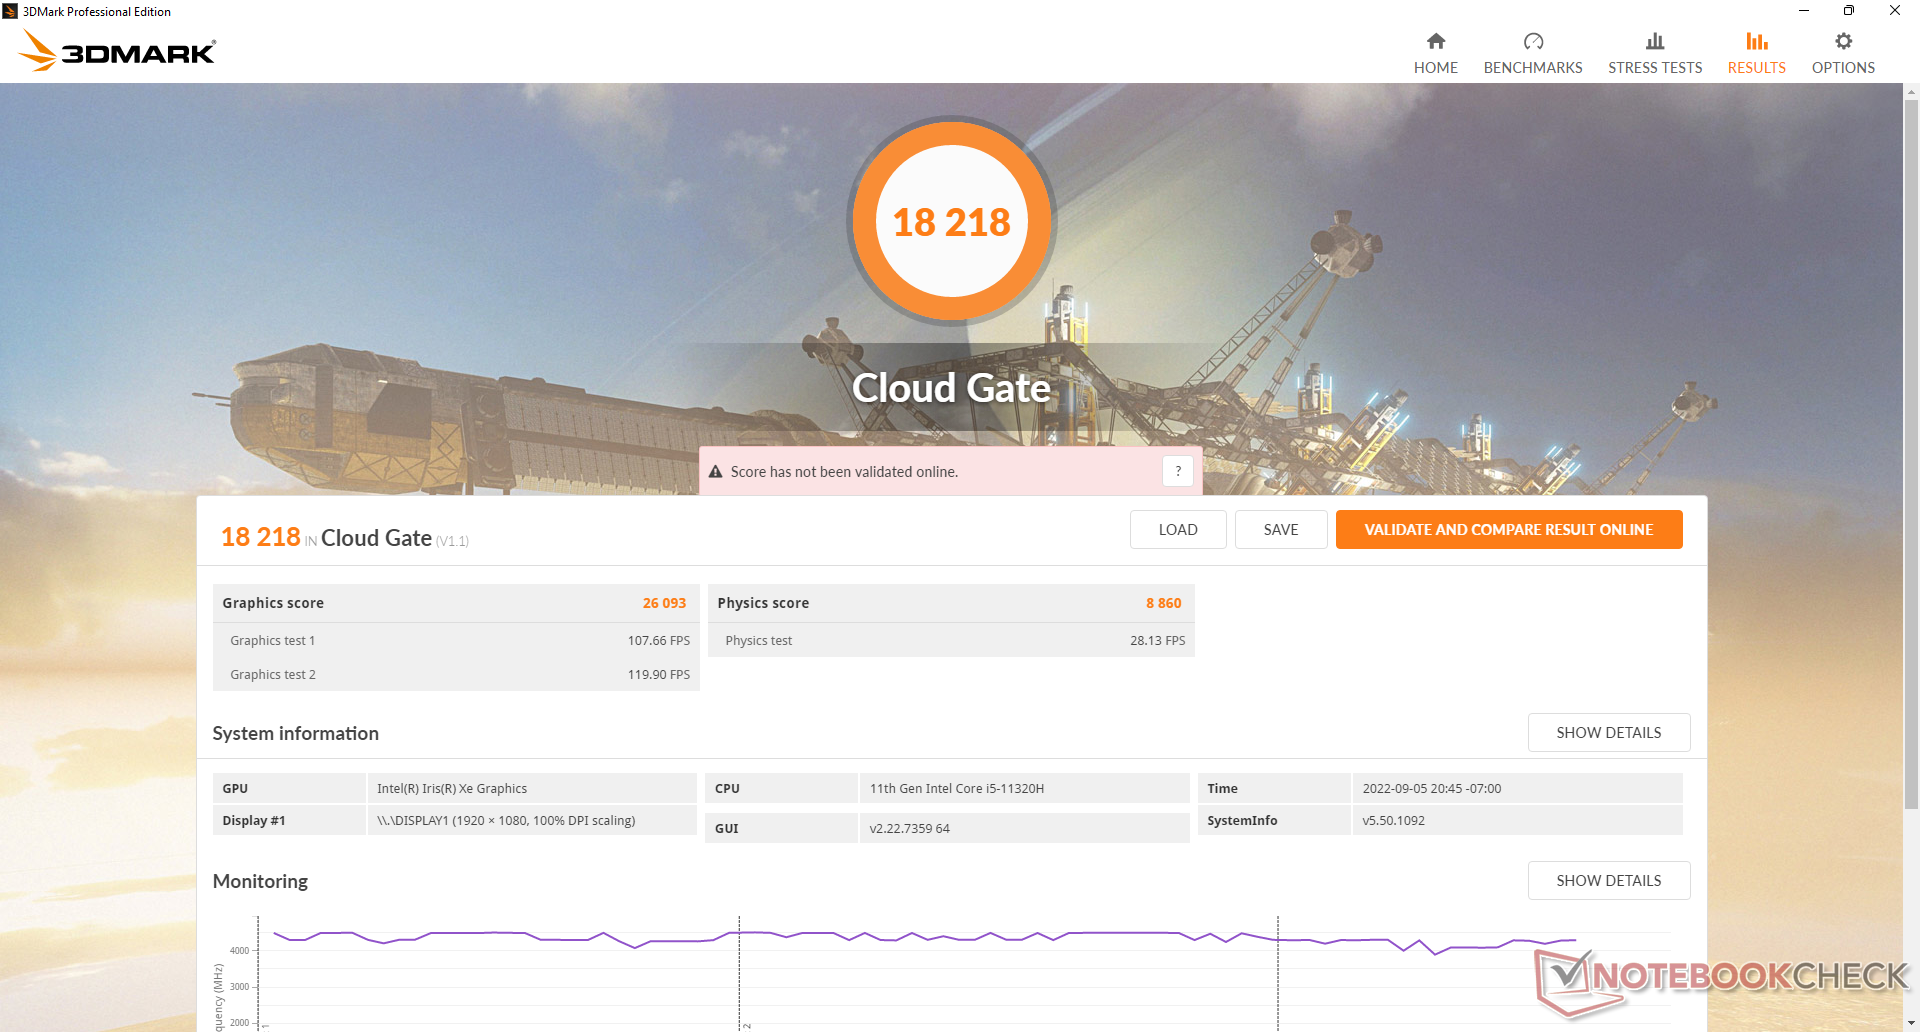
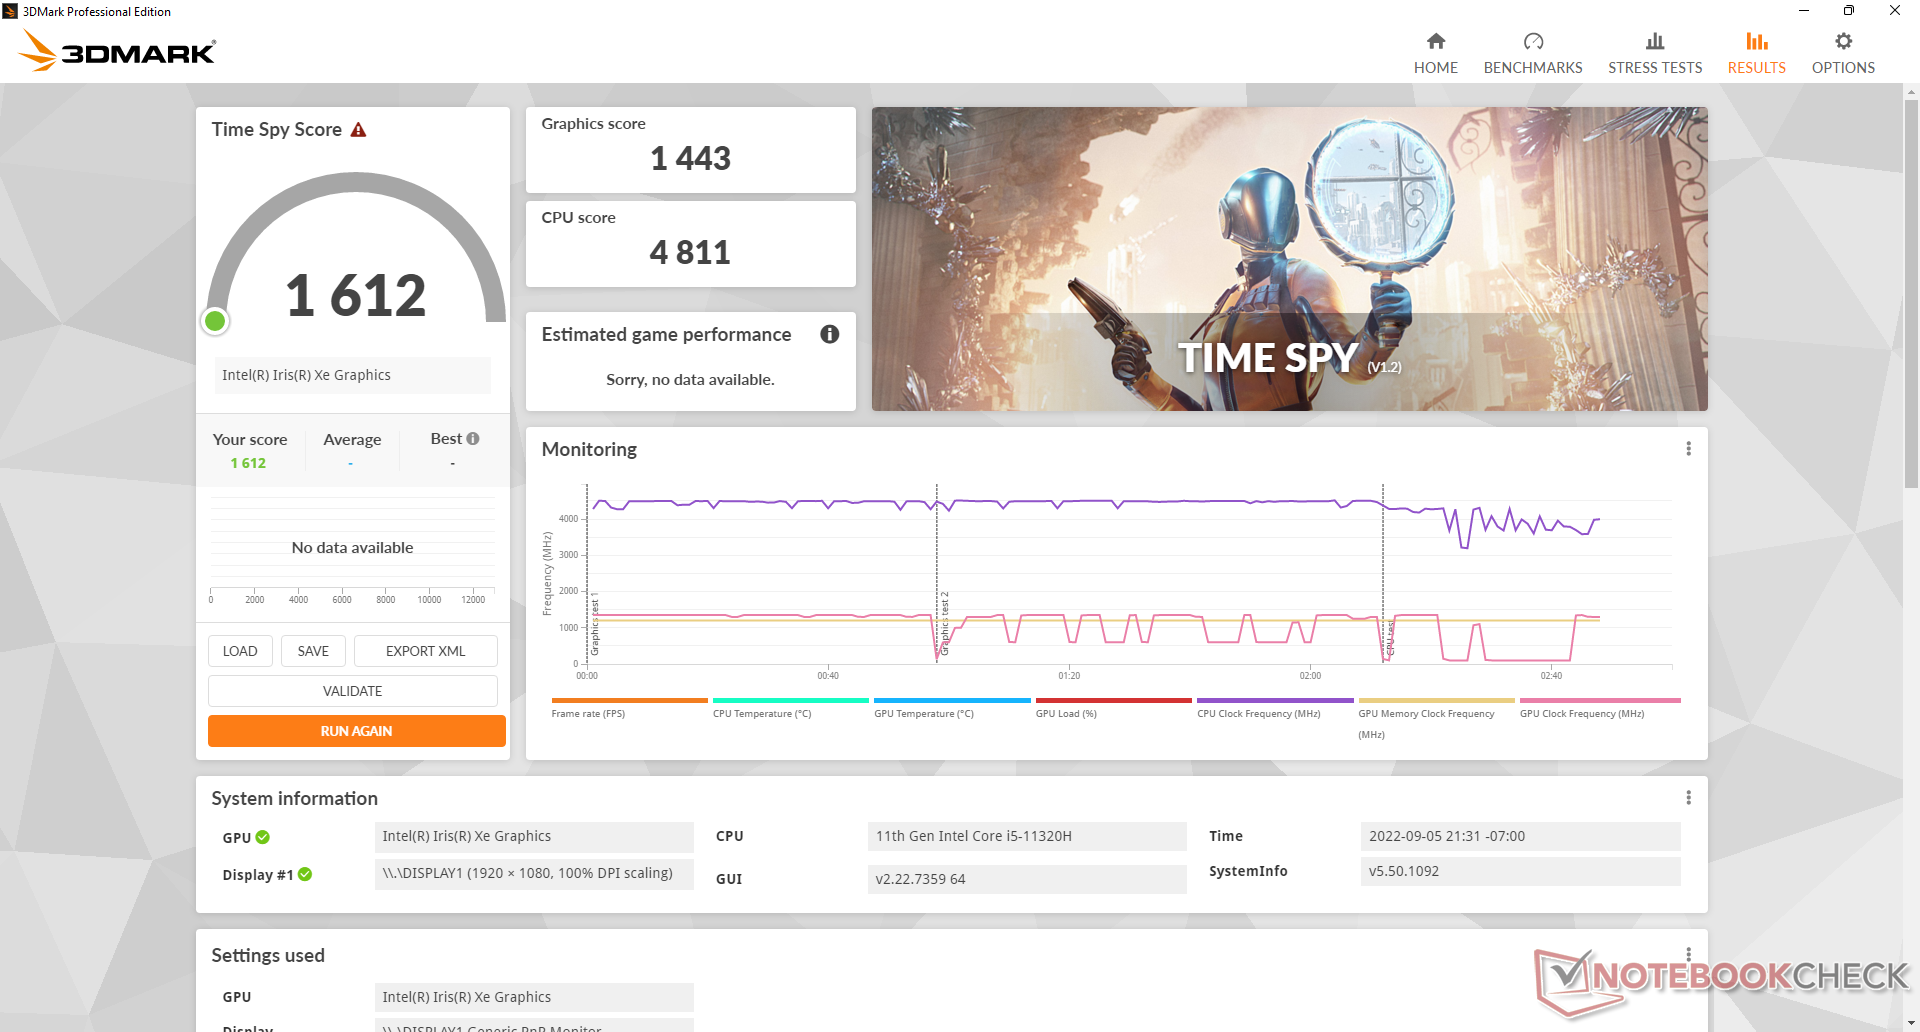
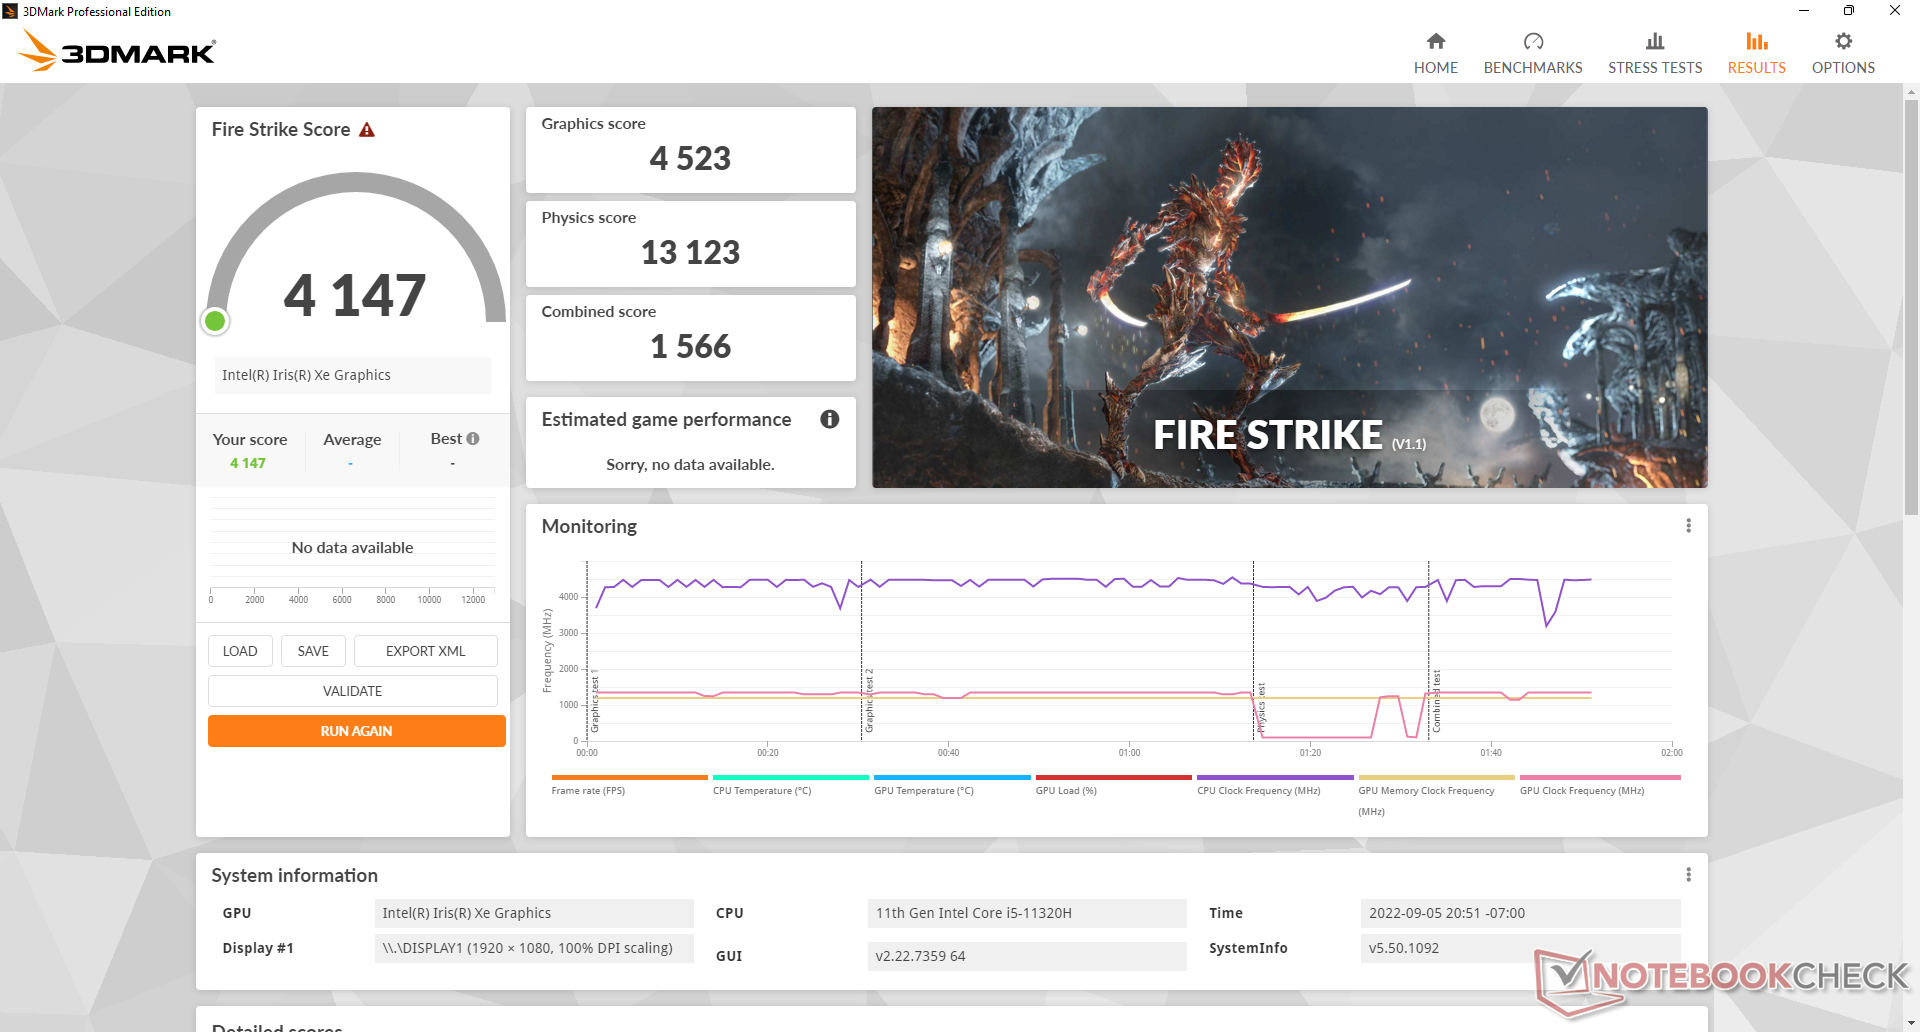
Integrated graphics performance is where we expect it to be relative to other PCs with the same Iris Xe 96 EUs GPU. Be sure to configure the SEi11 with dual-channel RAM or else graphics performance can drop by as much as 30 to 40 percent.
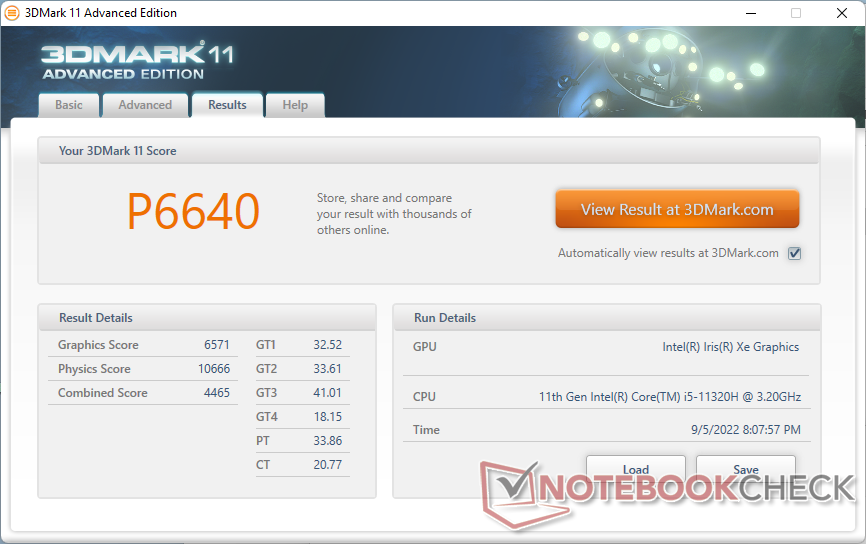
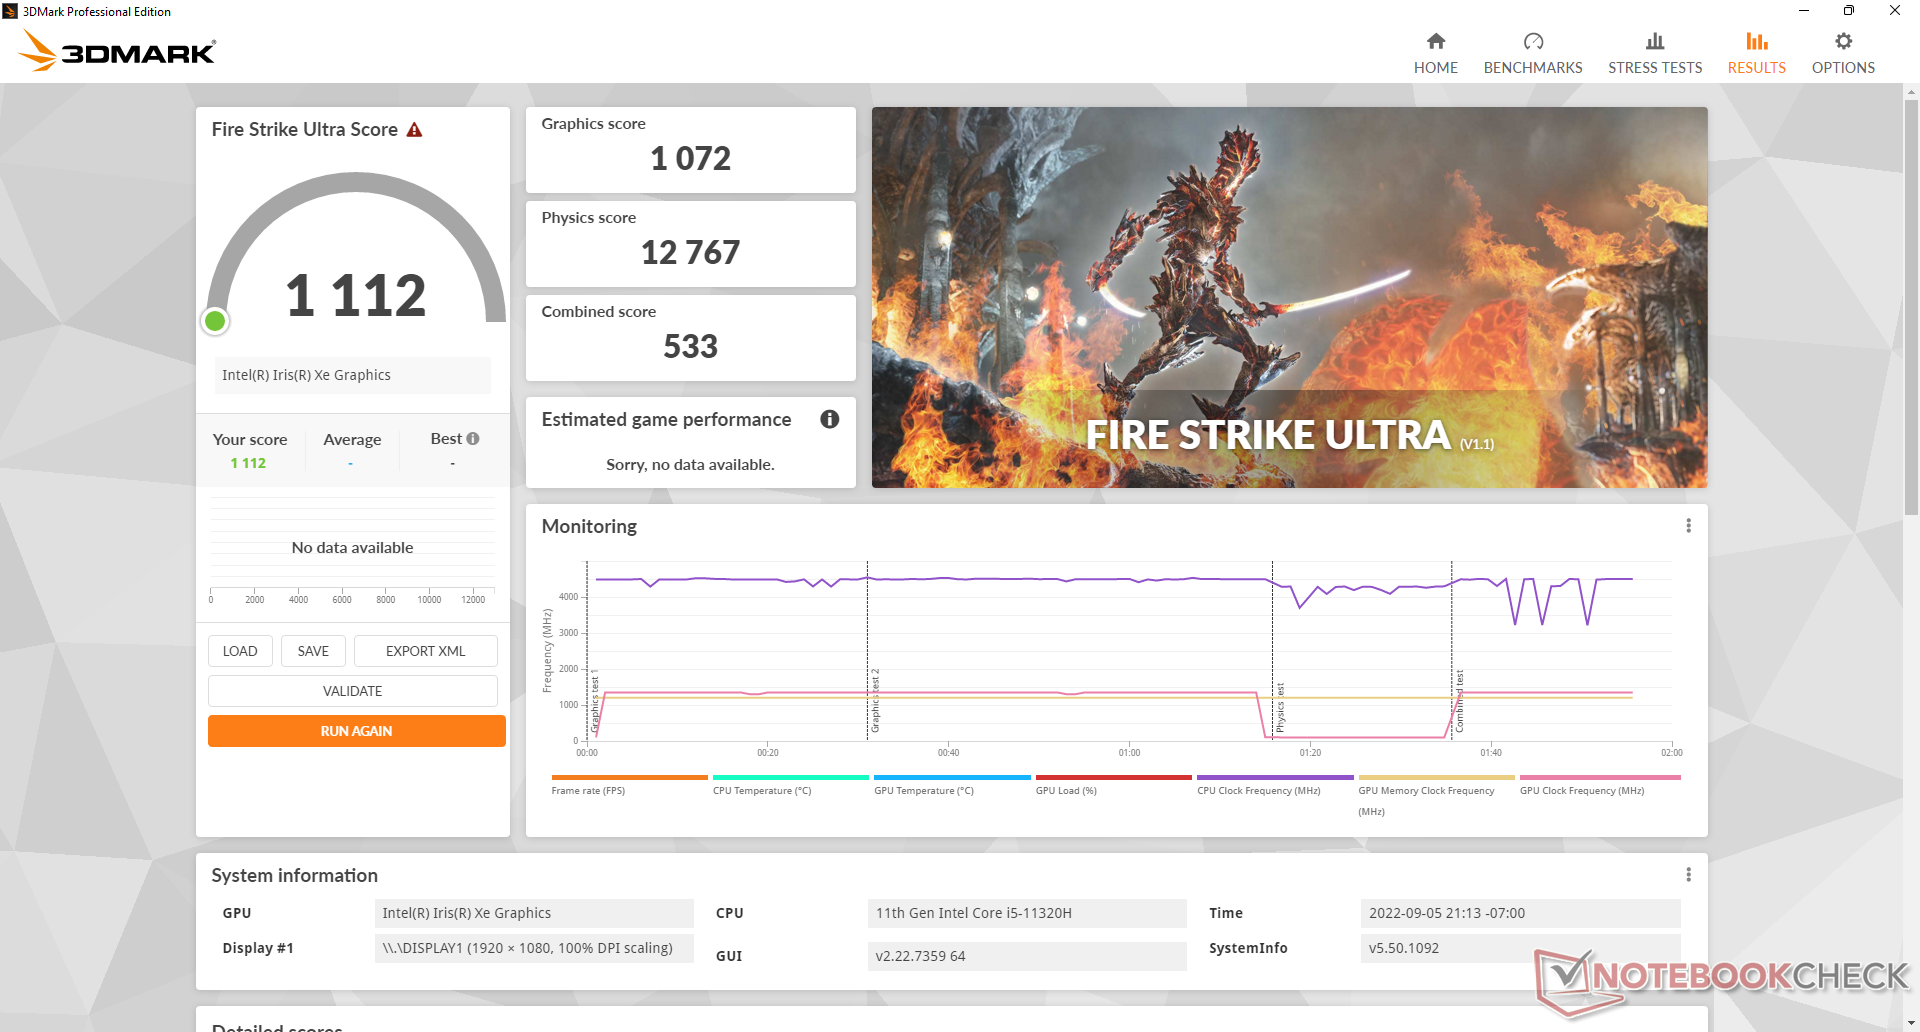
| 3DMark 11 Performance | 6640 points | |
| 3DMark Cloud Gate Standard Score | 18218 points | |
| 3DMark Fire Strike Score | 4147 points | |
| 3DMark Time Spy Score | 1612 points | |
Help | ||
| The Witcher 3 | |
| 1024x768 Low Graphics & Postprocessing | |
| Beelink SEi11 Pro | |
| Beelink GTR5 | |
| Average Intel Iris Xe Graphics G7 96EUs (28.9 - 117.2, n=188) | |
| Beelink GTI 11 | |
| Beelink SER4 | |
| Intel NUC11TNKi5 | |
| 1366x768 Medium Graphics & Postprocessing | |
| Beelink GTR5 | |
| Beelink SEi11 Pro | |
| Average Intel Iris Xe Graphics G7 96EUs (21.4 - 77.8, n=185) | |
| Beelink GTI 11 | |
| Beelink SER4 | |
| 1920x1080 High Graphics & Postprocessing (Nvidia HairWorks Off) | |
| Average Intel Iris Xe Graphics G7 96EUs (10.6 - 45.9, n=191) | |
| Beelink SEi11 Pro | |
| Beelink GTR5 | |
| Beelink GTI 11 | |
| Beelink SER4 | |
| 1920x1080 Ultra Graphics & Postprocessing (HBAO+) | |
| Beelink GTR5 | |
| Beelink SER4 | |
| Average Intel Iris Xe Graphics G7 96EUs (8.79 - 20.1, n=181) | |
| Beelink SEi11 Pro | |
| Beelink GTI 11 | |
| Cyberpunk 2077 1.6 | |
| 1920x1080 Low Preset | |
| Average Intel Iris Xe Graphics G7 96EUs (13 - 25.9, n=42) | |
| Beelink SEi11 Pro | |
| 1920x1080 Medium Preset | |
| Average Intel Iris Xe Graphics G7 96EUs (10.8 - 21.7, n=37) | |
| Beelink SEi11 Pro | |
| 1920x1080 High Preset | |
| Average Intel Iris Xe Graphics G7 96EUs (9.8 - 16.9, n=34) | |
| Beelink SEi11 Pro | |
| 1920x1080 Ultra Preset | |
| Average Intel Iris Xe Graphics G7 96EUs (7.4 - 16.8, n=32) | |
| Beelink SEi11 Pro | |
| GTA V | |
| 1024x768 Lowest Settings possible | |
| Beelink GTR5 | |
| Beelink SER4 | |
| Average Intel Iris Xe Graphics G7 96EUs (52 - 166.4, n=168) | |
| Beelink GTI 11 | |
| Beelink SEi11 Pro | |
| 1920x1080 Lowest Settings possible | |
| Beelink GTR5 | |
| Average Intel Iris Xe Graphics G7 96EUs (34.7 - 132.1, n=141) | |
| Beelink SER4 | |
| Beelink SEi11 Pro | |
| Beelink GTI 11 | |
| 1366x768 Normal/Off AF:4x | |
| Beelink GTR5 | |
| Beelink SER4 | |
| Average Intel Iris Xe Graphics G7 96EUs (24.1 - 152.7, n=169) | |
| Beelink GTI 11 | |
| Beelink SEi11 Pro | |
| 1920x1080 Normal/Off AF:4x | |
| Beelink GTR5 | |
| Beelink SER4 | |
| Average Intel Iris Xe Graphics G7 96EUs (20 - 119.3, n=142) | |
| Beelink SEi11 Pro | |
| Beelink GTI 11 | |
| 1920x1080 High/On (Advanced Graphics Off) AA:2xMSAA + FX AF:8x | |
| Beelink GTR5 | |
| Beelink SER4 | |
| Beelink SEi11 Pro | |
| Average Intel Iris Xe Graphics G7 96EUs (9.39 - 51.6, n=162) | |
| Beelink GTI 11 | |
| 1920x1080 Highest AA:4xMSAA + FX AF:16x | |
| Beelink GTR5 | |
| Beelink SER4 | |
| Average Intel Iris Xe Graphics G7 96EUs (4.13 - 22.9, n=156) | |
| Beelink GTI 11 | |
| Final Fantasy XV Benchmark | |
| 1280x720 Lite Quality | |
| Beelink GTR5 | |
| Average Intel Iris Xe Graphics G7 96EUs (14.9 - 56.5, n=189) | |
| Beelink SEi11 Pro | |
| Beelink SER4 | |
| Beelink GTI 11 | |
| Intel NUC11TNKi5 | |
| 1920x1080 Standard Quality | |
| Beelink GTR5 | |
| Average Intel Iris Xe Graphics G7 96EUs (10.5 - 31.2, n=185) | |
| Beelink SEi11 Pro | |
| Beelink SER4 | |
| Beelink GTI 11 | |
| Intel NUC11TNKi5 | |
| 1920x1080 High Quality | |
| Average Intel Iris Xe Graphics G7 96EUs (8.15 - 27.8, n=178) | |
| Beelink GTR5 | |
| Beelink SEi11 Pro | |
| Beelink SER4 | |
| Beelink GTI 11 | |
| Intel NUC11TNKi5 | |
| X-Plane 11.11 | |
| 1280x720 low (fps_test=1) | |
| Beelink GTR5 | |
| Beelink SEi11 Pro | |
| Average Intel Iris Xe Graphics G7 96EUs (13.4 - 88.4, n=213) | |
| Beelink SER4 | |
| Intel NUC11TNKi5 | |
| Beelink GTI 11 | |
| 1920x1080 med (fps_test=2) | |
| Beelink GTR5 | |
| Beelink SEi11 Pro | |
| Average Intel Iris Xe Graphics G7 96EUs (11.6 - 69.5, n=214) | |
| Beelink SER4 | |
| Intel NUC11TNKi5 | |
| Beelink GTI 11 | |
| 1920x1080 high (fps_test=3) | |
| Beelink GTR5 | |
| Beelink SEi11 Pro | |
| Average Intel Iris Xe Graphics G7 96EUs (11.1 - 59.8, n=213) | |
| Beelink SER4 | |
| Intel NUC11TNKi5 | |
| Beelink GTI 11 | |
| Strange Brigade | |
| 1280x720 lowest AF:1 | |
| Beelink GTR5 | |
| Average Intel Iris Xe Graphics G7 96EUs (48.5 - 115.1, n=172) | |
| Beelink SER4 | |
| Beelink SEi11 Pro | |
| Beelink GTI 11 | |
| 1920x1080 medium AA:medium AF:4 | |
| Beelink GTR5 | |
| Average Intel Iris Xe Graphics G7 96EUs (18.2 - 51.4, n=170) | |
| Beelink SEi11 Pro | |
| Beelink SER4 | |
| Beelink GTI 11 | |
| 1920x1080 high AA:high AF:8 | |
| Beelink GTR5 | |
| Average Intel Iris Xe Graphics G7 96EUs (15.4 - 39.8, n=169) | |
| Beelink SER4 | |
| Beelink SEi11 Pro | |
| Beelink GTI 11 | |
| 1920x1080 ultra AA:ultra AF:16 | |
| Beelink GTR5 | |
| Beelink SER4 | |
| Average Intel Iris Xe Graphics G7 96EUs (13.2 - 31.7, n=167) | |
| Beelink SEi11 Pro | |
| Beelink GTI 11 | |
Witcher 3 FPS Chart
| low | med. | high | ultra | |
|---|---|---|---|---|
| GTA V (2015) | 94.2 | 77.6 | 23.2 | |
| The Witcher 3 (2015) | 89.7 | 53.7 | 27.8 | 13.8 |
| Dota 2 Reborn (2015) | 119.6 | 78.6 | 50.4 | 47.4 |
| Final Fantasy XV Benchmark (2018) | 38.6 | 20.3 | 14.9 | |
| X-Plane 11.11 (2018) | 58.2 | 41.2 | 37.3 | |
| Strange Brigade (2018) | 79.3 | 33.9 | 27.7 | 22.2 |
| Cyberpunk 2077 1.6 (2022) | 18.6 | 15.6 | 11.7 | 9.8 |
Emissions
System Noise
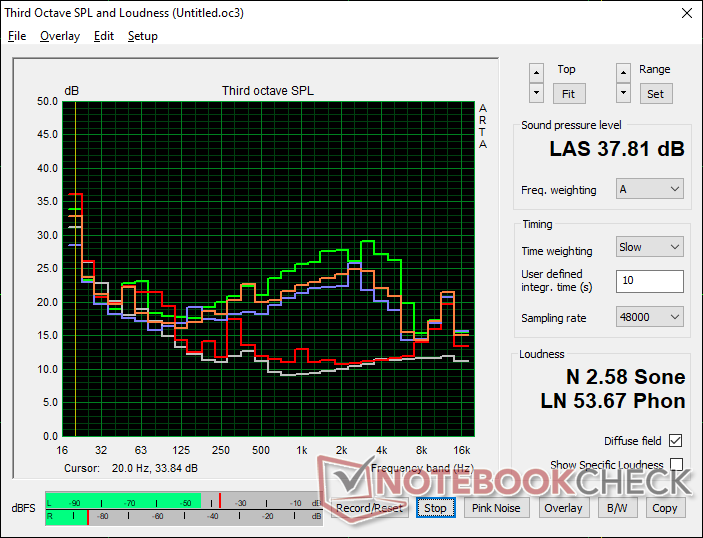
The fan in the unit is always active no matter the onscreen load or activity. It's thankfully relatively quiet at just 24.7 dB(A) against a background of 22.8 dB(A), but users expecting a completely silent mini PC will not find that here.
Overall fan noise is still quieter than on many other mini PCs when running more demanding loads. When web browsing or video streaming, for example, fan noise tends to hover between 25 and 28 dB(A) compared to over 30 dB(A) on the GTR5 or Intel NUC11. The fan tops out at just under 38 dB(A) when the CPU is at 100 percent utilization for long periods which is again noticeably quieter than many alternatives.
Noise level
| Idle |
| 24.7 / 24.7 / 25.3 dB(A) |
| Load |
| 33.2 / 37.8 dB(A) |
 | ||
30 dB silent 40 dB(A) audible 50 dB(A) loud |
||
min: | ||
| Beelink SEi11 Pro Iris Xe G7 96EUs, i5-11320H, Kingston NV1 SNVS/500GCN | Beelink GTR5 Vega 8, R9 5900HX, Kingston NV1 SNVS/500GCN | Beelink GTI 11 Iris Xe G7 80EUs, i5-1135G7, Kingston SA2000M8500G | Beelink SER4 Vega 8, R7 4800U, Intel SSD 660p SSDPEKNW512G8 | Intel NUC11TNKi5 Iris Xe G7 80EUs, i5-1135G7, Transcend M.2 SSD 430S TS512GMTS430S | |
|---|---|---|---|---|---|
| Noise | -26% | -31% | -20% | -26% | |
| off / environment * (dB) | 22.8 | 23.1 -1% | 25.7 -13% | 23.4 -3% | 24.8 -9% |
| Idle Minimum * (dB) | 24.7 | 34.2 -38% | 28.4 -15% | 33.2 -34% | 35.6 -44% |
| Idle Average * (dB) | 24.7 | 34.2 -38% | 32 -30% | 33.2 -34% | 35.6 -44% |
| Idle Maximum * (dB) | 25.3 | 34.2 -35% | 37.7 -49% | 33.2 -31% | 35.6 -41% |
| Load Average * (dB) | 33.2 | 44.6 -34% | 44.2 -33% | 38.6 -16% | 36.2 -9% |
| Witcher 3 ultra * (dB) | 34.5 | 41.4 -20% | 44.5 -29% | 39.2 -14% | 38 -10% |
| Load Maximum * (dB) | 37.8 | 45.1 -19% | 56 -48% | 40.8 -8% | 47.6 -26% |
* ... smaller is better
Temperature
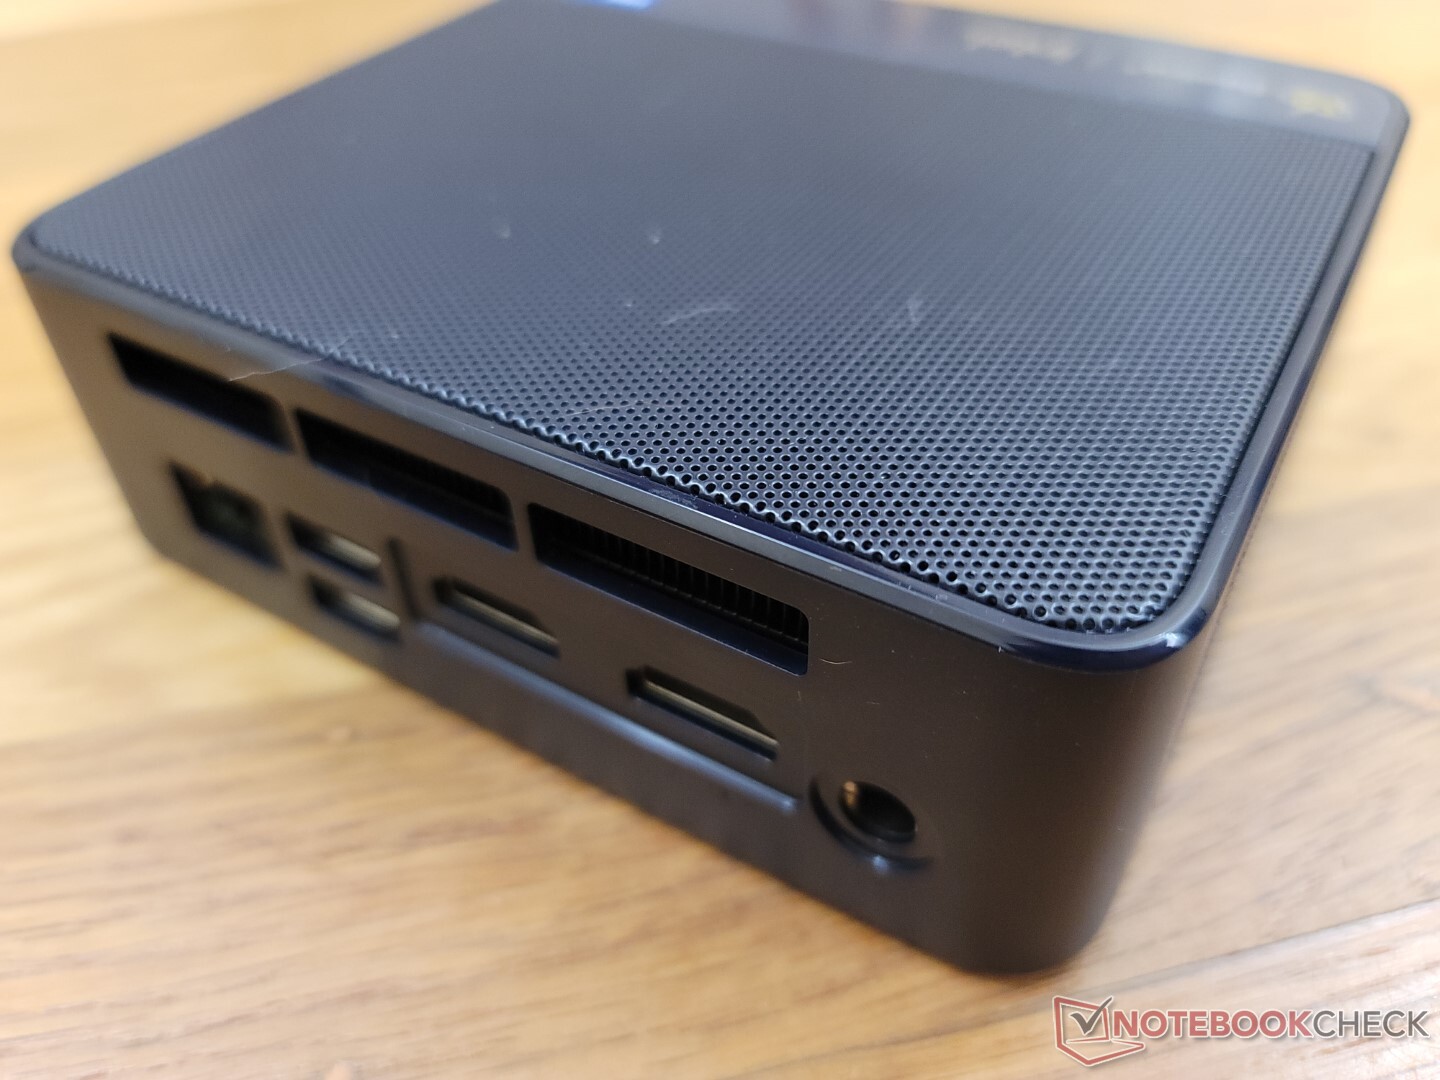
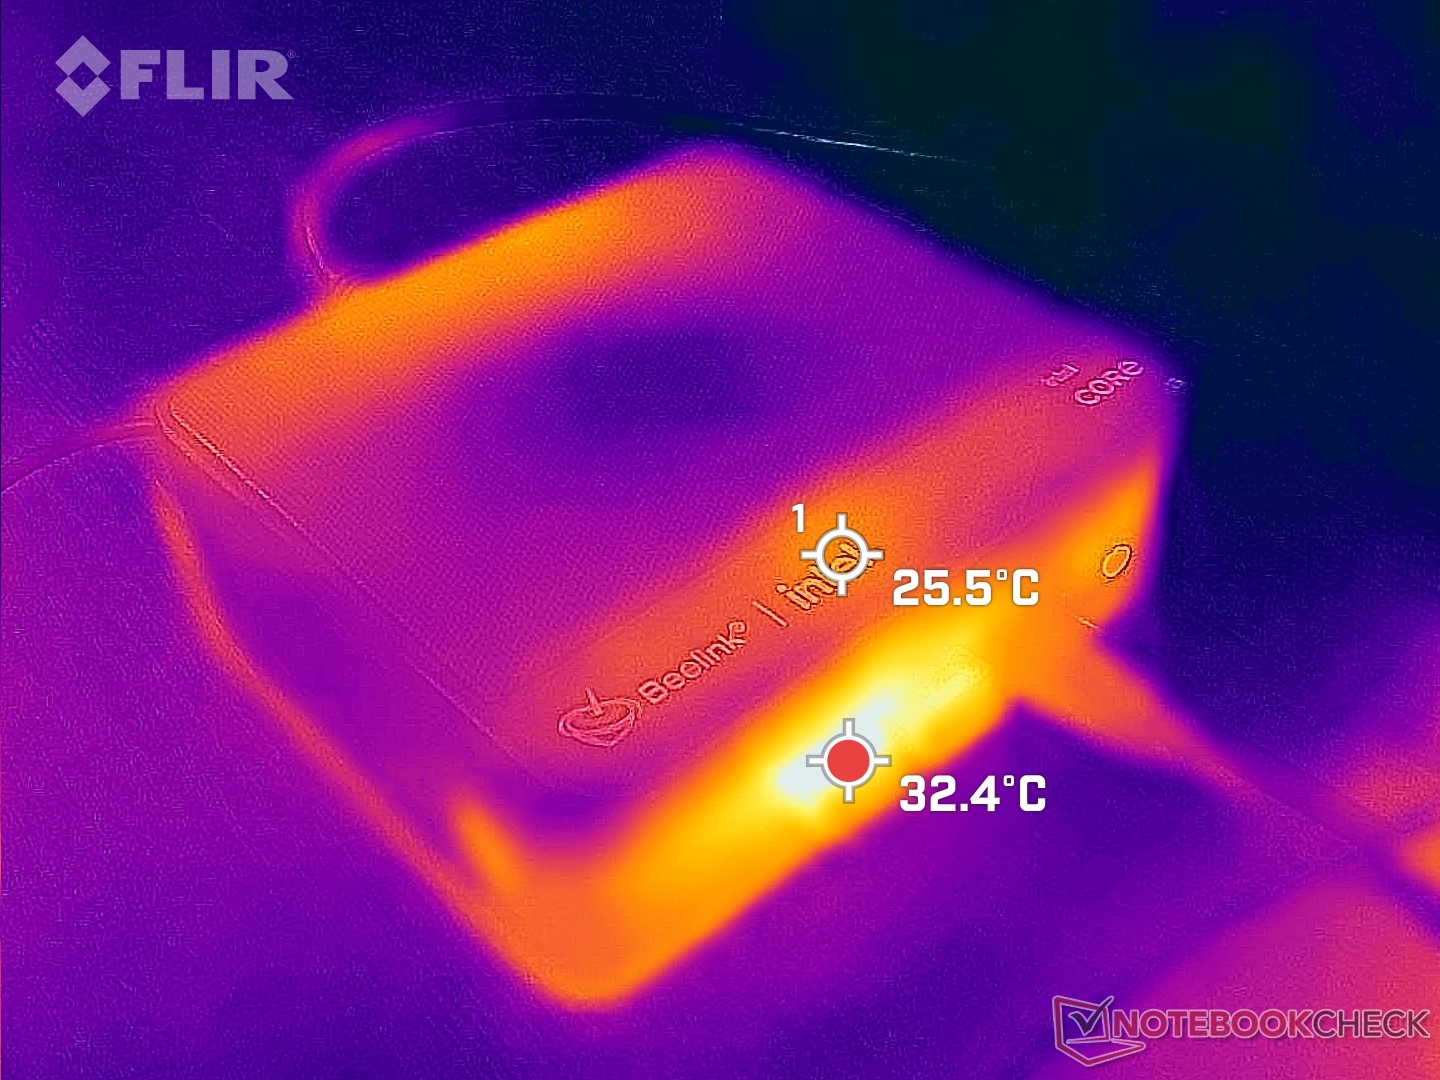
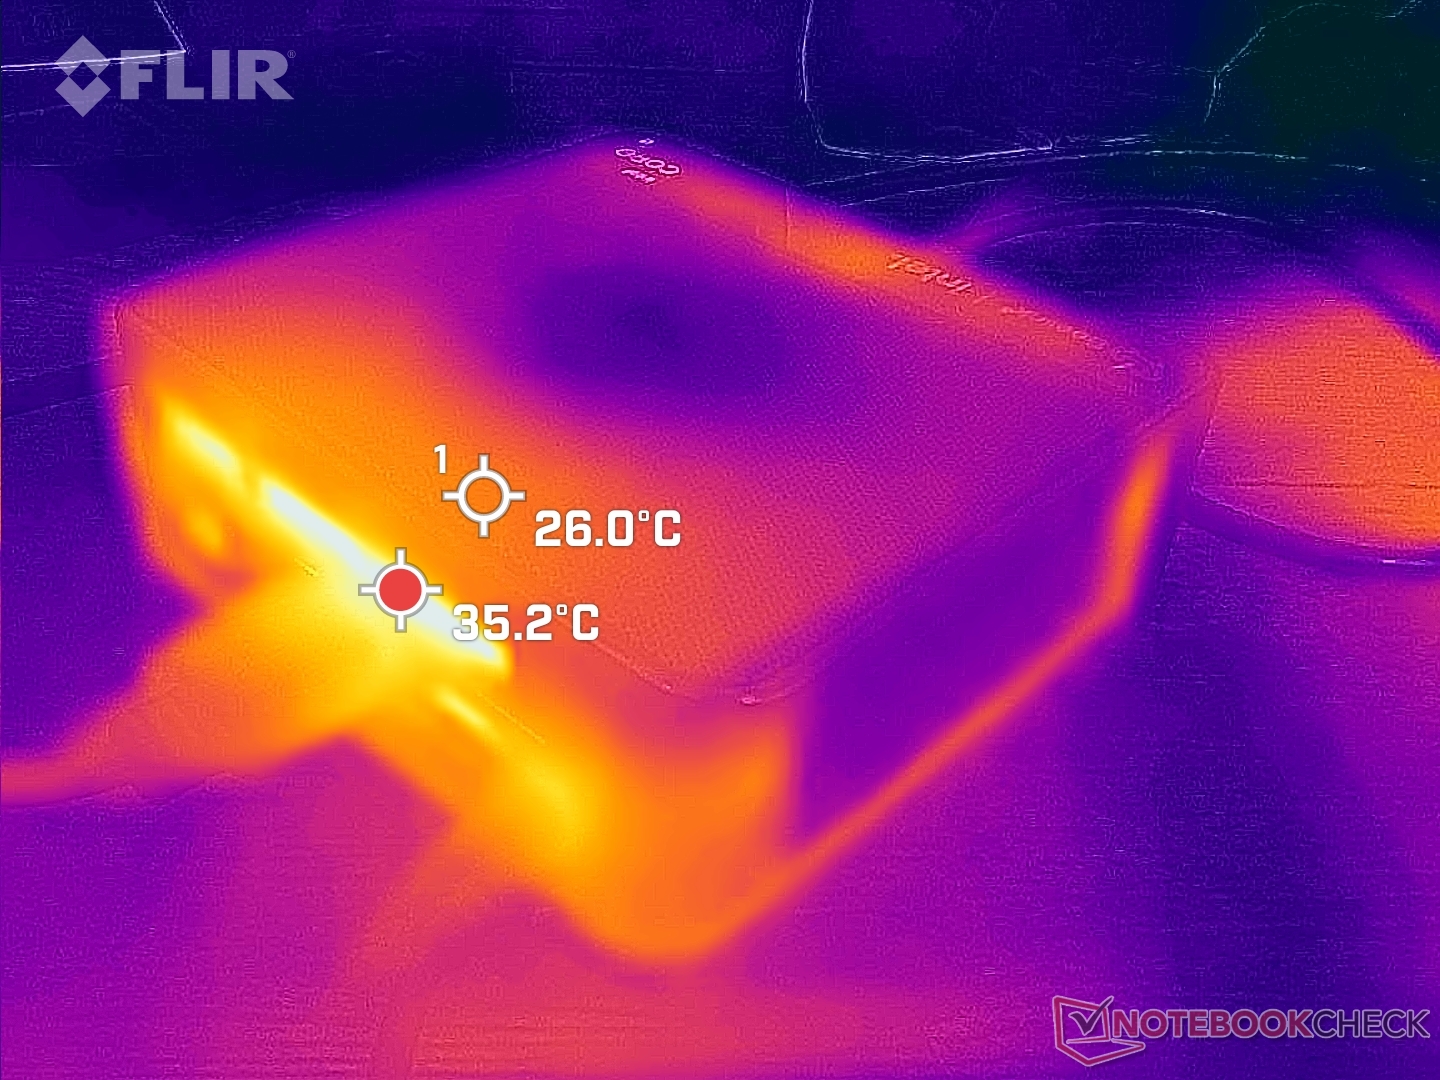
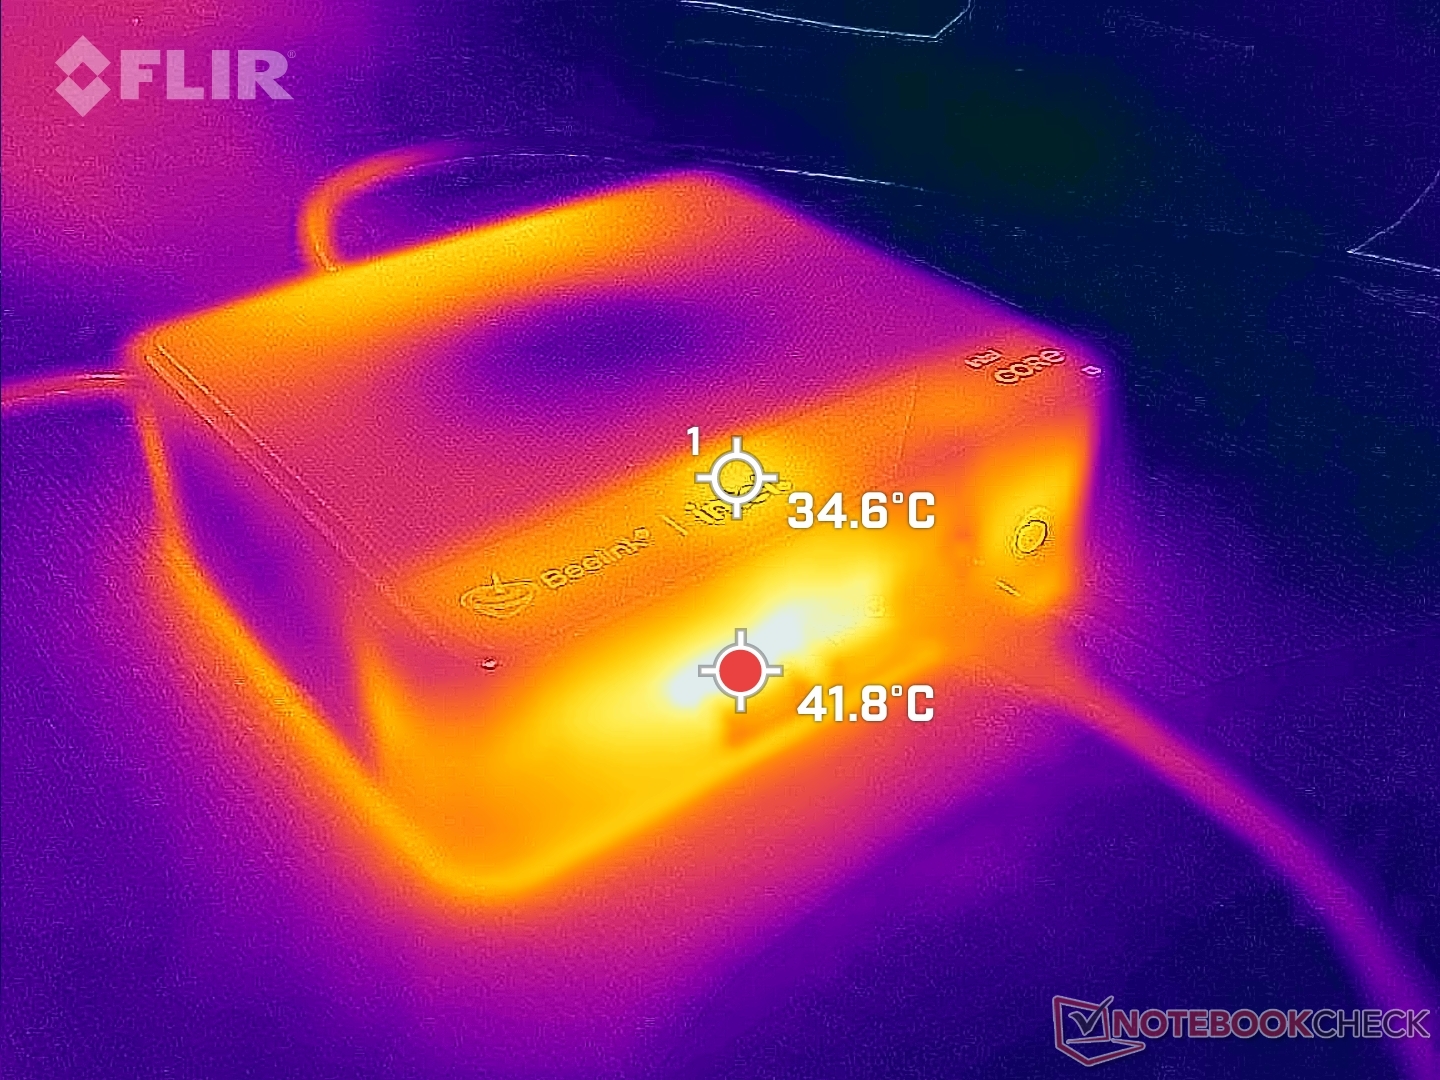
Cool air is pulled through the top surface of the unit while exhaust exits from the rear as shown by our temperature maps below. Items such as books and papers should not be placed on top as a result.
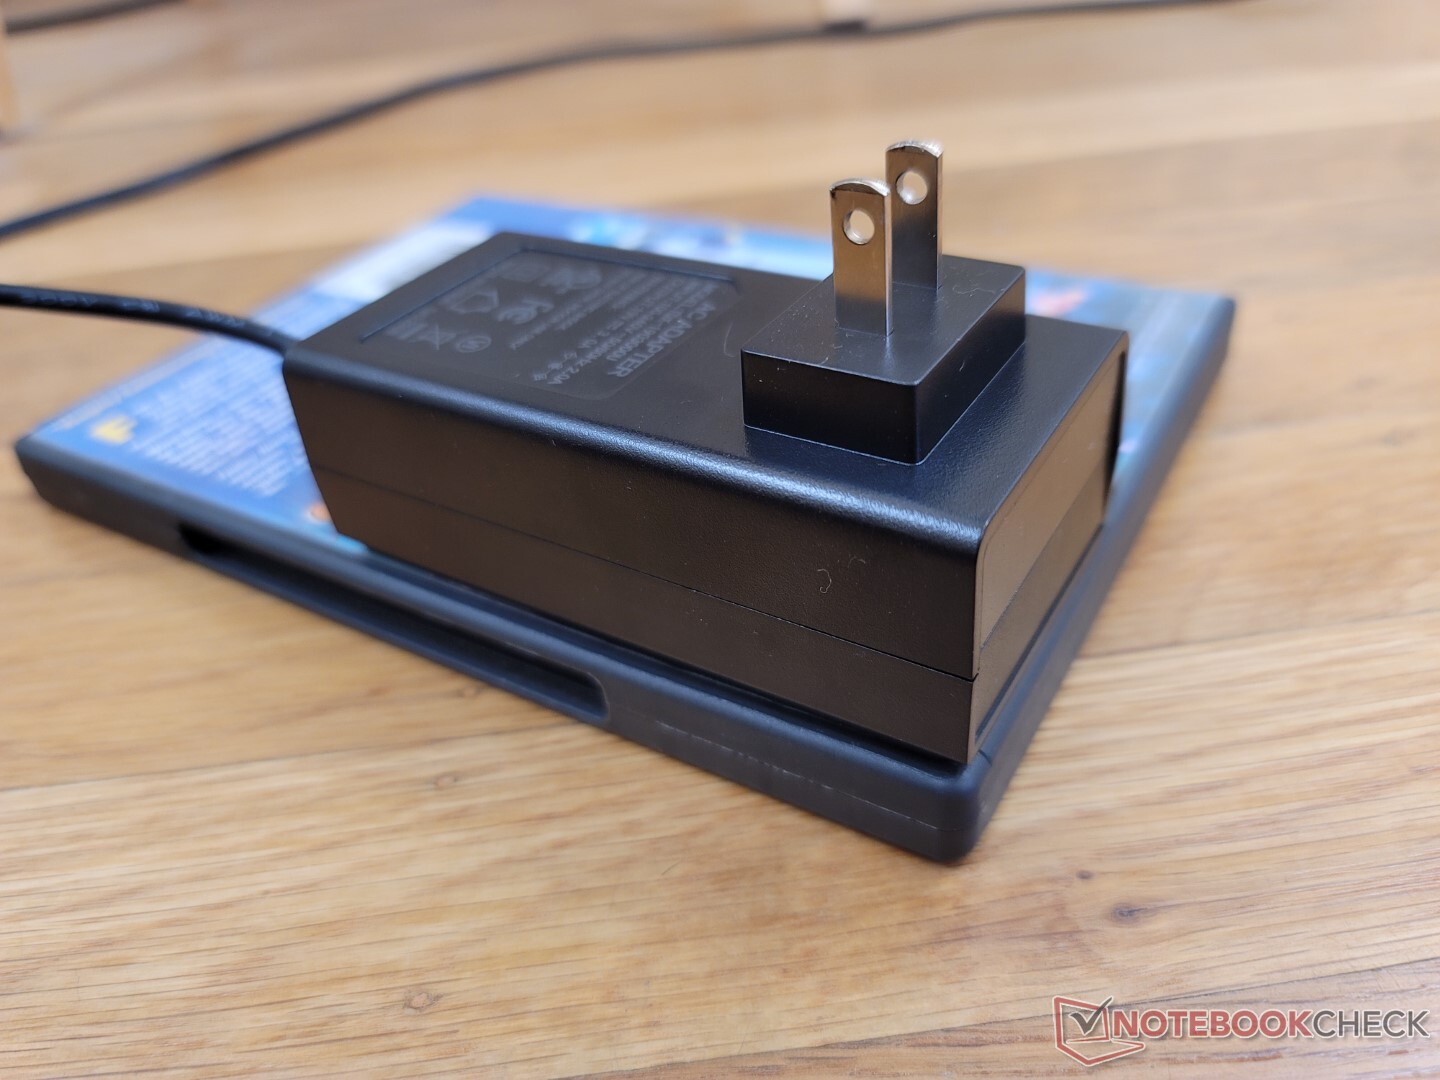
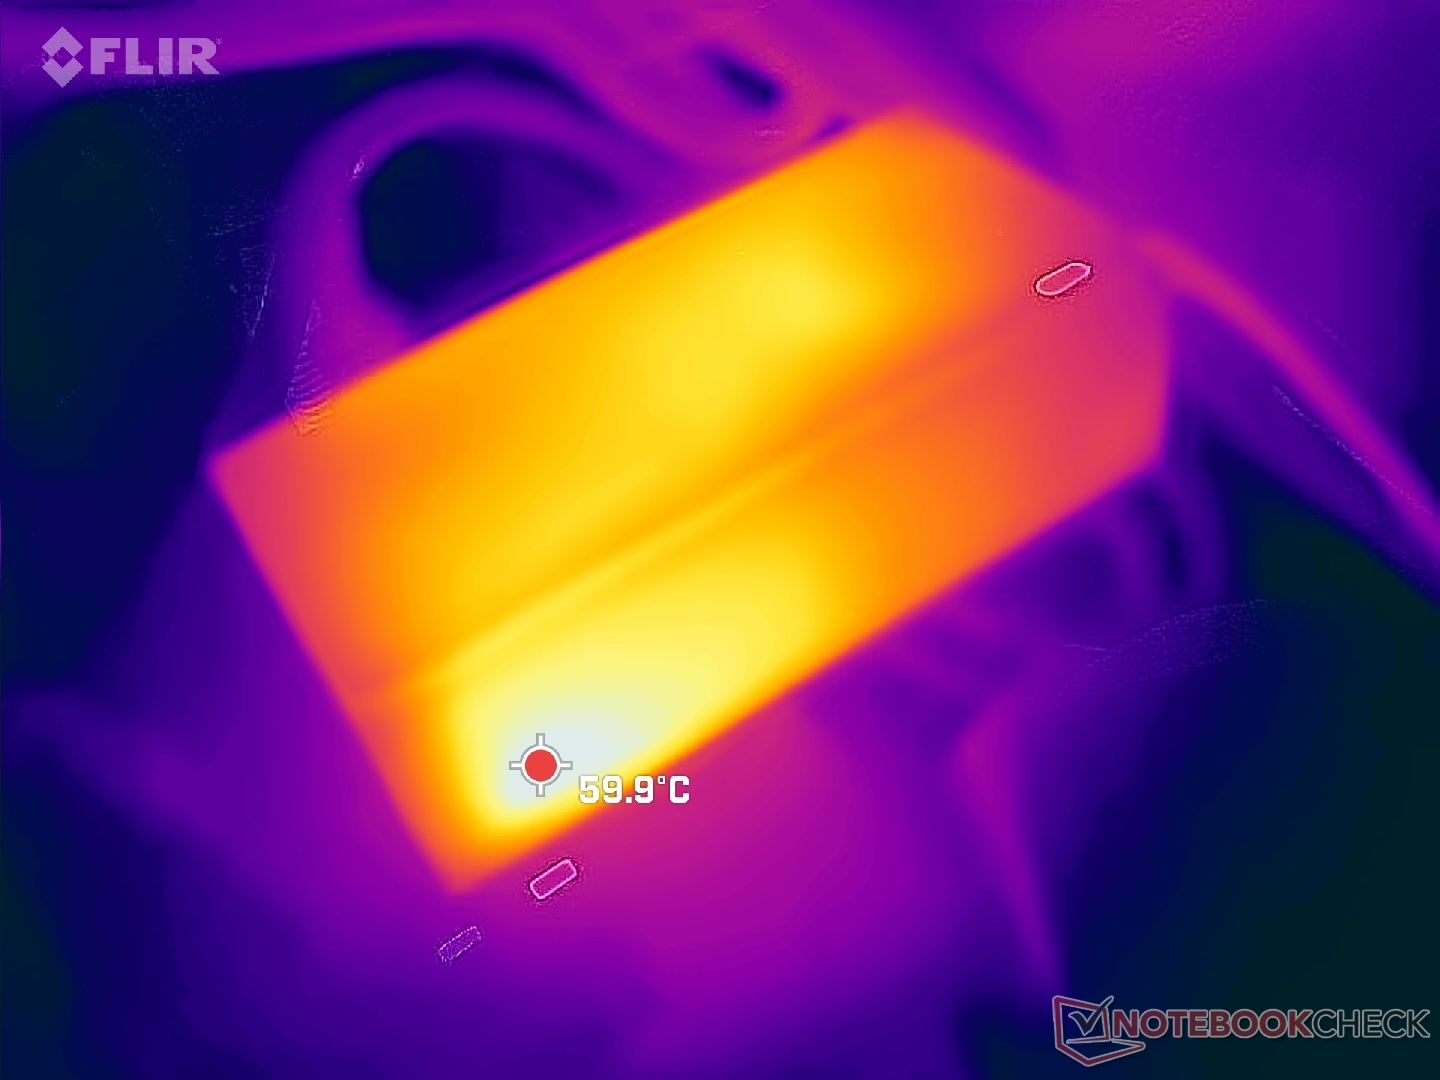
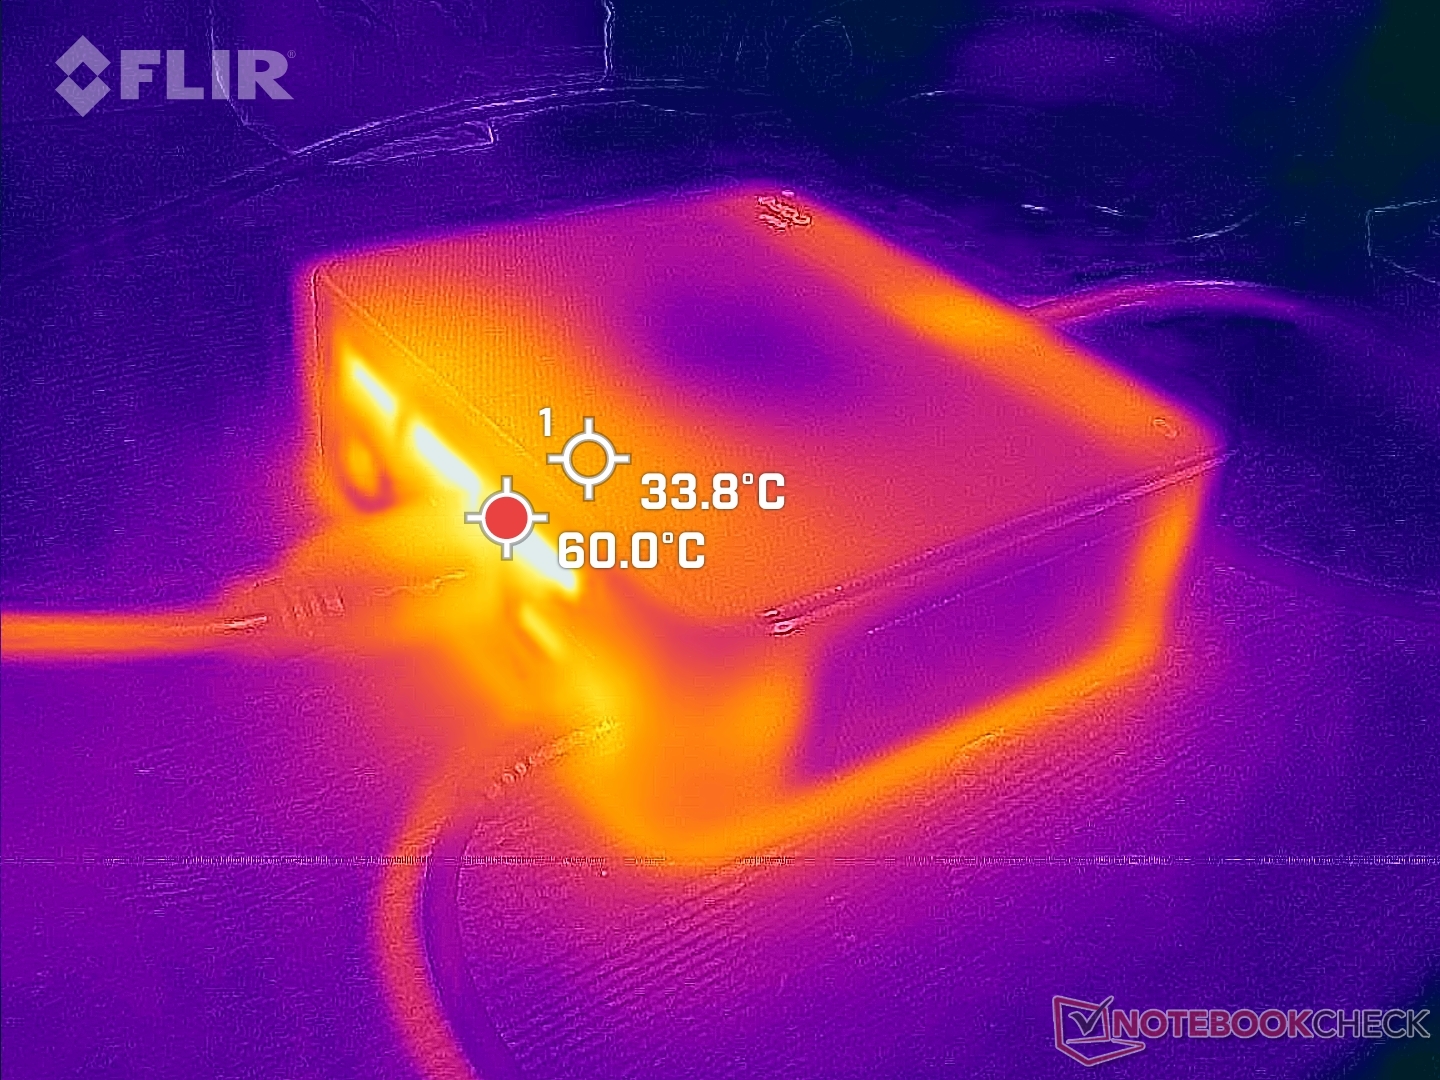
Note that the AC adapter can become noticeably warmer than most other AC adapters that ship with laptops.
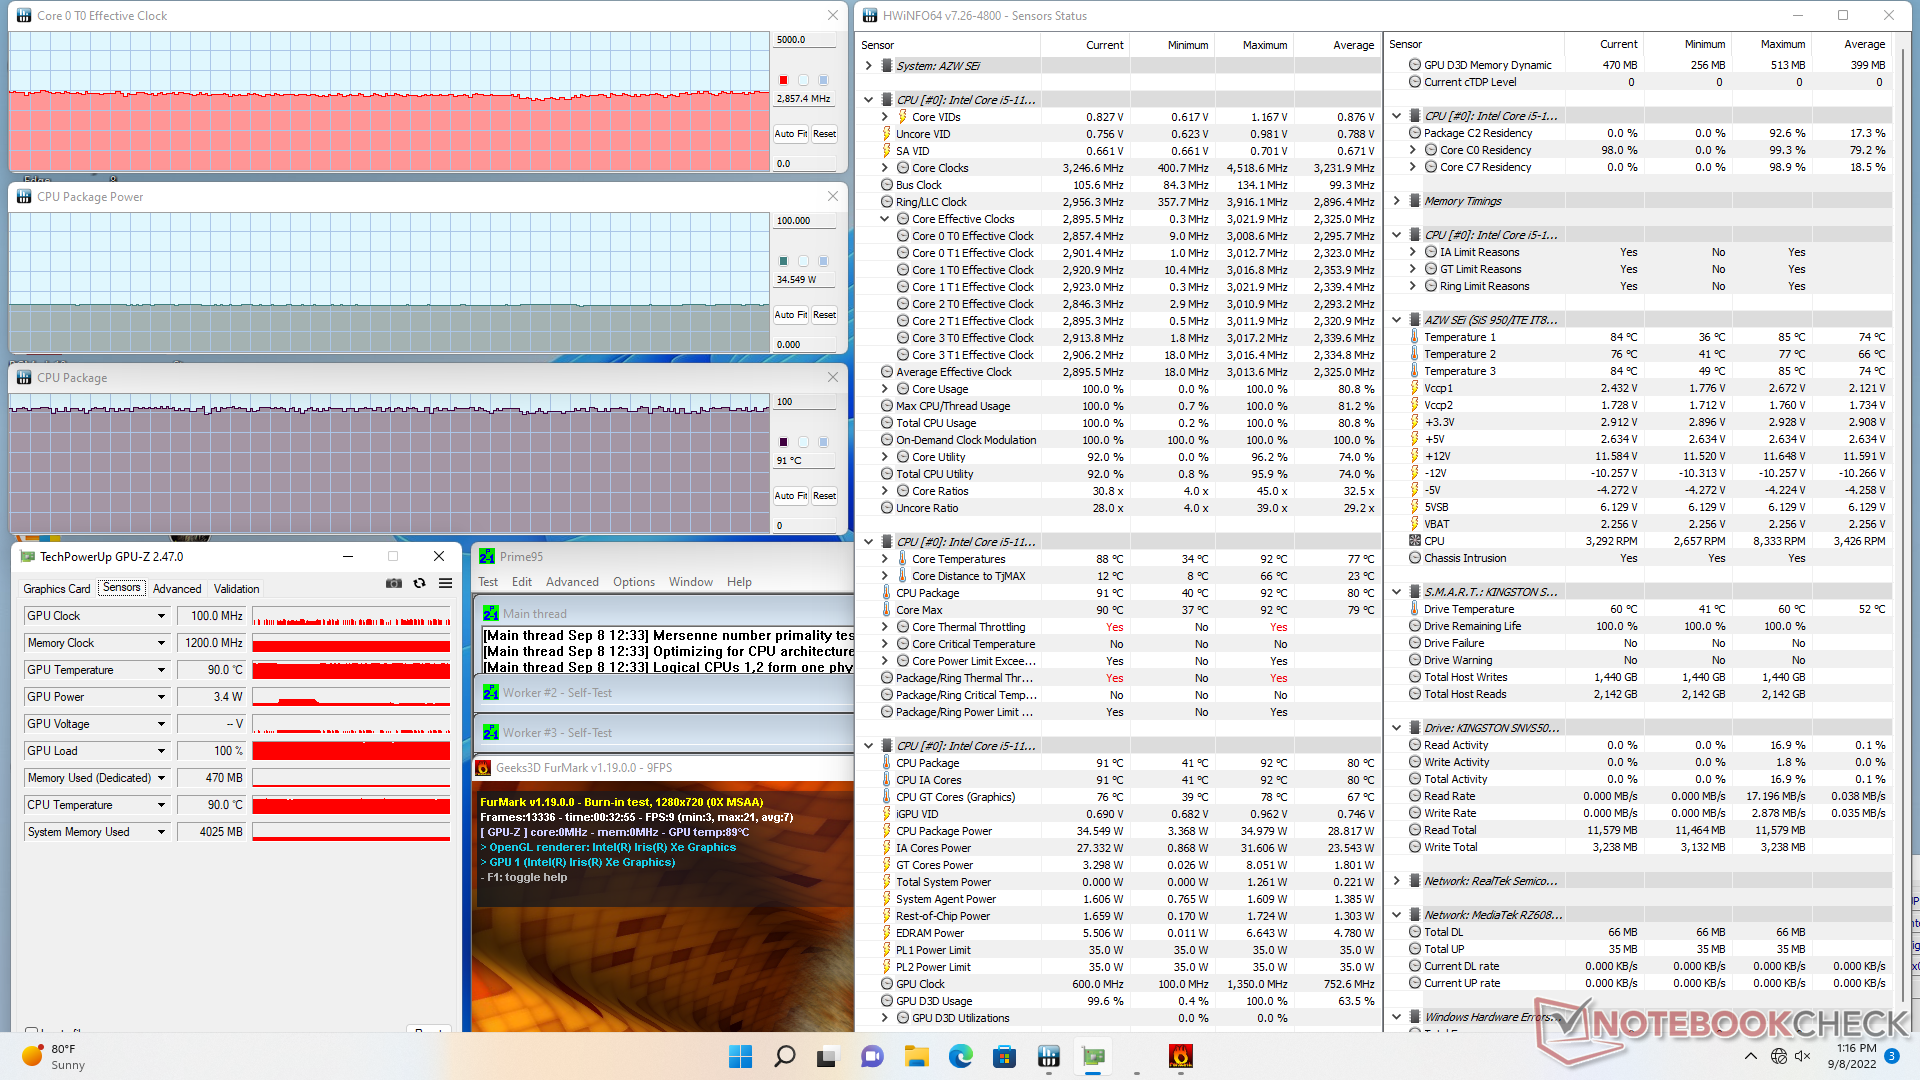
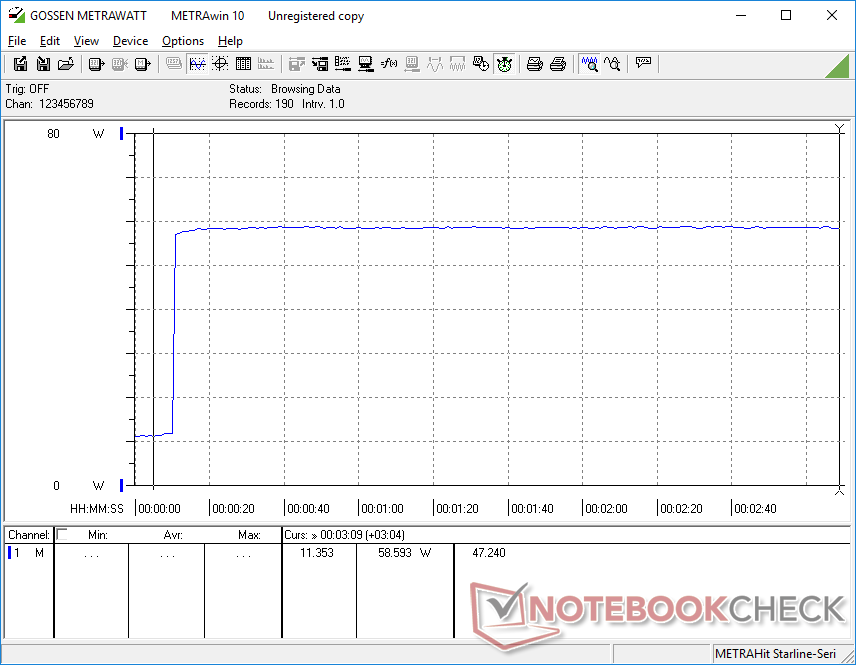
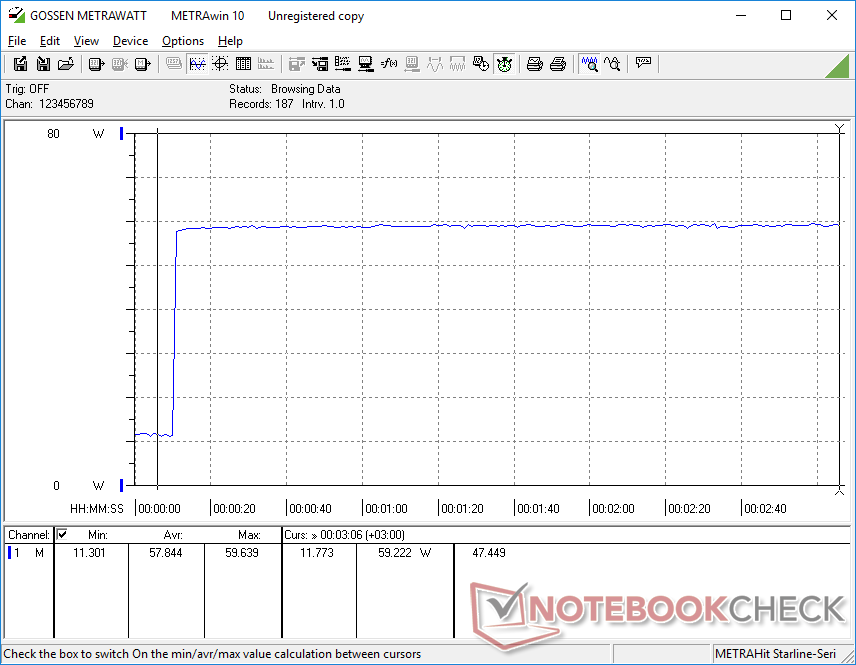
Stress Test
Clock rates and board power draw would spike to 2.9 GHz and 35 W, respectively, when initiating Prime95 stress. The system is able to maintain these values indefinitely albeit at a relatively high core temperature of 90 C. 35 W is the upper TDP range for the Core i5-11320H and so the SEi11 is utilizing the processor close to its maximum potential.
GPU clock rates and temperature when running Witcher 3 are relatively stable at 1350 MHz and 83 C, respectively. Running this same test on the Intel NUC11 with the Core i5-1135G7 would result in a much cooler core temperature of 58 C in comparison.
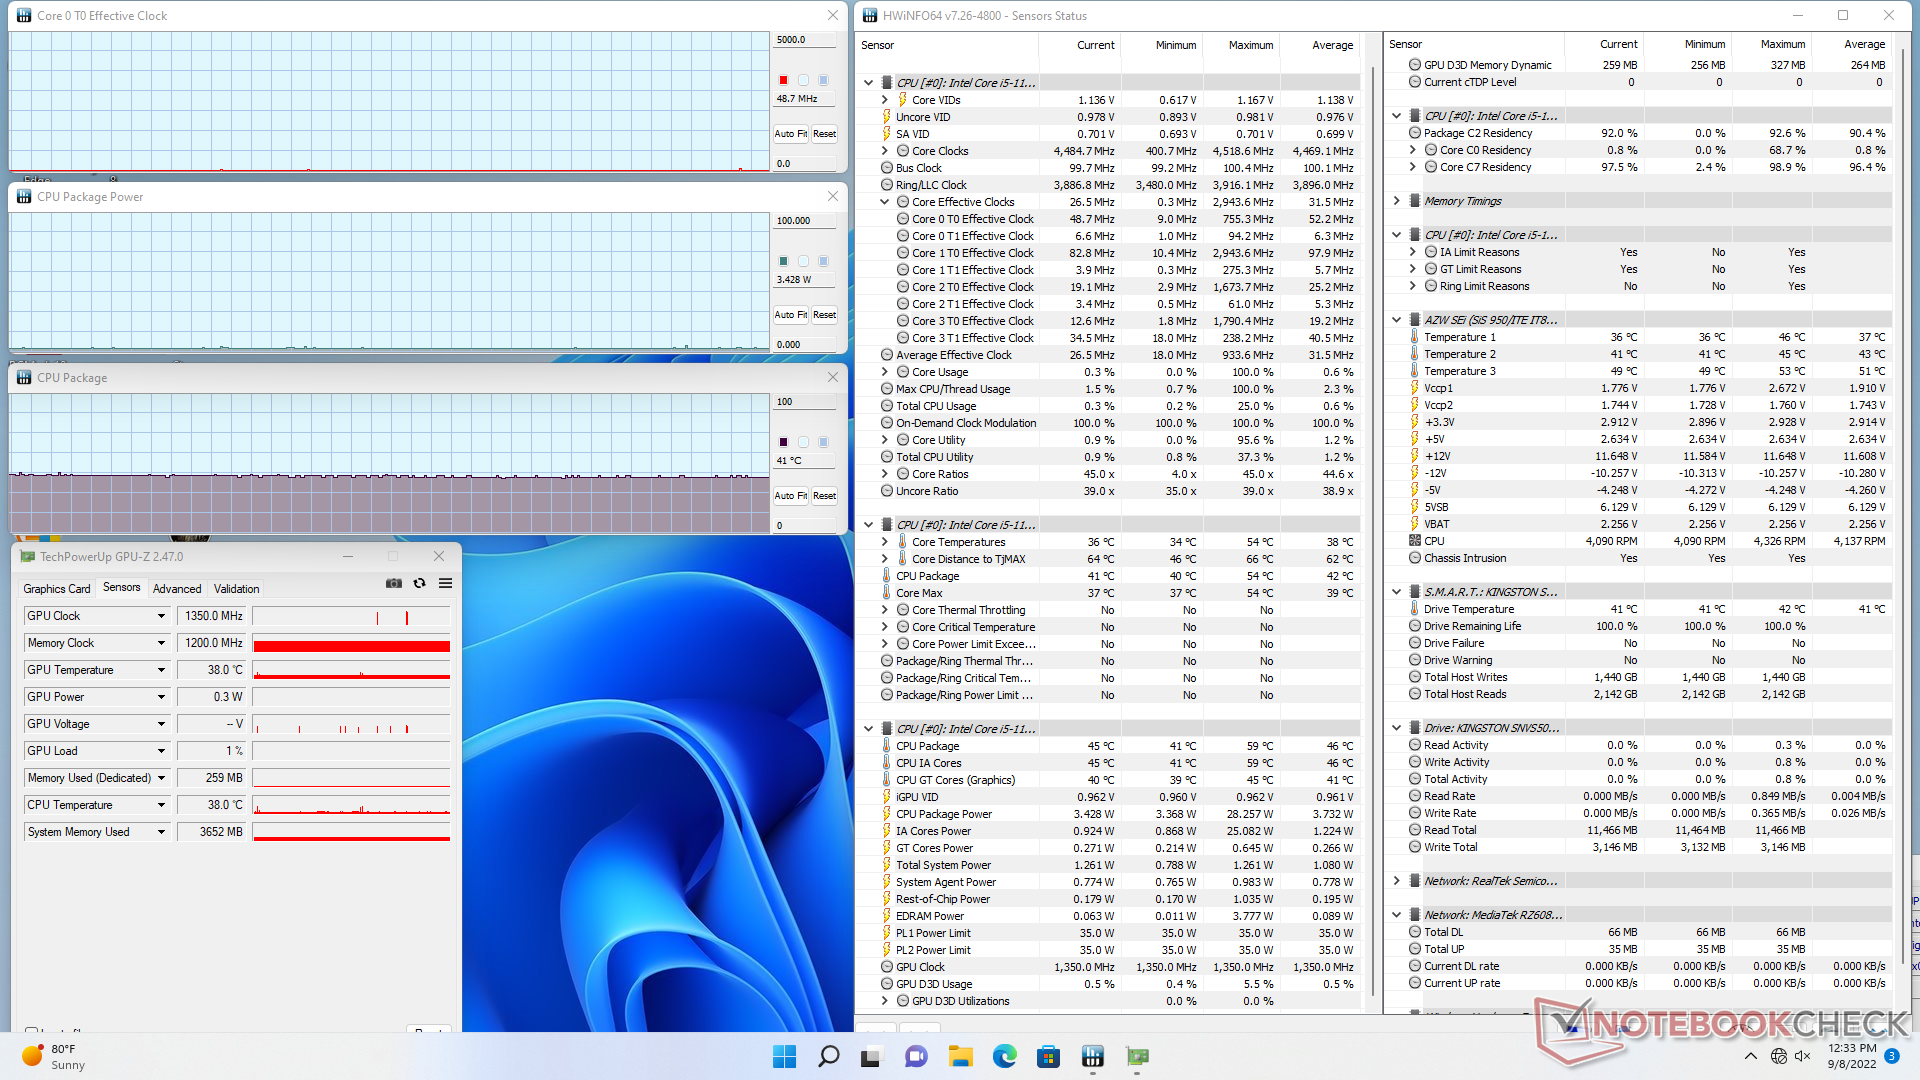
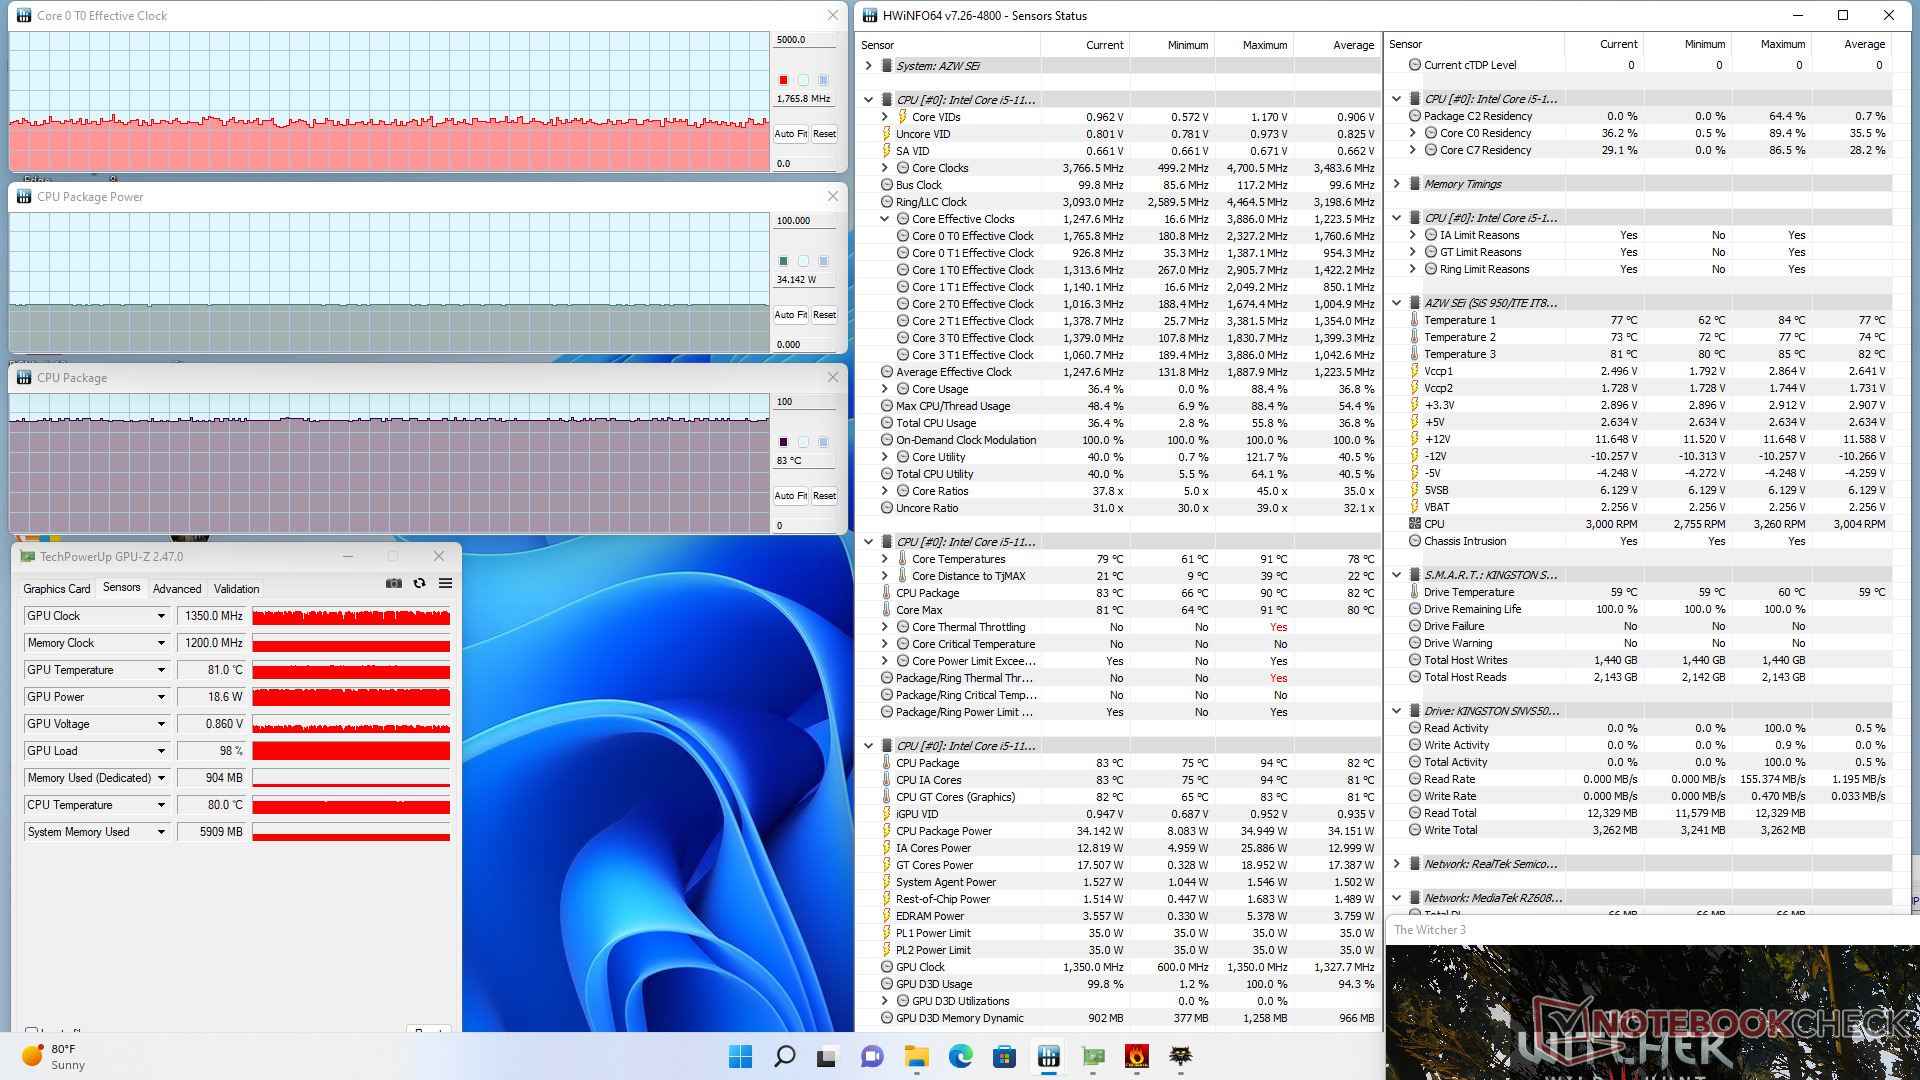
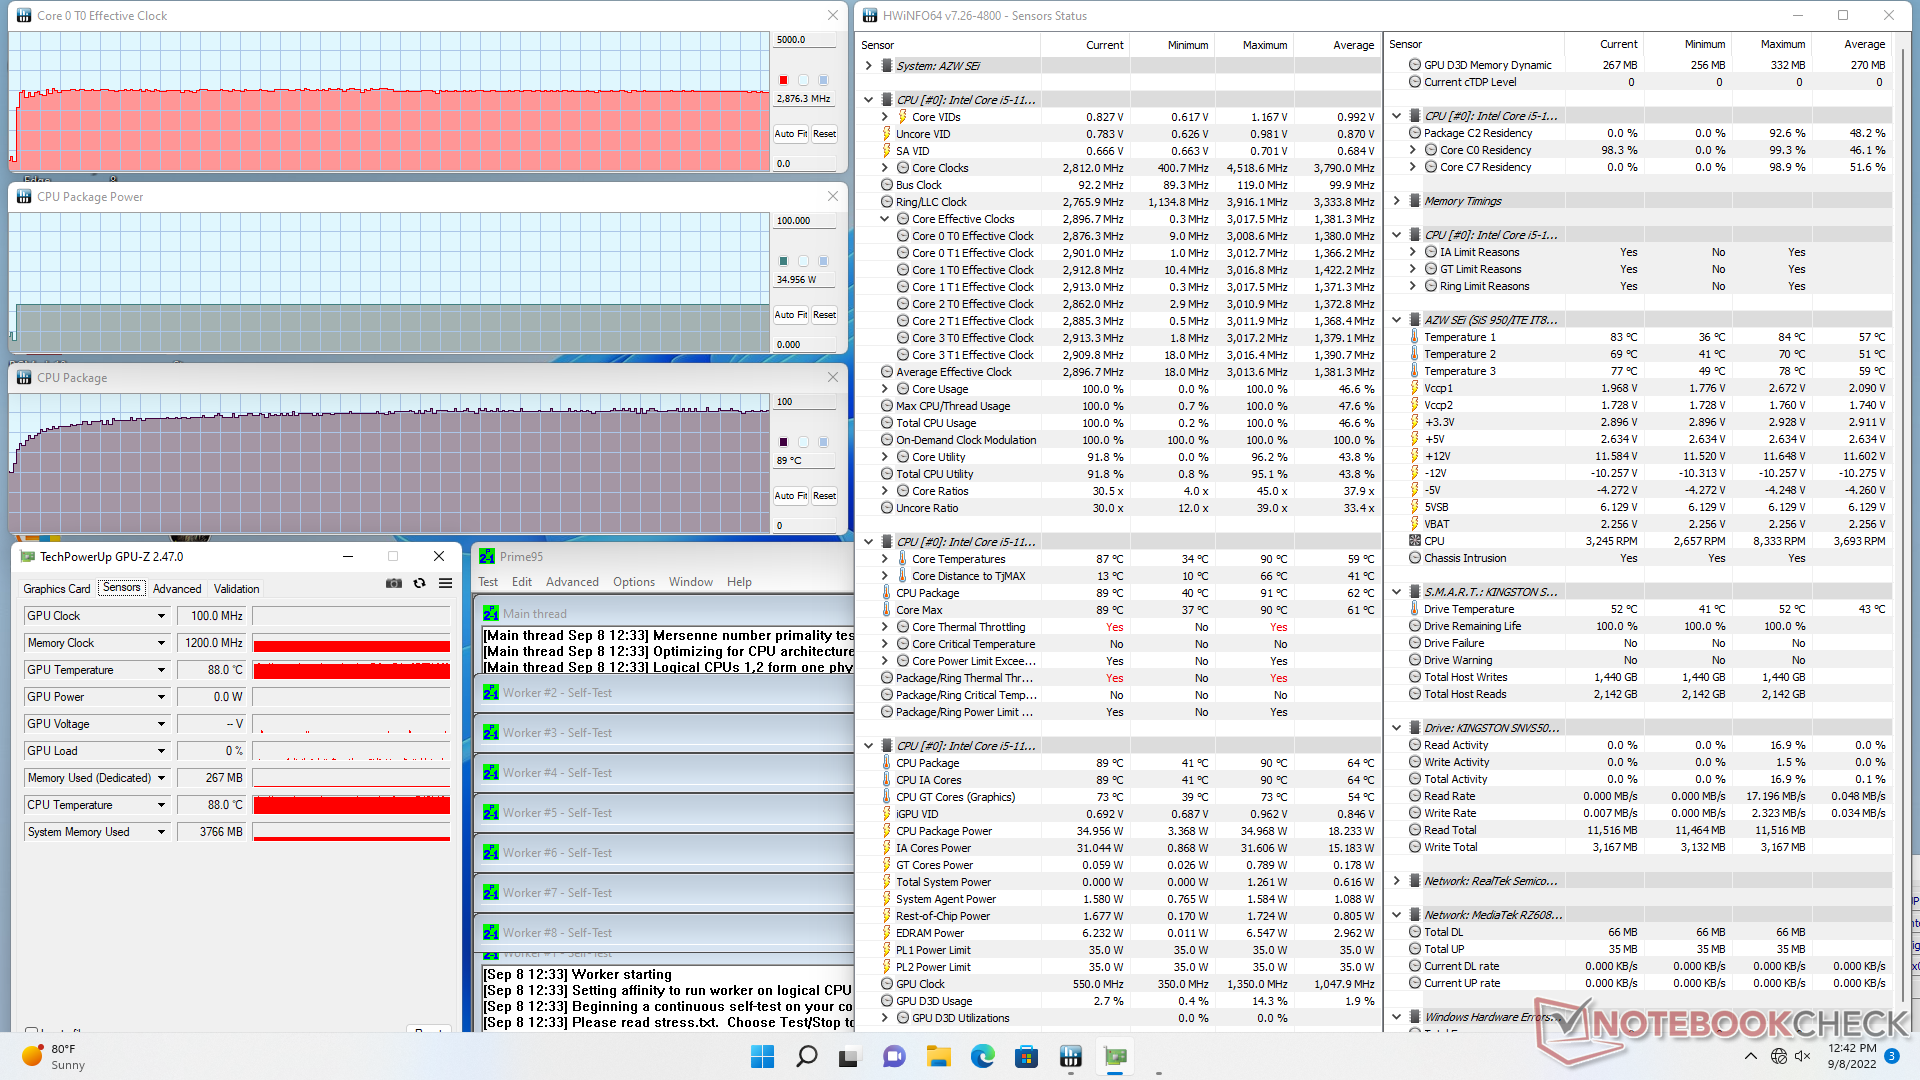
| CPU Clock (GHz) | GPU Clock (MHz) | Average CPU Temperature (°C) | |
| System Idle | -- | -- | 41 |
| Prime95 Stress | 2.9 | -- | 89 |
| Prime95 + FurMark Stress | ~2.9 | 600 | 91 |
| Witcher 3 Stress | ~1.8 | 1350 | 83 |
Energy Management
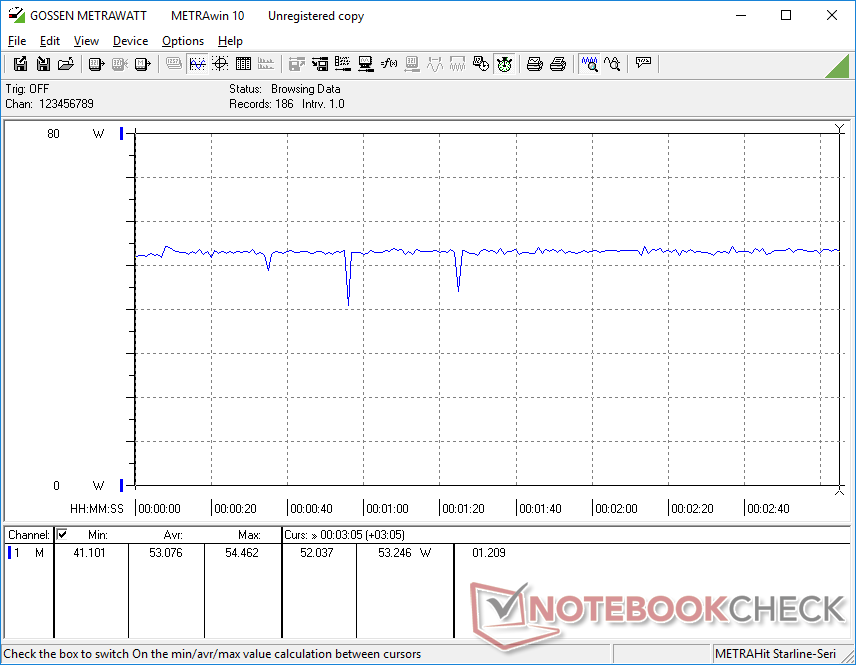
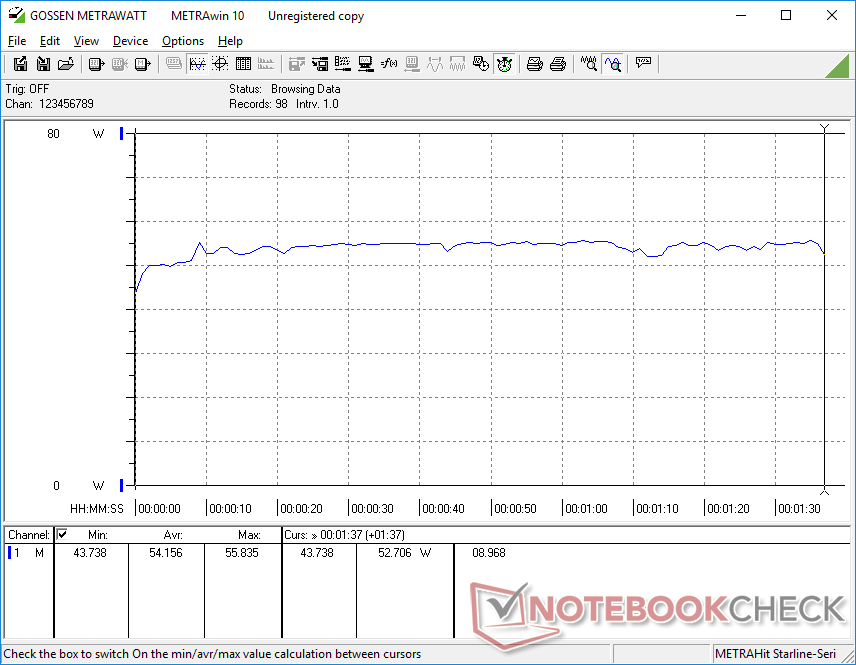
Power Consumption
The system is more demanding than mini PCs running on 11th gen Core U-series CPUs like the GTI 11 or Intel NUC11. If you value raw CPU multi-thread performance, however, then the SER4 may be the better option as it offers faster multi-thread performance while consuming over 30 percent less power than our SEi11.
We're able to record a maximum draw of 59 W from the relatively small (~10 x 4.3 x 4.8 cm) 57 W (19 V, 3 A) AC adapter when running Prime95.
| Off / Standby | |
| Idle | |
| Load |
|
Key:
min: | |
| Beelink SEi11 Pro i5-11320H, Iris Xe G7 96EUs, Kingston NV1 SNVS/500GCN, , x, | Beelink GTR5 R9 5900HX, Vega 8, Kingston NV1 SNVS/500GCN, , x, | Beelink GTI 11 i5-1135G7, Iris Xe G7 80EUs, Kingston SA2000M8500G, , x, | Beelink SER4 R7 4800U, Vega 8, Intel SSD 660p SSDPEKNW512G8, , x, | Intel NUC11TNKi5 i5-1135G7, Iris Xe G7 80EUs, Transcend M.2 SSD 430S TS512GMTS430S, , x, | |
|---|---|---|---|---|---|
| Power Consumption | -2% | -38% | 46% | -7% | |
| Idle Minimum * (Watt) | 9.8 | 6.2 37% | 15.2 -55% | 4.1 58% | 11.5 -17% |
| Idle Average * (Watt) | 10.3 | 8.9 14% | 16 -55% | 4.1 60% | 12.4 -20% |
| Idle Maximum * (Watt) | 10.5 | 9 14% | 16 -52% | 4.6 56% | 12.9 -23% |
| Load Average * (Watt) | 54.2 | 66.8 -23% | 48.6 10% | 35.6 34% | 40.7 25% |
| Witcher 3 ultra * (Watt) | 53.1 | 62.6 -18% | 53.8 -1% | 35.6 33% | 43.9 17% |
| Load Maximum * (Watt) | 59 | 81.6 -38% | 104.3 -77% | 39.9 32% | 73.5 -25% |
* ... smaller is better
Power Consumption Witcher 3 / Stresstest
Power Consumption external Monitor
Pros
Cons
Verdict — HTPC Core i5 Sweet Spot
Beelink's portfolio of mini PCs is home to a handful of "Intel NUC killers" that can offer most of the same features but for hundreds of dollars less. The SEi11 is yet another success story for the company due in large part to the Core i5-11320H which we've shown to be comparable to the Core i7-1165G7 as found on NUC models costing almost twice as much. In short, users won't need to settle for slower Core i3, Ryzen 3, Celeron, or Atom-level performance just because the NUC alternative is so much more affordable. The accessible RAM, dual storage solution, and wide selection of ports should satisfy most HTPC purposes or small home office setups.
The Beelink SEi11 performs almost exactly the same as an Intel NUC11 with the Core i7-1165G7 while retailing for significantly less.
There are a few cut corners to be wary of. Thunderbolt and DisplayPort in particular are not supported while WLAN is weaker than expected. The standard warranty is also shorter than the 36-month warranty of an Intel NUC. Fan noise is generally quieter than most other mini PCs albeit at the cost of warmer core temperatures. Otherwise, this is as close to an Intel NUC experience you can get without paying those NUC prices.
Price and Availability
Amazon has the Beelink SEi11 in stock complete with Windows 11 Pro, 500 GB SSD, and 16 GB of RAM for $479 USD or $419 USD after applying the coupon code as of this writing. Alternatively, users can purchase directly from the manufacturer for $429.
Price comparison
