Asus TUF Gaming GeForce RTX 4070 Ti Review: Ada mid-ranger with RTX 3090 Ti performance that undercuts AMD Radeon RX 7900 XT by US$50 ↺
Update 01/07: Review now complete
Nvidia's GeForce RTX 40 series launch was not without some consternation from gamers and the press alike. Alongside the RTX 4090, the company originally announced two RTX 4080 cards — a 16 GB version and a 12 GB version.
Although the RTX 4080 16 GB invited criticism due to its pricing (it remains overpriced to this date), its performance gains were still significant. Things went south with the RTX 4080 12 GB, however.
Nvidia's original rationale was that the RTX 4080 12 GB deserves to be named so since the performance is indeed in the class of an xx80 series card. However, gamers and the press did not take too kindly to this which led to the company eventually having to abruptly "unlaunch" the card.
Now, at CES 2023, Nvidia is 'relaunching' the AD104-based RTX 4080 12 GB as the GeForce RTX 4070 Ti priced at US$799 MSRP.
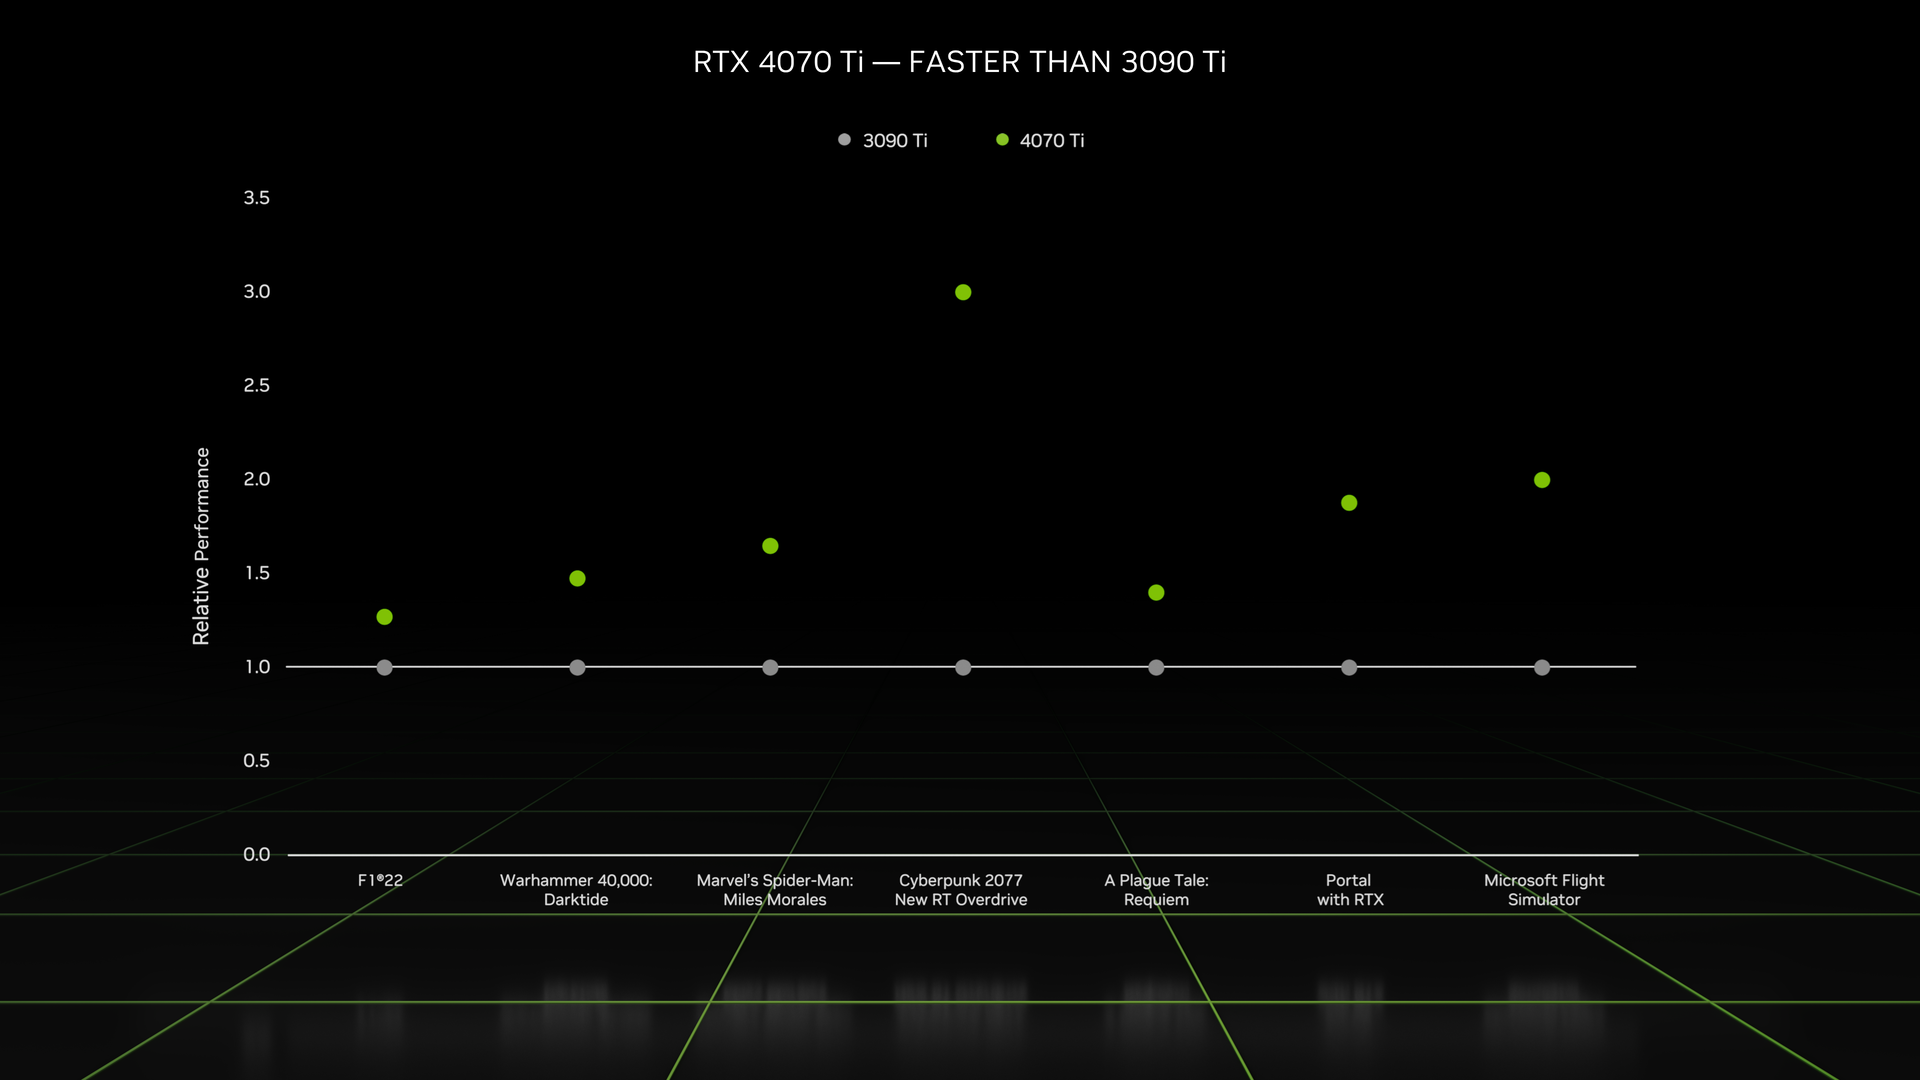
In classic Nvidia style, the RTX 4070 Ti has managed to court some controversy of its own as well. During its reveal, Nvidia said that the RTX 4070 Ti can be up to 3x faster than an RTX 3090 Ti.
While we do see the RTX 4070 Ti being on par or even overtaking the RTX 3090 Ti by a whisker, it is nowhere close to being 3x faster. That might be possible in special test conditions with DLSS, but we don't know the basis for the company's claims.
Nvidia is not offering a Founders Edition card this time around, so potential buyers will have to seek out add-in board (AiB) partner options. While partner cards have their merits over reference designs, the already convoluted market pricing can further complicate purchase decisions as there's a lot of diversity within offerings from the same OEM.
We will look into these aspects as we go on, but for now we have an Asus TUF Gaming GeForce RTX 4070 Ti OC Edition GPU yearning to be put through its paces. This card is listed at US$850 and at ₹101,799 in the Indian market with a three-year local limited warranty.
We were also sent a Gigabyte Aorus GeForce RTX 4070 Ti Master, the review of which will follow shortly.
Comparison of the TUF Gaming RTX 4070 Ti with other Nvidia GPUs
| Specification | RTX 4090 FE | RTX 4080 FE | TUF Gaming RTX 4070 Ti | RTX 3090 Ti FE | RTX 3090 FE | RTX 3080 Ti FE | RTX 3080 FE | RTX 3070 FE | Titan RTX | Titan X Pascal |
| Chip | AD102 | AD103 | AD104 | GA102 | GA102 | GA102 | GA102 | GA104 | TU102 | GP102 |
| FinFET Process | Custom 4N | Custom 4N | Custom 4N | 8 nm | 8 nm | 8 nm | 8 nm | 8 nm | 12 nm | 16 nm |
| CUDA Cores | 16,384 | 9,728 | 7,680 | 10,752 | 10,496 | 10,240 | 8,704 | 5,888 | 4,608 | 3,584 |
| Texture Units | 512 | 304 | 240 | 336 | 328 | 320 | 272 | 184 | 288 | 224 |
| Tensor Cores | 512 4th Gen. | 304 4th Gen. | 240 4th Gen. | 336 3rd Gen. | 328 3rd Gen. | 320 3rd Gen. | 272 3rd Gen. | 184 3rd Gen. | 576 2nd Gen. | — |
| RT Cores | 128 3rd Gen. | 76 3rd Gen. | 60 3rd Gen. | 84 2nd Gen. | 82 2nd Gen. | 80 2nd Gen. | 68 2nd Gen. | 46 2nd Gen. | 72 | — |
| GPU Base Clock | 2,235 MHz | 2,205 MHz | 2,310 MHz | 1,560 MHz | 1,395 MHz | 1,365 MHz | 1,440 MHz | 1,500 MHz | 1,350 MHz | 1,417 MHz |
| GPU Boost Clock | 2,520 MHz | 2,505 MHz | 2,760 MHz | 1,860 MHz | 1,695 MHz | 1,665 MHz | 1,710 MHz | 1,750 MHz | 1,770 MHz | 1,531 MHz |
| Memory Bus | 384-bit | 256-bit | 192-bit | 384-bit | 384-bit | 384-bit | 320-bit | 256-bit | 384-bit | 384-bit |
| Memory Bandwidth | 1,008 GB/s | 716.8 GB/s | 504 GB/s | 1,008 GB/s | 936 GB/s | 912 GB/s | 760 GB/s | 448 GB/s | 672 GB/s | 480.4 GB/s |
| Video Memory | 24 GB GDDR6X | 16 GB GDDR6X | 12 GB GDDR6X | 24 GB GDDR6X | 24 GB GDDR6X | 12 GB GDDR6X | 10 GB GDDR6X | 8 GB GDDR6 | 24 GB GDDR6 | 12 GB GDDR5X |
| Power Consumption | 450 W | 320 W | 285 W | 450 W | 350 W | 350 W | 320 W | 220 W | 280 W | 250 W |
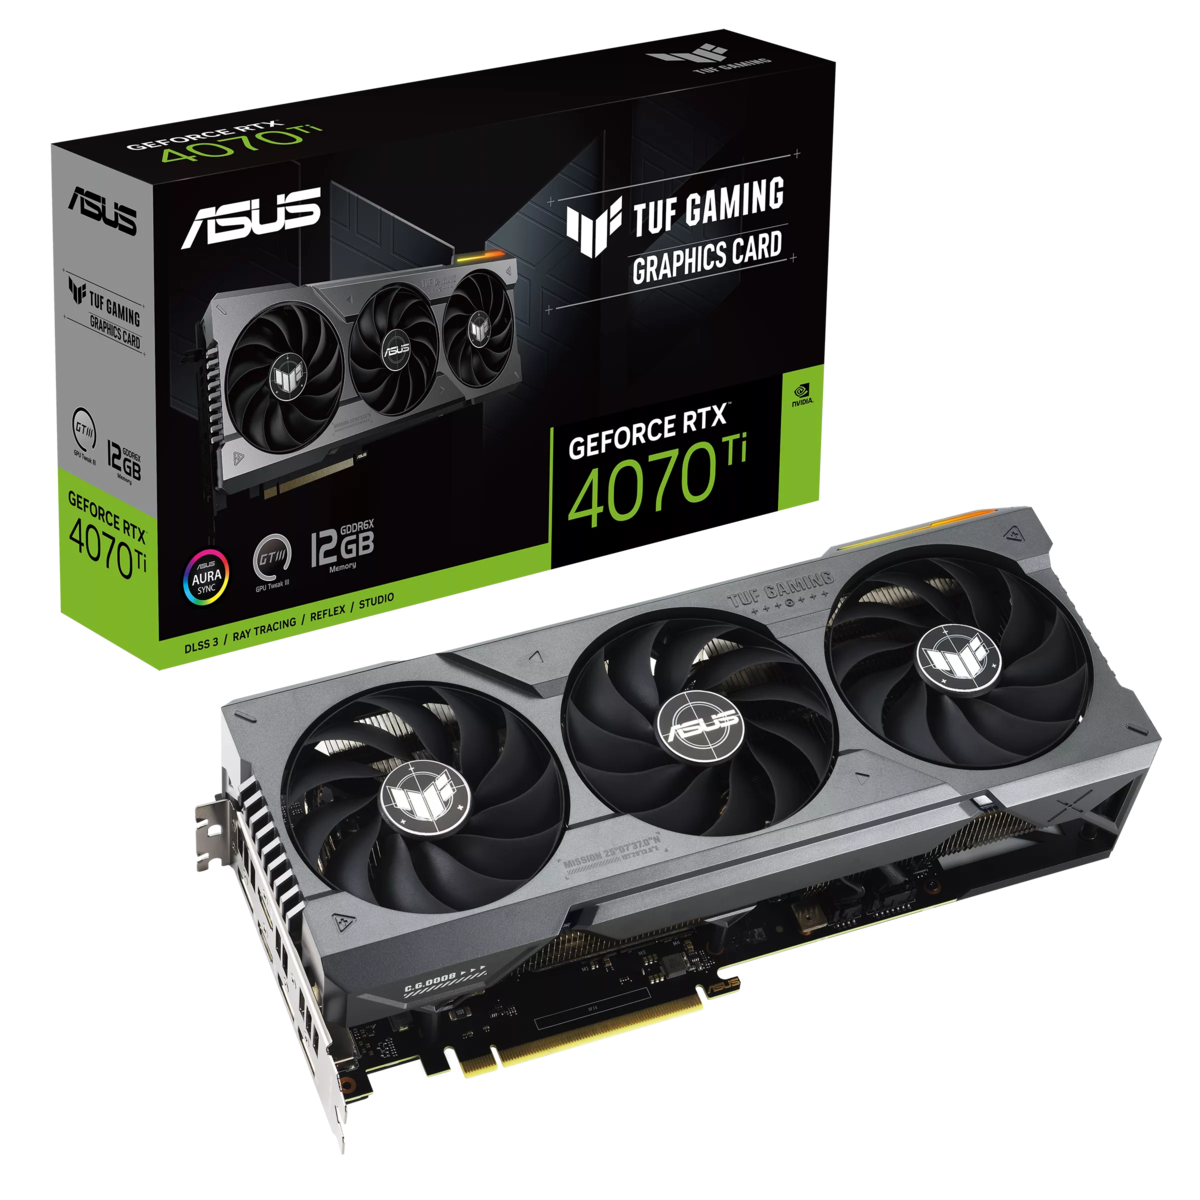
A closer look at the Asus TUF Gaming RTX 4070 Ti OC Edition
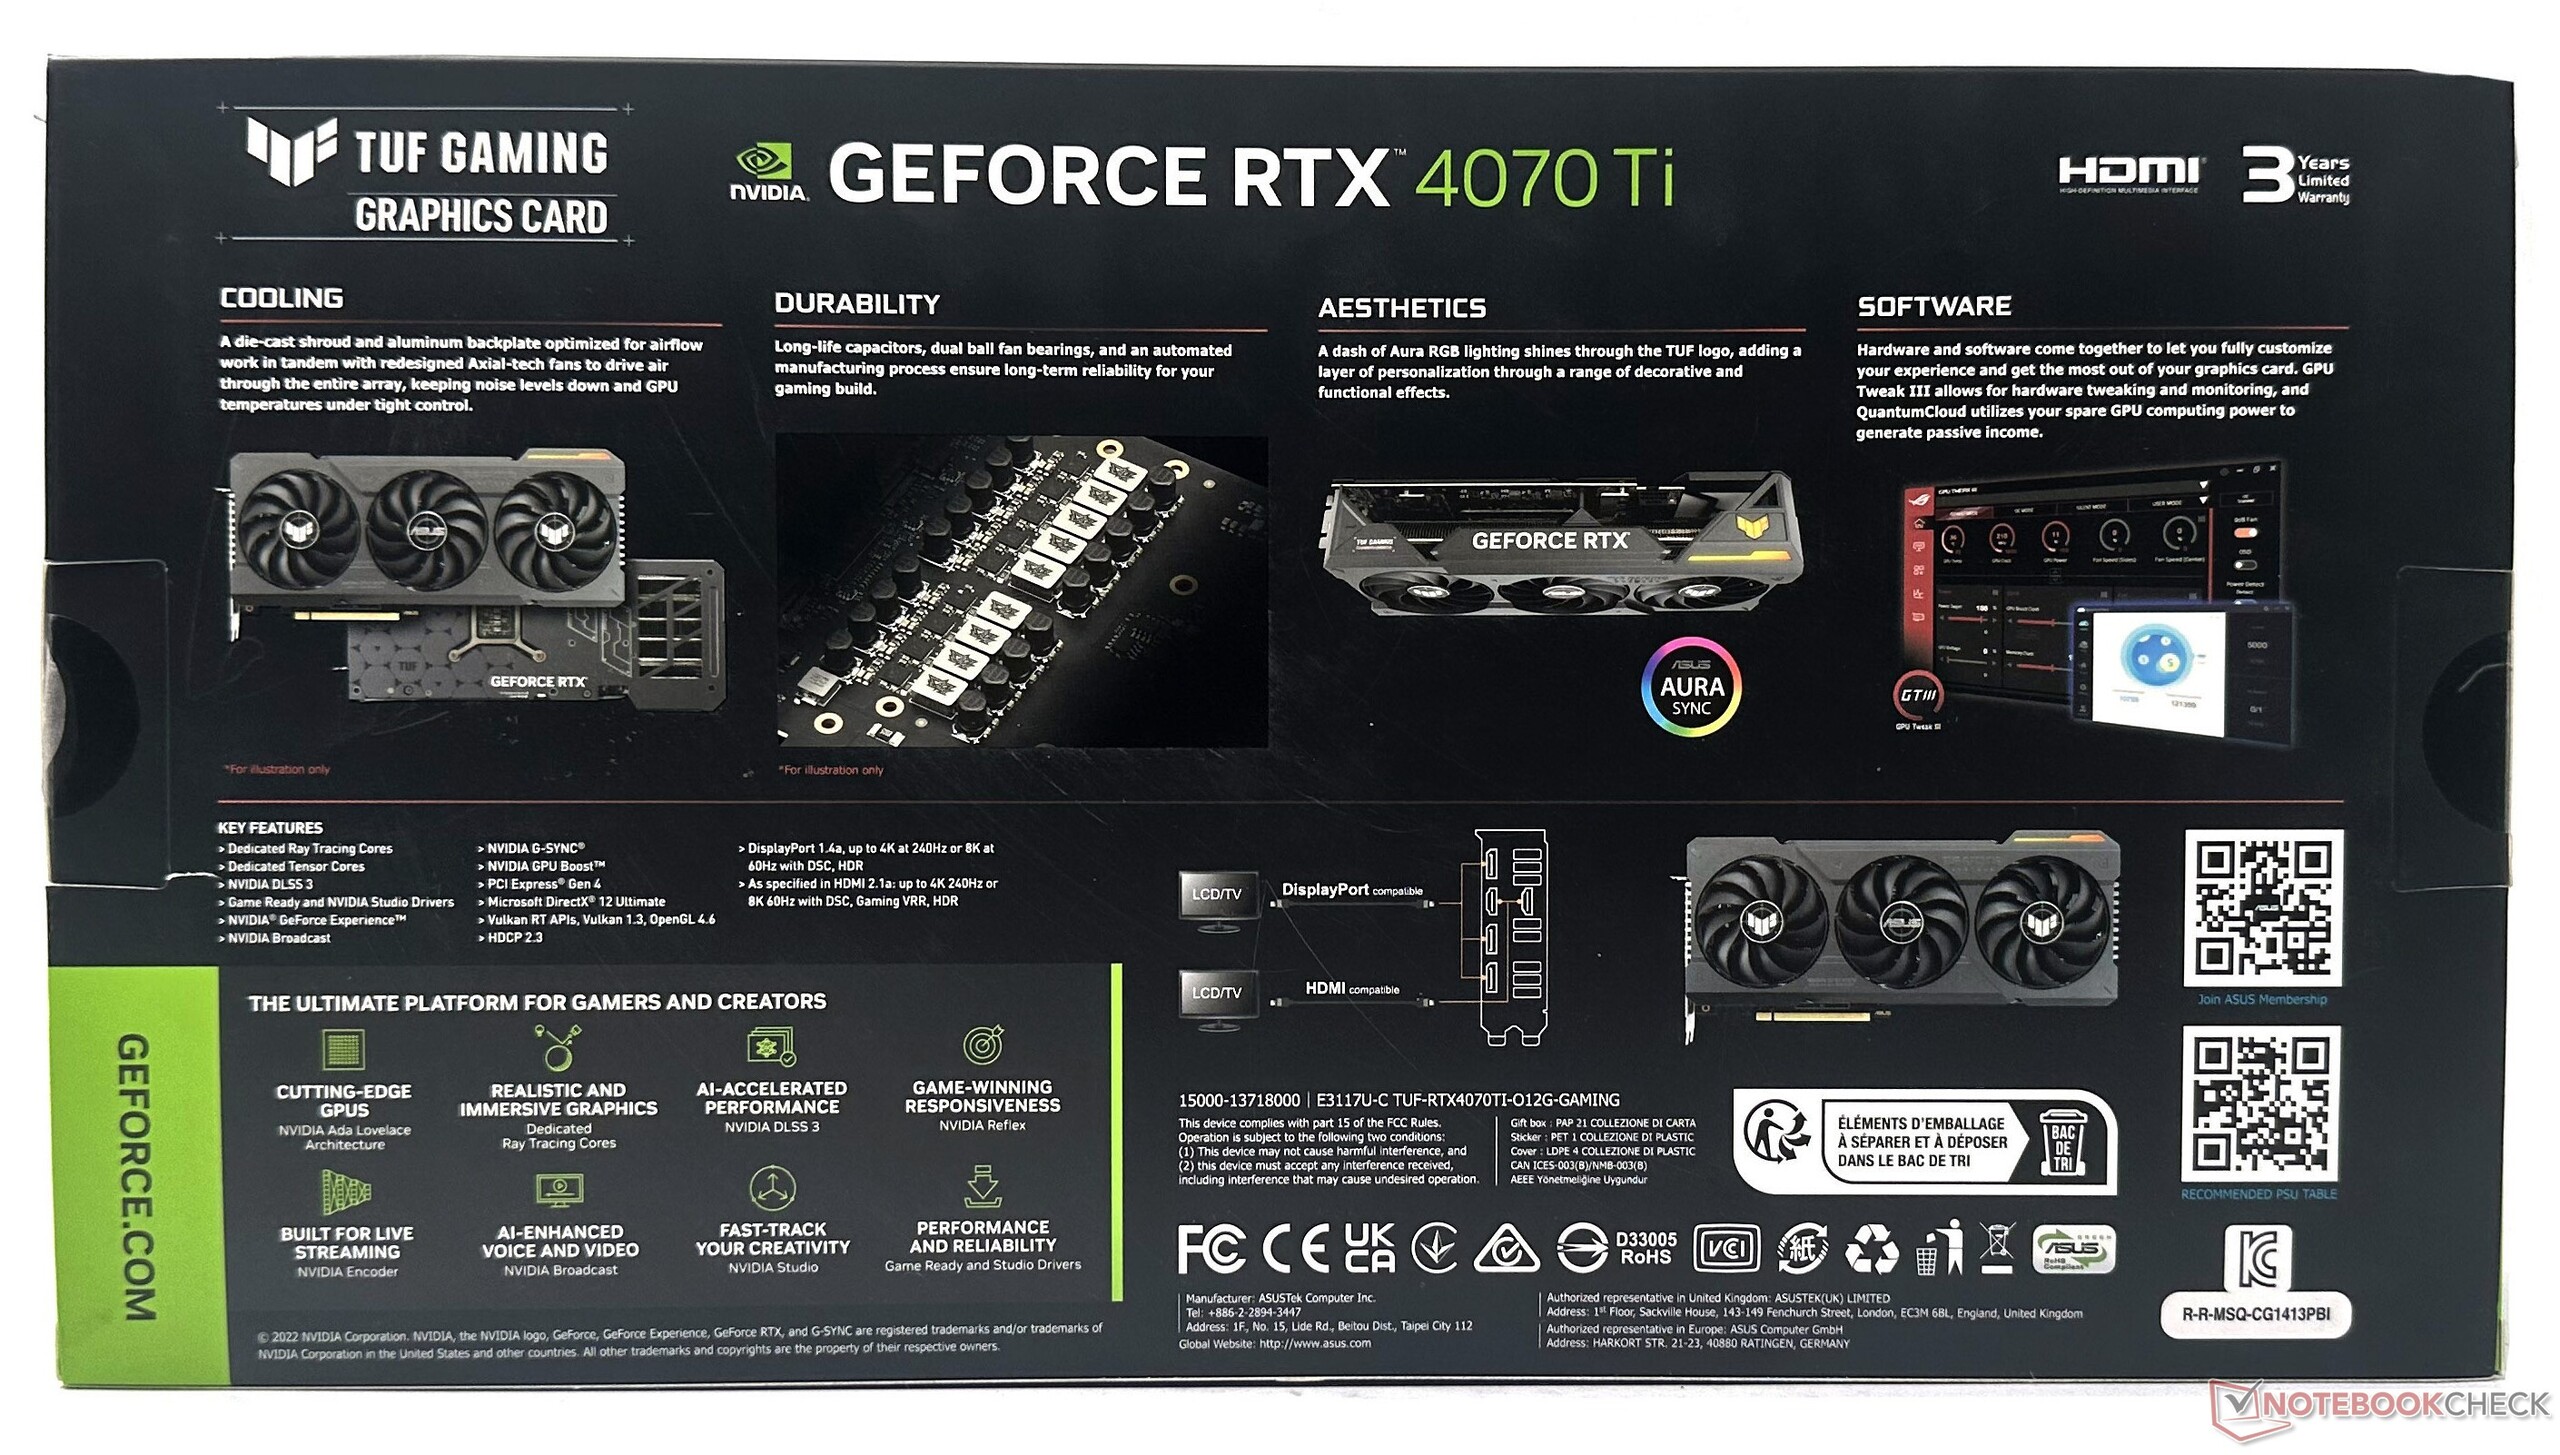
Asus's TUF lineup is known for offering long-lasting hardware that meets stringent durability requirements, and the TUF Gaming RTX 4070 Ti OC Edition is no different.
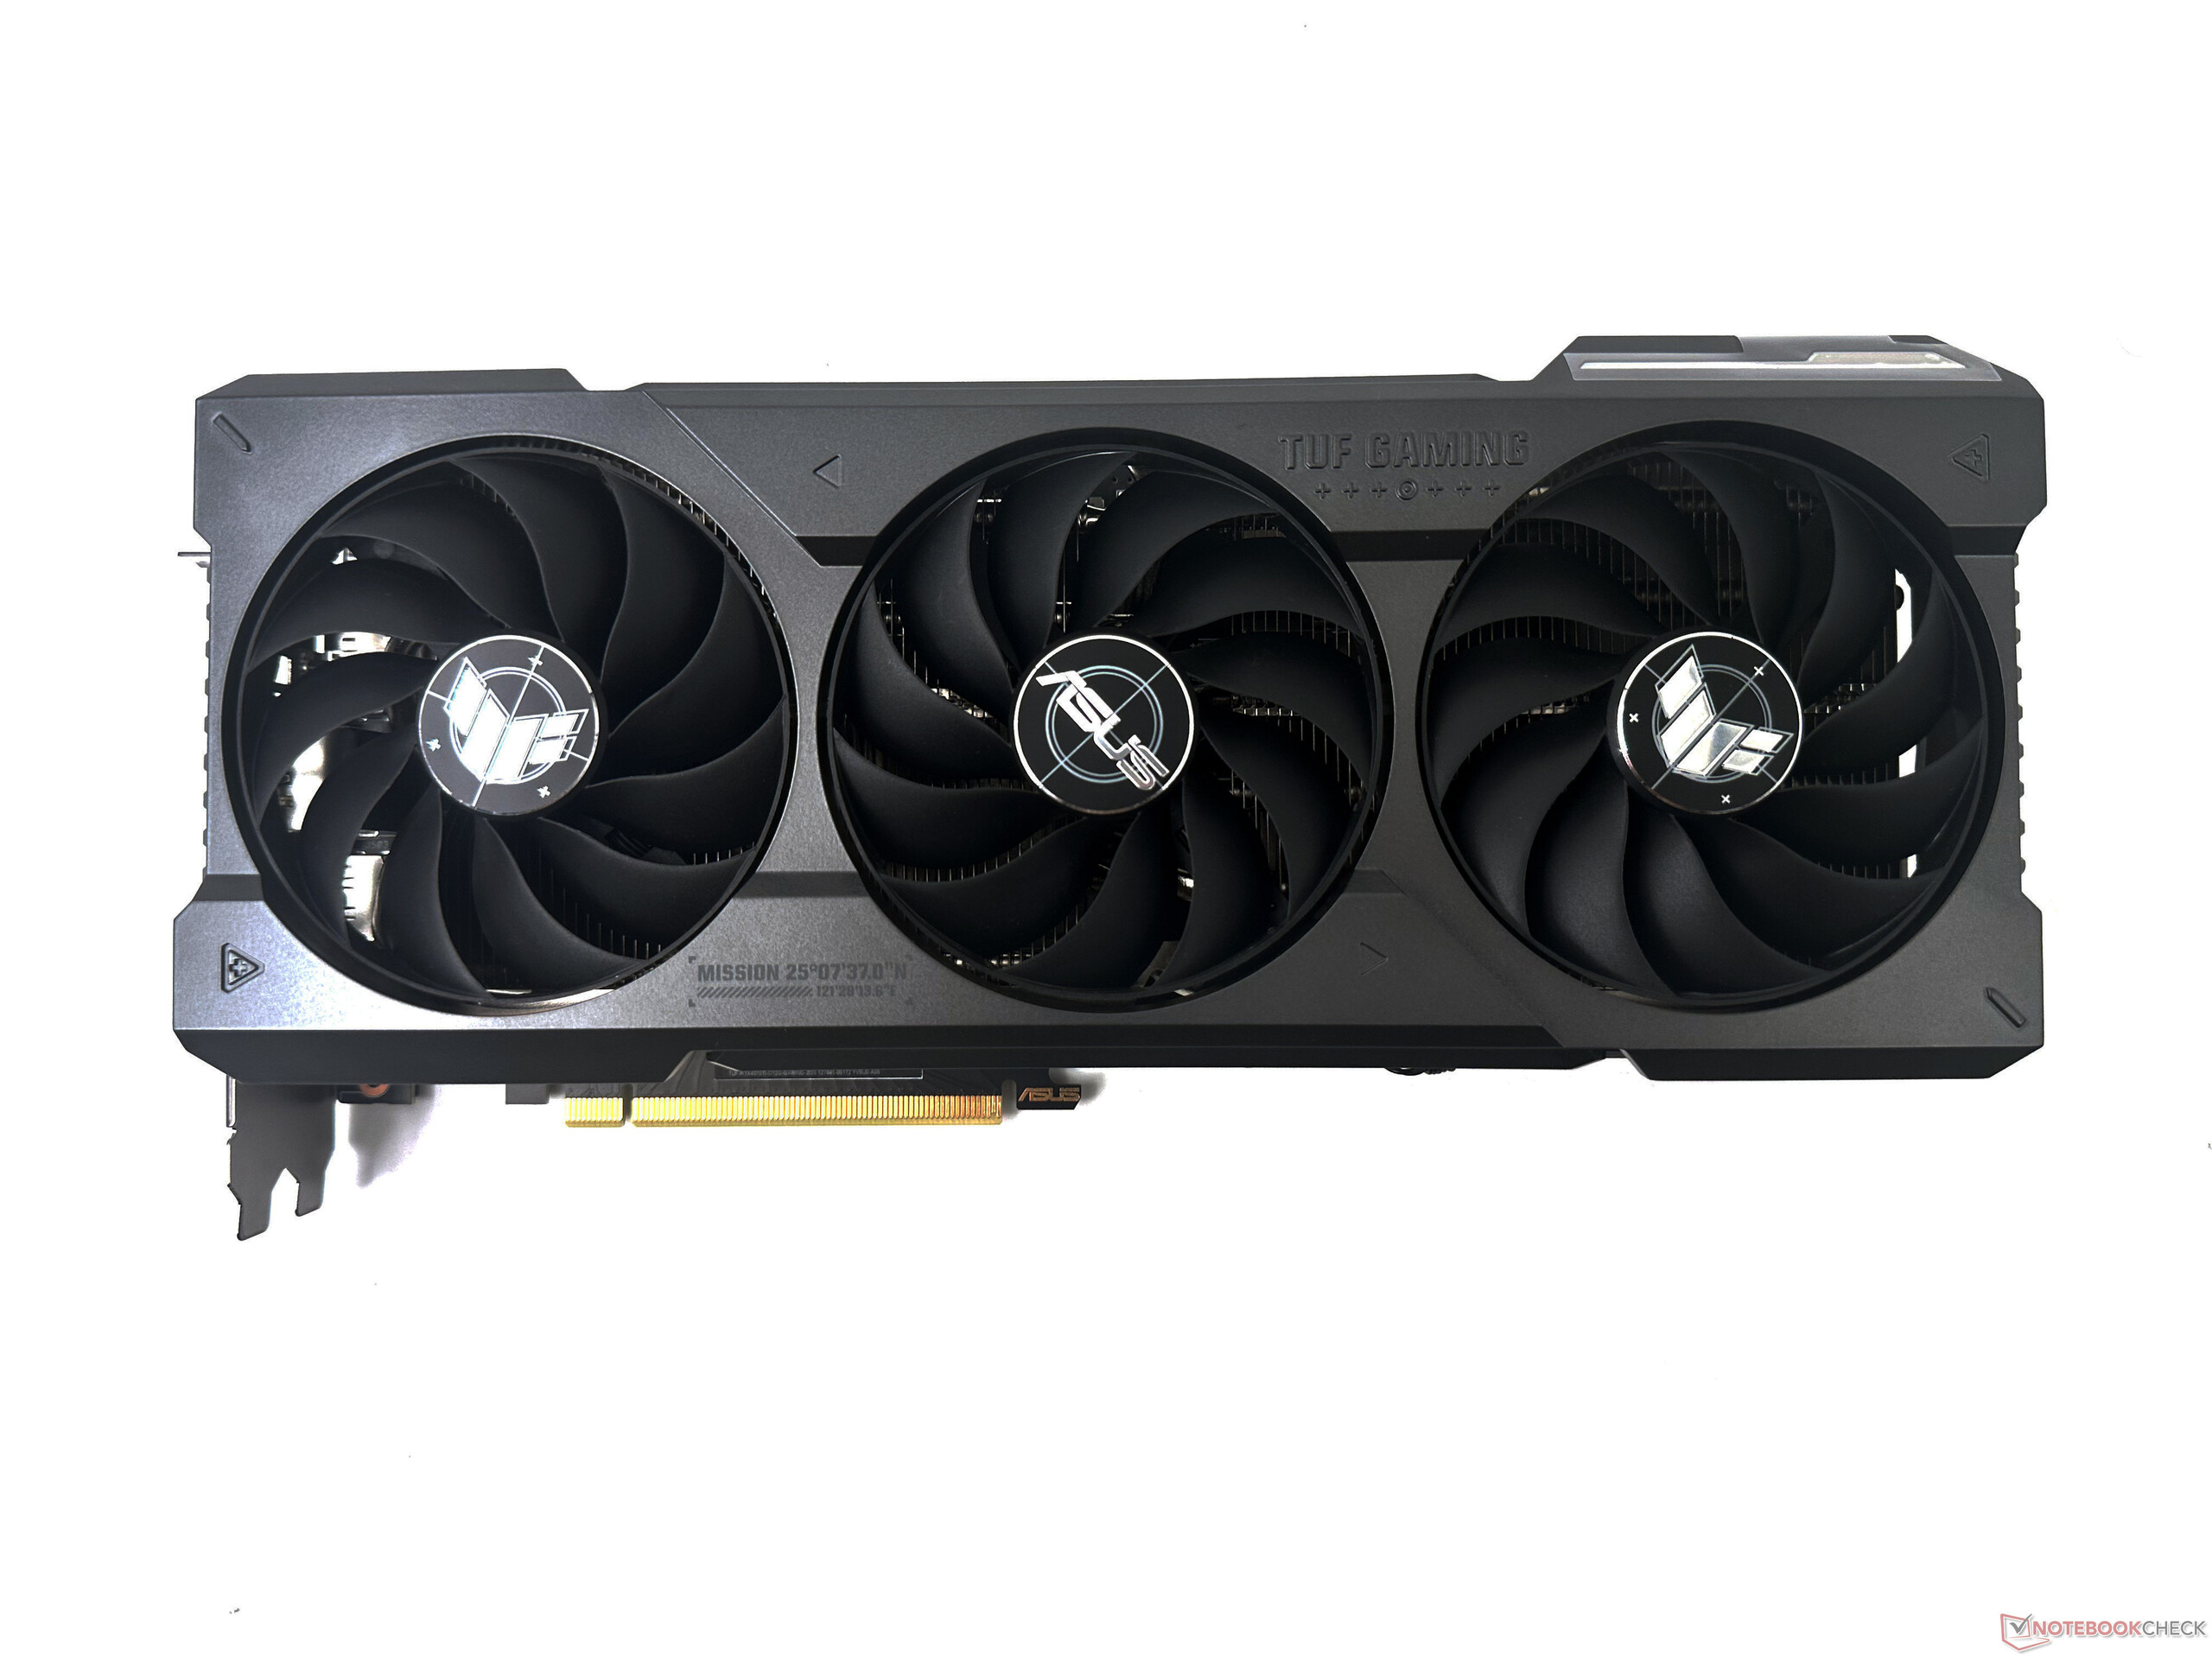
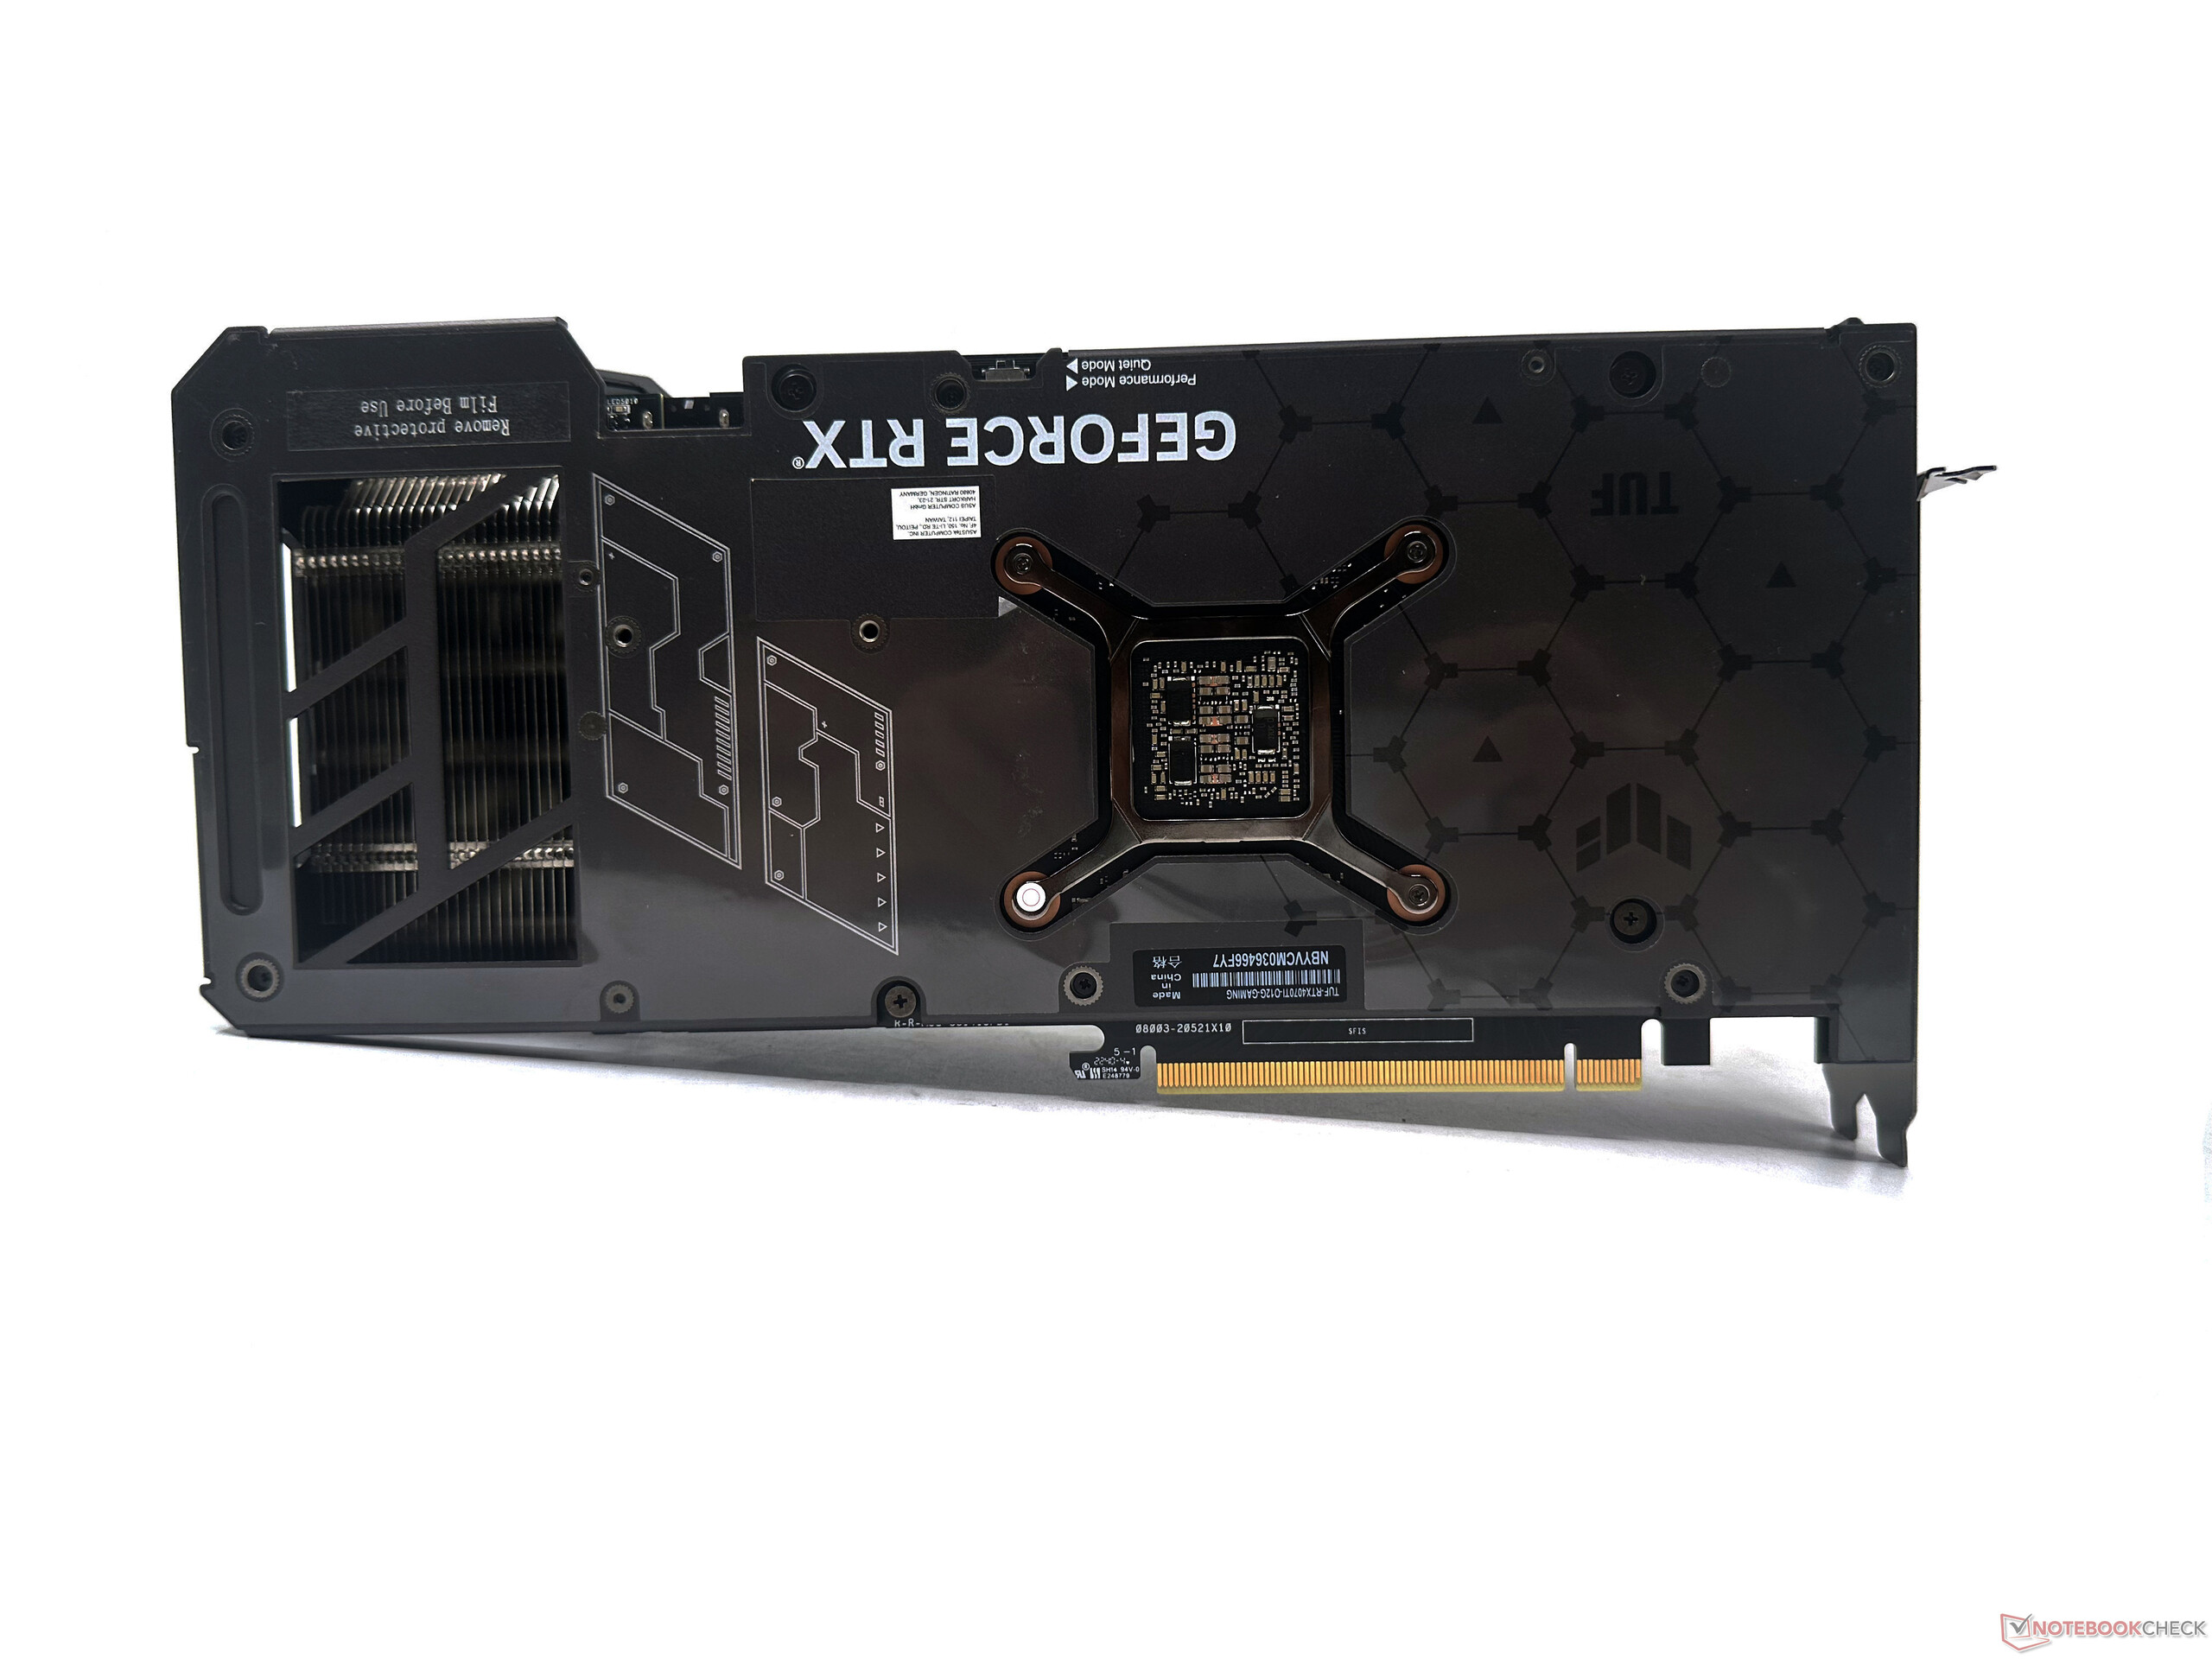
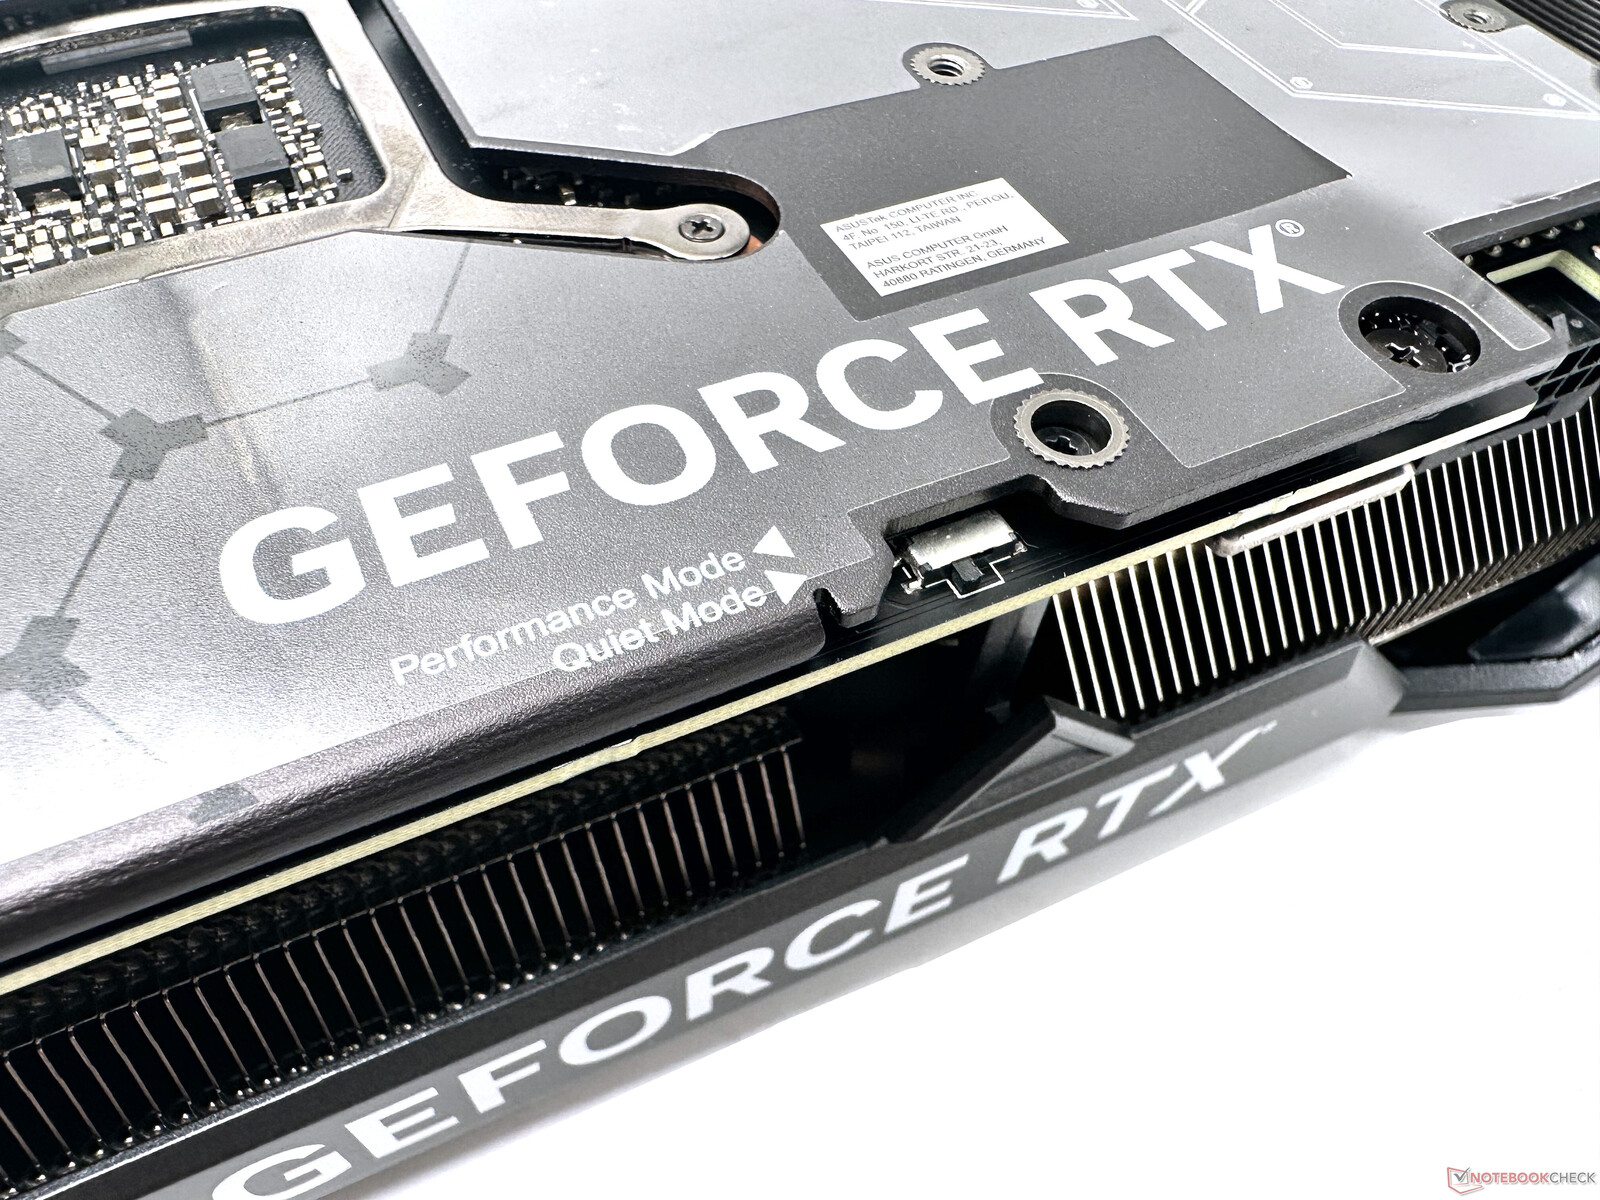
According to Asus, the TUF Gaming RTX 4070 Ti OC Edition features military-grade capacitors that have been rated for 20,000 hours at 105 °C. Unlike the vast majority of GPUs, the TUF Gaming RTX 4070 Ti sports a metal shroud that is both aesthetically pleasing and functionally effective in proper heat dissipation.
We also get to see a metal backplate that feels durable and with a cutout for ventilation.
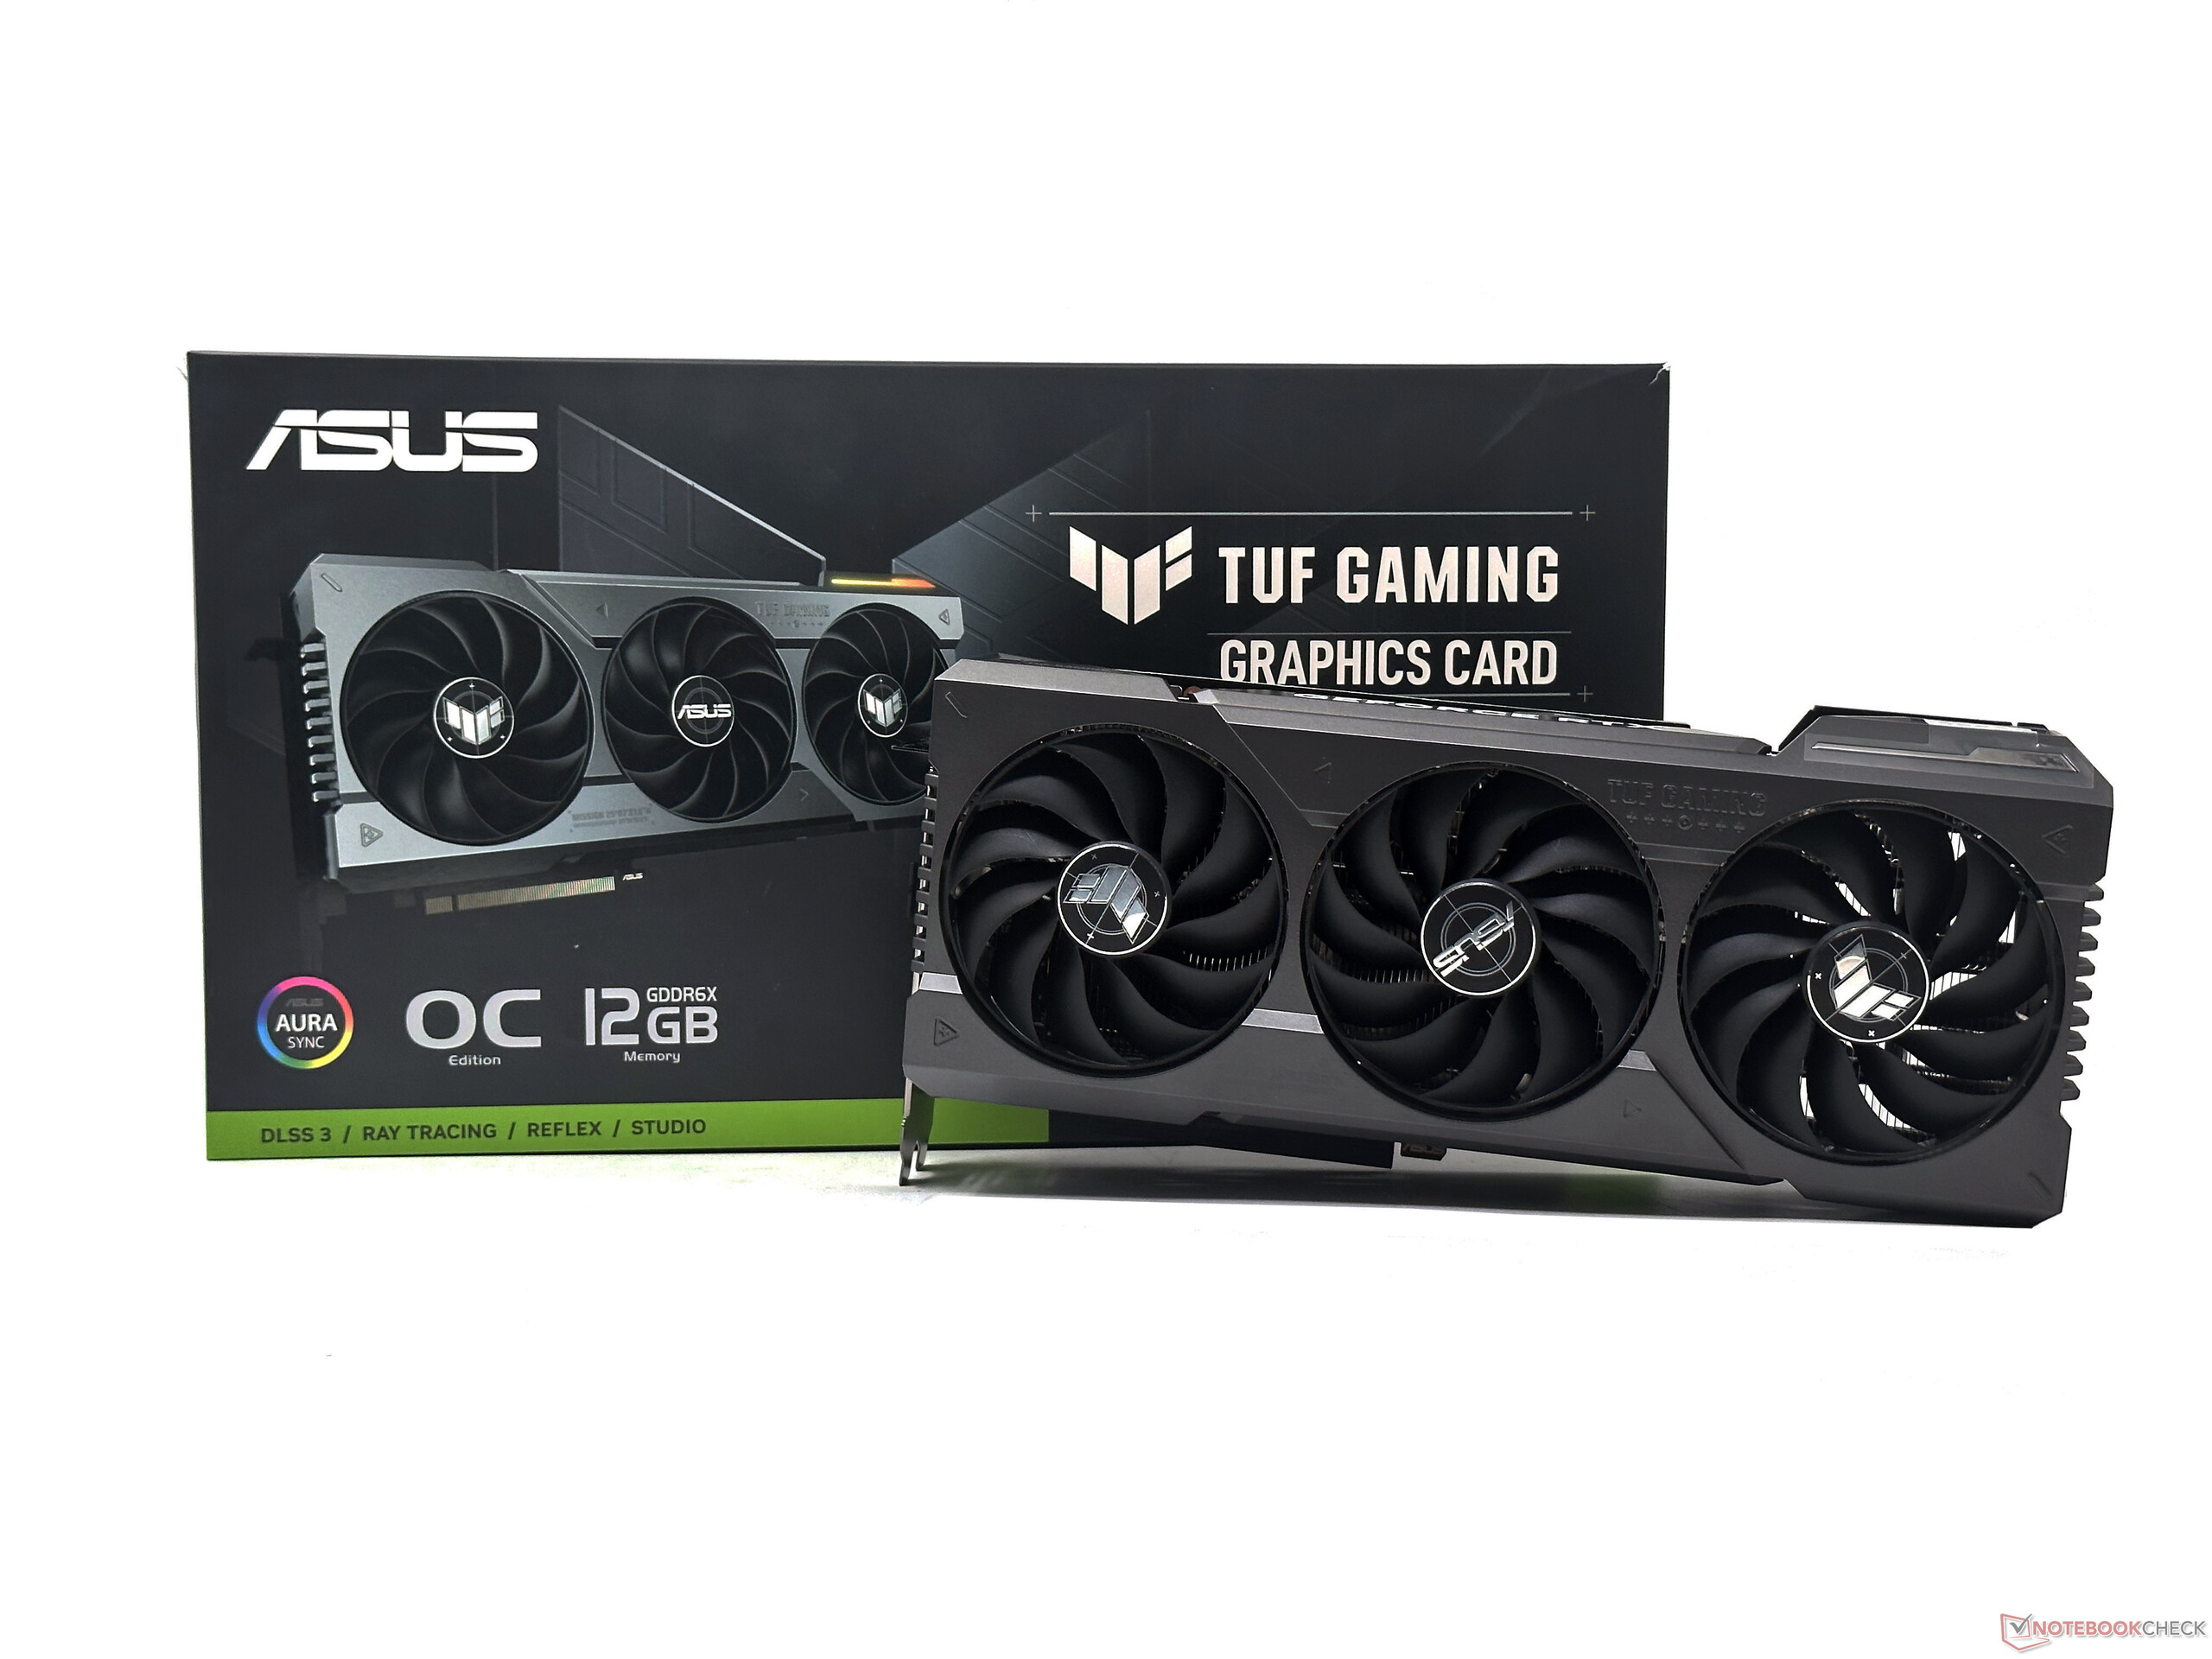
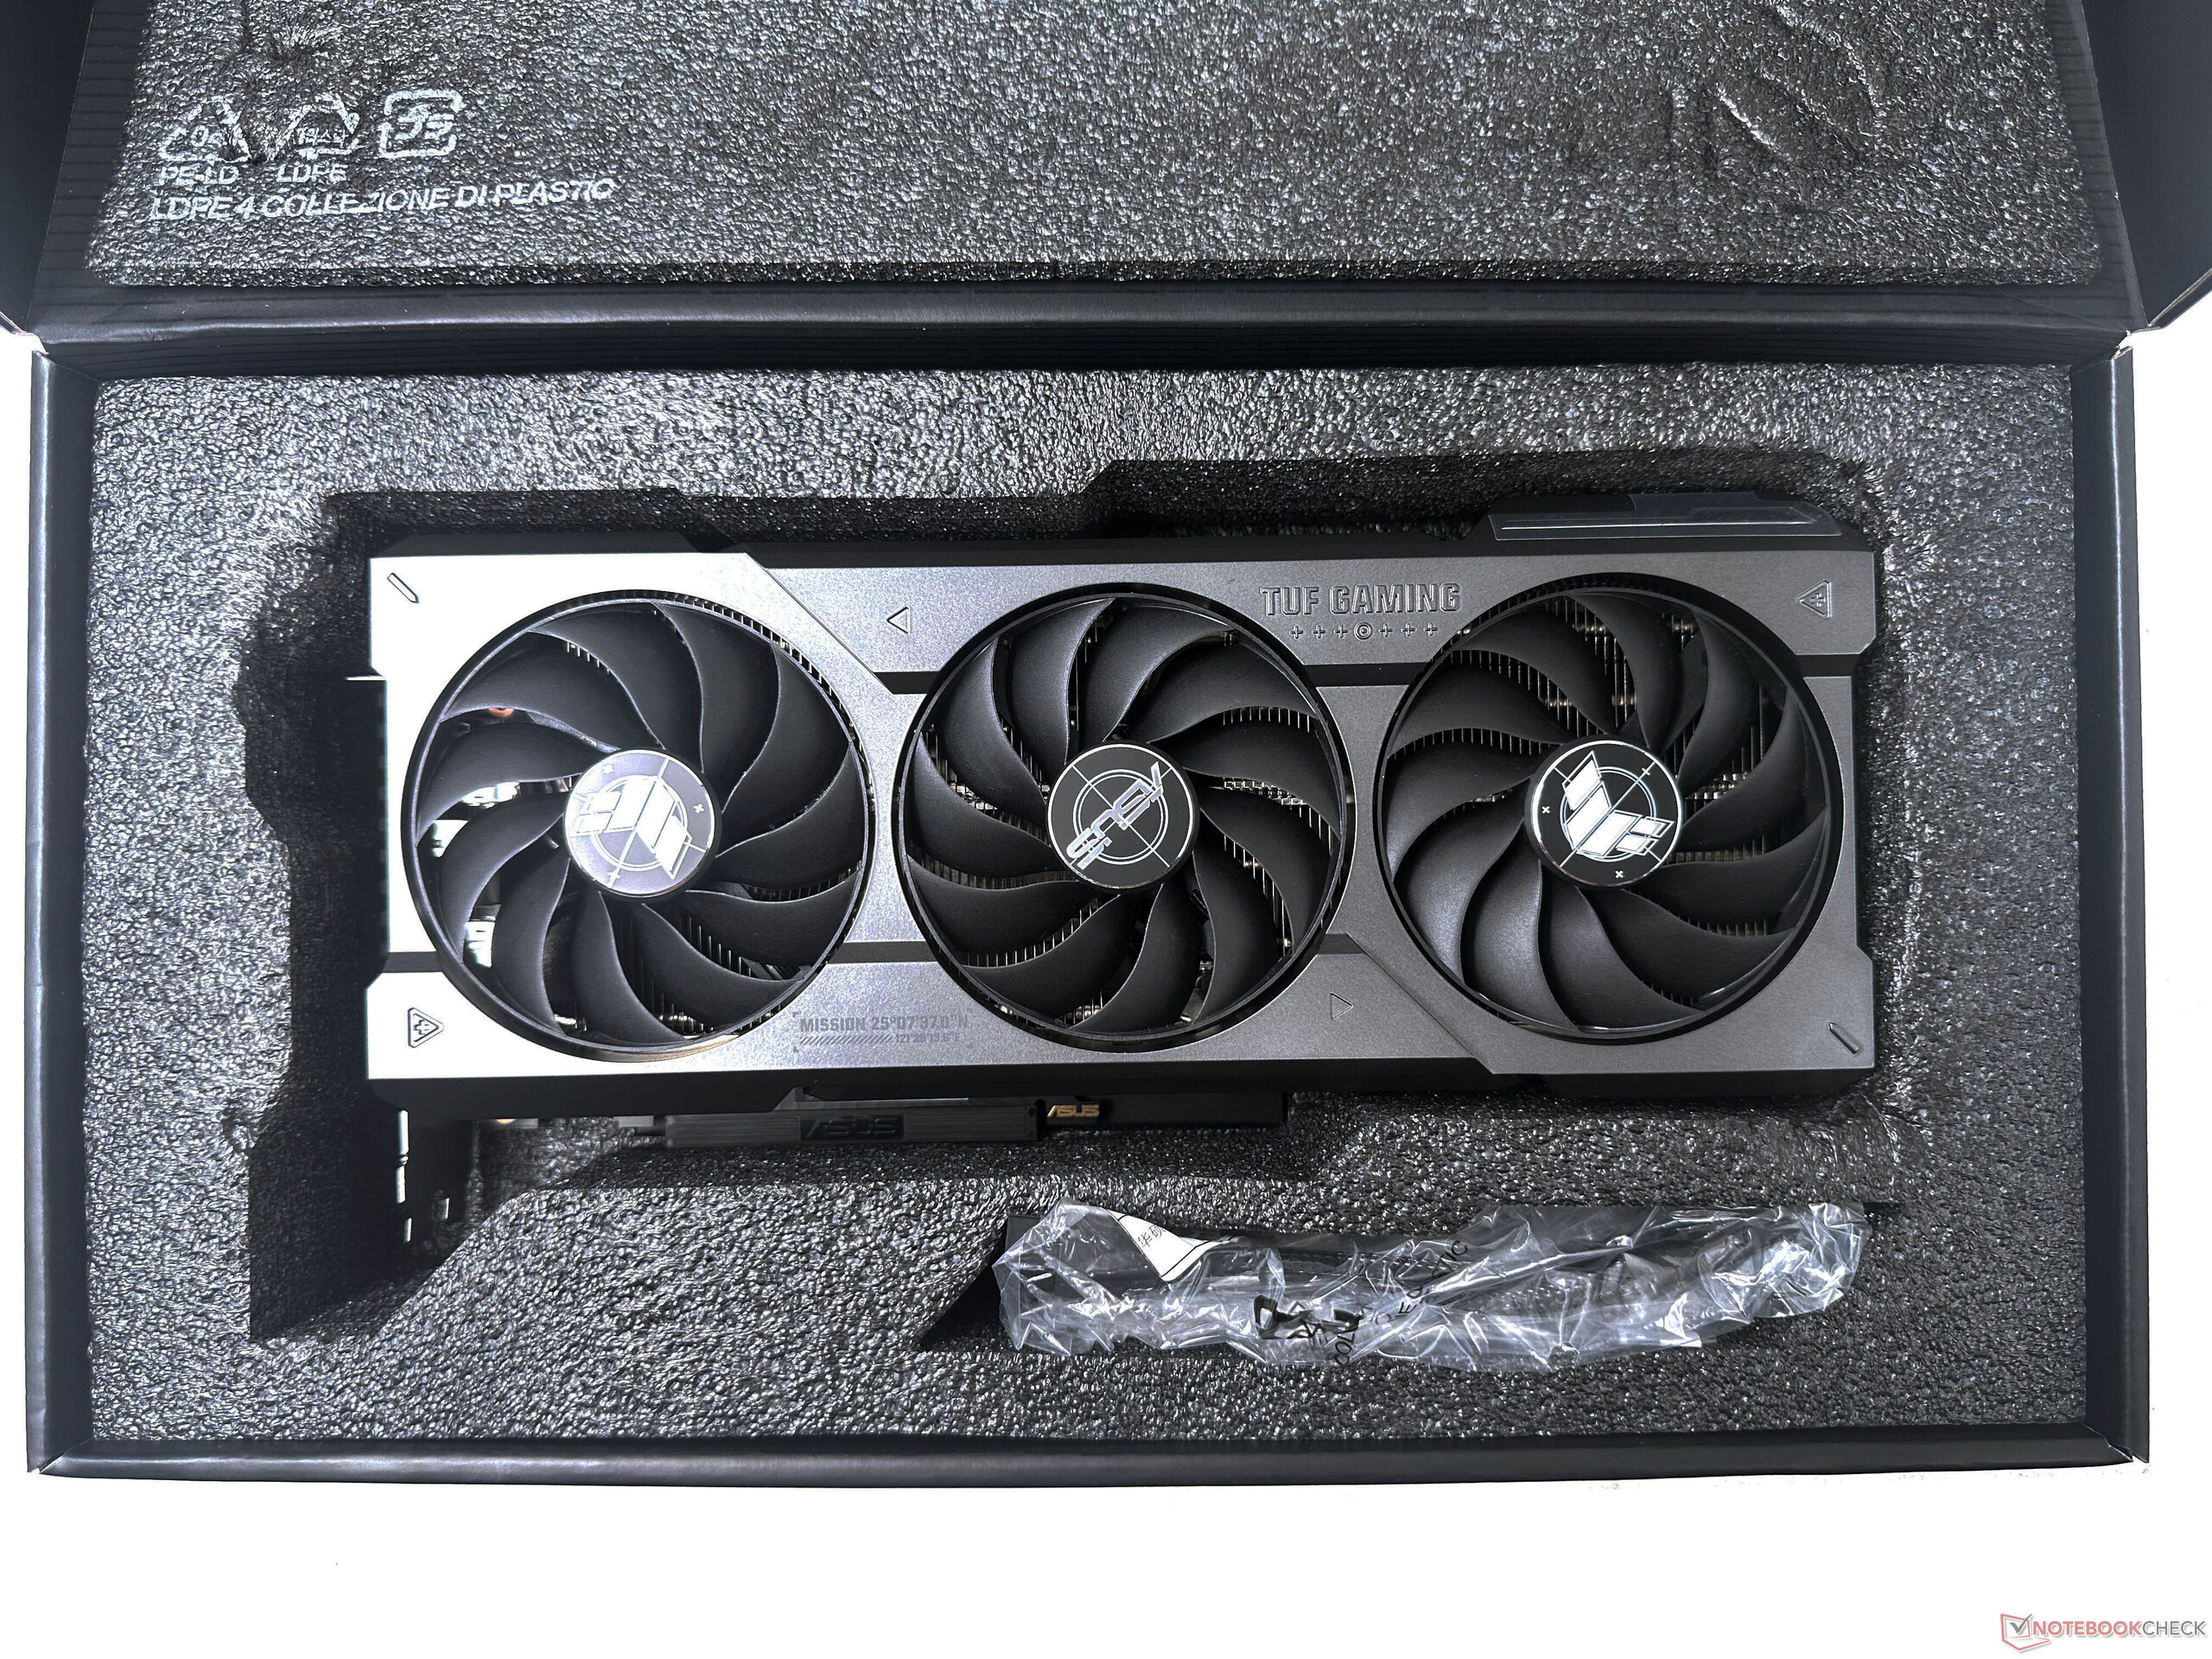
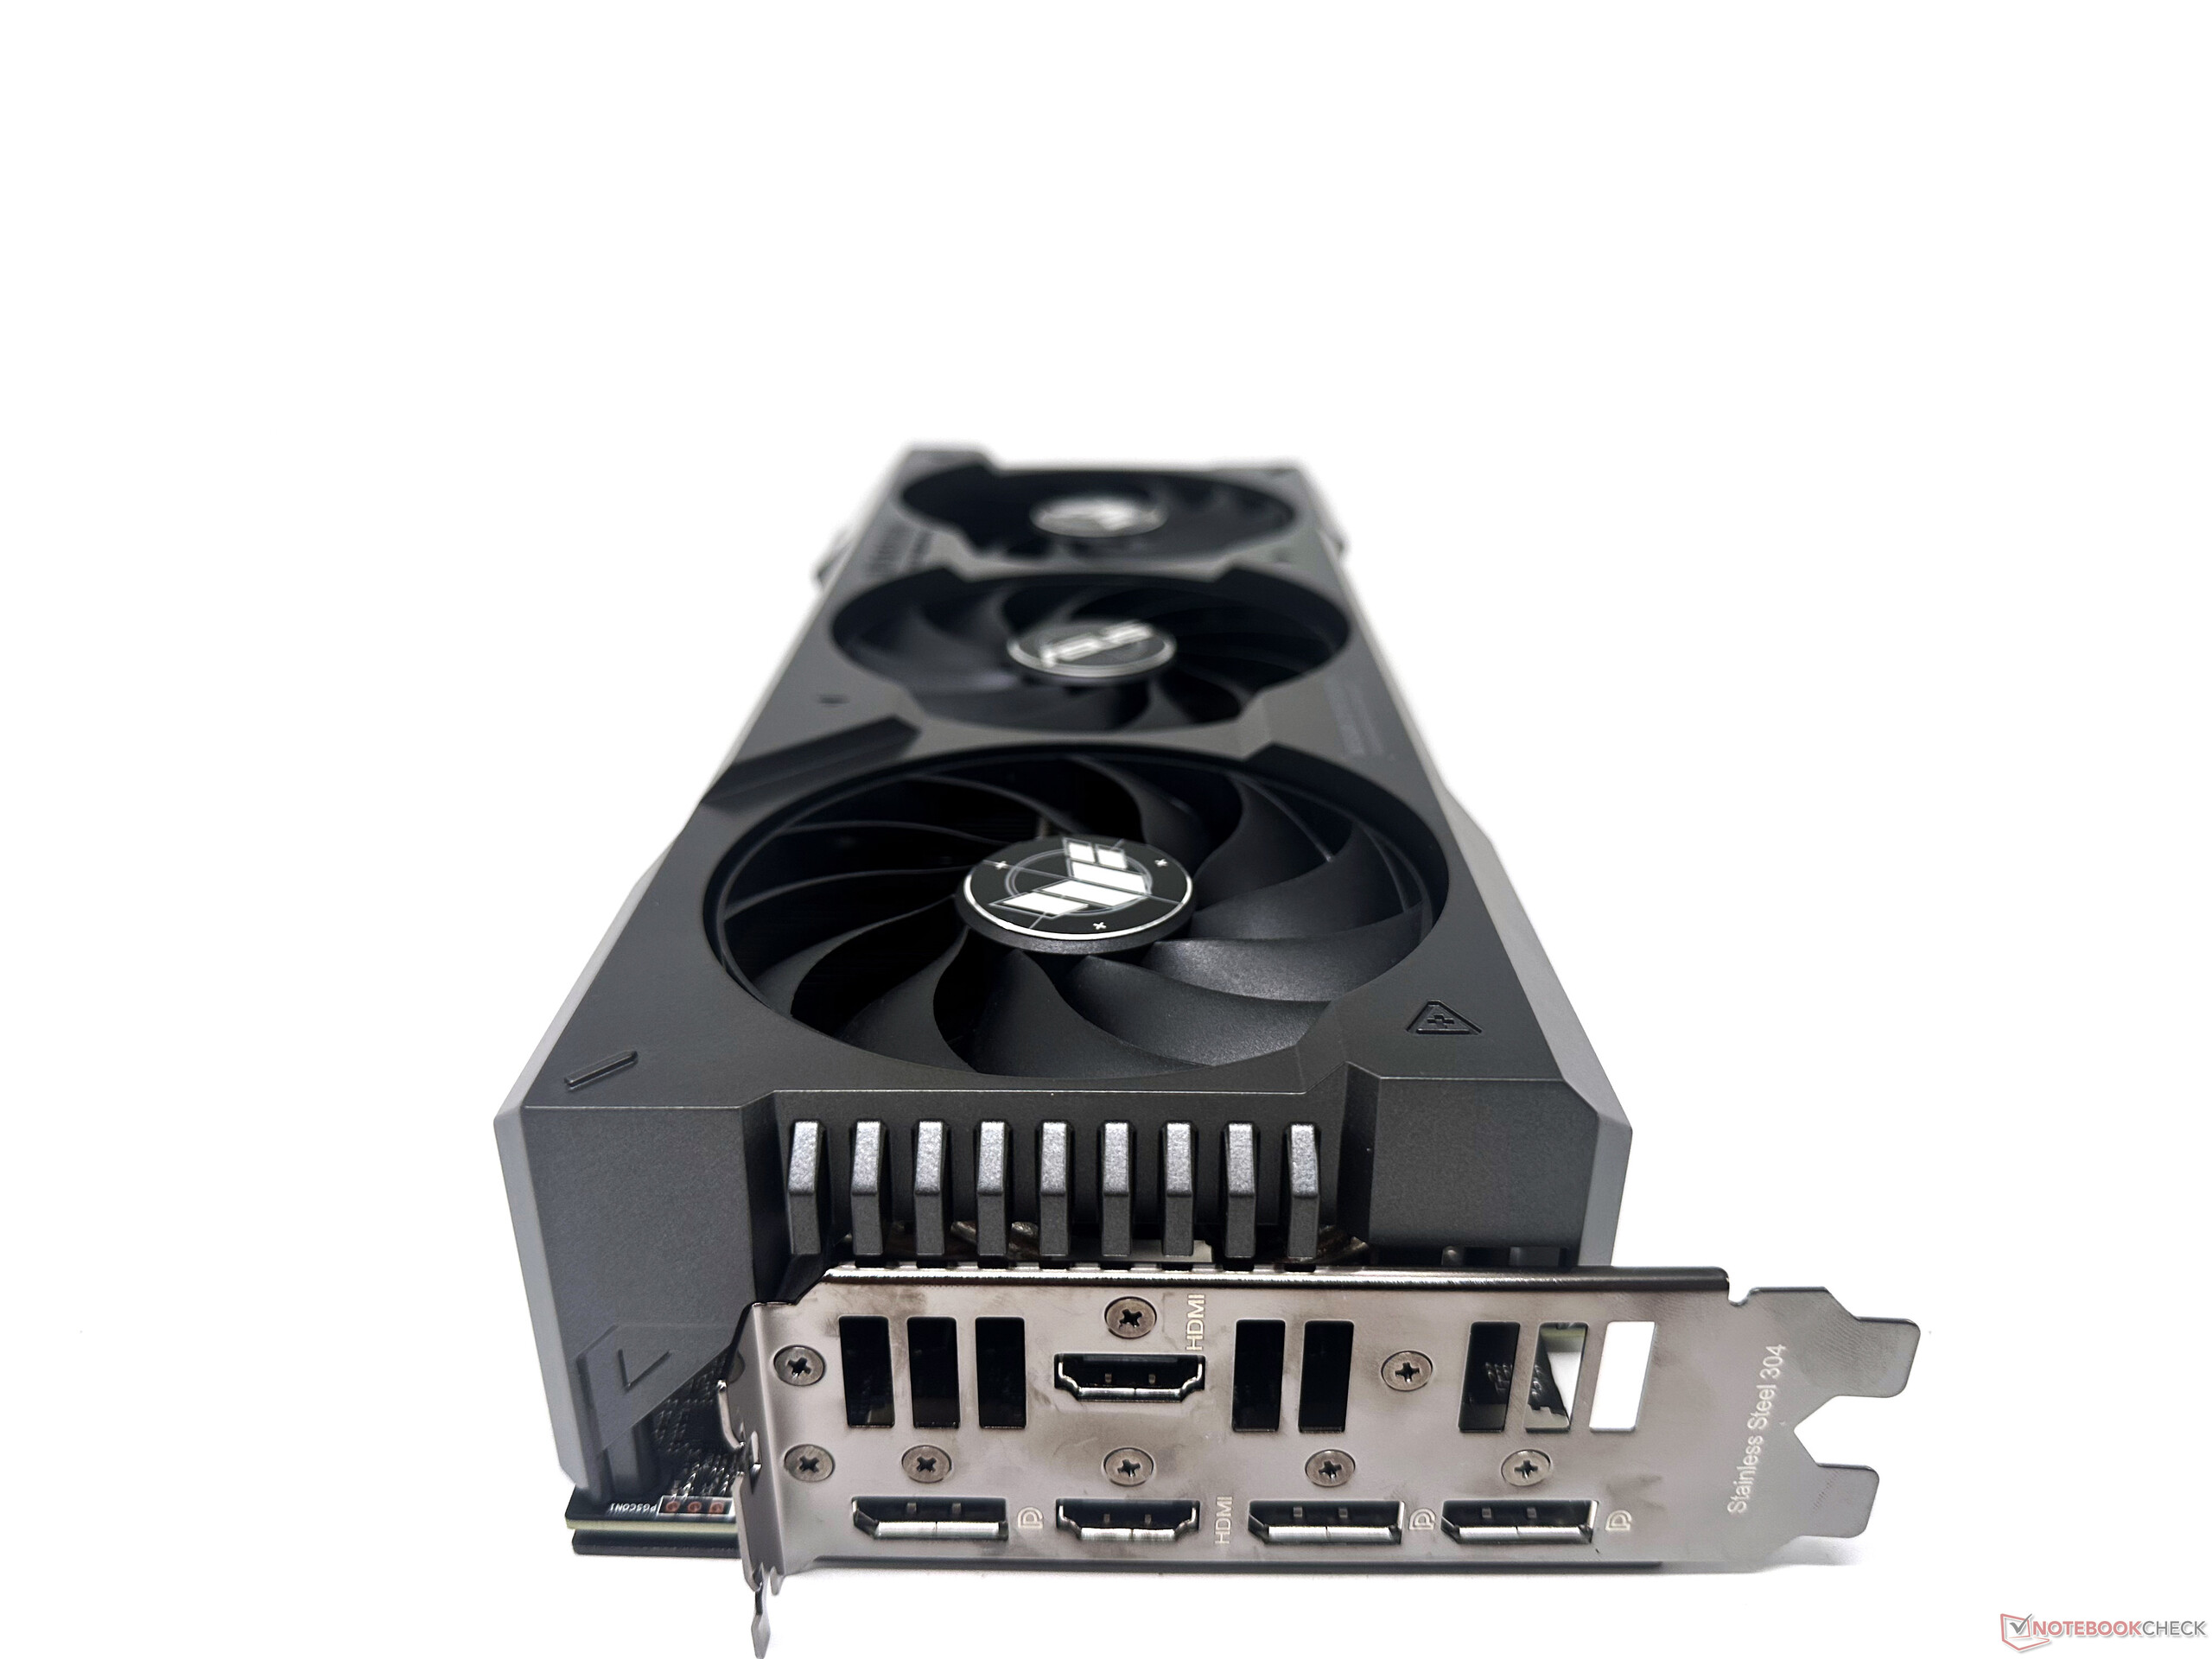
The TUF Gaming RTX 4070 Ti OC Edition measures 305 mm x 138 mm x 65 mm and should easily fit into a typical ATX case. The card typically weighs close to 1.4 kg and occupies slightly more than three PCIe slots.
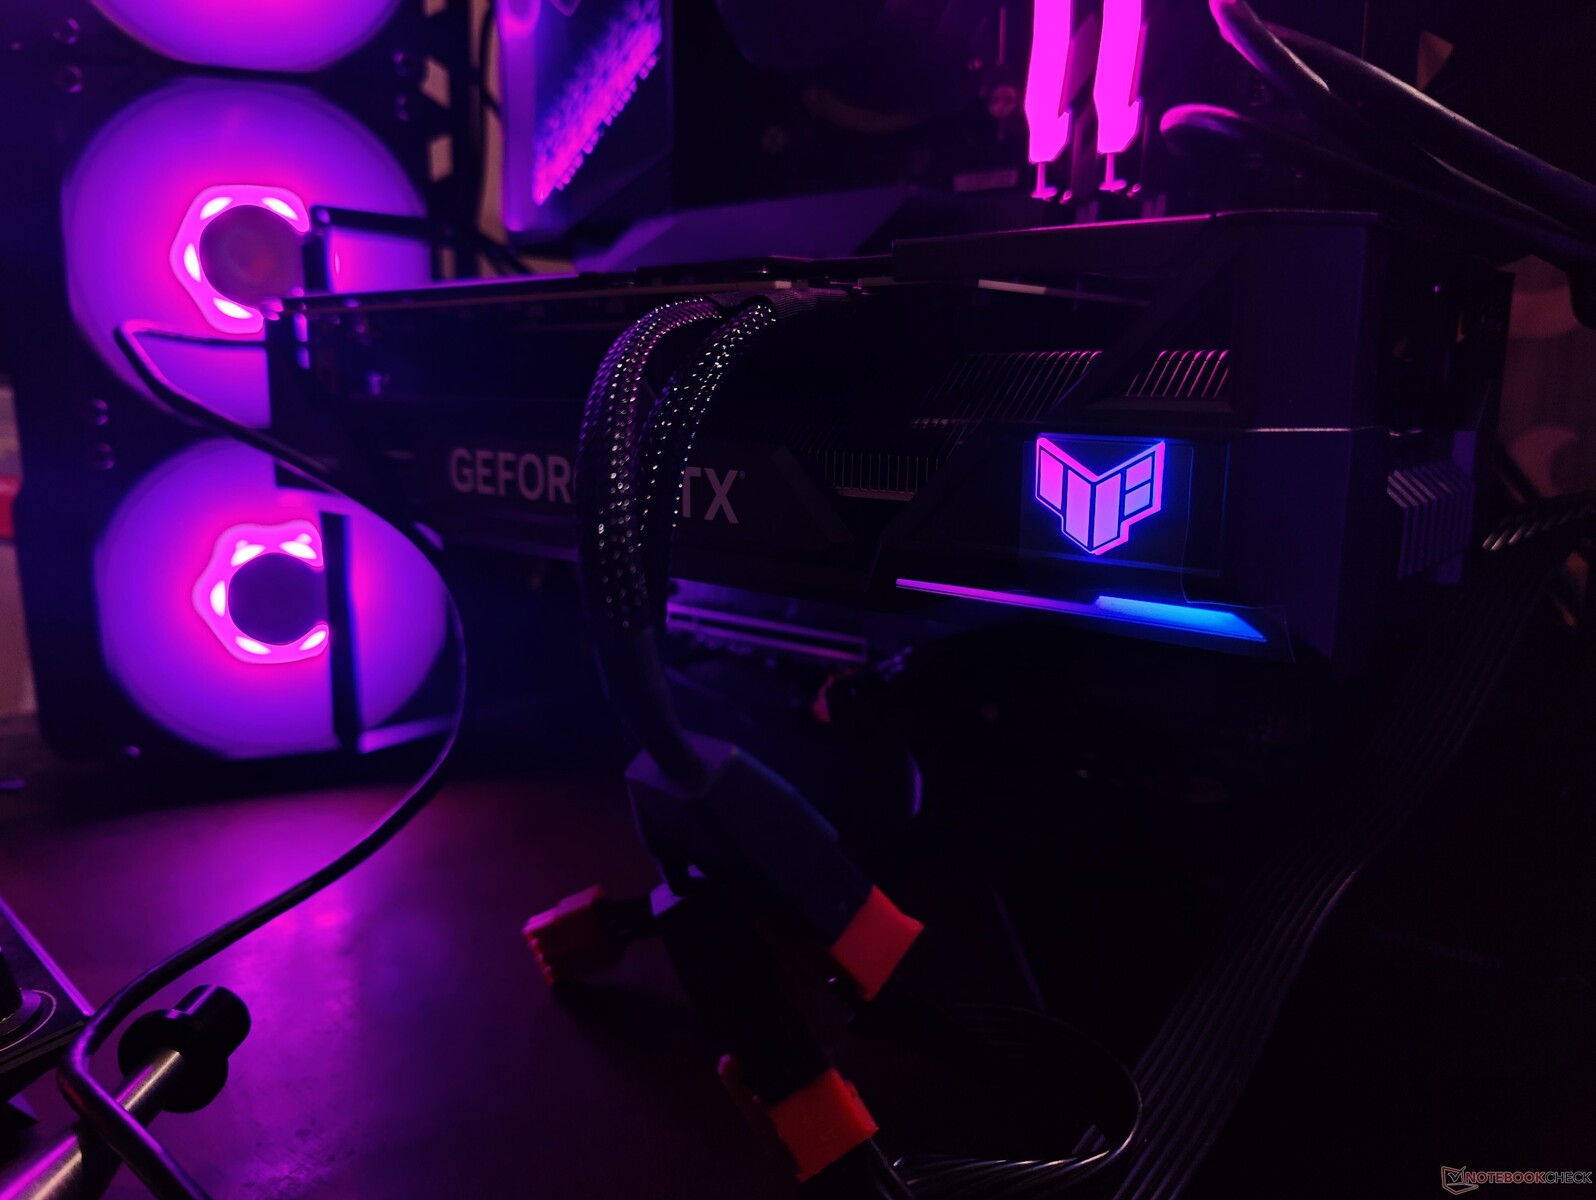
The overall design is minimalist, but Asus does offer RGB effects on the TUF logo and in a light bar beneath the logo.
These effects and other card parameters can be adjusted via Asus's optional GPU Tweak III software. You can also control these effects via any Aura Sync-compatible utility.
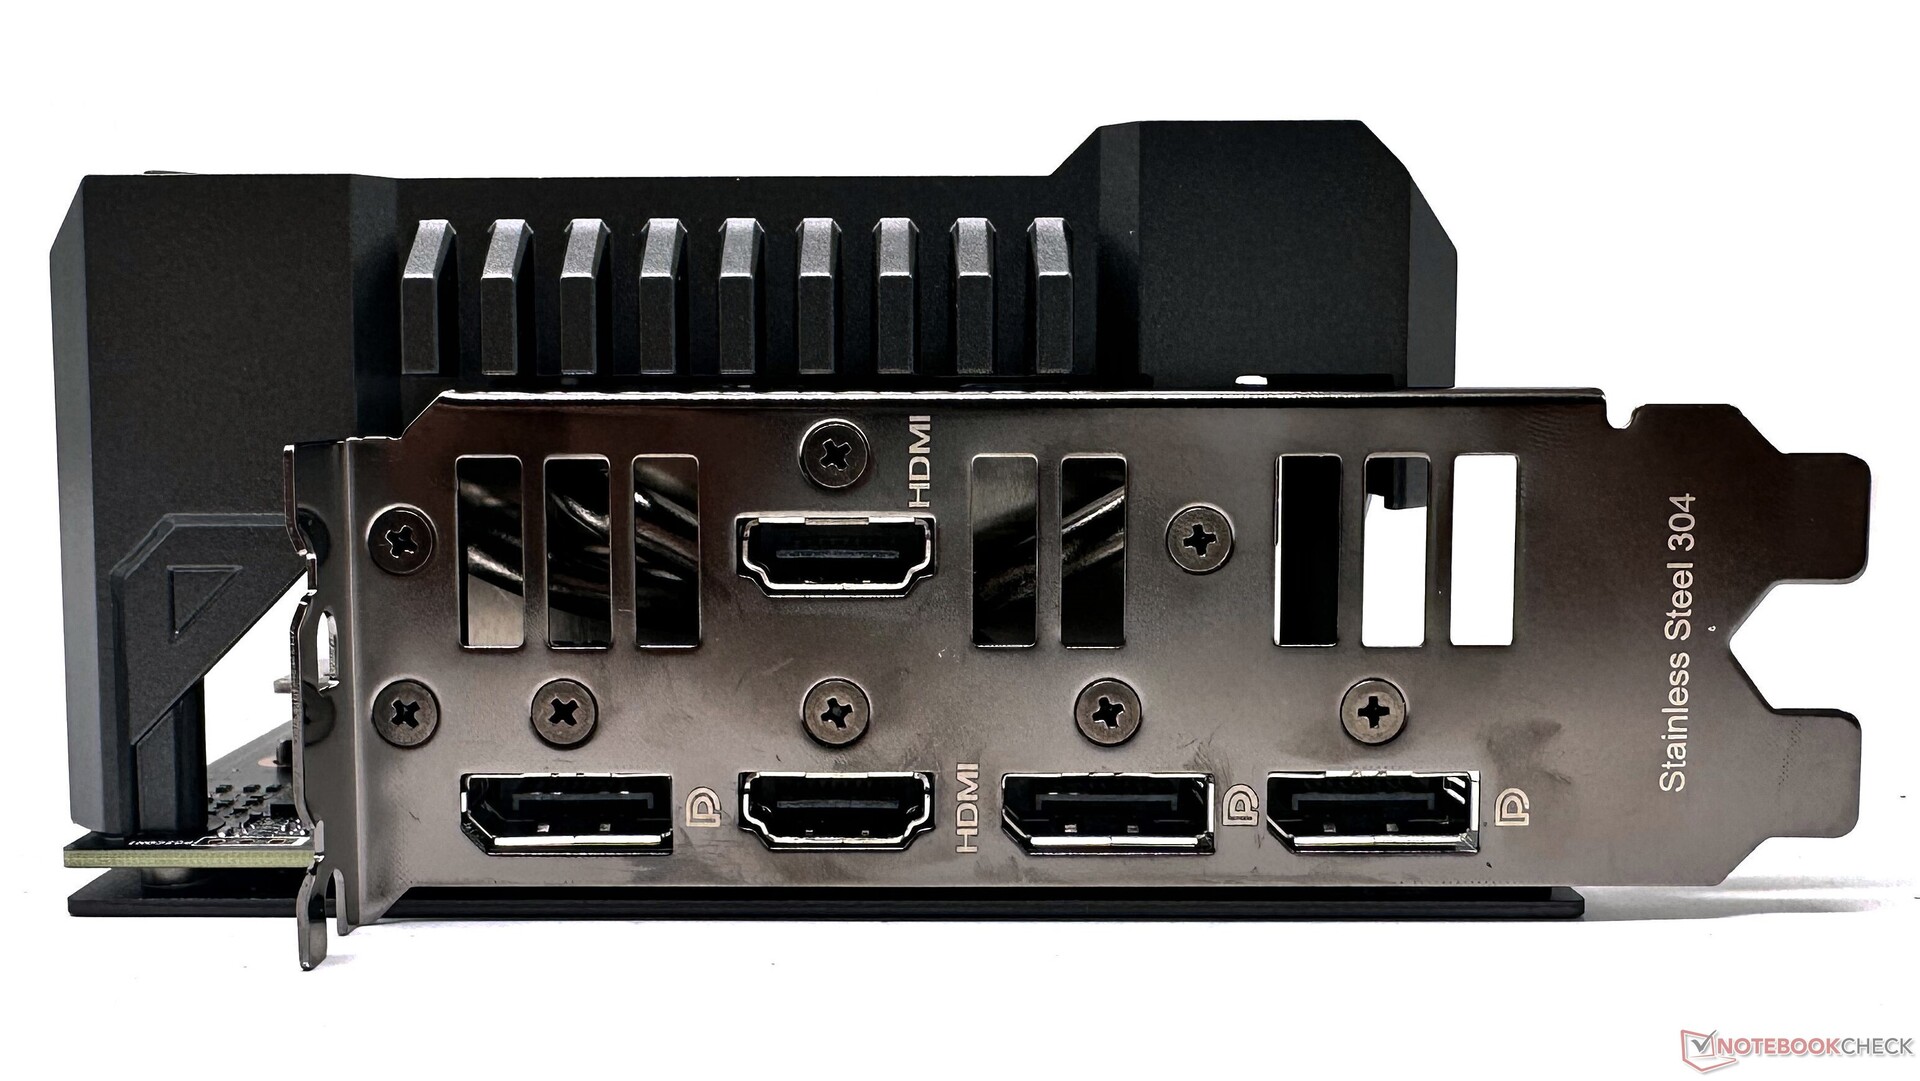
Most Ada cards offer four display outs including three DisplayPort 1.4a and one HDMI 2.1a. But Asus has been benevolent in offering five ports —two HDMI 2.1a-outs and three DisplayPort 1.4a-outs — which can come in handy for hooking up TVs and the likes that do not offer DisplayPort connections.
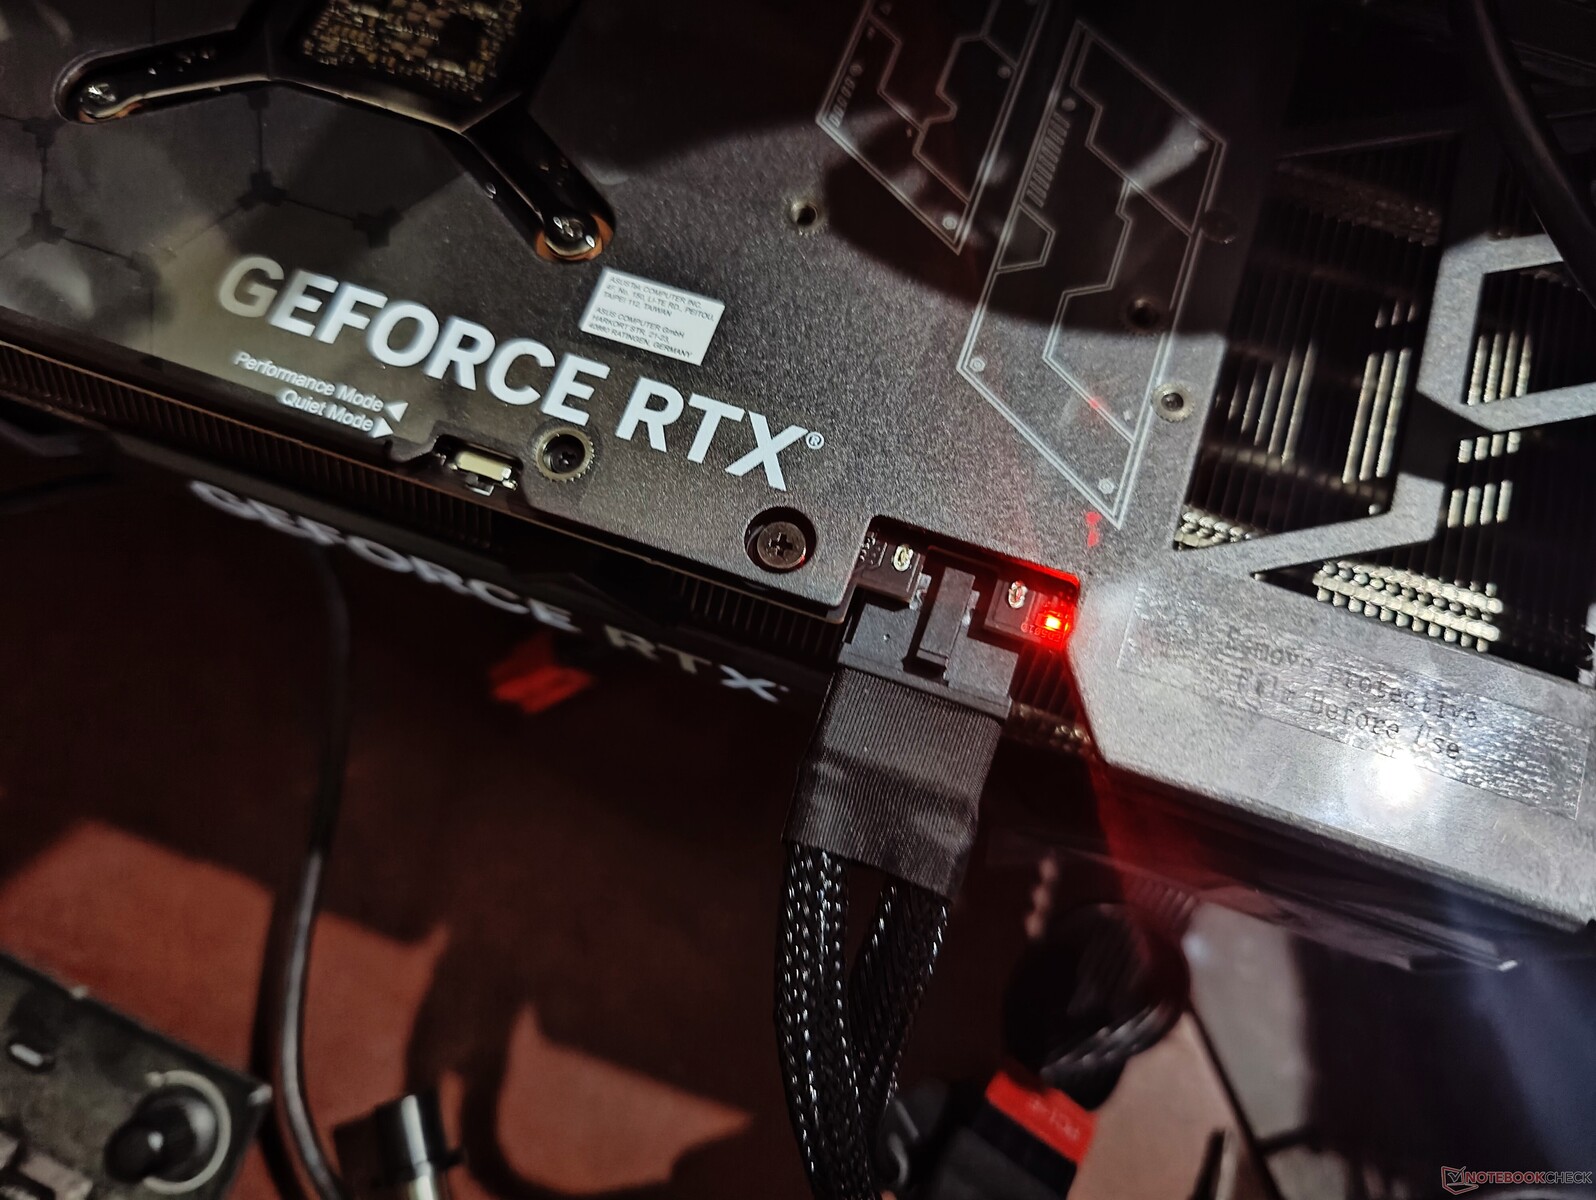
Like all other Ada cards launched so far, the TUF Gaming RTX 4070 Ti OC Edition also features the infamous PCIe Gen 5 16-pin power connector. Since the card draws only about 285 W typically, the provided 12VHPWR to 2x 8-pin adapter is sufficient.
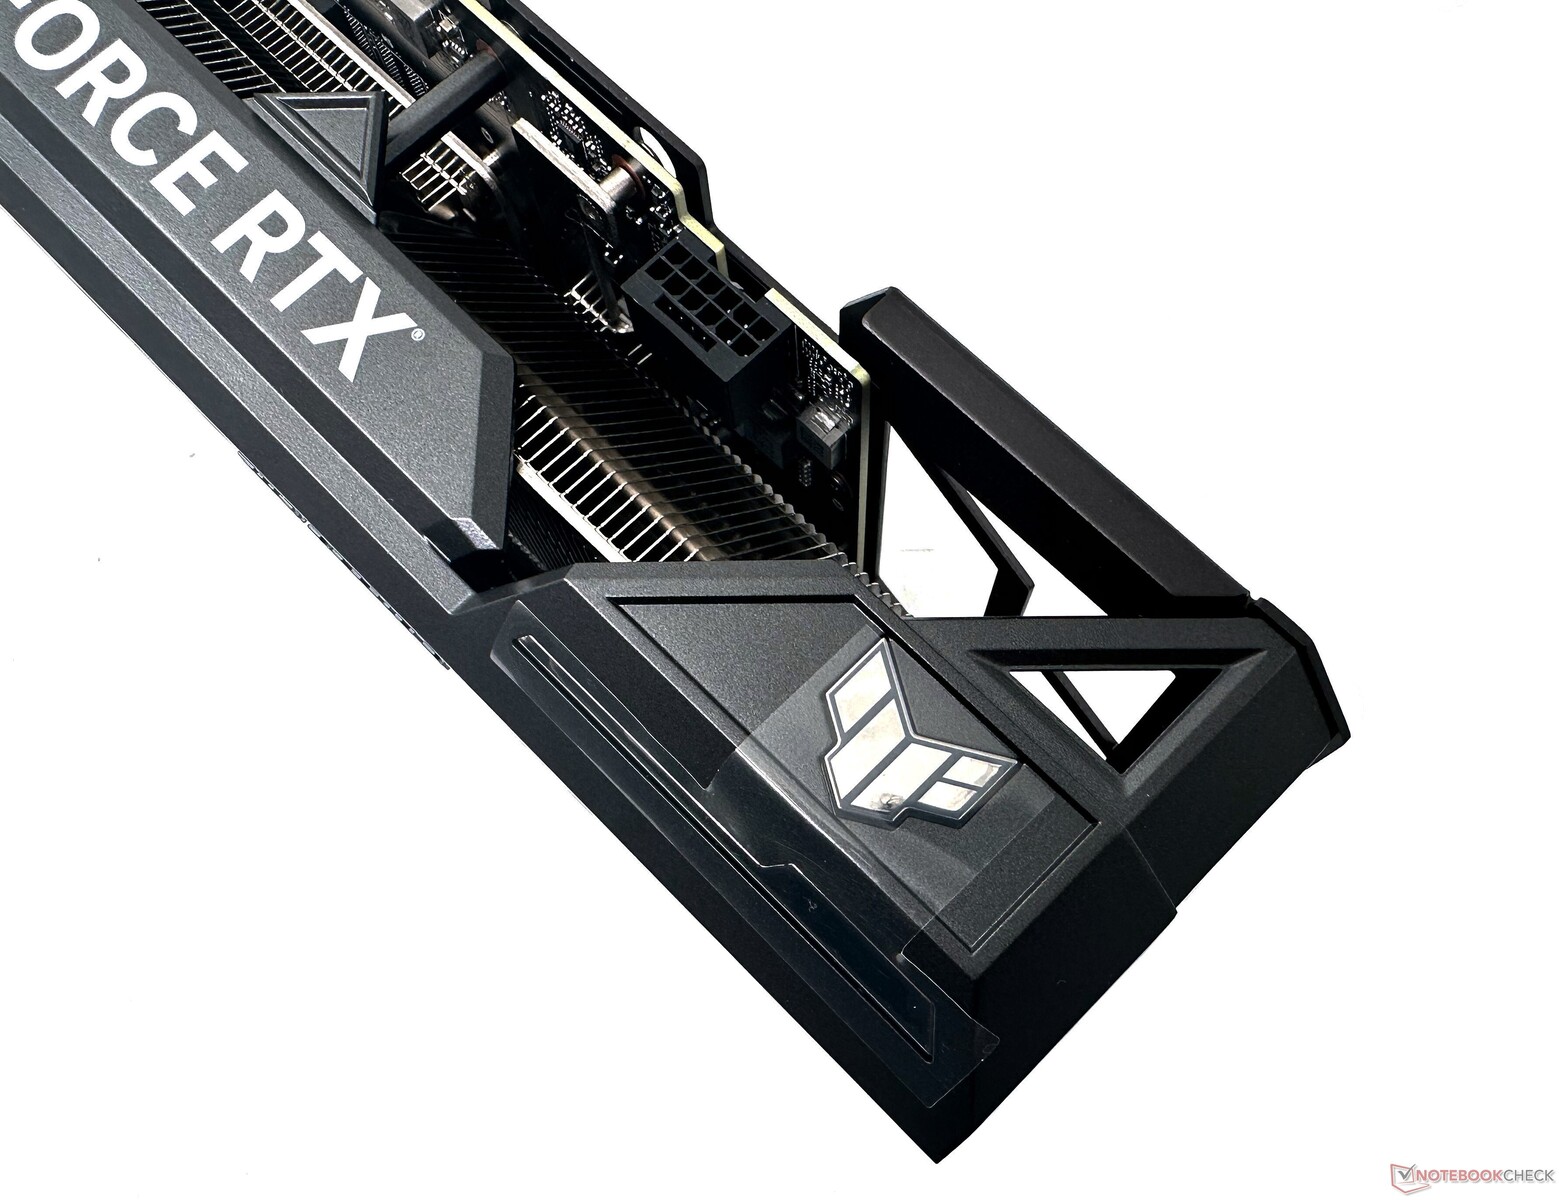
Asus offers a red LED indicator near the power input that tells the connector has not been seated correctly, or if the card is not receiving adequate power. The catch is that the LED indicator is off during use but lights up when the PC is turned off, which is a confusing behavior. Asus is apparently planning to fix this with a future software update.
There's also a BIOS switch that enables toggling between Performance and Quiet modes. The modes are largely identical, but Performance mode should be able to allow boosts up to 2,760 MHz while Quiet mode offers up to 2,730 MHz. We will look into how these modes affect power draws, thermals, and fan noise as we go on.

In the box, we find quite a few items including:
- TUF collection card
- 12VHPWR to 2x 8-pin power adapter
- Thank You card
- TUF Gaming Certificate
- Quick Start guide
- Warranty information
- TUF Velcro hook and loop
- TUF GPU holder
The TUF GPU holder prevents card sag and also doubles up as a screwdriver.
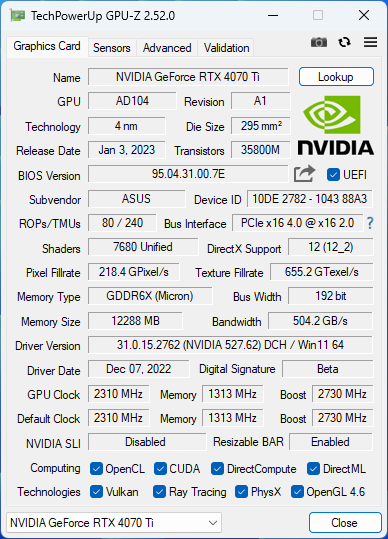
The Asus TUF Gaming RTX 4070 Ti OC Edition can boost up to 2,760 MHz with the Performance BIOS. The card is rated for a total graphics power (TGP) of 285 W. Overclocking potential is limited with only about 10% additional power target headroom for an increased TGP of 314 W.

The test bench: TUF Gaming RTX 4070 Ti meets the Intel Core i9-13900K
The test system is largely identical to what we've used for our reviews of the RTX 4090 FE and the RTX 4080 FE. This includes the following components:
- Cooler MasterFrame 700 test bench
- Intel Core i9-13900K
- Gigabyte Z790 Aorus Master motherboard
- Gigabyte Aorus Gen 4 2 TB NVMe SSD for benchmarks and games
- 2x 16 GB Kingston Fury Renegade DDR5-6400 RAM with timings 32-39-39-80 at 1.40 V
- Gigabyte M28U 4K 144 Hz monitor
- Cooler Master MasterLiquid ML360L V2 ARGB AIO cooler
- Thermaltake ToughPower Grand RGB 850 W
- A fresh installation of Windows 11 22H2 with the latest patches was used together with the provided test Game Ready driver version 527.62
We would like to thank Cooler Master for supplying the test bench and AIO, Gigabyte for the Core i9-13900K, Z790 motherboard, M28U monitor, and NVMe SSD, and Kingston for the memory.
Synthetic benchmarks: Inches past the RTX 3090 Ti while trying to catch up to the RX 7900 XT
The Asus TUF Gaming RTX 4070 Ti trails the AMD Radeon RX 7900 XT by 16% in Fire Strike Graphics and is 10% behind the RTX 4080 Founders Edition.
This delta with the RX 7900 XT widens close to 21% in Fire Strike Ultra and Fire Strike Extreme. The Radeon RX 7900 XTX, meanwhile, is far ahead of the TUF Gaming RTX 4070 Ti with leads of up to 49% in Fire Strike Ultra.
Time Spy Graphics sees the TUF Gaming RTX 4070 Ti take a 18% hit when compared to the RTX 4080 and about 11% lesser scores in comparison with the RX 7900 XT.
Although still trailing, the TUF Gaming RTX 4070 Ti is able to narrow the gap with the RX 7900 XT while performing generally on par with the RTX 3090 Ti in various Unigine tests. Unsurprisingly, the RTX 4090 FE reigns supreme in Unigine Superposition at 4K Optimized and 8K Optimized settings.
Overall, the Asus TUF Gaming RTX 4070 Ti is ever-so-slightly ahead of the RTX 3090 Ti in overall synthetic benchmark performance that includes various 3DMark and Unigine tests. The new AD104 GPU is not too far behind the RX 7900 XT, but it cannot match the likes of the RX 7900 XTX and the RTX 4080.
We did not notice any discernable performance drops in select 3DMark tests in the Quiet BIOS mode.
| 3DMark 11 Performance | 55728 points | |
| 3DMark Ice Storm Standard Score | 289247 points | |
| 3DMark Cloud Gate Standard Score | 87562 points | |
| 3DMark Fire Strike Score | 42479 points | |
| 3DMark Fire Strike Extreme Score | 26604 points | |
| 3DMark Time Spy Score | 22481 points | |
Help | ||
Compute performance: On par with Ampere flagships but Blender CUDA woes with Ada continue
The effects of reduced CUDA core counts in AD104 start becoming clearer in compute benchmarks. The TUF Gaming RTX 4070 Ti loses to the RTX 4080 by 24% in V-Ray 5 CUDA and RTX tests and this gap increases to 45% when compared with the RTX 4090 FE. However, the TUF Gaming RTX 4070 Ti does show decent improvements over the RTX 3090 and RTX 3090 Ti in these tests.
Blender Classroom CUDA once again shows skewed results with the RTX 4070 Ti similar to what we had observed with the RTX 4090 and RTX 4080 even with the latest drivers. We have reached out to Nvidia and are yet to hear back from them on this. Optix rendering with the TUF Gaming RTX 4070 Ti is only two seconds slower than the RTX 4080.
Interestingly, LuxMark Room GPU-only test shows the TUF Gaming RTX 4070 Ti with 35% gains over the RTX 3090 Ti and a massive 63% lead over the RX 7900 XTX. However, AMD GPUs make up for this deficit in the Sala GPU-only benchmark wherein the Radeon RX 6900 XT and the RX 6950 XT top the charts with up to 37% leads over the TUF Gaming RTX 4070 Ti.
The TUF Gaming RTX 4070 Ti is able to perform on par with the RTX 3090 Ti in ComputeMark but trails the RX 7900 XT by 10% overall.
| V-Ray Benchmark Next 4.10 - GPU | |
| NVIDIA GeForce RTX 4090 (v4.10.07 ) | |
| NVIDIA GeForce RTX 4080 (v4.10.07 ) | |
| Average of class Desktop (122 - 2403, n=48, last 2 years) | |
| Asus TUF Gaming GeForce RTX 4070 Ti (v4.10.07 ) | |
| NVIDIA GeForce RTX 3090 Ti (v4.10.07 ) | |
| NVIDIA GeForce RTX 3090 (v4.10.07 ) | |
| Average NVIDIA GeForce RTX 3090 (781 - 883, n=18) | |
| Average NVIDIA GeForce RTX 3080 Ti (854 - 855, n=3) | |
| Average NVIDIA GeForce RTX 3080 (636 - 643, n=2) | |
| Average NVIDIA Titan RTX (386 - 439, n=16) | |
| AMD Radeon RX 6800 XT (v4.10.07 ) | |
| AMD Radeon RX 6950 XT (v4.10.07 ) | |
| Blender | |
| v3.3 Classroom CUDA | |
| Average NVIDIA Titan RTX (n=1) | |
| Average NVIDIA GeForce RTX 3080 Ti (21 - 22, n=2) | |
| Average NVIDIA GeForce RTX 3090 (20 - 22, n=13) | |
| NVIDIA GeForce RTX 3090 (3.3.0) | |
| Average of class Desktop (8 - 54, n=31, last 2 years) | |
| v3.3 Classroom OPTIX/RTX | |
| Average NVIDIA Titan RTX (n=1) | |
| Average NVIDIA GeForce RTX 3080 Ti (14 - 15, n=2) | |
| Average NVIDIA GeForce RTX 3090 (13 - 14, n=13) | |
| NVIDIA GeForce RTX 3090 (3.3.0) | |
| Asus TUF Gaming GeForce RTX 4070 Ti (3.3.2) | |
| Average of class Desktop (5 - 19, n=30, last 2 years) | |
| NVIDIA GeForce RTX 4080 (3.3.0) | |
| NVIDIA GeForce RTX 4090 (3.3.0) | |
* ... smaller is better
Gaming performance: Significant gains compared to RTX 3090
The Asus TUF Gaming RTX 4070 Ti continues to stalk the RTX 3090 Ti in gaming tests with perceivable gains over the RTX 3090. Cumulatively, the TUF Gaming RTX 4070 Ti is on par with the RTX 3090 Ti and can be up to 13% faster vis-à-vis the RTX 3090 in tested games.
The performance is not too behind the RX 7900 XT and, in certain cases such as QHD settings, the RTX 4070 Ti is on par or can even edge out AMD's second-best RDNA 3 GPU this generation.
In general, TUF Gaming RTX 4070 Ti comes across as an extremely capable card for QHD 100 fps gaming at Ultra settings. The card is also capable of running most modern AAA titles at 4K Ultra 60 fps, but QHD is where AD104 shines the most.
While performance is comparable to that of the RTX 3090 Ti, hardware limitations start coming into play, especially at 4K. The RTX 3090 Ti has a much wider memory bus and a higher memory bandwidth, which favors high resolutions and heavy textures. That being said, AD104 manages to come well-within striking distance of the RTX 3090 Ti solely on the basis of architectural improvements.
Compared to the top dog RTX 4090 FE, the RTX 4070 Ti lags behind by about 28% overall in raster performance. Nvidia is pushing DLSS 3 as the panacea to boost fps at maxed out settings, so it should be possible to hit even higher frames at 4K with DLSS 3 in supported titles.
The fact that we are now getting RTX 3090 Ti levels of performance at a US$799 MSRP shows how much of a cash-grab the Ampere flagship was at launch.
Ray tracing performance
The TUF Gaming RTX 4070 Ti also benefits from new ray tracing pipelines introduced with the Ada architecture including the new Opacity Micromap Engine and the Displaced Micro-mesh Engine.
Ada also brings a new Shader Execution Reordering (SER) scheduling system for more efficient secondary ray thread reordering, but developers will have to specifically take advantage of it.
The RTX 4070 Ti has 29% fewer RT cores than the RTX 3090 Ti. However, the above improvements to Ada's RT pipeline brings the RTX 4070 Ti on par with the Ampere flagship. Of course, this is also highly dependent on how the game engine itself implements various RT features, which is why we do not always see significant gains.
Metro Exodus (non-Enhanced Edition), for example, shows 11% gains in RT at 1080p Ultra compared to the RTX 3090, but we don't see much of a difference with even the RTX 4090 or RTX 4080 either. Only the the RX 7900 XTX is able to offer a 10% higher fps in this setting. Similar is the case with Far Cry 6 RT at 1080p Ultra as well.
Titles such as Control, Ghostwire: Tokyo, and Dying Light 2 show a much more prominent separation of the RTX 4070 Ti from the flagship Ada cards when it comes too native ray tracing performance.
Similar to the RTX 3090 Ti, ray tracing at native 4K Ultra without upscaling poses to be a challenge for the RTX 4070 Ti as evident from Cyberpunk 2077 1.5 tests — not surprising, considering that even the RTX 4090 FE can manage only about 42 fps in these settings.
| Control - 1920x1080 High Quality Preset & High Ray Tracing Preset (DX12) | |
| NVIDIA GeForce RTX 4090 | |
| Average of class Desktop (163.1 - 170.5, n=2, last 2 years) | |
| NVIDIA GeForce RTX 4080 | |
| AMD Radeon RX 7900 XTX | |
| NVIDIA GeForce RTX 3090 Ti | |
| Asus TUF Gaming RTX 4070 Ti | |
| AMD Radeon RX 7900 XT | |
| Average NVIDIA GeForce RTX 3080 Ti (111 - 120.6, n=3) | |
| Average NVIDIA GeForce RTX 3090 (91.4 - 122.6, n=5) | |
| Average NVIDIA GeForce RTX 3080 (98.1 - 103, n=2) | |
| AMD Radeon RX 6950 XT | |
| Average NVIDIA Titan RTX (63 - 120, n=3) | |
| AMD Radeon RX 6900 XT (SAM ENABLED) | |
| AMD Radeon RX 6900 XT | |
| AMD Radeon RX 6800 XT | |
| Watch Dogs Legion - 1920x1080 Ultra Preset + Ultra Ray Tracing (DX12) | |
| NVIDIA GeForce RTX 4090 | |
| NVIDIA GeForce RTX 4080 | |
| Asus TUF Gaming RTX 4070 Ti | |
| NVIDIA GeForce RTX 3090 Ti | |
| Average NVIDIA GeForce RTX 3090 (75.7 - 110, n=3) | |
| Average NVIDIA GeForce RTX 3080 Ti (n=1) | |
| AMD Radeon RX 6800 XT | |
| Average NVIDIA GeForce RTX 3080 (70.9 - 71.3, n=2) | |
| AMD Radeon RX 6950 XT | |
| AMD Radeon RX 6900 XT | |
| AMD Radeon RX 6900 XT (SAM ENABLED) | |
| Average NVIDIA Titan RTX (n=1) | |
| Dying Light 2 - 1920x1080 High Quality Raytracing | |
| NVIDIA GeForce RTX 4090 | |
| NVIDIA GeForce RTX 4080 | |
| Average NVIDIA GeForce RTX 3090 (67.9 - 109.9, n=3) | |
| Average NVIDIA GeForce RTX 3080 Ti (n=1) | |
| Asus TUF Gaming RTX 4070 Ti | |
| Average NVIDIA Titan RTX (n=1) | |
| NVIDIA GeForce RTX 3090 Ti | |
| Average NVIDIA GeForce RTX 3080 (n=1) | |
| Cyberpunk 2077 1.6 | |
| 3840x2160 Ray Tracing Ultra Preset (DLSS off) | |
| NVIDIA GeForce RTX 4090 (1.6) | |
| NVIDIA GeForce RTX 4080 (1.6) | |
| NVIDIA GeForce RTX 3090 Ti (1.52) | |
| Asus TUF Gaming RTX 4070 Ti (1.61) | |
| Average NVIDIA GeForce RTX 3090 (19.8 - 22.1, n=6) | |
| AMD Radeon RX 7900 XTX (1.61) | |
| Average NVIDIA GeForce RTX 3080 Ti (n=1) | |
| AMD Radeon RX 7900 XT (1.61) | |
| Average NVIDIA Titan RTX (n=1) | |
| Average NVIDIA GeForce RTX 3080 (n=1) | |
| 1920x1080 Ray Tracing Ultra Preset (DLSS off) | |
| NVIDIA GeForce RTX 4090 (1.6) | |
| NVIDIA GeForce RTX 4080 (1.6) | |
| Asus TUF Gaming RTX 4070 Ti (1.61) | |
| NVIDIA GeForce RTX 3090 Ti (1.52) | |
| Average NVIDIA GeForce RTX 3080 Ti (n=1) | |
| Average NVIDIA GeForce RTX 3090 (61.3 - 70.4, n=6) | |
| AMD Radeon RX 7900 XTX (1.61) | |
| Average NVIDIA GeForce RTX 3080 (n=1) | |
| AMD Radeon RX 7900 XT (1.61) | |
| Average NVIDIA Titan RTX (n=1) | |
| The Callisto Protocol - 1920x1080 Ultra Preset (without FSR Upscaling) + Full Ray-Tracing | |
| Average of class Desktop (138.8 - 145.2, n=2, last 2 years) | |
| Average NVIDIA GeForce RTX 3090 (n=1) | |
| AMD Radeon RX 7900 XTX | |
| AMD Radeon RX 7900 XT | |
| Asus TUF Gaming RTX 4070 Ti | |
| Average NVIDIA GeForce RTX 3080 Ti (n=1) | |
| Average NVIDIA GeForce RTX 3080 (n=1) | |
| Average NVIDIA Titan RTX (n=1) | |
| low | med. | high | ultra | QHD | 4K | |
|---|---|---|---|---|---|---|
| GTA V (2015) | 187.9 | 187.9 | 187.6 | 172.3 | 158.4 | 171.8 |
| The Witcher 3 (2015) | 460 | 230 | 151.9 | |||
| Dota 2 Reborn (2015) | 303 | 274.2 | 261.2 | 245.5 | 231.5 | |
| Final Fantasy XV Benchmark (2018) | 236 | 235 | 209 | 167 | 90.5 | |
| Shadow of the Tomb Raider (2018) | 298 | 280 | 202 | 104.4 | ||
| Metro Exodus (2019) | 194.6 | 161.4 | 132.1 | 84.5 | ||
| Control (2019) | 202 | 130.6 | 64.9 | |||
| Borderlands 3 (2019) | 212 | 186.9 | 140.6 | 74.1 | ||
| Mafia Definitive Edition (2020) | 241 | 171.9 | 88.9 | |||
| Watch Dogs Legion (2020) | 174.3 | 152 | 121 | 68.4 | ||
| F1 2021 (2021) | 713 | 614 | 499 | 263 | 199.8 | 114.4 |
| Far Cry 6 (2021) | 197 | 183 | 159 | 89 | ||
| Dying Light 2 (2022) | 175.5 | 120.9 | 59.1 | |||
| Cyberpunk 2077 1.6 (2022) | 185.7 | 167.4 | 122.9 | 50.1 | ||
| Ghostwire Tokyo (2022) | 318 | 329 | 219 | 95.2 | ||
| F1 22 (2022) | 407 | 417 | 342 | 143.5 | 92.4 | 47 |
| Uncharted Legacy of Thieves Collection (2022) | 137.7 | 133.8 | 108.8 | 63.2 | ||
| Call of Duty Modern Warfare 2 2022 (2022) | 187 | 179 | 132 | 83 | ||
| The Callisto Protocol (2022) | 155.26 | 155.75 | 117.62 | 68.34 |
Emissions: No perceivable difference between Performance and Quiet BIOS modes
Asus equips the TUF Gaming RTX 4070 Ti with a triple-fan cooler. As is common with most AiB cards, you do get a BIOS switch between Performance and Quiet modes.
The TUF Gaming RTX 4070 Ti O12G allows increasing the TGP by 10% up to 314 W, so there's not much of an overclocking potential.
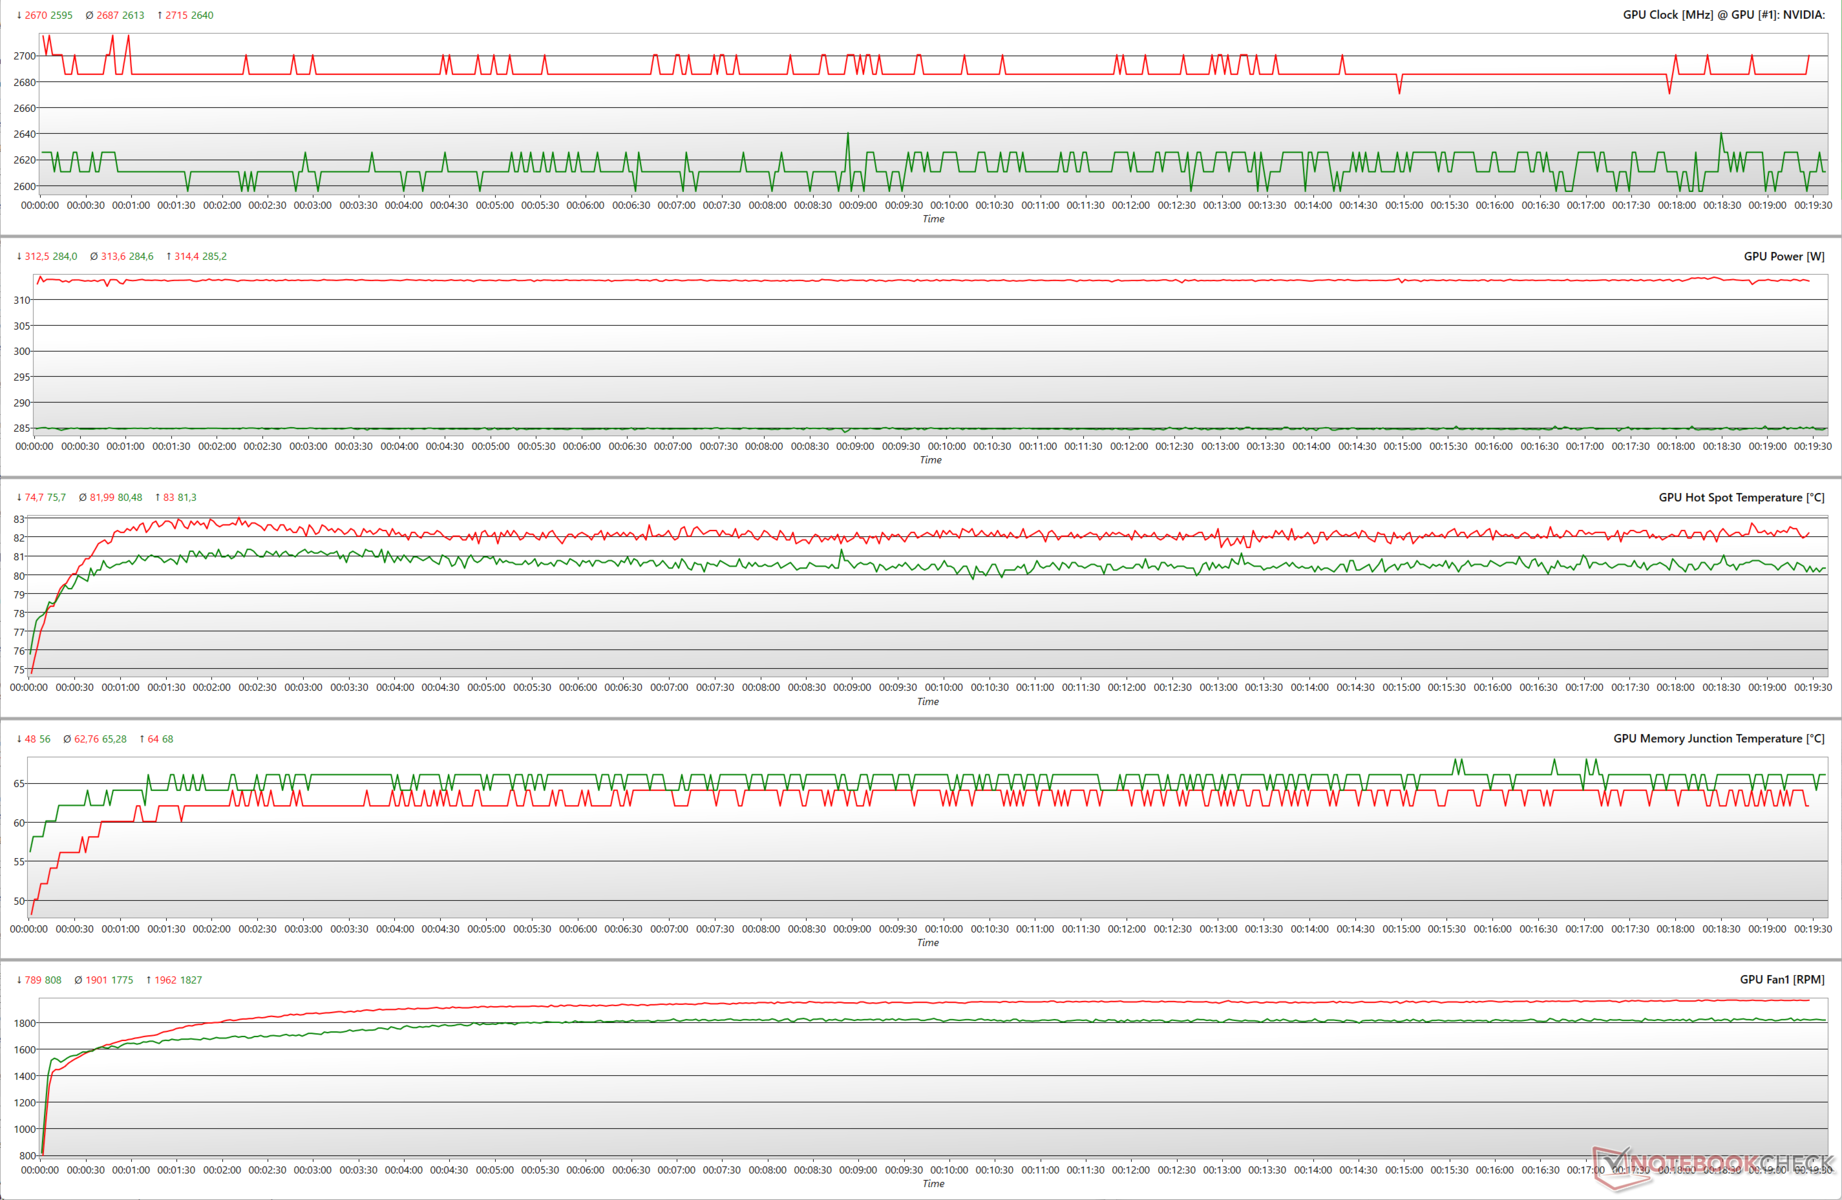
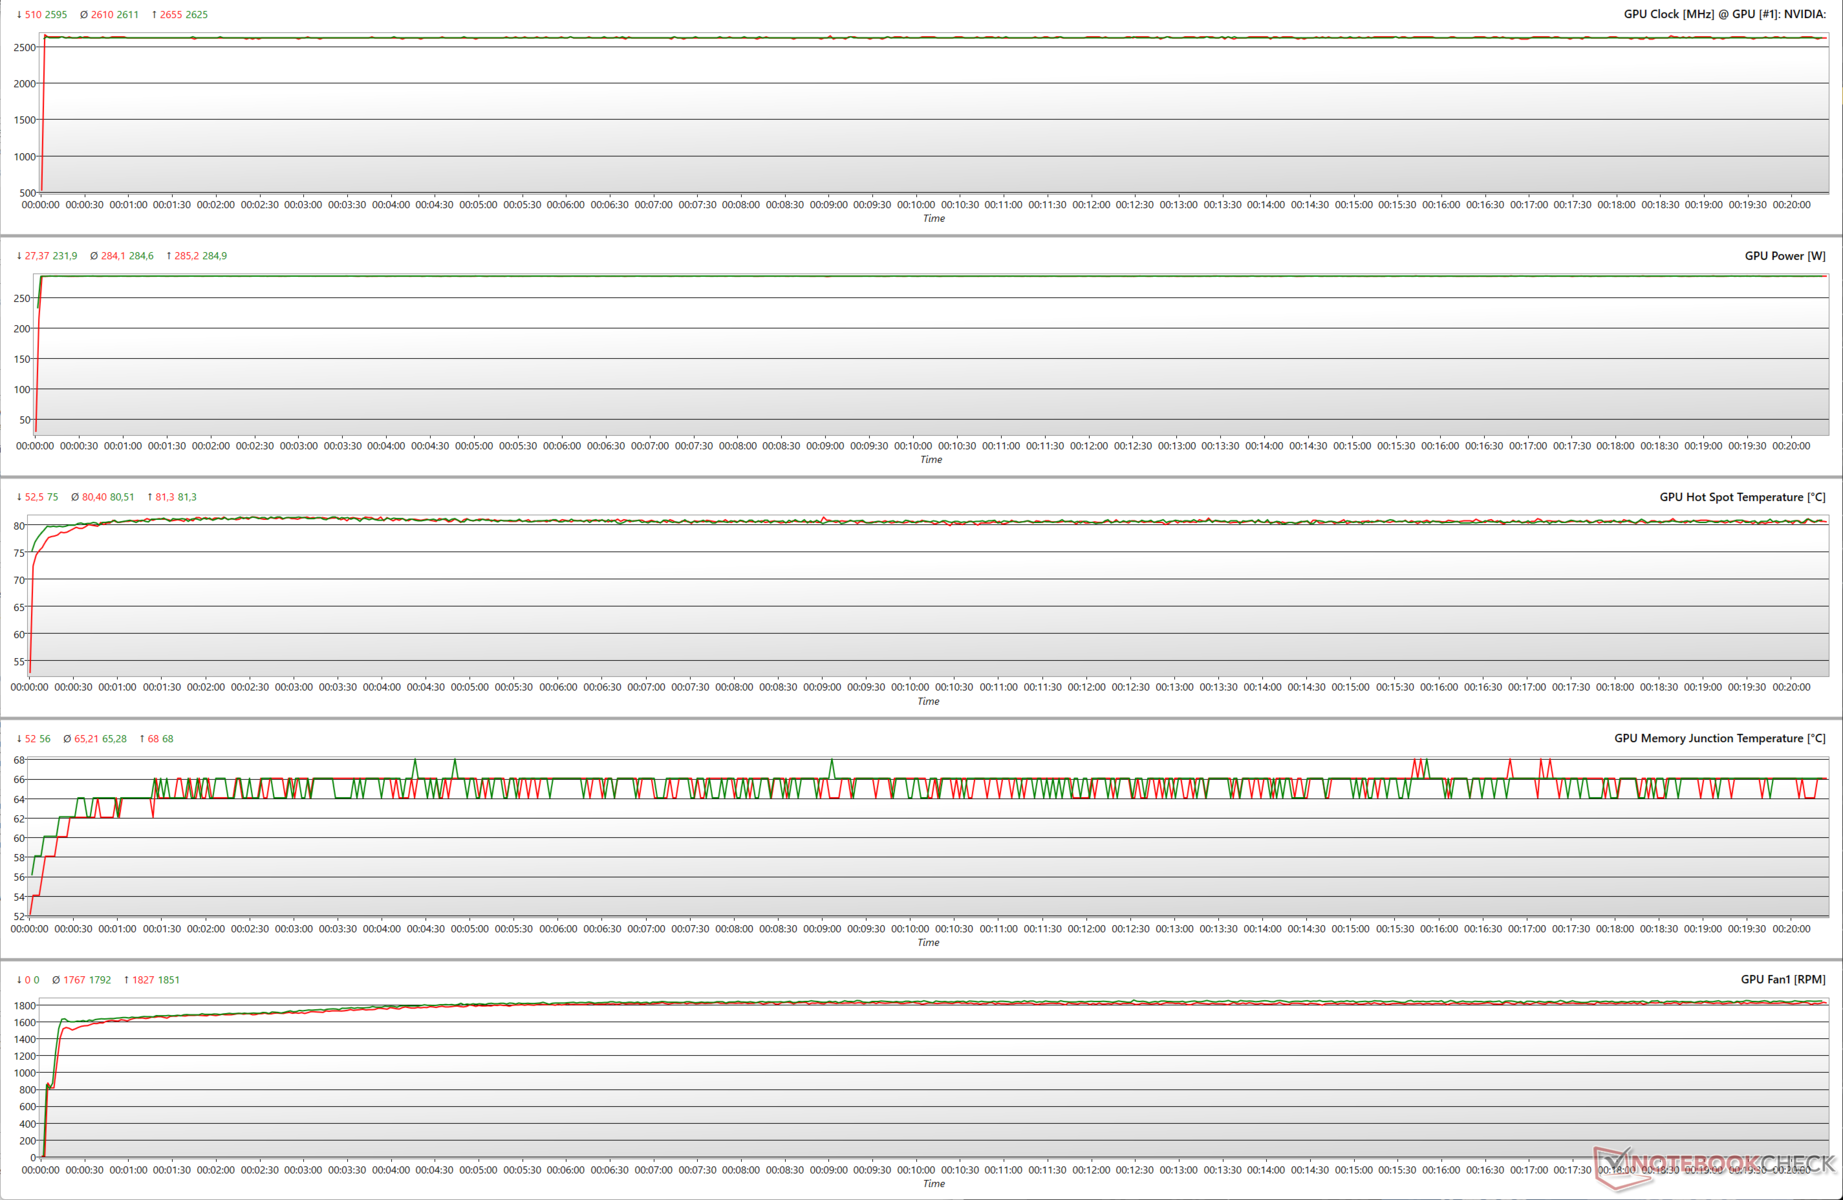
Stress tests
During a FurMark stress test at 1280 x 720 without AA, we see that the TUF Gaming RTX 4070 Ti makes full use of its 285 W TGP and runs at an average 2,613 MHz while hitting the rated 2,640 MHz maximum boost at times. Increasing the TGP to 314 W sees the clocks boosting up to 2,715 MHz while averaging at 2,687 MHz. This only has a minimal impact on GPU hotspot temperatures, which can increase up to 83 °C.
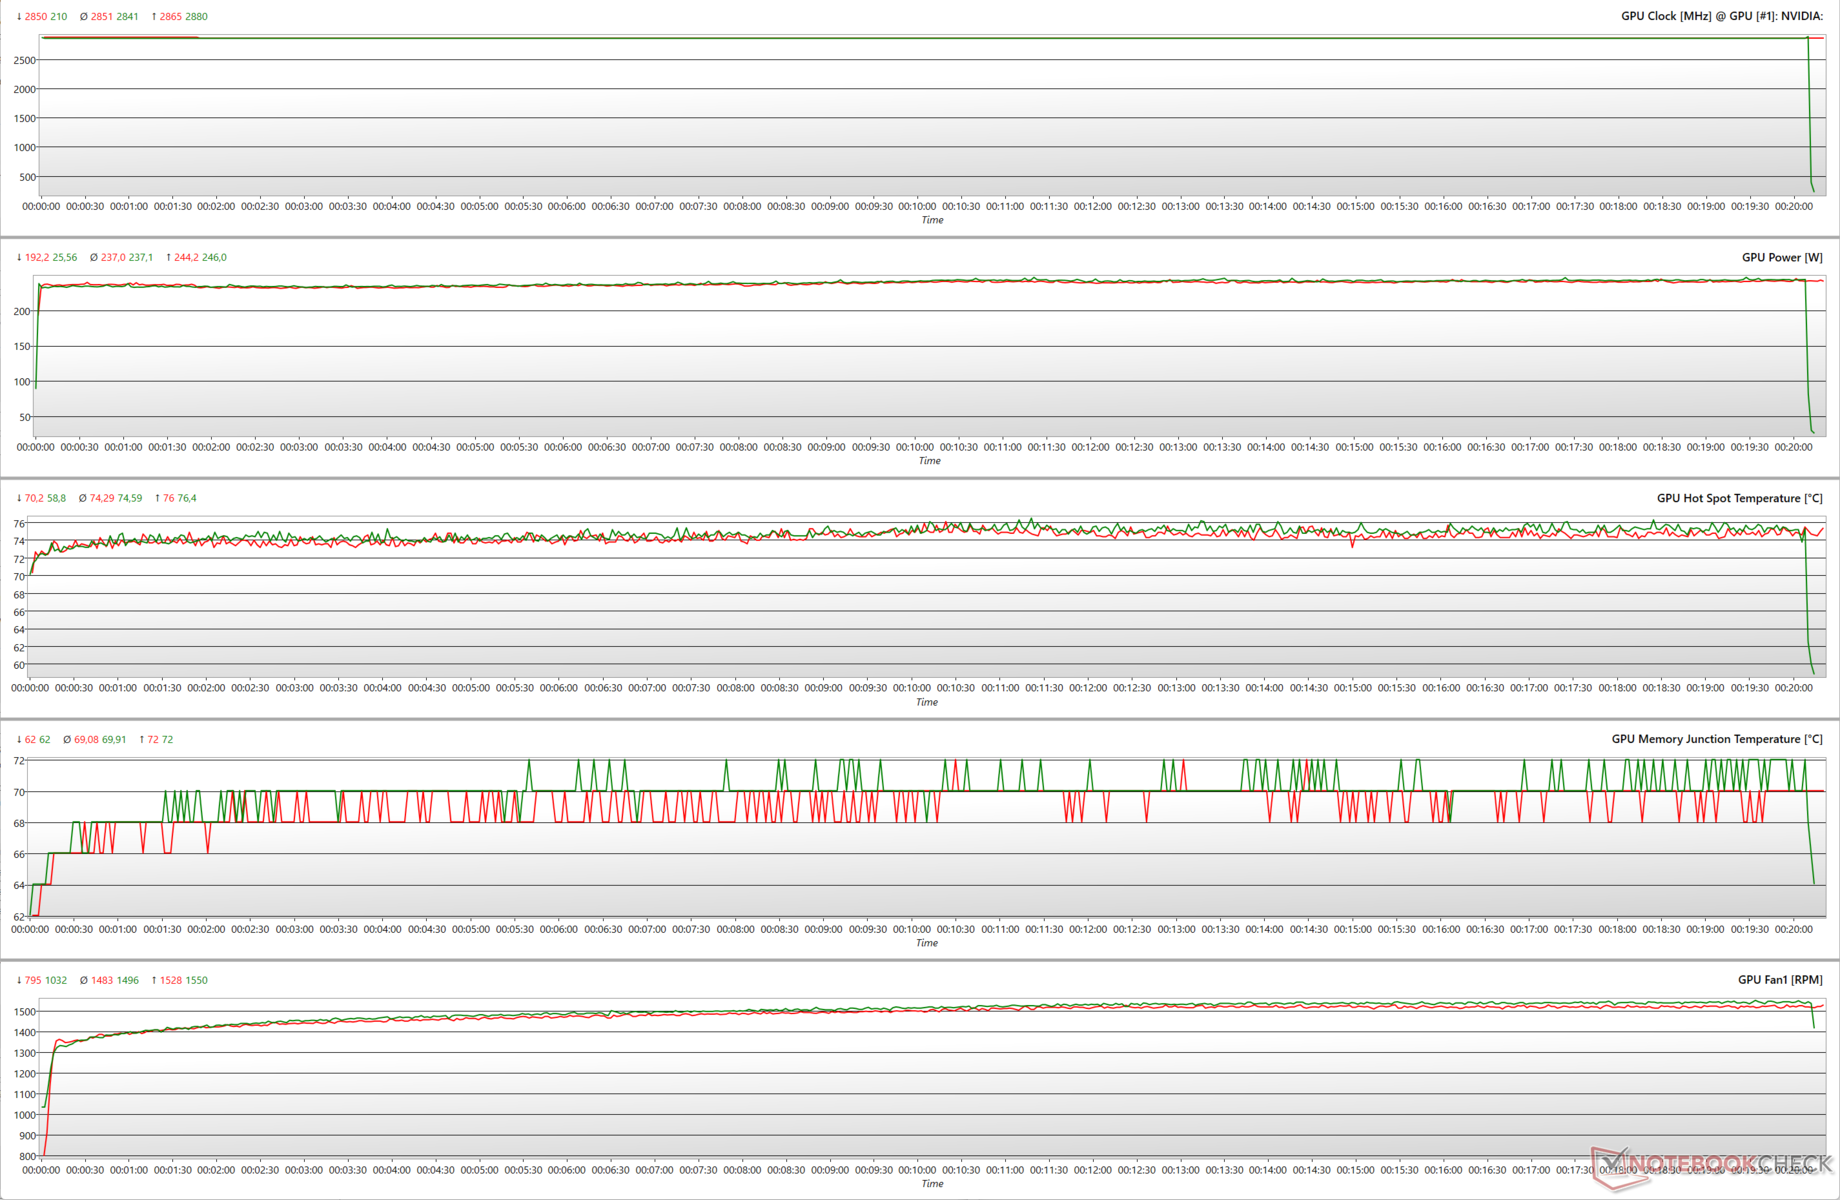
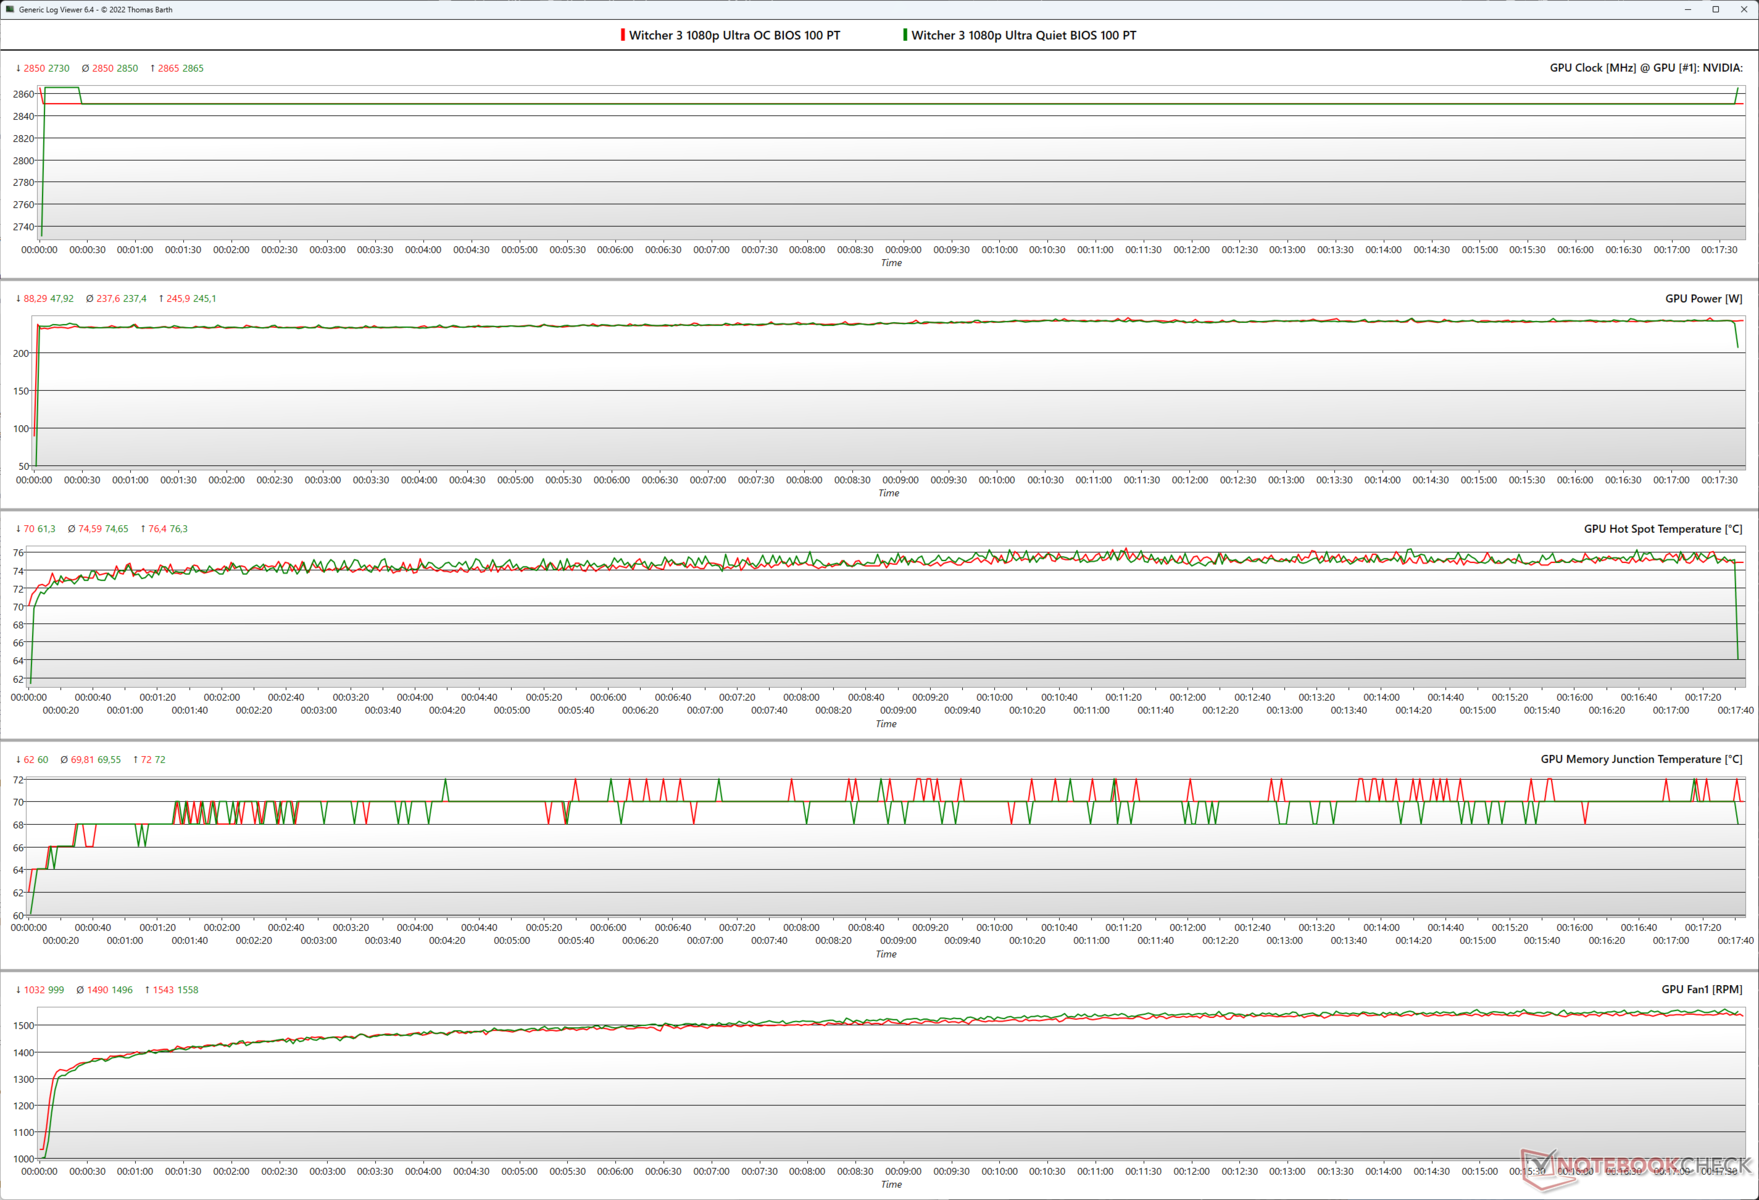
Stressing the GPU with The Witcher 3 at 1080p Ultra presents a more real-world scenario. Here, we see that there's practically no difference in various GPU parameters between 285 W and 314 TGP. This is because Ada does not rely on power limits alone to boost clocks. In this case, the RTX 4070 Ti is able to achieve a 2,880 MHz boost frequency at around 246 W itself.
Asus claims that Performance mode BIOS enables the card to run 9 °C cooler, but we did not observe any perceivable difference in GPU parameters in either BIOS modes with both FurMark and The Witcher 3 stress tests.
The Witcher 3 FPS Chart
Asus's Axial-tech cooling system seems to be doing a good job as evidenced by the well-sustained performance seen in The Witcher 3 at 1080p Ultra and 4K Ultra settings.
Surface temperatures
Asus's cooling tech also helps in keeping the TUF Gaming RTX 4070 Ti's surface temperatures at manageable levels.
At an ambient temperature of 22 °C, we observe that the front side of the card does not warm up while the GPU area can reach 71 °C. The metal backplate remains relatively cool at about 56 °C.
We recorded up to 46 °C near the area where the 12VHPWR adapter plugs in while the adapter itself was cool at only about 35 °C.


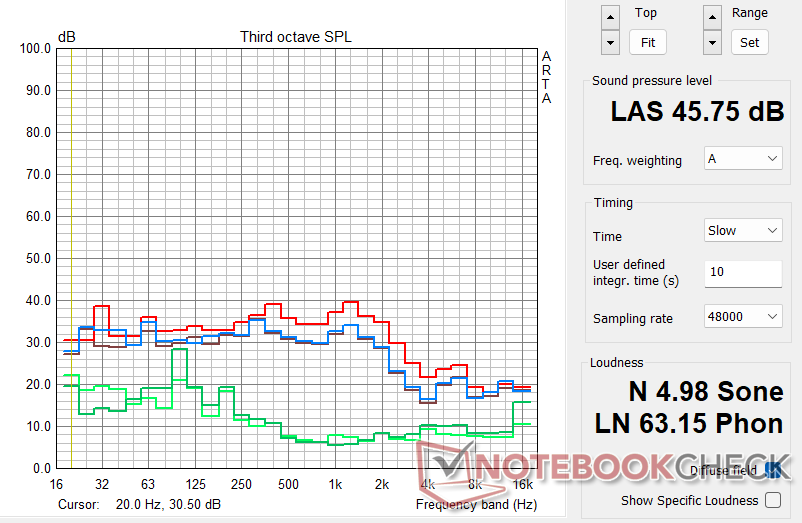
Noise levels
The TUF Gaming RTX 4070 Ti has tolerable fan noise levels in general. Two of the three fans rotate counterclockwise while the center fan rotates in a clockwise direction. The fans seem to be well-built and do not protrude outside their enclosures.
In the default fan curve, all three fans completely stop when the GPU core temperature is up to 55 °C and only start up after it crosses this threshold.
Therefore, most basic workloads and even gaming at 720p or 1080p low settings in older titles won't see the fans revving up.
According to Asus, switching to the Quiet BIOS can result in 6.3x quieter noise profile compared to the Performance BIOS. However, we did not find such a difference in our testing.
There seems to be practically no difference between the two BIOS modes when we measured fan noise at a fixed distance of 20 cm from the open test bench with all other case fans turned off except for the Cooler Master AIO pump.
The maximum fan noise level we recorded was 45.75 dB(A) for a fan speed of 1,962 RPM during a FurMark run at a 110% power target.
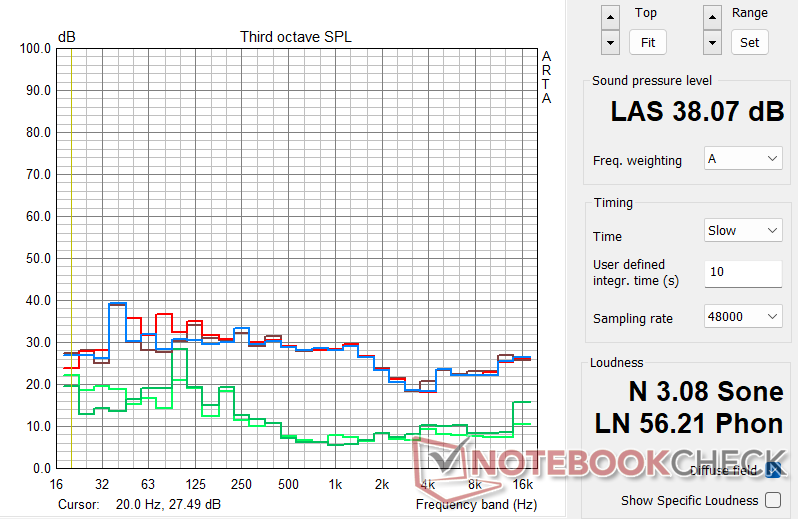
A real-world stress test like The Witcher 3 at 1080p Ultra was not affected by the increased power target. As evidenced by our stress test graphs for The Witcher 3 earlier, the RTX 4070 Ti achieved a 2,880 MHz boost at 246 W and the fans spinning at 1,550 RPM were providing sufficient cooling already.
This likely explains why the GPU did not rev up the fans any further, and the fan noise levels remained the same across all test conditions at around 38 dB(A).
| Stress Test | VBIOS Mode / Power Target | Max. Fan Speed (RPM) | Fan Noise dB(A) |
|---|---|---|---|
| FurMark 1280 x 720, no AA | Performance / 100% | 1,827 | 40.51 |
| FurMark 1280 x 720, no AA | Performance / 110% | 1,962 | 45.75 |
| FurMark 1280 x 720, no AA | Quiet / 100% | 1,851 | 40.81 |
| The Witcher 3 1080p Ultra | Performance / 100% | 1,550 | 38.07 |
| The Witcher 3 1080p Ultra | Performance / 110% | 1,528 | 38.04 |
| The Witcher 3 1080p Ultra | Quiet / 100% | 1,558 | 37.81 |
Energy Management: Up to 32% more economical than the RTX 3090 Ti
The Ada lineup has been particularly good in power efficiency, at least from AD103 onwards. In FurMark, the RTX 4070 Ti consumes up to 32% and 21% less power than the RTX 3090 Ti and RX 7900 XT, respectively in default settings.
In The Witcher 3 at 1080p Ultra, we once again see that increasing the power target has no perceivable effect on overall system power consumption. Still, the RTX 4070 Ti can be up to 25% more economical than the RTX 3090 Ti and up to 9% frugal than the RX 7900 XT.
Interestingly, the RTX 4080 FE also consumes similar power as the TUF Gaming RTX 4070 Ti in the default settings for 10% more frames.
Power Consumption: External Monitor
* ... smaller is better
Pros
Cons
Verdict: Hope for the midrange after several faux pas

Things didn't go exactly as planned for Nvidia with the Ada launch, particularly with the RTX 4080 and below. Misleading nomenclature and performance claims don't augur well for gamers, but here we are with the first AD103-based RTX 4070 Ti GPU in our hands.
The Asus TUF Gaming RTX 4070 Ti OC Edition comes across as a very capable midrange GPU of this generation. The card is built as per TUF standards and offers pleasing aesthetics and a relatively nominal footprint compared to some of the RTX 4080 and RTX 4090 behemoths we've seen so far.
The RTX 4070 Ti's performance in synthetic and gaming benchmarks is generally on par or at times even slightly better than the RTX 3090 Ti and definitely quite significant compared to the RTX 3090.
The card also makes last gen flagship AMD cards such as the Radeon RX 6950 XT (US$830) and the Radeon RX 6900 XT (US$700) obsolete even at their now-reduced prices.
The Asus TUF Gaming RTX 4070 Ti OC is the new QHD gaming champion that brings RTX 3090 Ti and RX 7900 XT-class performance at a price that is becoming the new normal for midrange these days. The RTX 4070 Ti offers more card for the buck thanks to DLSS and better ray tracing compared to any AMD offering to date while even saving US$50.
Asus offers a very capable cooling solution with the TUF Gaming RTX 4070 Ti. The OEM provides two BIOS modes, but we didn't find much of a difference in acoustics or performance between the two. It is possible that the company may push out a VBIOS update or two down the line to further optimize power consumption and noise, but this can be done manually as well with some tinkering.
Surface temperatures and fan noise levels were generally tolerable. Power consumption, for the performance on offer, is very economical compared to what the RTX 3090 Ti guzzles.
That being said, the RTX 3090 Ti (US$1,099) is not entirely dud at this point. The RTX 4070 Ti makes for a better purchase decision than the RTX 3090 Ti only if you are solely into gaming, and that too at resolutions such as QHD Ultra or FHD Ultra. Eventually, that 192-bit memory bus will start showing its limits.
Therefore, those into 4K gaming, content creation, and the works would still want to go the RTX 3090 Ti route given that it has a much more powerful memory configuration. Nevertheless, the RTX 4070 Ti is well within reach of the RTX 3090 Ti in 4K gaming, and DLSS 3 can offset some of the bandwidth limitations since the actual rendering happens at a lower resolution anyways.
While the Ampere and RDNA 2 generation suffered from acute shortages and massively inflated prices owing to the pandemic and the crypto bubble, Ada and RDNA 3 were expected to do some course correction.
However, GPU makers seem to have sensed that customers are willing to pay the extra buck, so the current pricing modalities across the board are anything but ideal. For perspective, the RTX 3070 Ti launched back in 2021 at a US$599 MSRP.
Given how the RTX 4070 Ti performs, the Radeon RX 7900 XT at US$899 now seems needlessly expensive, and the RTX 4080 FE's US$1,200 pricing is still bereft of any rationale.
Whether an xx70 card should be priced at the US$800+ mark is debatable, but gamers planning on treating themselves to a new generation GPU have only two options right now — bite the bullet or play the waiting game.
Price and Availability
The Asus TUF Gaming RTX 4070 Ti OC Edition is available for US$850 from retailers such as Best Buy (coming soon) and Micro Center. We do hear Nvidia has mandated that some of the AiB RTX 4070 Ti cards be priced at the US$799 MSRP, which probably explains why the non-OC version of this card retails for US$50 less. Variants such as the Asus Strix series will be priced much higher.
In India, the Asus TUF Gaming RTX 4070 Ti OC Edition retails for ₹101,999 while the non-OC Edition is available for ₹93,299 at various retailers. The card is yet to be stocked on Amazon India.
Price comparison
