Notebookcheck Logo

Intel Core i7-7600U vs AMD A9-9420e

Intel Core i7-7600U

► remove from comparison Intel i7-7600U

The Intel Core i7-7600U is a fast dual-core processor for notebooks based on the Kaby Lake architecture and was announced in January 2017. It integrates 2 CPU cores with Hyper-Threading support clocked at 2.8 - 3.9 GHz (2 core Turbo also 3.9 GHz). Besides two cores, the processor is also equipped with the HD Graphics 620 GPU as well as a dual-channel memory controller (DDR3L-1600/DDR4-2400). It is manufactured in a 14nm process with FinFET transistors.

Architecture

Intel basically uses the same micro architecture compared to Skylake, so the per-MHz performance does not differ. The manufacturer only reworked the Speed Shift technology for faster dynamic adjustments of voltages and clocks, and the improved 14nm process allows much higher frequencies combined with better efficiency than before.

Performance

With 2.5 to 3.9 GHz, the Core i7-7600U clocks significantly higher than the old Core i7-6500U (2.5 - 3.1). That means, the i7-7600U is (at the time of announcement in beginning of 2017) the fastest dual core processor for laptops. The performance is sufficient for demanding tasks (except some games that may need four real cores).

Graphics

The integrated Intel HD Graphics 620 has 24 Execution Units (similar to previous HD Graphics 520) running at 300 - 1150 MHz. The performance depends a lot on the memory configuration; it should be comparable to a dedicated Nvidia GeForce 920M in combination with fast DDR4-2133 dual-channel memory.

Contrary to Skylake, Kaby Lake now supports hardware decoding for H.265/HEVC Main 10 with a 10-bit color depth as well as Google's VP9 codec. The dual-core Kaby Lake processors, which were announced in January, should also support HDCP 2.2.

Power Consumption

The chip is manufactured in an improved 14nm process with FinFET transistors, which improves the efficiency even further. Intel still specifies the TDP with 15 Watts, but it can also be reduced to 7.5 Watts by the notebook manufacturers (cTDP down). This will obviously affect the performance, because the Turbo Boost cannot be maintained for longer periods.

AMD A9-9420e

► remove from comparison AMD A9-9420e

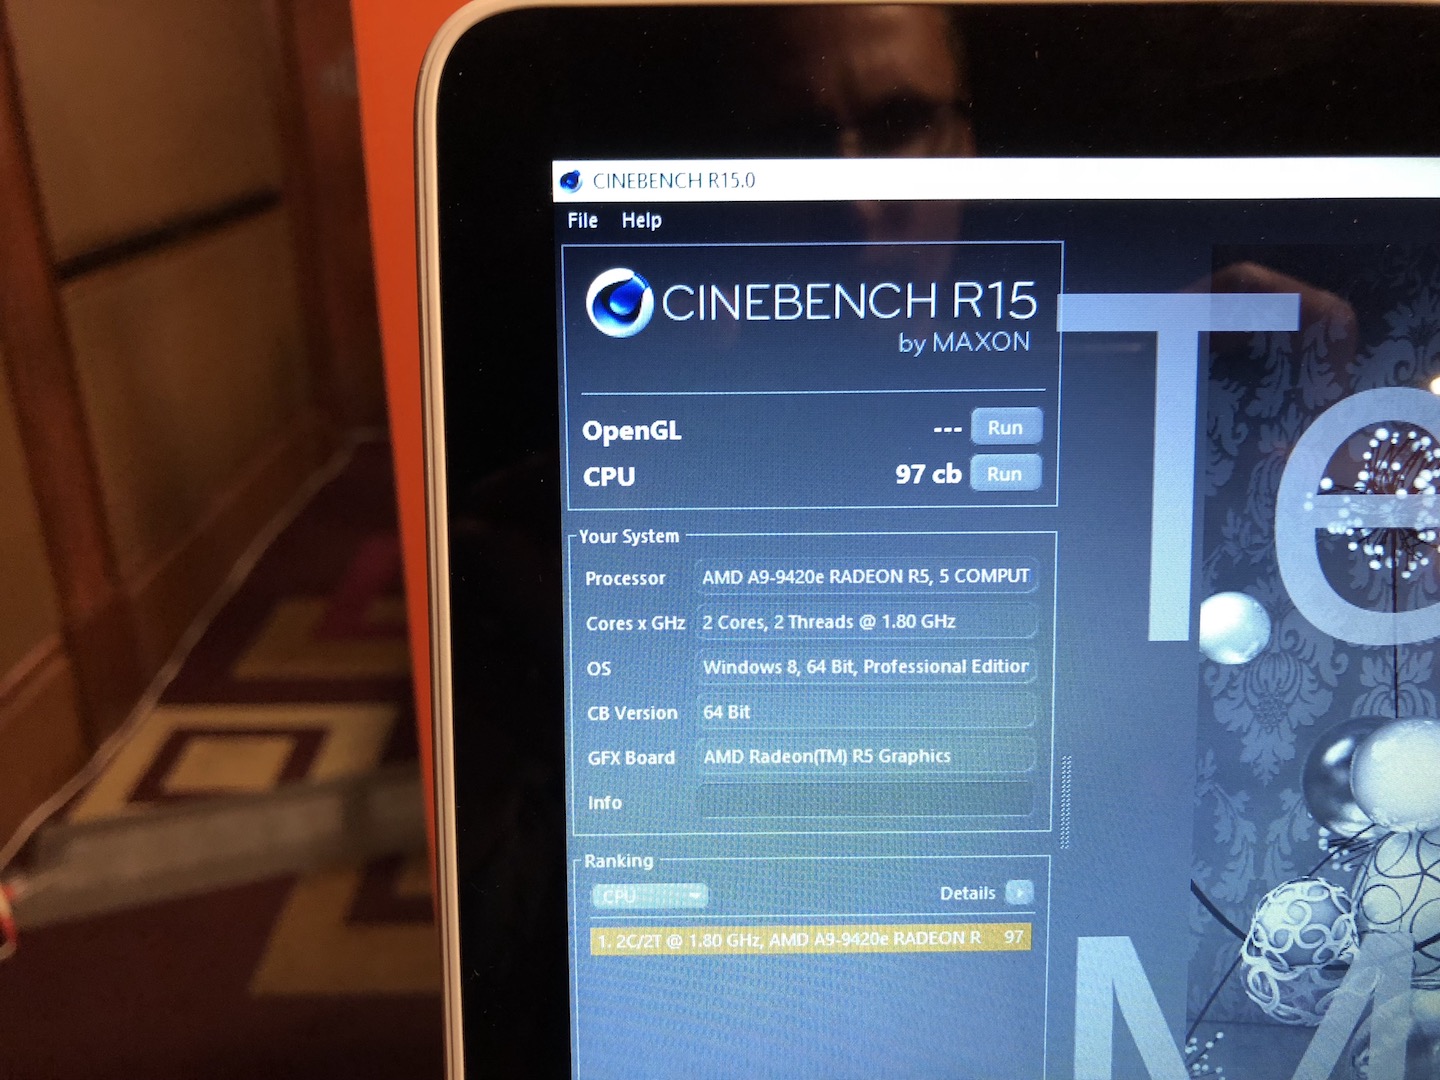
The AMD A9-9420e is an entry-level chip from the Stoney-Ridge APU series for notebooks (7th APU generation). It was first found in the Dell Inspiron 3000 with passive cooling and 4 GB DDR4 RAM. The performance in that device was way below the normal A9-9420 as the clock speed only reached up to 2,5 GHz. It also includes a Radeon R5 GPU with 192 shaders as well as a single-channel DDR4-2133 memory controller, H.265 video engine and chipset with all I/O ports.

Architecture

Stoney Ridge is the successor of the Carrizo architecture and the design is almost identical. Thanks to optimized manufacturing processes and more aggressive Boost behavior, however, the clocks are a bit higher at the same power consumption. The memory controller now also supports DDR4-RAM, in this case up to 2133 MHz. Stoney Ridge is the designation for the smaller dual-core and single-core chip, while Bristol Ridge is the bigger quad-core chip with dual-channel memory controller. More technical details are available in the following articles:

Power Consumption

AMD specifies the TDP of the A9-9420 between 10-25 Watts, but the passively cooled A9-9420e should be positioned lower than 9 Watt.

ModelIntel Core i7-7600UAMD A9-9420e
SeriesIntel Kaby LakeAMD Bristol Ridge
CodenameKaby LakeStoney Ridge
Series: Bristol Ridge Stoney Ridge
Intel Core i7-7700K compare4.2 - 4.5 GHz4 / 8 cores8 MB L3
Intel Core i7-7700 compare3.6 - 4.2 GHz4 / 8 cores8 MB L3
Intel Xeon E3-1535M v6 compare3.1 - 4.2 GHz4 / 8 cores8 MB L3
Intel Core i7-7920HQ compare3.1 - 4.1 GHz4 / 8 cores8 MB L3
Intel Core i7-7700T compare2.9 - 3.8 GHz4 / 8 cores8 MB L3
Intel Core i5-7600K compare3.8 - 4.2 GHz4 / 4 cores8 MB L3
Intel Xeon E3-1505M v6 compare3 - 4 GHz4 / 8 cores8 MB L3
Intel Core i7-7820HQ compare2.9 - 3.9 GHz4 / 8 cores8 MB L3
Intel Core i7-7820HK compare2.9 - 3.9 GHz4 / 8 cores8 MB L3
Intel Core i7-7700HQ compare2.8 - 3.8 GHz4 / 8 cores6 MB L3
Intel Core i5-7500 compare3.4 - 3.8 GHz4 / 4 cores6 MB L3
Intel Core i5-7440HQ compare2.8 - 3.8 GHz4 / 4 cores6 MB L3
Intel Core i7-7567U compare3.5 - 4 GHz2 / 4 cores4 MB L3
Intel Core i7-7660U compare2.5 - 4 GHz2 / 4 cores4 MB L3
Intel Core i7-7600U « 2.8 - 3.9 GHz2 / 4 cores4 MB L3
Intel Core i5-7300HQ compare2.5 - 3.5 GHz4 / 4 cores6 MB L3
Intel Core i5-7500T compare2.7 - 3.3 GHz4 / 4 cores6 MB L3
Intel Core i5-7287U compare3.3 - 3.7 GHz2 / 4 cores4 MB L3
Intel Core i7-7560U compare2.4 - 3.8 GHz2 / 4 cores4 MB L3
Intel Core i5-7267U compare3.1 - 3.5 GHz2 / 4 cores4 MB L3
Intel Core i5-7360U compare2.3 - 3.6 GHz2 / 4 cores4 MB L3
Intel Core i7-7500U compare2.7 - 3.5 GHz2 / 4 cores4 MB L3
Intel Core i5-7300U compare2.6 - 3.5 GHz2 / 4 cores3 MB L3
Intel Core i5-7260U compare2.2 - 3.4 GHz2 / 4 cores4 MB L3
Intel Core i5-7200U compare2.5 - 3.1 GHz2 / 4 cores3 MB L3
Intel Core i3-7100H compare3 GHz2 / 4 cores3 MB L3
Intel Core i3-7167U compare2.8 GHz2 / 4 cores3 MB L3
Intel Core i7-7Y75 compare1.3 - 3.6 GHz2 / 4 cores4 MB L3
Intel Core i5-7Y57 compare1.2 - 3.3 GHz2 / 4 cores4 MB L3
Intel Core i5-7Y54 compare1.2 - 3.2 GHz2 / 4 cores4 MB L3
Intel Core i3-7100U compare2.4 GHz2 / 4 cores3 MB L3
Intel Core m3-7Y32 compare1 - 3 GHz2 / 4 cores4 MB L3
Intel Pentium Gold 4415U compare2.3 GHz2 / 4 cores2 MB L3
Intel Core m3-7Y30 compare1 - 2.6 GHz2 / 4 cores4 MB L3
Intel Celeron 3965U compare2.2 GHz2 / 2 cores2 MB L3
Intel Core i3-7020U compare2.3 GHz2 / 4 cores3 MB L3
Intel Celeron 3867U compare1.8 GHz2 / 2 cores2 MB L3
Intel Celeron 3865U compare1.8 GHz2 / 2 cores2 MB L3
Intel Pentium Gold 4425Y compare1.7 GHz2 / 4 cores2 MB L3
Intel Pentium Gold 4415Y compare1.6 GHz2 / 4 cores2 MB L3
Intel Pentium Gold 4410Y compare1.5 GHz2 / 4 cores2 MB L3
Intel Celeron 3965Y compare1.5 GHz2 / 2 cores2 MB L3
AMD A9-9425 compare3.1 - 3.7 GHz2 / 2 cores
AMD A9-9420e « - 2.5 GHz2 / 2 cores
AMD A9-9420 compare3 - 3.6 GHz2 / 2 cores
AMD A9-9410 compare2.9 - 3.5 GHz2 / 2 cores
AMD A6-9225 compare2.6 - 3.1 GHz2 / 2 cores
AMD A6-9220 compare2.5 - 2.9 GHz2 / 2 cores
AMD A6-9220C compare1.8 - 2.7 GHz2 / 2 cores
AMD A6-9210 compare2.4 - 2.8 GHz2 / 2 cores
AMD A4-9120 compare2.2 - 2.5 GHz2 / 2 cores
AMD A4-9120C compare1.6 - 2.4 GHz2 / 2 cores
AMD E2-9010 compare2 - 2.2 GHz2 / 2 cores
AMD E2-9000 compare1.8 - 2.2 GHz2 / 2 cores
AMD A6-9220e compare1.6 - 2.4 GHz2 / 2 cores
Clock2800 - 3900 MHz <=2500? MHz
L1 Cache128 KB
L2 Cache512 KB1 MB
L3 Cache4 MB
Cores / Threads2 / 42 / 2
TDP15 Watt
Technology14 nm28 nm
max. Temp.100 °C90 °C
SocketBGA1356BGA
FeaturesDual-Channel DDR4 Memory Controller, HyperThreading, AVX, AVX2, Quick Sync, Virtualization, AES-NISingle-Channel DDR4-2133?, Virtualization,
iGPUIntel HD Graphics 620 (300 - 1150 MHz)AMD Radeon R5 (Stoney Ridge)
Architecturex86x86
$393 U.S.
Announced
Transistors1200 Million
Die Size124.5 mm2

Benchmarks

Cinebench R15 - Cinebench R15 CPU Multi 64 Bit
min: 242     avg: 338.5     median: 344 (2%)     max: 379 Points
97 Points (1%)
Cinebench R15 - Cinebench R15 CPU Single 64 Bit
min: 112     avg: 152.9     median: 161 (48%)     max: 164 Points
Cinebench R11.5 - Cinebench R11.5 CPU Multi 64 Bit
min: 3.62     avg: 3.9     median: 3.9 (5%)     max: 4.16 Points
Cinebench R11.5 - Cinebench R11.5 CPU Single 64 Bit
min: 1.48     avg: 1.8     median: 1.9 (46%)     max: 1.87 Points
Cinebench R10 - Cinebench R10 Rend. Single (32bit)
min: 5145     avg: 6096     median: 6253 (38%)     max: 6316 Points
Cinebench R10 - Cinebench R10 Rend. Multi (32bit)
min: 11324     avg: 12622     median: 12482 (9%)     max: 15012 Points
Cinebench R10 - Cinebench R10 Rend. Multi (64bit)
16430 Points (11%)
Cinebench R10 - Cinebench R10 Rend. Single (64bit)
8145 Points (10%)
wPrime 2.10 - wPrime 2.0 1024m *
min: 436.1     avg: 486.3     median: 480.5 (6%)     max: 556 s
wPrime 2.10 - wPrime 2.0 32m *
min: 12.1     avg: 15     median: 13.7 (3%)     max: 19.9 s
WinRAR - WinRAR 4.0
min: 2333     avg: 2681     median: 2686 (4%)     max: 2976 Points
X264 HD Benchmark 4.0 - x264 Pass 2
min: 19.51     avg: 22.4     median: 22.7 (8%)     max: 23.77 fps
X264 HD Benchmark 4.0 - x264 Pass 1
min: 105     avg: 119.6     median: 121.1 (28%)     max: 130.1 fps
TrueCrypt - TrueCrypt Serpent
min: 0.238     avg: 0.2     median: 0.2 (0%)     max: 0.248 GB/s
TrueCrypt - TrueCrypt Twofish
min: 0.4     avg: 0.4     median: 0.4 (7%)     max: 0.416 GB/s
TrueCrypt - TrueCrypt AES
min: 2.3     avg: 2.4     median: 2.4 (6%)     max: 2.4 GB/s
3DMark 06 - CPU - 3DMark 06 - CPU
min: 4570     avg: 4714     median: 4720.5 (10%)     max: 4844 Points
Super Pi mod 1.5 XS 1M - Super Pi mod 1.5 XS 1M *
min: 9     avg: 10.2     median: 9.8 (2%)     max: 13.33 s
Super Pi mod 1.5 XS 2M - Super Pi mod 1.5 XS 2M *
min: 22     avg: 23.5     median: 22.6 (1%)     max: 30.31 s
Super Pi Mod 1.5 XS 32M - Super Pi mod 1.5 XS 32M *
min: 506     avg: 552     median: 542.5 (2%)     max: 688 s
3DMark Vantage - 3DM Vant. Perf. CPU no Physx
12748 Points (11%)
3DMark 11 - 3DM11 Performance Physics
min: 1706     avg: 4360     median: 4575 (12%)     max: 5004 Points
3DMark - 3DMark Ice Storm Physics
min: 23959     avg: 38587     median: 40889.5 (33%)     max: 50904 Points
3DMark - 3DMark Ice Storm Extreme Physics
min: 28540     avg: 39426     median: 39313 (32%)     max: 48085 Points
3DMark - 3DMark Ice Storm Unlimited Physics
min: 45972     avg: 48807     median: 47780 (40%)     max: 52354 Points
3DMark - 3DMark Cloud Gate Physics
min: 3334     avg: 3727     median: 3768.5 (10%)     max: 4114 Points
3DMark - 3DMark Fire Strike Standard Physics
min: 4806     avg: 5372     median: 5430.5 (10%)     max: 5929 Points
3DMark - 3DMark Time Spy CPU
1937 Points (8%)
Geekbench 4.4 - Geekbench 4.1 - 4.4 64 Bit Single-Core
4386 Points (44%)
Geekbench 4.4 - Geekbench 4.1 - 4.4 64 Bit Multi-Core
8278 Points (9%)
Geekbench 4.0 - Geekbench 4.0 64 Bit Single-Core
4272 Points (58%)
Geekbench 4.0 - Geekbench 4.0 64 Bit Multi-Core
7978 Points (19%)
Geekbench 3 - Geekbench 3 32 Bit Multi-Core
min: 7427     avg: 7749     median: 7748.5 (14%)     max: 8070 Points
Geekbench 3 - Geekbench 3 32 Bit Single-Core
min: 3486     avg: 3693     median: 3693 (72%)     max: 3900 Points
Geekbench 3 - Geekbench 3 64 Bit Multi-Core
8312 Points (13%)
Geekbench 3 - Geekbench 3 64 Bit Single-Core
4080 Points (61%)
Mozilla Kraken 1.1 - Kraken 1.1 Total Score *
min: 914     avg: 995     median: 944.5 (1%)     max: 1258 ms
Sunspider - Sunspider 1.0 Total Score *
min: 62.5     avg: 65.2     median: 64.3 (1%)     max: 69.8 ms
Octane V2 - Octane V2 Total Score
min: 24529     avg: 35704     median: 37194.5 (33%)     max: 40798 Points
Power Consumption - Prime95 Power Consumption - external Monitor *
42.3 Watt (7%)
Power Consumption - Cinebench R15 Multi Power Consumption - external Monitor *
35.4 Watt (6%)
Power Consumption - Cinebench R15 Multi Power Efficiency - external Monitor
10.7 Points per Watt (8%)

Average Benchmarks Intel Core i7-7600U → 100% n=1

Average Benchmarks AMD A9-9420e → 28% n=1

- Range of benchmark values for this graphics card
- Average benchmark values for this graphics card
* Smaller numbers mean a higher performance
1 This benchmark is not used for the average calculation

Add one or more devices and compare

In the following list you can select (and also search for) devices that should be added to the comparison. You can select more than one device.

restrict list:

show all (including archived), 2024, 2023
v1.26
log 01. 15:28:26

#0 checking url part for id 8410 +0s ... 0s

#1 checking url part for id 10052 +0s ... 0s

#2 not redirecting to Ajax server +0s ... 0s

#3 did not recreate cache, as it is less than 5 days old! Created at Sat, 01 Jun 2024 05:37:57 +0200 +0.001s ... 0.001s

#4 composed specs +0.034s ... 0.034s

#5 did output specs +0s ... 0.035s

#6 getting avg benchmarks for device 8410 +0.003s ... 0.038s

#7 got single benchmarks 8410 +0.043s ... 0.081s

#8 getting avg benchmarks for device 10052 +0.003s ... 0.084s

#9 got single benchmarks 10052 +0.007s ... 0.09s

#10 got avg benchmarks for devices +0s ... 0.09s

#11 No cached benchmark found, getting uncached values +0.032s ... 0.122s

#12 No cached benchmark found, getting uncached values +0.003s ... 0.125s

#13 min, max, avg, median took s +0.121s ... 0.246s

#14 return log +0.027s ... 0.273s

Please share our article, every link counts!
> Expert Reviews and News on Laptops, Smartphones and Tech Innovations > Benchmarks / Tech > Processor Comparison - Head 2 Head
Redaktion, 2017-09- 8 (Update: 2023-07- 1)