Notebookcheck Logo

Intel Core i5-L16G7 vs AMD Ryzen 5 4680U

Intel Core i5-L16G7

► remove from comparison Intel i5-L16G7

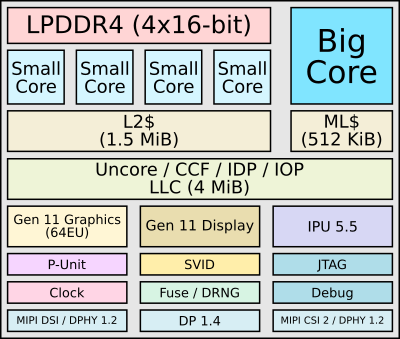
The Core i5-L16G7 is an SoC with 5 processor cores based on the Lakefield architecture. It uses one fast Sunny Cove core (known from Ice-Lake CPUs but without AVX512) with up to 3 GHz and 4 small Tremont cores (Atom / Celeron) with up to 2.8 GHz. Using all 5 cores, the CPU can reach up to 1.8 GHz, base clock speed is 1.4 GHz. The CPU does not support HyperThreading / SMT. The rest of the SoC is similar to the Ice Lake chips, like the Gen 11 graphics card with 64 EUs (similar to the Iris Plus G7 but only clocked at 500 MHz and using the UHD Graphics name).

Performance

The average L16G7 in our database is in the same league as the Pentium N6000 and also the Core i3-1110G4, as far as multi-thread benchmark scores are concerned. This kind of performance is only sufficient for basic day-to-day activities as of late 2023.

Your mileage may vary depending on how competent the cooling solution of your laptop is and how high the CPU power limits are.

With a specified TDP of 7 Watt (PL1, 9.5 Watt PL2), the CPU is well suited for thin and light laptops and Windows based tablets. / 2-in-1. Intel claims that the standby power was greatly reduced (91% better compared to the i7-8500Y with 2.5 mW). The SoC is manufactured in 10nm and uses the Intel Foveros 3D Packaging technology. Foveros is used to stack the in 22FFL manufactured I/O die, the compute die in 10nm and up to 8 GB LPDDR4X-4267.

AMD Ryzen 5 4680U

► remove from comparison AMD R5 4680U

The AMD Ryzen 5 4680U is a semi-custom APU of the Renoir family designed for Microsoft devices. The 4680U integrates six CPU cores based on the Zen 2 microarchitecture clocked at 2.2 GHz (base) to 4 GHz (Boost) with SMT support for a total 12 threads. The two advantages a 4680U has over the older Ryzen 5 4600U are its higher base clock speed and a faster iGPU.

Architecture

The chip is manufactured on the modern 7 nm TSMC process and in part thanks to this fact, AMD advertises a 2x performance per watt improvement over the 12 nm Ryzen 3000 mobile processors. The built-in dual-channel memory controller supports LPDDR4-4266 RAM. Furthermore, 8 MB of L3 cache can be found on the chip.

Just like the other mobile Ryzen 4000 CPUs, a 4680U supports PCI-Express 3.0. Please go to our Renoir processor hub page for additional information on the product family.

Performance

Multi-thread performance is most comparable to the Ryzen 7 4700U and the Core i5-10500H, the latter being a much more power-hungry chip. This makes the Ryzen a more than decent CPU for most tasks, as of early 2022.

Graphics

In addition to the six CPU cores, the APU also integrates a DX 12 compatible Radeon RX Vega 7 graphics adapter with 7 CUs (448 unified shaders) at up to 1,500 MHz. The Vega iGPU will have no trouble HW-decoding AVC, HEVC and VP9 videos, but the newer AV1 codec will only be decoded via software. In terms of gaming, we are looking at an MX150-level performance. Pretty much all games released in 2020 can be played on low to medium settings in 720p on this graphics adapter.

Power consumption

This Ryzen 5 series chip has a default TDP (also known as the long-term power limit) of 15 W, a value that laptop makers - Microsoft, in this case - are free to change to anything between 10 W and 25 W, with clock speeds and performance changing accordingly as a result. Indeed, we saw the CPU consume roughly 23 watts when subjected to our usual stress testing routine.

The 7 nm TSMC process this Ryzen is built with makes for very decent, as of mid 2022, energy efficiency.

ModelIntel Core i5-L16G7AMD Ryzen 5 4680U
SeriesIntel LakefieldAMD Renoir (Ryzen 4000 APU)
CodenameLakefieldRenoir-U (Zen 2)
Series: Renoir (Ryzen 4000 APU) Renoir-U (Zen 2)
Intel Core i5-L16G7 « 1.4 - 3 GHz5 / 5 cores
Intel Core i3-L13G4 compare0.8 - 2.8 GHz5 / 5 cores4 MB L3
AMD Ryzen 7 4980U compare2 - 4.4 GHz8 / 16 cores8 MB L3
AMD Ryzen 7 4800U compare1.8 - 4.2 GHz8 / 16 cores8 MB L3
AMD Ryzen 7 4700U compare2 - 4.1 GHz8 / 8 cores8 MB L3
AMD Ryzen 5 4680U « 2.2 - 4 GHz6 / 12 cores8 MB L3
AMD Ryzen 5 4600U compare2.1 - 4 GHz6 / 12 cores8 MB L3
AMD Ryzen 5 4500U compare2.3 - 4 GHz6 / 6 cores8 MB L3
AMD Ryzen 3 4300U compare2.7 - 3.7 GHz4 / 4 cores4 MB L3
Clock1400 - 3000 MHz2200 - 4000 MHz
Cores / Threads5 / 56 / 12
TDP7 Watt15 Watt
Technology10 nm7 nm
max. Temp.100 °C105 °C
SocketCSP1016FP6
FeaturesLPDDR4x-4266 RAM, PCIe 3, 4 GT/s bus, MMX, SSE, SSE2, SSE3, SSSE3, SSE4.1, SSE4.2, VMX, SMEP, SMAP, EIST, TM1, TM2, Turbo, SST, AES-NI, RDRAND, RDSEED, SHALPDDR4-4266 RAM, PCIe 3, MMX, SSE, SSE2, SSE3, SSSE3, SSE4A, SSE4.1, SSE4.2, AVX, AVX2, BMI2, ABM, FMA, ADX, SMEP, SMAP, SMT, CPB, AES-NI, RDRAND, RDSEED, SHA
iGPUIntel UHD Graphics G7 (Lakefield GT2 64 EU) (200 - 500 MHz)AMD Radeon RX Vega 7 ( - 1500 MHz)
Architecturex86x86
$281 U.S.
Announced
Manufacturerark.intel.comwww.amd.com
L1 Cache384 KB
L2 Cache3 MB
L3 Cache8 MB

Benchmarks

Performance Rating - CB R15 + R20 + 7-Zip + X265 + Blender + 3DM11 CPU - i5-L16G7
21.1 pt (29%)
Performance Rating - CB R15 + R20 + 7-Zip + X265 + Blender + 3DM11 CPU - R5 4680U
31.1 pt (43%)
Cinebench R23 - Cinebench R23 Multi Core
1810 Points (2%)
7073 Points (7%)
Cinebench R23 - Cinebench R23 Single Core
710 Points (30%)
1163 Points (49%)
Cinebench R20 - Cinebench R20 CPU (Single Core)
min: 276     avg: 282.5     median: 282.5 (31%)     max: 289 Points
451 Points (50%)
Cinebench R20 - Cinebench R20 CPU (Multi Core)
min: 609     avg: 648     median: 647.5 (2%)     max: 686 Points
2478 Points (6%)
Cinebench R15 - Cinebench R15 CPU Multi 64 Bit
255 Points (2%)
1291 Points (8%)
Cinebench R15 - Cinebench R15 CPU Single 64 Bit
min: 88.3     avg: 89.5     median: 89.5 (27%)     max: 90.7 Points
170 Points (51%)
Cinebench R11.5 - Cinebench R11.5 CPU Multi 64 Bit
3.2 Points (4%)
15.6 Points (20%)
Cinebench R11.5 - Cinebench R11.5 CPU Single 64 Bit
1.4 Points (35%)
2 Points (50%)
Cinebench R10 - Cinebench R10 Rend. Single (32bit)
4079 Points (25%)
5301 Points (32%)
Cinebench R10 - Cinebench R10 Rend. Multi (32bit)
9003 Points (7%)
31826 Points (23%)
wPrime 2.10 - wPrime 2.0 1024m *
879 s (10%)
248.6 s (3%)
wPrime 2.10 - wPrime 2.0 32m *
28.6 s (6%)
8.2 s (2%)
WinRAR - WinRAR 4.0
3576 Points (6%)
7-Zip 18.03 - 7-Zip 18.03 Multli Thread 4 runs
min: 7230     avg: 7587     median: 7586.5 (4%)     max: 7943 MIPS
32745 MIPS (19%)
7-Zip 18.03 - 7-Zip 18.03 Single Thread 4 runs
min: 3174     avg: 3211     median: 3211 (38%)     max: 3248 MIPS
4077 MIPS (49%)
HWBOT x265 Benchmark v2.2 - HWBOT x265 4k Preset
min: 1.44     avg: 1.5     median: 1.5 (3%)     max: 1.48 fps
7.7 fps (13%)
TrueCrypt - TrueCrypt Serpent
1.2 GB/s (0%)
TrueCrypt - TrueCrypt Twofish
1.4 GB/s (24%)
TrueCrypt - TrueCrypt AES
8.3 GB/s (22%)
Blender - Blender 2.79 BMW27 CPU *
min: 1897     avg: 2027     median: 2026.5 (14%)     max: 2156 Seconds
458 Seconds (3%)
R Benchmark 2.5 - R Benchmark 2.5 *
min: 0.897     avg: 0.9     median: 0.9 (20%)     max: 0.987 sec
0.7 sec (15%)
Super Pi mod 1.5 XS 1M - Super Pi mod 1.5 XS 1M *
11.7 s (3%)
10.5 s (2%)
Super Pi mod 1.5 XS 2M - Super Pi mod 1.5 XS 2M *
25.9 s (1%)
24.6 s (1%)
Super Pi Mod 1.5 XS 32M - Super Pi mod 1.5 XS 32M *
622 s (3%)
581 s (3%)
3DMark 11 - 3DM11 Performance Physics
min: 2926     avg: 3015     median: 3015 (8%)     max: 3104 Points
10051 Points (27%)
3DMark - 3DMark Ice Storm Physics
26353 Points (21%)
3DMark - 3DMark Ice Storm Extreme Physics
26635 Points (22%)
3DMark - 3DMark Ice Storm Unlimited Physics
32705 Points (28%)
3DMark - 3DMark Cloud Gate Physics
min: 2831     avg: 2834     median: 2834 (7%)     max: 2837 Points
3DMark - 3DMark Fire Strike Standard Physics
min: 4138     avg: 4306     median: 4305.5 (8%)     max: 4473 Points
16642 Points (30%)
3DMark - 3DMark Time Spy CPU
1148 Points (5%)
5067 Points (21%)
Geekbench 5.5 - Geekbench 5.1 - 5.4 64 Bit Single-Core
min: 797     avg: 827     median: 826.5 (35%)     max: 856 Points
1078 Points (45%)
Geekbench 5.5 - Geekbench 5.1 - 5.4 64 Bit Multi-Core
min: 1441     avg: 1634     median: 1633.5 (3%)     max: 1826 Points
5785 Points (10%)
Mozilla Kraken 1.1 - Kraken 1.1 Total Score *
min: 1252     avg: 1278     median: 1277.5 (1%)     max: 1303 ms
877 ms (1%)
Octane V2 - Octane V2 Total Score
min: 31228     avg: 32455     median: 32455 (29%)     max: 33682 Points
47184 Points (42%)
WebXPRT 3 - WebXPRT 3 Score
min: 121     avg: 124.5     median: 124.5 (26%)     max: 128 Points
198 Points (41%)

Average Benchmarks Intel Core i5-L16G7 → 100% n=28

Average Benchmarks AMD Ryzen 5 4680U → 242% n=28

- Range of benchmark values for this graphics card
- Average benchmark values for this graphics card
* Smaller numbers mean a higher performance
1 This benchmark is not used for the average calculation

Add one or more devices and compare

In the following list you can select (and also search for) devices that should be added to the comparison. You can select more than one device.

restrict list:

show all (including archived), 2024, 2023
v1.26
log 29. 19:33:03

#0 checking url part for id 12215 +0s ... 0s

#1 checking url part for id 13178 +0s ... 0s

#2 not redirecting to Ajax server +0s ... 0s

#3 did not recreate cache, as it is less than 5 days old! Created at Tue, 28 May 2024 05:33:54 +0200 +0.001s ... 0.001s

#4 composed specs +0.027s ... 0.028s

#5 did output specs +0s ... 0.028s

#6 getting avg benchmarks for device 12215 +0.016s ... 0.044s

#7 got single benchmarks 12215 +0.01s ... 0.054s

#8 getting avg benchmarks for device 13178 +0.014s ... 0.068s

#9 got single benchmarks 13178 +0.007s ... 0.075s

#10 got avg benchmarks for devices +0s ... 0.075s

#11 min, max, avg, median took s +0.186s ... 0.261s

#12 return log +0.024s ... 0.284s

Please share our article, every link counts!
> Expert Reviews and News on Laptops, Smartphones and Tech Innovations > Benchmarks / Tech > Processor Comparison - Head 2 Head
Redaktion, 2017-09- 8 (Update: 2023-07- 1)