Notebookcheck Logo

Apple M3 Pro 12-Core vs Intel Core i9-13900K vs Apple M3

Apple M3 Pro 12-Core

► remove from comparison Apple Apple M3 Pro 12-Core

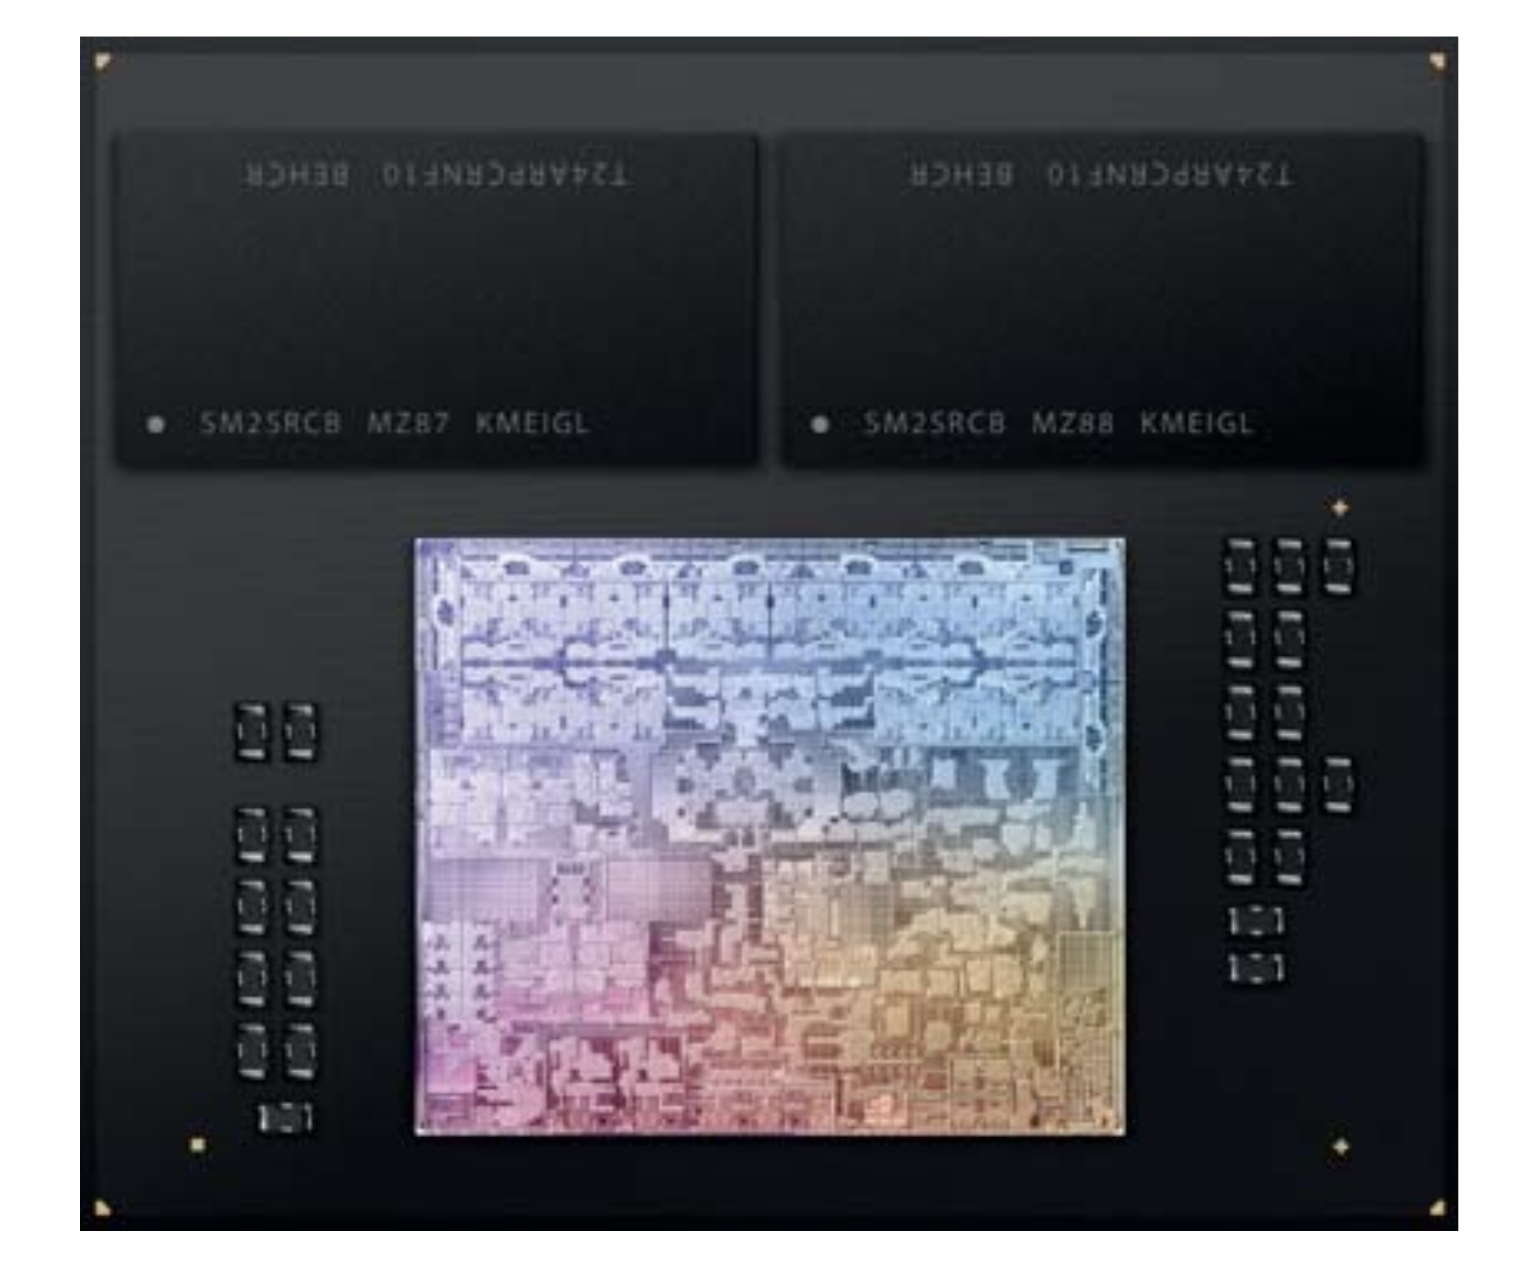
The Apple M3 Pro (12 Core) is a system on a chip (SoC) from Apple for notebooks that was launched in late 2023. It integrates a new 12-core CPU with 6 performance cores with up to 4.06 GHz and 6 efficiency cores with 2.8 GHz. There is also a slimmed-down 11-core variant with a 14-core GPU.

Compared to the M2 Pro the M3 Pro has been slimmed down somewhat and swaps two performance cores for efficiency cores. This is due to the changed core configuration, as 6 cores are now used per cluster (the M2 Pro and M3 still have 4 cores per cluster). Furthermore, the memory bus has been reduced from 256 bits to 192 bits (150 GB/s vs. 200 GB/s). However, thanks to the new architecture and higher clock rates, the new M3 Pro is still slightly faster.

The M3 Pro also integrates a new graphics card with dynamic caching, mesh shading and ray tracing acceleration via hardware. In the top model, all 18 cores of the chip are used and support up to 3 displays simultaneously (internal and 2 external).

GPU and CPU can jointly access the shared memory on the package (unified memory). This is available in 18 or 36 GB variants and offers 150 GB/s maximum bandwidth (192 bit bus).

The integrated 16-core Neural Engine has also been revised and now offers 18 TOPS peak performance (compared to 15.8 TOPS in the M2 but 35 TOPS in the new A17 Pro). The video engine now also supports AV1 decoding in hardware. H.264, HEVC and ProRes (RAW) can still be decoded and encoded.

Unfortunately, the integrated WLAN only continues to support WiFi 6E (no WiFi 7), unlike the small M3 SoC thunderbolt 4 is also supported (max 40 Gbit/s).

The chip is manufactured in the current 3nm process (N3B) at TSMC and contains 37 billion transistors (-7.5% vs. Apple M2 Pro).

Intel Core i9-13900K

► remove from comparison Intel i9-13900K

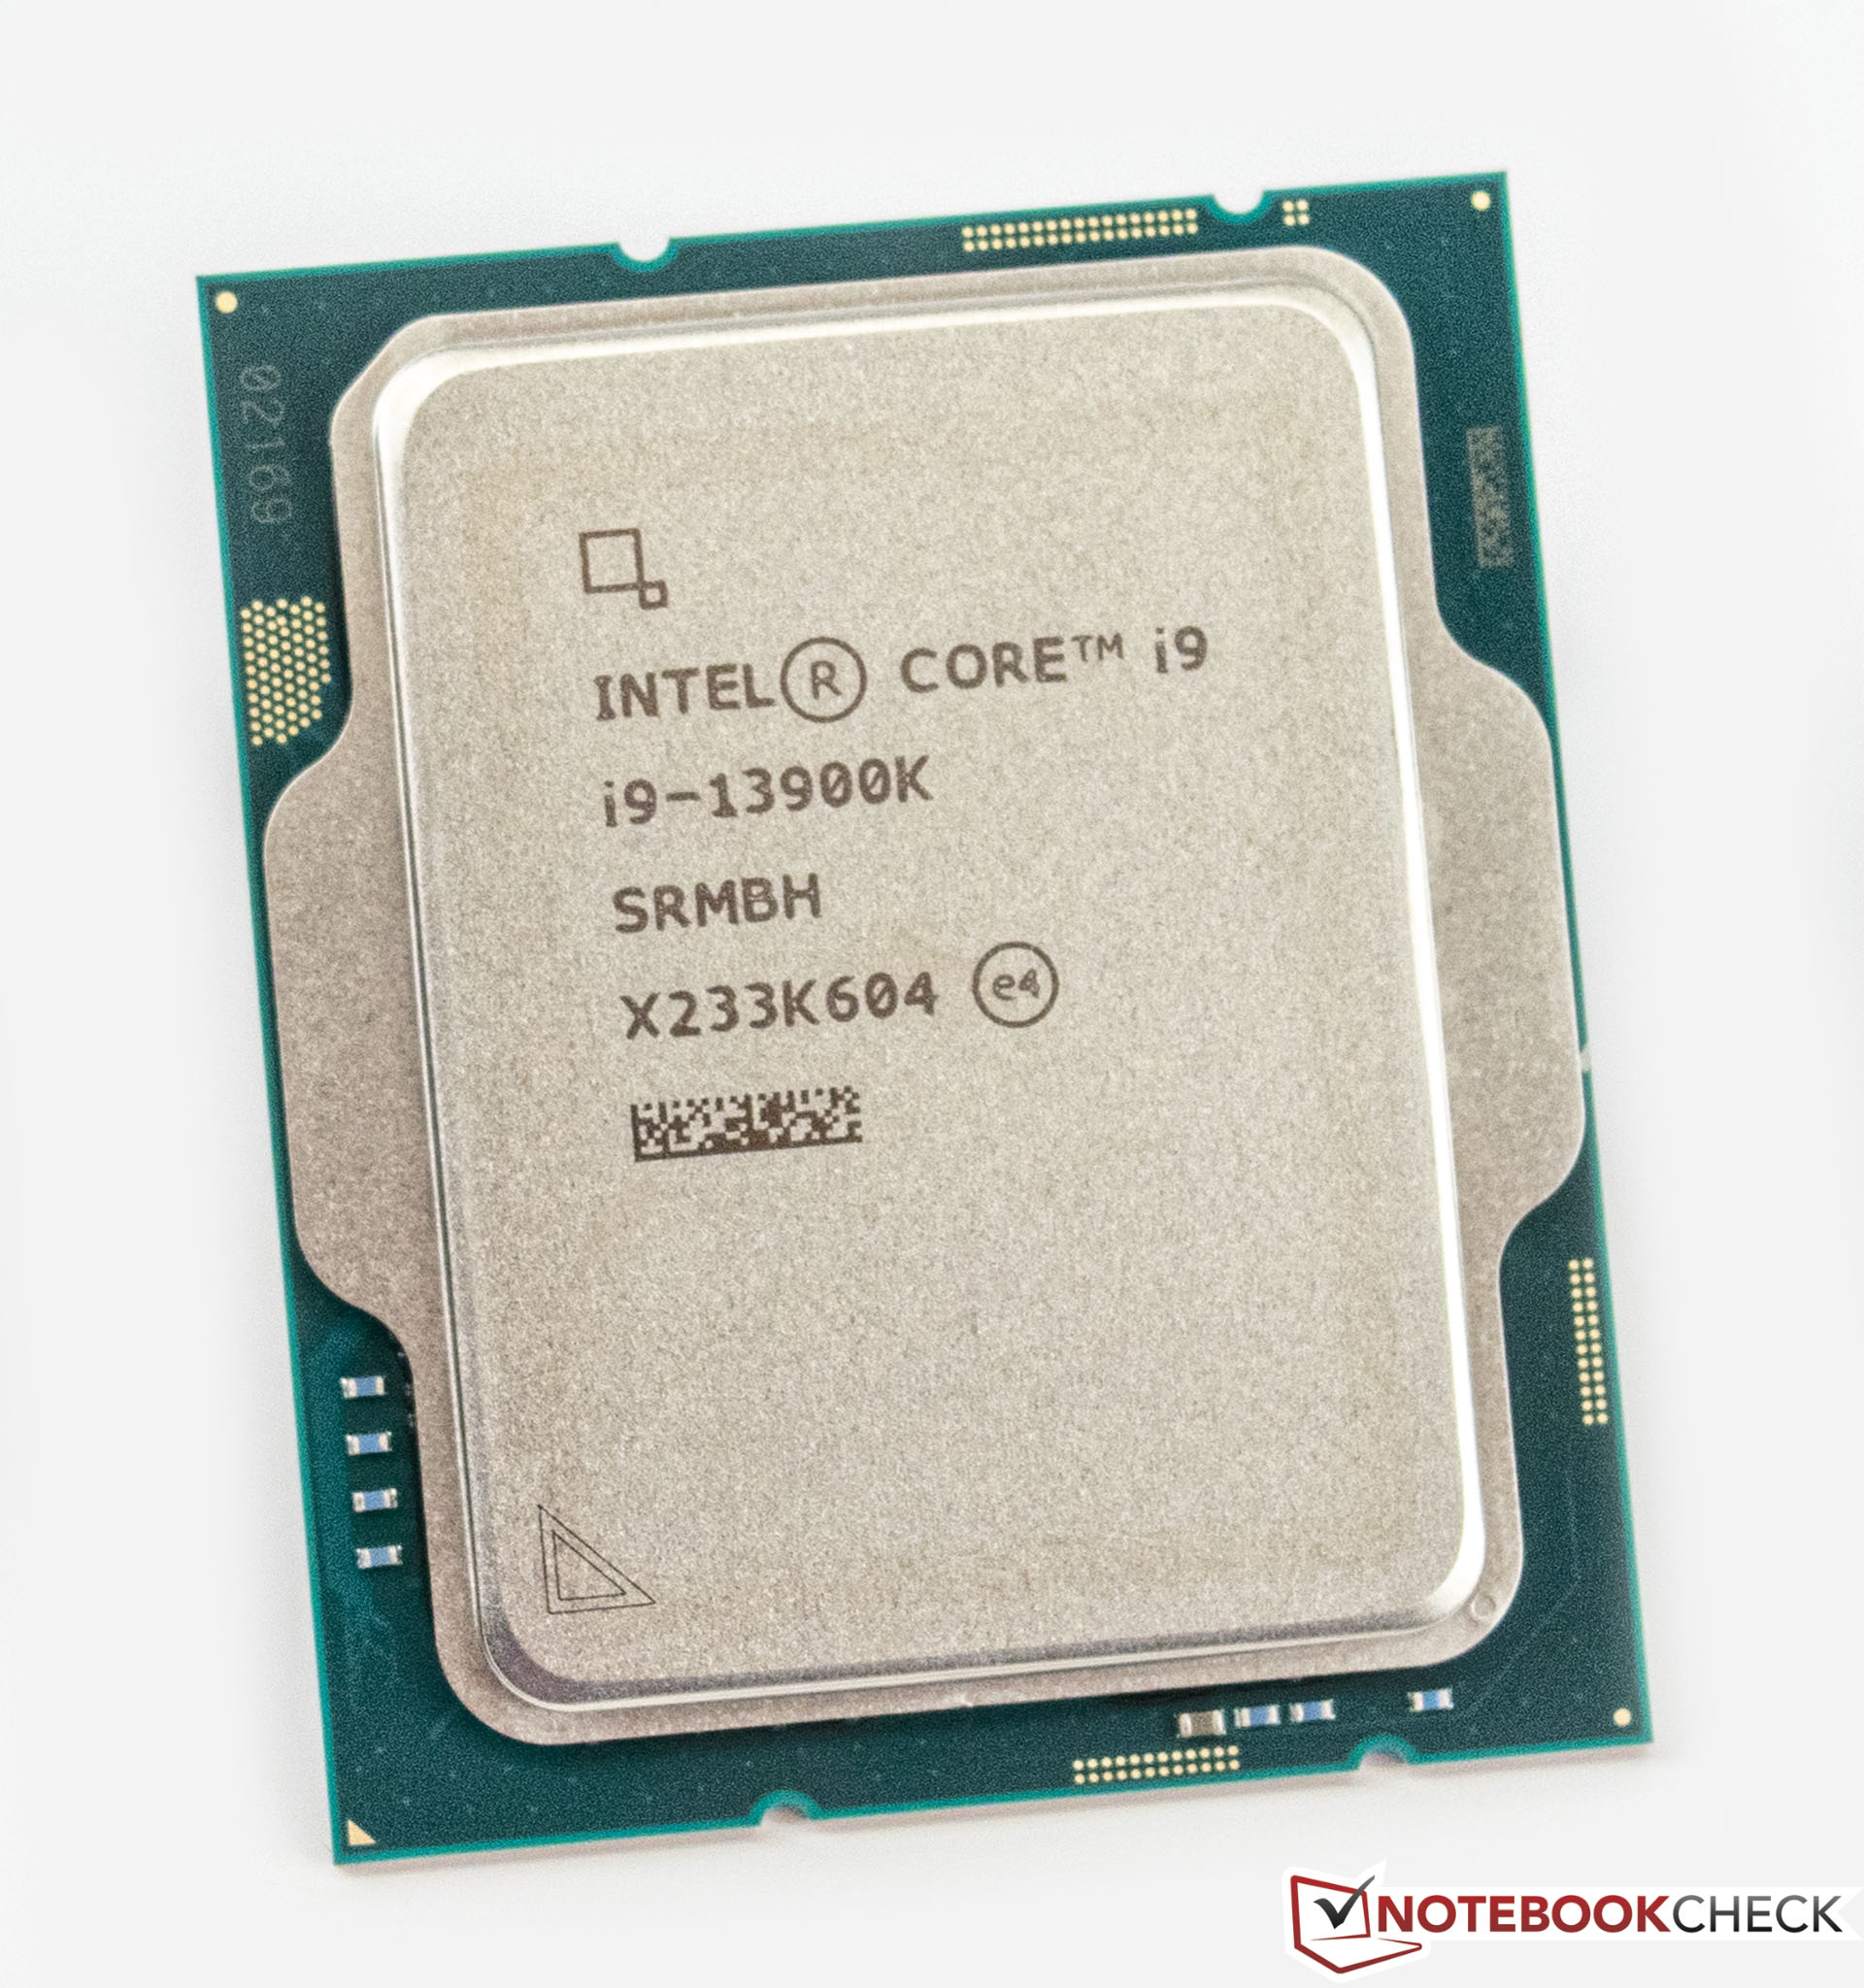
The Intel Core i9-13900K is a fast high-end desktop processor of the Raptor Lake series. It includes a hybrid architecture for the CPU cores with combined 24 cores and 32 threads. Eight fast Raptor Cove performance cores (P-cores) with HyperThreading and a clock speed of 3 - 5.8 GHz and sixteen Gracemont efficiency cores without HyperThreading and a clock speed of 2.2 - 4.3 GHz.

Thanks to the faster P-cores and more E-cores, the i9-13900K is significantly faster than the old i9-12900K (especially in multi-threaded workloads). Compared to the Raphael AMD Ryzen 9 7950X (Zen 4), the 13900K offers a slightly higher multi-thread-performance and a slightly lower single core performance. In games, the Intel CPU is currently the clear winner (at the time of announcement of the 7950X).

The 13900K is rated at 125 Watt TDP base power (PL1) and 253 Watt Turbo Power (PL2) and therefore slightly higher than the old i9-12900K.

Apple M3

► remove from comparison Apple M3

The Apple M3 is a system on a chip (SoC) from Apple for notebooks that was introduced in late 2023. It integrates a new 8-core CPU with 4 performance cores with up to 4.06 GHz and 4 efficiency cores running at up to 2.75 GHz. Apple claims that the CPU is up to 20% faster than in the old Apple M2 (3.5 GHz)

Due to the higher clock speeds and architecture improvements, the processor performance is also significantly better than the M2 in benchmarks (see e.g. Geekbench below) and can keep up with the fastest CPUs in short single-core tests (like the Raptor Lake i9-13950HX).

The M3 also integrates a new graphics adapter with dynamic caching, mesh shading and ray tracing acceleration called Apple M3 10-Core GPU. According to Apple, it is 20% faster than the GPU in the M2. The chip integrates again 10 GPU cores, but the cheaper variant only offers 8 cores (e.g. in the entry iMac). Later in early 2025 Apple also introduced a 9-core variant in the new iPad Air models. Furthermore, the GPU only supports 2 displays (an additional 6K60 display to the internal one).

Both GPU and CPU can access the unified memory on the package together. It is still available in 8, 16 and 24 GB variants and offers the same 100 GB/s maximum bandwidth (unlike the Pro models that feature a reduced memory bandwidth). 

The integrated 16-core Neural Engine has also been revised and now offers 18 TOPS peak performance (versus 15.8 TOPS in the M2 but 35 TOPS in the new A17 Pro). The video engine now supports AV1 decoding in hardware. H.264, HEVC and ProRes (RAW) can still be decoded and encoded.

Unfortunately, the integrated wireless network module only supports Wi-Fi 6E (no Wi-Fi 7) and due to the support of only a single external monitor, the chip also has to make do with no Thunderbolt 4 (Thunderbolt 3 / USB 4 support only for up to 40 Gbit/s).

The chip is manufactured on the current 3nm TSMC process (N3B most likely) and contains 25 billion transistors (+25% vs. Apple M2). The 3nm process should also contribute to the excellent efficiency of the chip. Under load, the M3 CPU consumes approximately 20 Watt.

ModelApple M3 Pro 12-CoreIntel Core i9-13900KApple M3
SeriesApple M3Intel Raptor Lake-SApple M3
Series: M3
Apple M3 Max 16-Core2.75 - 4.06 GHz16 / 16 cores
Apple M3 Max 14-Core2.75 - 4.06 GHz14 / 14 cores
Apple M3 Pro 12-Core « 2.75 - 4.06 GHz12 / 12 cores
Apple M3 Pro 11-Core2.75 - 4.06 GHz11 / 11 cores
Apple M32.75 - 4.06 GHz8 / 8 cores
Intel Core i9-13900K « 3 - 5.8 GHz24 / 32 cores36 MB L3
Intel Core i7-13700K3.4 - 5.4 GHz16 / 24 cores30 MB L3
Intel Core i5-13600K3.5 - 5.1 GHz14 / 20 cores24 MB L3
Intel Core i7-14701TE2.1 - 5.2 GHz8 / 16 cores33 MB L3
Intel Core i5-135002.5 - 4.8 GHz14 / 20 cores24 MB L3
Intel Core i5-14501TE2.2 - 5.1 GHz6 / 12 cores12 MB L3
Intel Core i5-14501E3.3 - 5.2 GHz6 / 12 cores24 MB L3
Intel Core i5-14401E2.5 - 4.7 GHz6 / 12 cores12 MB L3
Intel Core i5-14401TE2 - 4.5 GHz6 / 12 cores12 MB L3
Intel Core i5-13500T1.6 - 4.6 GHz14 / 20 cores24 MB L3
Apple M3 Max 16-Core2.75 - 4.06 GHz16 / 16 cores
Apple M3 Max 14-Core2.75 - 4.06 GHz14 / 14 cores
Apple M3 Pro 12-Core2.75 - 4.06 GHz12 / 12 cores
Apple M3 Pro 11-Core2.75 - 4.06 GHz11 / 11 cores
Apple M3 « 2.75 - 4.06 GHz8 / 8 cores
Clock2748 - 4056 MHz3000 - 5800 MHz2748 - 4056 MHz
Cores / Threads12 / 12
6 x 4.1 GHz Apple M3 P-Core
6 x 2.7 GHz Apple M3 E-Core
24 / 32
8 x 5.8 GHz Intel Raptor Cove P-Core
16 x 4.3 GHz Intel Gracemont E-Core
8 / 8
4 x 4.1 GHz Apple M3 P-Core
4 x 2.7 GHz Apple M3 E-Core
TDP27 Watt125 Watt
Transistors37000 Million25000 Million
Technology3 nm10 nm3 nm
FeaturesARMv8 Instruction SetIntel UHD Graphics 770, DDR5 5600 MT/s, DDR4 3200 MT/sARMv8 Instruction Set
iGPUApple M3 Pro 18-Core GPUIntel UHD Graphics 770 (300 - 1650 MHz)Apple M3 10-Core GPU
ArchitectureARMx86ARM
Announced
Manufacturerwww.apple.comwww.intel.comwww.apple.com
CodenameRaptor Lake
L2 Cache32 MB4 MB
L3 Cache36 MB
Die Size257 mm2
max. Temp.100 °C
SocketLGA 1700
$589 U.S.

Benchmarks

Performance Rating - CB R15 + R20 + 7-Zip + X265 + Blender + 3DM11 CPU - i9-13900K
49 pt (82%)
Restrict / Search: Model: Max. age: years
Cinebench 2024 - Cinebench 2024 CPU Single Core
143 Points (80%)
99%
1 M3 +
min: 140     avg: 141     median: 141 (79%)     max: 142 Points
Cinebench 2024 - Cinebench 2024 CPU Multi Core
1059 Points (20%)
57%
1 M3 +
min: 576     avg: 622     median: 599.5 (11%)     max: 712 Points
Cinebench R23 - Cinebench R23 Multi Core
15106 Points (14%)
min: 32592     avg: 37310     median: 38271.5 (36%)     max: 40103 Points
68%
M3 +
min: 10074     avg: 10275     median: 10298 (10%)     max: 10454 Points
Cinebench R23 - Cinebench R23 Single Core
1977 Points (83%)
min: 2203     avg: 2238     median: 2238.5 (94%)     max: 2272 Points
96%
M3 +
min: 1900     avg: 1901     median: 1900 (80%)     max: 1904 Points
Cinebench R20 - Cinebench R20 CPU (Single Core)
min: 828     avg: 849     median: 849.5 (93%)     max: 870 Points
59%
1 M3 +
504 Points (55%)
Cinebench R20 - Cinebench R20 CPU (Multi Core)
min: 13415     avg: 14459     median: 14620.5 (36%)     max: 15181 Points
19%
1 M3 +
2818 Points (7%)
Cinebench R15 - Cinebench R15 CPU Multi 64 Bit
2163 Points (14%)
min: 5321     avg: 5798     median: 5805.5 (37%)     max: 6191 Points
69%
M3 +
1499 Points (9%)
Cinebench R15 - Cinebench R15 CPU Single 64 Bit
min: 299     avg: 314.1     median: 318 (88%)     max: 328 Points
85%
1 M3 +
271 Points (75%)
Cinebench R11.5 - Cinebench R11.5 CPU Multi 64 Bit
min: 62.2     avg: 67     median: 67.5 (87%)     max: 70.78 Points
Cinebench R11.5 - Cinebench R11.5 CPU Single 64 Bit
min: 3.8     avg: 3.9     median: 3.9 (92%)     max: 3.93 Points
Cinebench R10 - Cinebench R10 Rend. Single (32bit)
min: 11661     avg: 11989     median: 12017.5 (73%)     max: 12259 Points
Cinebench R10 - Cinebench R10 Rend. Multi (32bit)
min: 85342     avg: 88253     median: 87738 (64%)     max: 92192 Points
Cinebench R10 - Cinebench R10 Rend. Multi (64bit)
min: 132000     avg: 134526     median: 133567 (85%)     max: 138969 Points
Cinebench R10 - Cinebench R10 Rend. Single (64bit)
min: 17418     avg: 17943     median: 17998.5 (22%)     max: 18355 Points
wPrime 2.10 - wPrime 2.0 1024m *
min: 79.738     avg: 84.6     median: 84.2 (1%)     max: 90.13 s
wPrime 2.10 - wPrime 2.0 32m *
min: 1.818     avg: 2.1     median: 2 (0%)     max: 2.305 s
WinRAR - WinRAR 4.0
min: 13210     avg: 14265     median: 14271 (23%)     max: 15309 Points
7-Zip 18.03 - 7-Zip 18.03 Multi Thread 4 runs
min: 127201     avg: 142777     median: 146984 (84%)     max: 148053 MIPS
7-Zip 18.03 - 7-Zip 18.03 Single Thread 4 runs
min: 7176     avg: 7343     median: 7272 (86%)     max: 7539 MIPS
X264 HD Benchmark 4.0 - x264 Pass 2
min: 247.5     avg: 261.5     median: 264.8 (89%)     max: 269 fps
X264 HD Benchmark 4.0 - x264 Pass 1
min: 412     avg: 419     median: 419.3 (97%)     max: 425.5 fps
HWBOT x265 Benchmark v2.2 - HWBOT x265 4k Preset
min: 34.5     avg: 39.9     median: 40.7 (72%)     max: 42.6 fps
TrueCrypt - TrueCrypt Serpent
min: 2.6     avg: 2.9     median: 2.9 (85%)     max: 3 GB/s
TrueCrypt - TrueCrypt Twofish
min: 5.2     avg: 5.4     median: 5.4 (93%)     max: 5.4 GB/s
TrueCrypt - TrueCrypt AES
min: 20.5     avg: 23.3     median: 22.9 (60%)     max: 27 GB/s
Blender - Blender 3.3 Classroom CPU *
314 Seconds (4%)
min: 136     avg: 145.2     median: 140.5 (2%)     max: 174 Seconds
61%
M3 +
min: 491     avg: 590     median: 517 (7%)     max: 761 Seconds
Blender - Blender 2.79 BMW27 CPU *
327 Seconds (2%)
min: 80     avg: 85.7     median: 84 (1%)     max: 101 Seconds
66%
M3 +
min: 474     avg: 509     median: 494 (3%)     max: 558 Seconds
R Benchmark 2.5 - R Benchmark 2.5 *
min: 0.3468     avg: 0.4     median: 0.4 (8%)     max: 0.3911 sec
3DMark 06 - CPU - 3DMark 06 - CPU
min: 19989     avg: 20578     median: 20192 (43%)     max: 21934 Points
Super Pi mod 1.5 XS 1M - Super Pi mod 1.5 XS 1M *
min: 5.655     avg: 5.7     median: 5.7 (1%)     max: 5.86 s
Super Pi mod 1.5 XS 2M - Super Pi mod 1.5 XS 2M *
min: 12.287     avg: 12.6     median: 12.5 (1%)     max: 13.193 s
Super Pi Mod 1.5 XS 32M - Super Pi mod 1.5 XS 32M *
min: 289.628     avg: 296.6     median: 293.3 (1%)     max: 310.125 s
3DMark Vantage - 3DM Vant. Perf. CPU no Physx
min: 86915     avg: 97290     median: 96473 (74%)     max: 112434 Points
3DMark 11 - 3DM11 Performance Physics
min: 29023     avg: 31289     median: 31187.5 (77%)     max: 33181 Points
3DMark - 3DMark Ice Storm Physics
min: 79257     avg: 97847     median: 97246.5 (79%)     max: 111988 Points
3DMark - 3DMark Ice Storm Extreme Physics
min: 80320     avg: 96904     median: 97919.5 (79%)     max: 102987 Points
3DMark - 3DMark Ice Storm Unlimited Physics
min: 83056     avg: 98634     median: 97311 (78%)     max: 105981 Points
3DMark - 3DMark Cloud Gate Physics
min: 26626     avg: 29034     median: 29044.5 (73%)     max: 30955 Points
3DMark - 3DMark Fire Strike Standard Physics
min: 46013     avg: 51456     median: 51140 (91%)     max: 54226 Points
3DMark - 3DMark Time Spy CPU
min: 16236     avg: 20507     median: 20037 (84%)     max: 22794 Points
Geekbench 6.4 - Geekbench 6.4 Single-Core
3138 Points (78%)
3070 Points (77%)
97%
M3 +
min: 2994     avg: 3057     median: 3054 (76%)     max: 3130 Points
Geekbench 6.4 - Geekbench 6.4 Multi-Core
15480 Points (60%)
20800 Points (81%)
77%
M3 +
min: 11752     avg: 11921     median: 11966 (46%)     max: 12066 Points
Geekbench 5.5 - Geekbench 5.1 - 5.5 64 Bit Single-Core
2327 Points (91%)
min: 2106     avg: 2237     median: 2286 (89%)     max: 2290 Points
97%
M3 +
min: 1286     avg: 2092     median: 2256 (88%)     max: 2350 Points
Geekbench 5.5 - Geekbench 5.1 - 5.5 64 Bit Multi-Core
15298 Points (27%)
min: 22448     avg: 23743     median: 24033 (43%)     max: 24157 Points
69%
M3 +
min: 10402     avg: 10603     median: 10570 (19%)     max: 10774 Points
Geekbench 5.0 - Geekbench 5.0 64 Bit Single-Core
min: 2148     avg: 2191     median: 2197 (10%)     max: 2246 Points
Geekbench 5.0 - Geekbench 5.0 64 Bit Multi-Core
min: 22024     avg: 23446     median: 23664 (75%)     max: 24021 Points
Geekbench 4.4 - Geekbench 4.1 - 4.4 64 Bit Single-Core
min: 9218     avg: 9542     median: 9598 (96%)     max: 9683 Points
Geekbench 4.4 - Geekbench 4.1 - 4.4 64 Bit Multi-Core
min: 77347     avg: 84105     median: 85336 (85%)     max: 86695 Points
Mozilla Kraken 1.1 - Kraken 1.1 Total Score *
376.2 ms (0%)
min: 423     avg: 430.6     median: 432 (1%)     max: 438 ms
104%
M3 +
min: 322.8     avg: 350.3     median: 362.8 (0%)     max: 373.2 ms
Octane V2 - Octane V2 Total Score
96501 Points (71%)
100%
1 M3 +
min: 92645     avg: 95595     median: 96622 (71%)     max: 98093 Points
WebXPRT 4 - WebXPRT 4 Score
min: 304     avg: 317.6     median: 316 (87%)     max: 335 Points
99%
1 M3 +
min: 313     avg: 314     median: 314 (86%)     max: 315 Points
WebXPRT 3 - WebXPRT 3 Score
427 Points (77%)
min: 338     avg: 364     median: 368 (66%)     max: 382 Points
104%
M3 +
min: 423     avg: 438.7     median: 445 (80%)     max: 448 Points
Antutu v10 - AnTuTu v10 Total Score
100%
1 M3 +
min: 2045290     avg: 2096340     median: 2096340 (70%)     max: 2147390 Points
Antutu v10 - AnTuTu v10 CPU
100%
1 M3 +
min: 538633     avg: 555031     median: 555030 (16%)     max: 571428 Points
PassMark PerformanceTest Mobile V1 - PerformanceTest Mobile V1 CPU Tests
100%
1 M3 +
min: 21270     avg: 21339     median: 21339 (3%)     max: 21408 Points
CrossMark - CrossMark Overall
1977 Points (74%)
min: 2263     avg: 2497     median: 2580 (96%)     max: 2589 Points
93%
M3 +
min: 1847     avg: 1850     median: 1847 (69%)     max: 1857 Points
Power Consumption - Prime95 Power Consumption - external Monitor *
min: 228     avg: 354.3     median: 359 (62%)     max: 471 Watt
Power Consumption - Cinebench R15 Multi Power Consumption - external Monitor *
47.9 Watt (9%)
min: 349     avg: 392.5     median: 370.5 (68%)     max: 480 Watt
Power Consumption - Geekbench 5.5 Power Consumption 150cd *
100%
1 M3 +
min: 7.79     avg: 7.9     median: 7.9 (3%)     max: 8.01 Watt
Power Consumption - Idle Power Consumption - external Monitor *
5.8 Watt (4%)
206%
1 M3 +
min: 2.63     avg: 2.8     median: 2.8 (2%)     max: 2.87 Watt
Power Consumption - Idle Power Consumption 150cd 1min *
7.5 Watt (8%)
189%
1 M3 +
min: 2.6     avg: 3.7     median: 3.9 (4%)     max: 4.7 Watt
Power Consumption - Power Efficiency - Cinebench R15 Multi external Monitor
45.2 Points per Watt (34%)
min: 12.9     avg: 15     median: 15.2 (11%)     max: 16.8 Points per Watt

Average Benchmarks Apple M3 Pro 12-Core → 100% n=12

Average Benchmarks Intel Core i9-13900K → 170% n=12

Average Benchmarks Apple M3 → 84% n=12

- Range of benchmark values for this graphics card
red legend - Average benchmark values for this graphics card
* Smaller numbers mean a higher performance
1 This benchmark is not used for the average calculation

v1.33
log 19. 12:12:55

#0 ran 0s before starting gpusingle class +0s ... 0s

#1 checking url part for id 15115 +0s ... 0s

#2 checking url part for id 14625 +0s ... 0s

#3 checking url part for id 15110 +0s ... 0s

#4 redirected to Ajax server, took 1755598375s time from redirect:0 +0s ... 0s

#5 did not recreate cache, as it is less than 5 days old! Created at Tue, 19 Aug 2025 05:19:27 +0200 +0s ... 0s

#6 composed specs +0.009s ... 0.01s

#7 did output specs +0s ... 0.01s

#8 getting avg benchmarks for device 15115 +0.001s ... 0.01s

#9 got single benchmarks 15115 +0.004s ... 0.014s

#10 getting avg benchmarks for device 14625 +0.004s ... 0.018s

#11 got single benchmarks 14625 +0.022s ... 0.04s

#12 getting avg benchmarks for device 15110 +0.001s ... 0.041s

#13 got single benchmarks 15110 +0.007s ... 0.048s

#14 got avg benchmarks for devices +0s ... 0.048s

#15 min, max, avg, median took s +0.052s ... 0.1s

#16 return log +0s ... 0.1s

Please share our article, every link counts!
Mail Logo
> Expert Reviews and News on Laptops, Smartphones and Tech Innovations > Benchmarks / Tech > Processor Comparison - Head 2 Head
Redaktion, 2017-09- 8 (Update: 2023-07- 1)