Alldocube M8 T801 Tablet Review
")
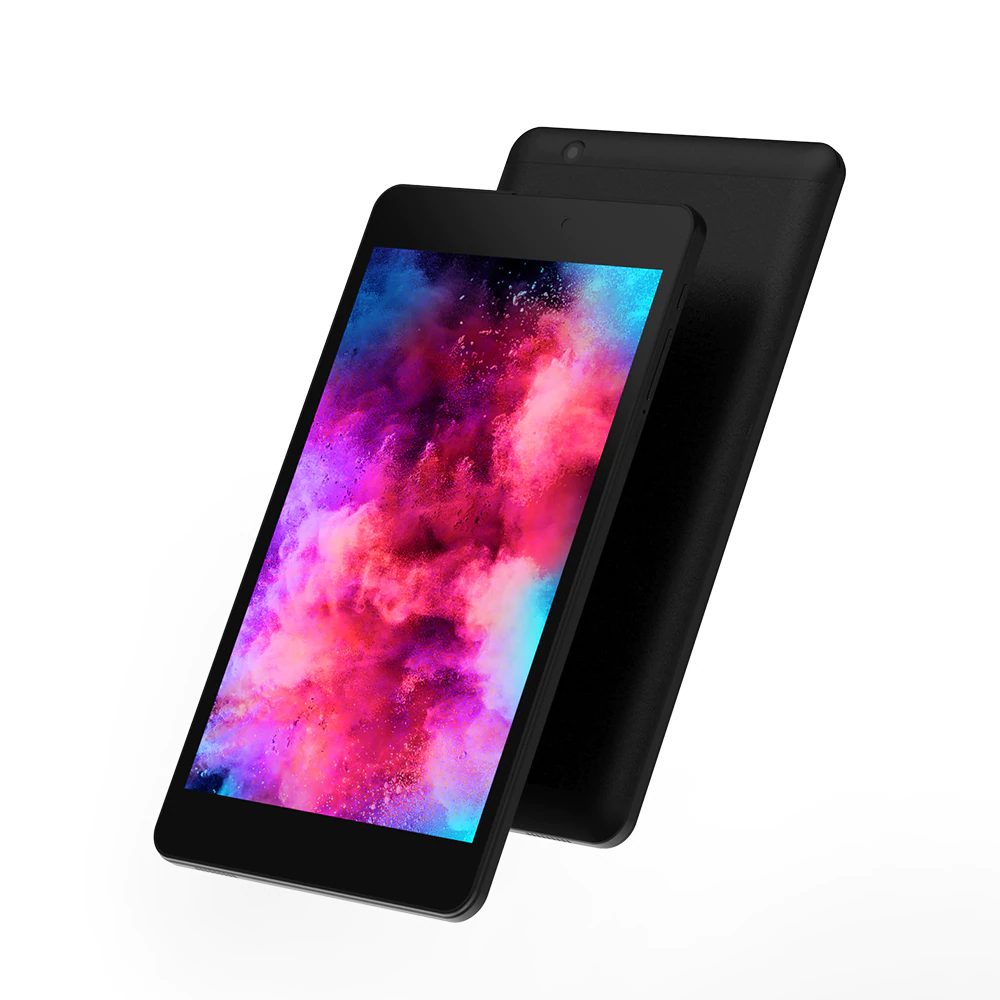
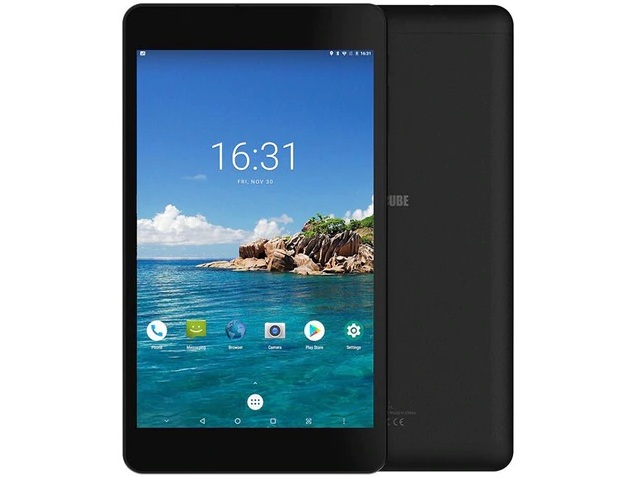
The Alldocube M8 is a budget 8-inch Android tablet notable for its 16:10 display. The unit retails for just $125 to $150 USD to compete directly with other low-end models like the Lenovo Tab 4 8, Huawei MediaPad M5 lite, and the Asus ZenPad 3 8.0.
More information can be found on the official M8 product page here. The unit is in stock on both Amazon and Aliexpress.
Case
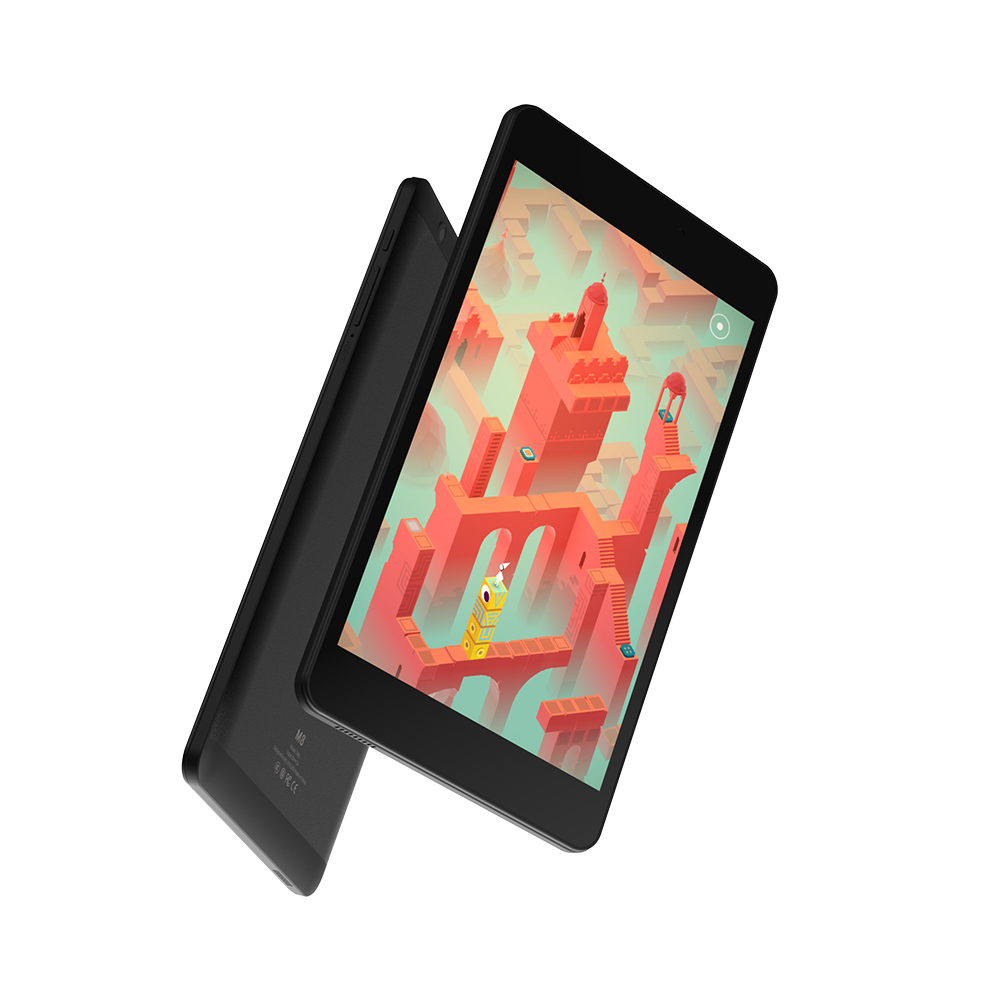
The Alldocube M8 is slightly thicker and heavier than many other 8-inch tablets with the exception of the Amazon Fire HD 8 2018. On the plus side, the chassis feels slightly stronger and more rigid as a result. Pricier, thinner tablets with larger screens like the Alldocube X can actually feel more fragile than the M8. Attempting to twist the unit results in only slight flexing and creaking.
Connectivity
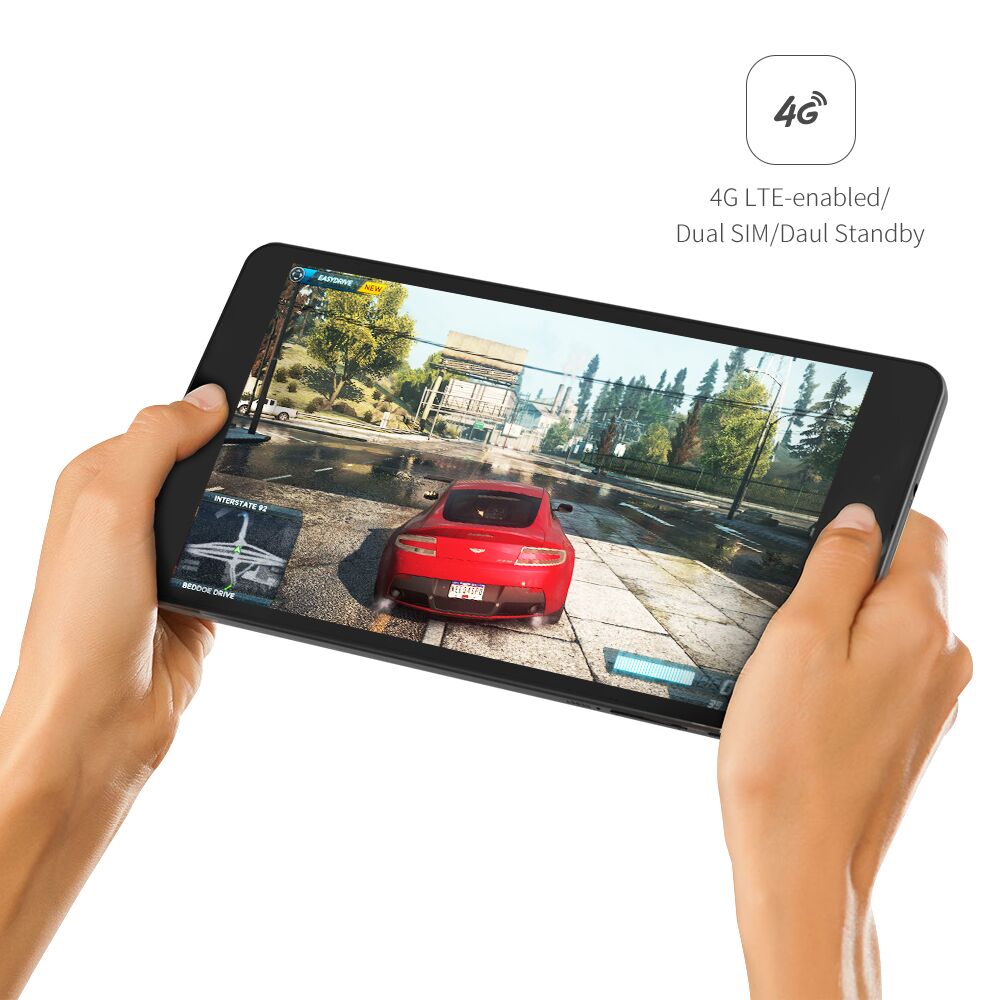
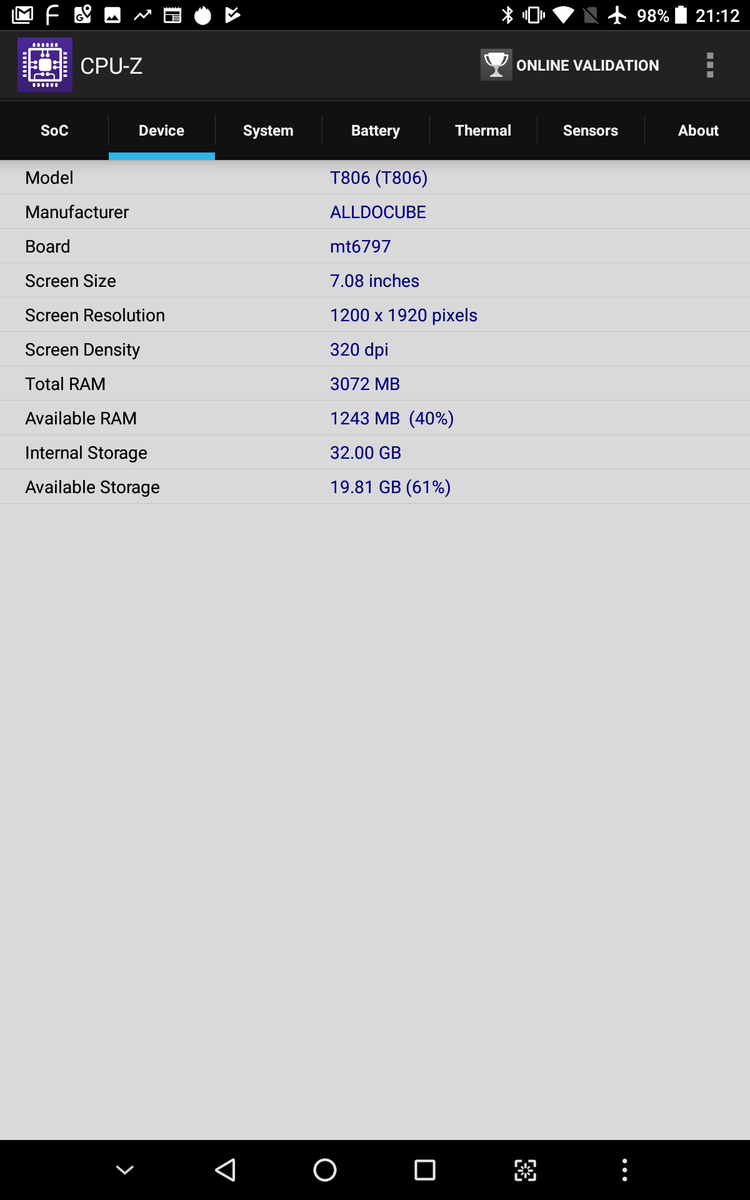
Our T801 SKU omits 4G LTE and an SD card reader for a cheaper price in contrast to the T806 SKU. The tablet still relies on micro-USB for charging and data.
Communication
Wireless is up to 1x1 802.11ac with integrated Bluetooth 4.2. Maximum transfer rate is still less than half that of the Apple iPad 6. We otherwise didn't experience any connectivity issues during our time with the unit.
Cameras
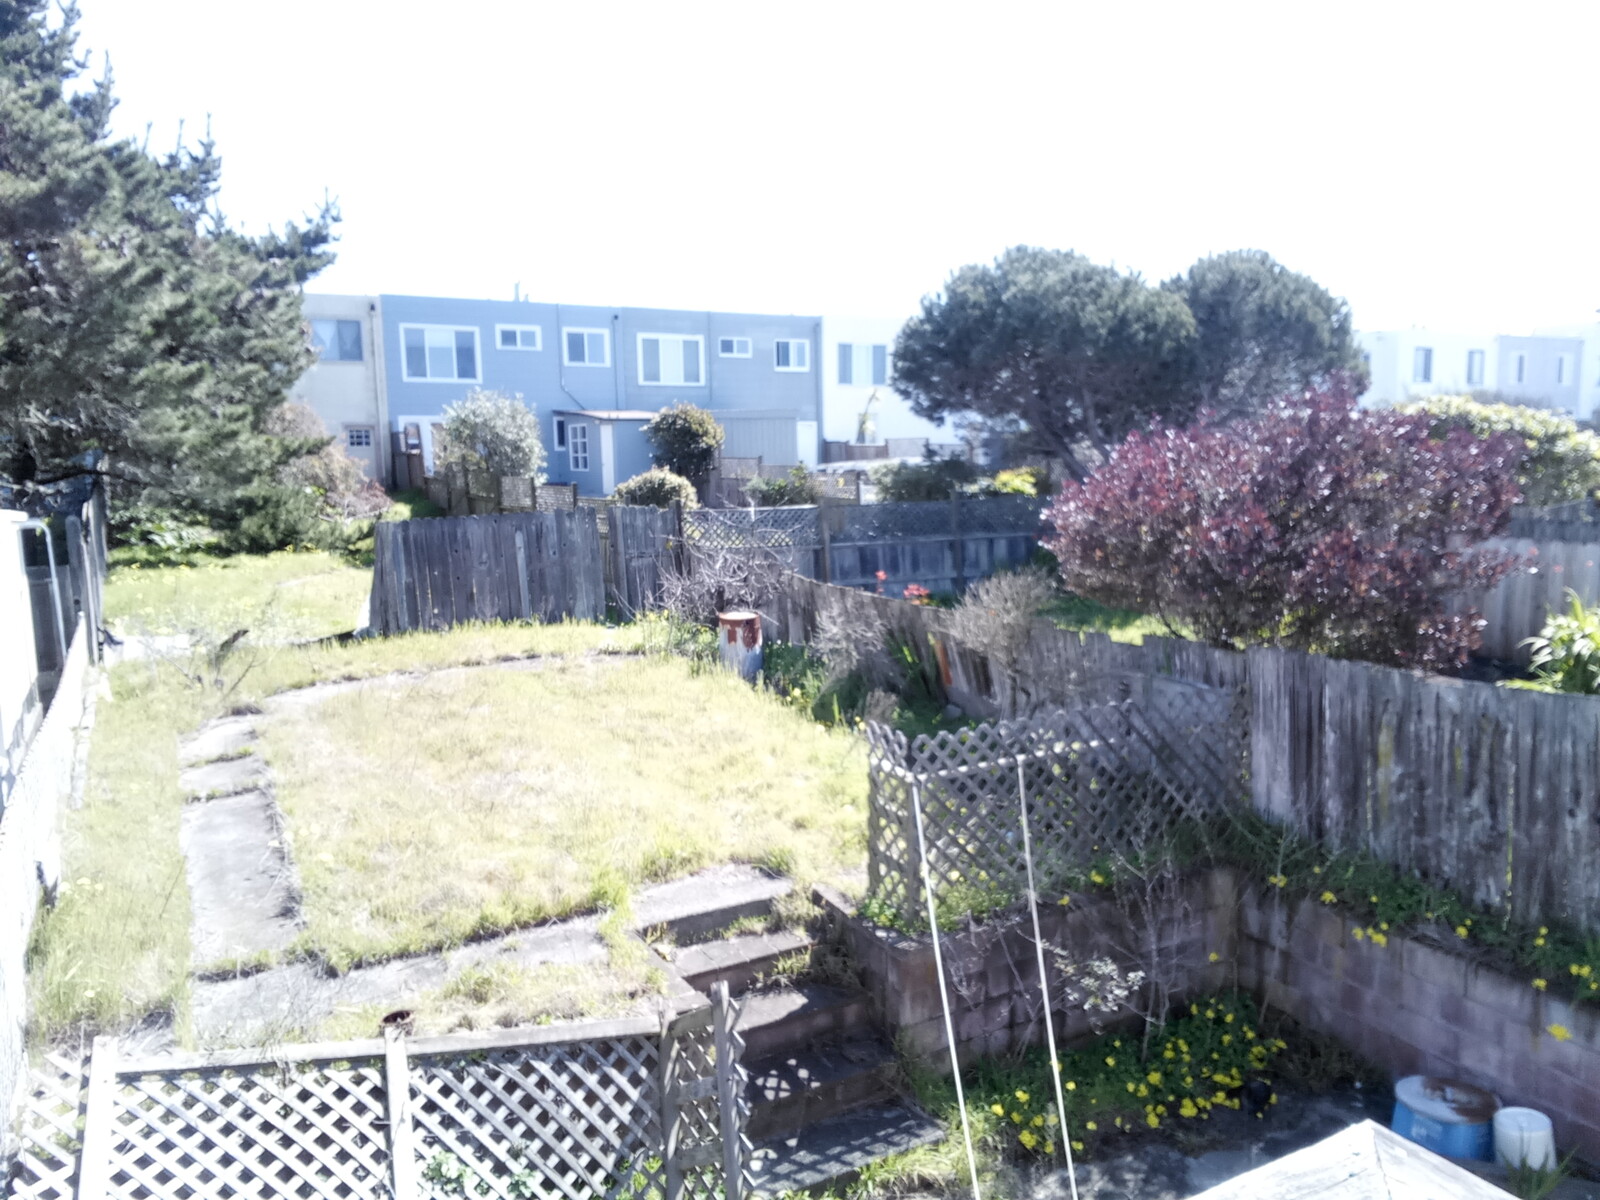
The rear 5 MP and front 2 MP cameras hold nothing special. Quality is very poor not unlike your typical budget tablet with overexposed pictures and muddy colors.
Accessories and Warranty
Included extras are a micro-USB cable, 10 W AC adapter (5 V/2 A), and the usual paperwork.
The standard one-year limited warranty applies, but the buyer will likely have to pay for overseas shipping.
Input Devices
Keyboard
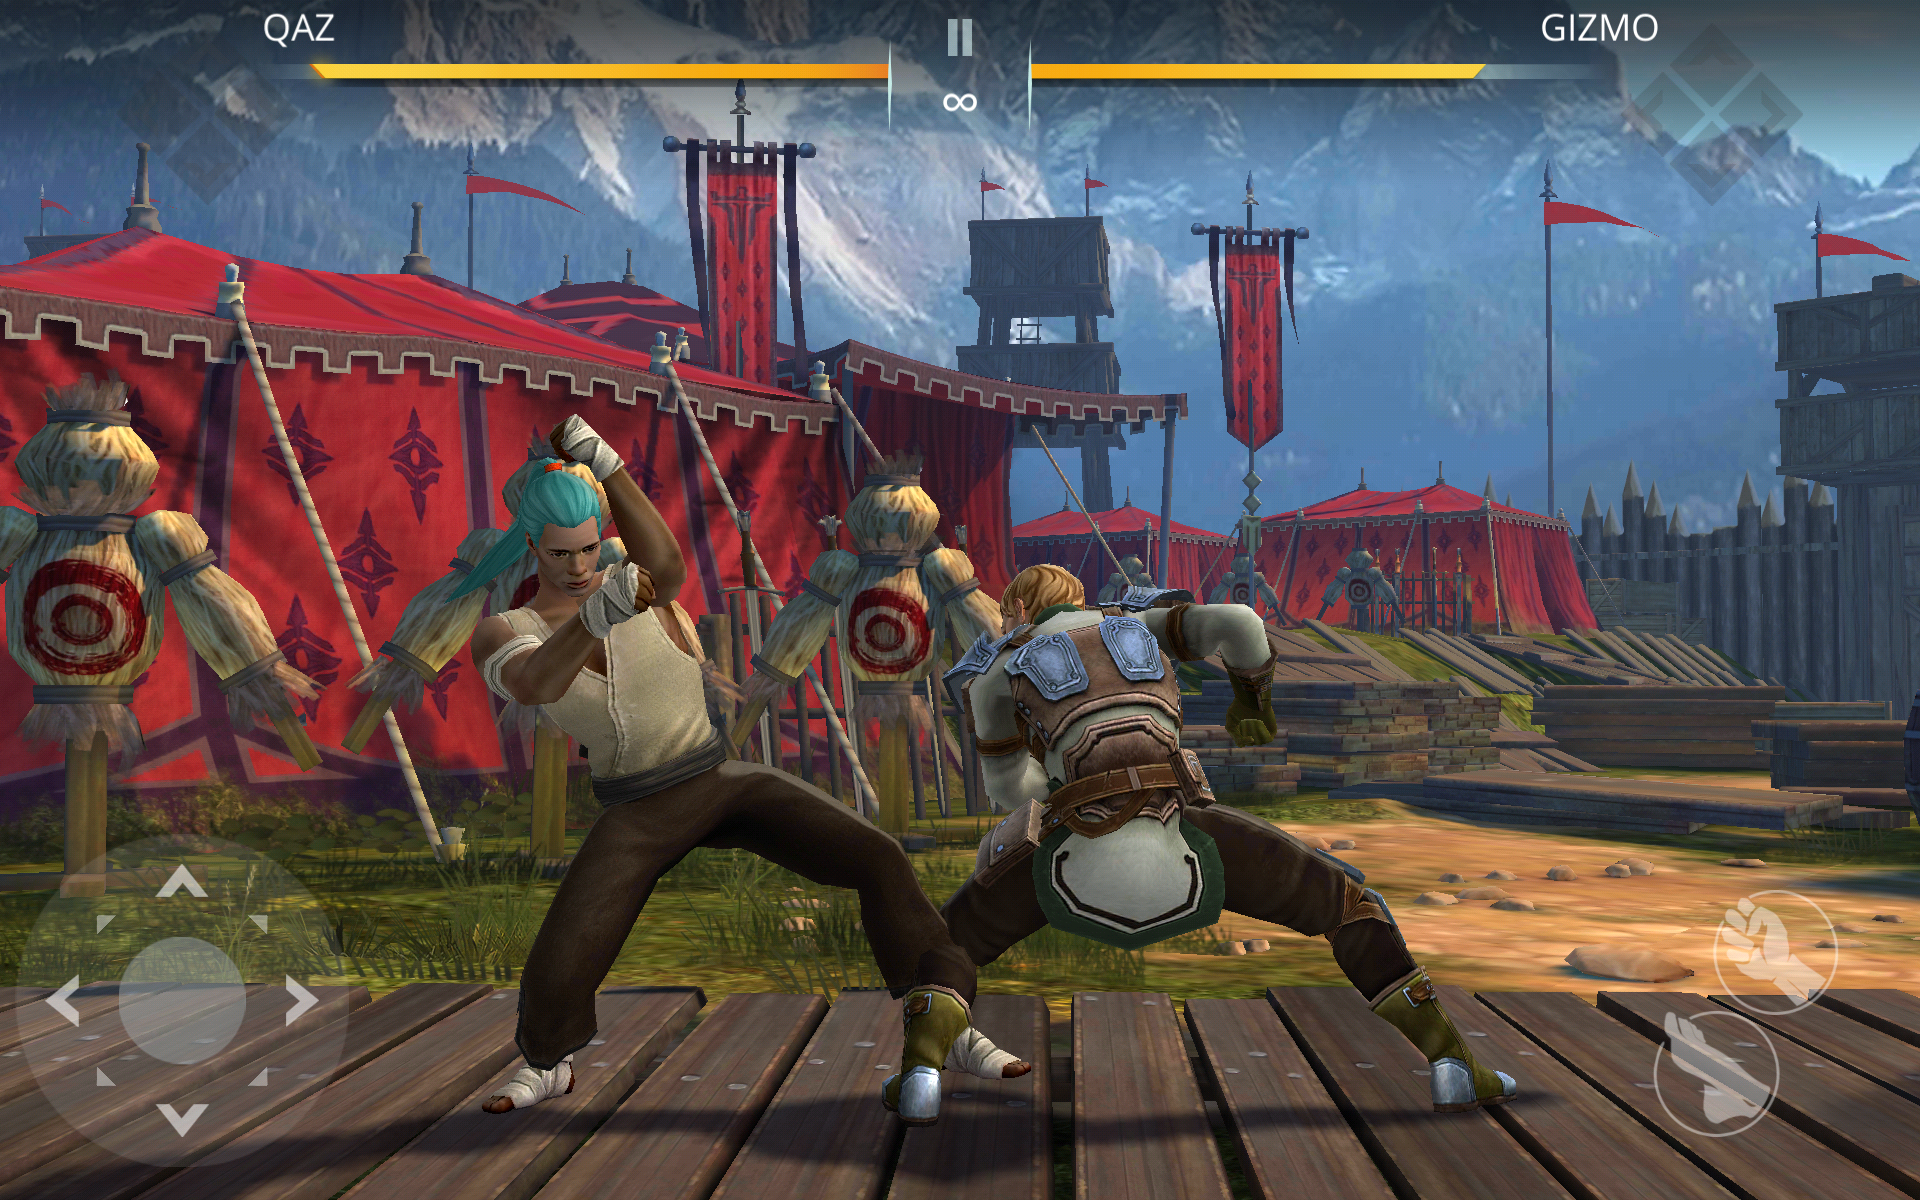
Typing is generally smooth without any major or uneven input delays unless if too many active applications or tabs are running. For example, having both Chrome and a demanding game like Asphalt 9 running would increase typing delay. There is no haptic feedback, however, which would have improved tactility.
The glass multi-touch screen can recognize up to 10 simultaneous fingers.
Display
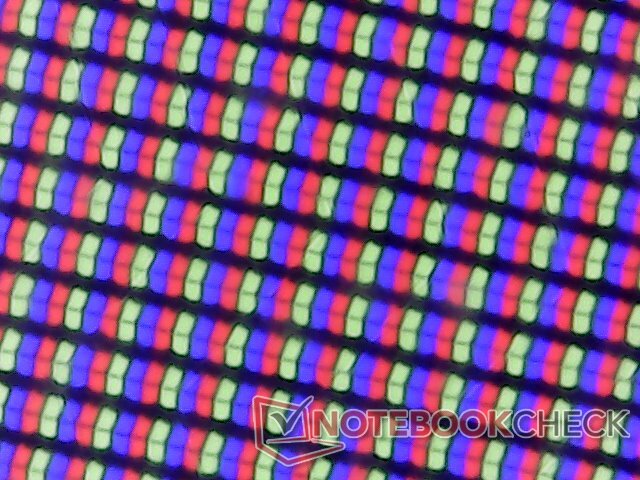
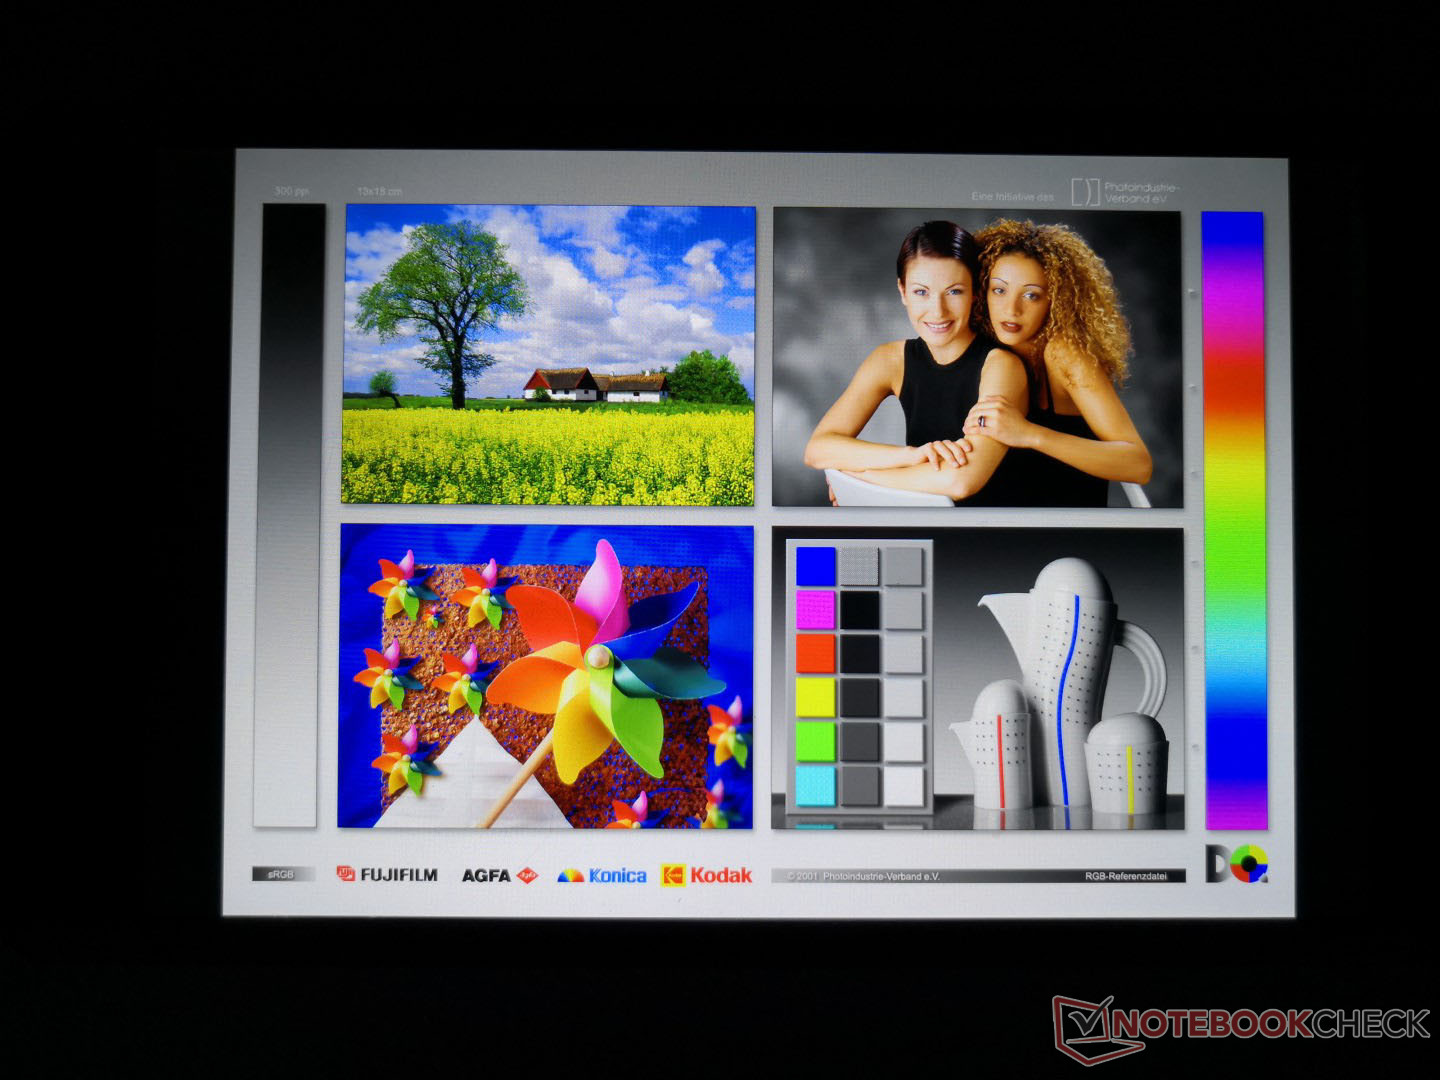
The 8-inch IPS display is dimmer than many other budget tablets including the Xiaomi Mi Pad 4 and Amazon Fire HD 8 2018. The glass overlay is also quite thick resulting in some graininess and muted colors when compared to the crisper and cleaner display of an iPad. Contrast is otherwise average for its budget category.
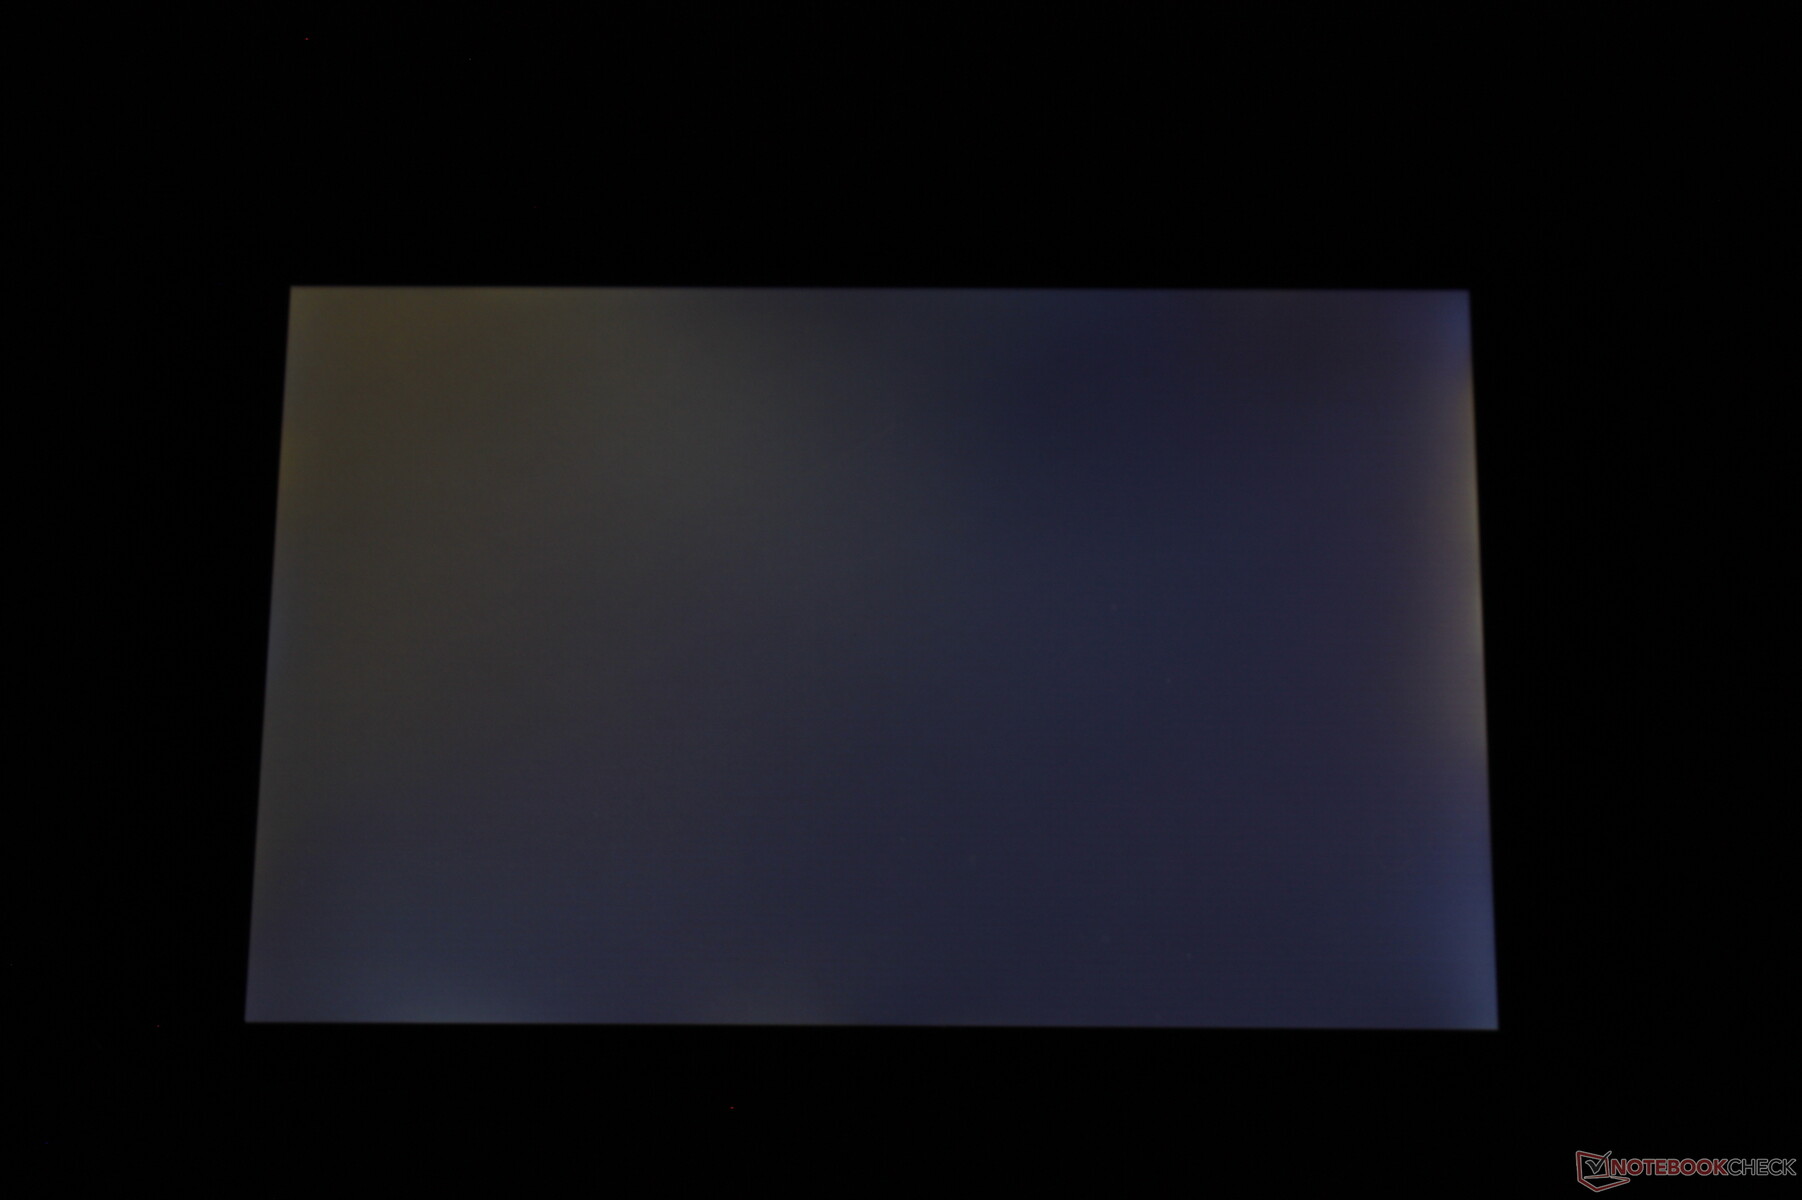
Our test unit suffers from uneven backlight bleeding as shown below. It's noticeable when watching videos with black borders, but it's not severe enough to be overly distracting.
| |||||||||||||||||||||||||
Brightness Distribution: 94 %
Center on Battery: 317.5 cd/m²
Contrast: 635:1 (Black: 0.5 cd/m²)
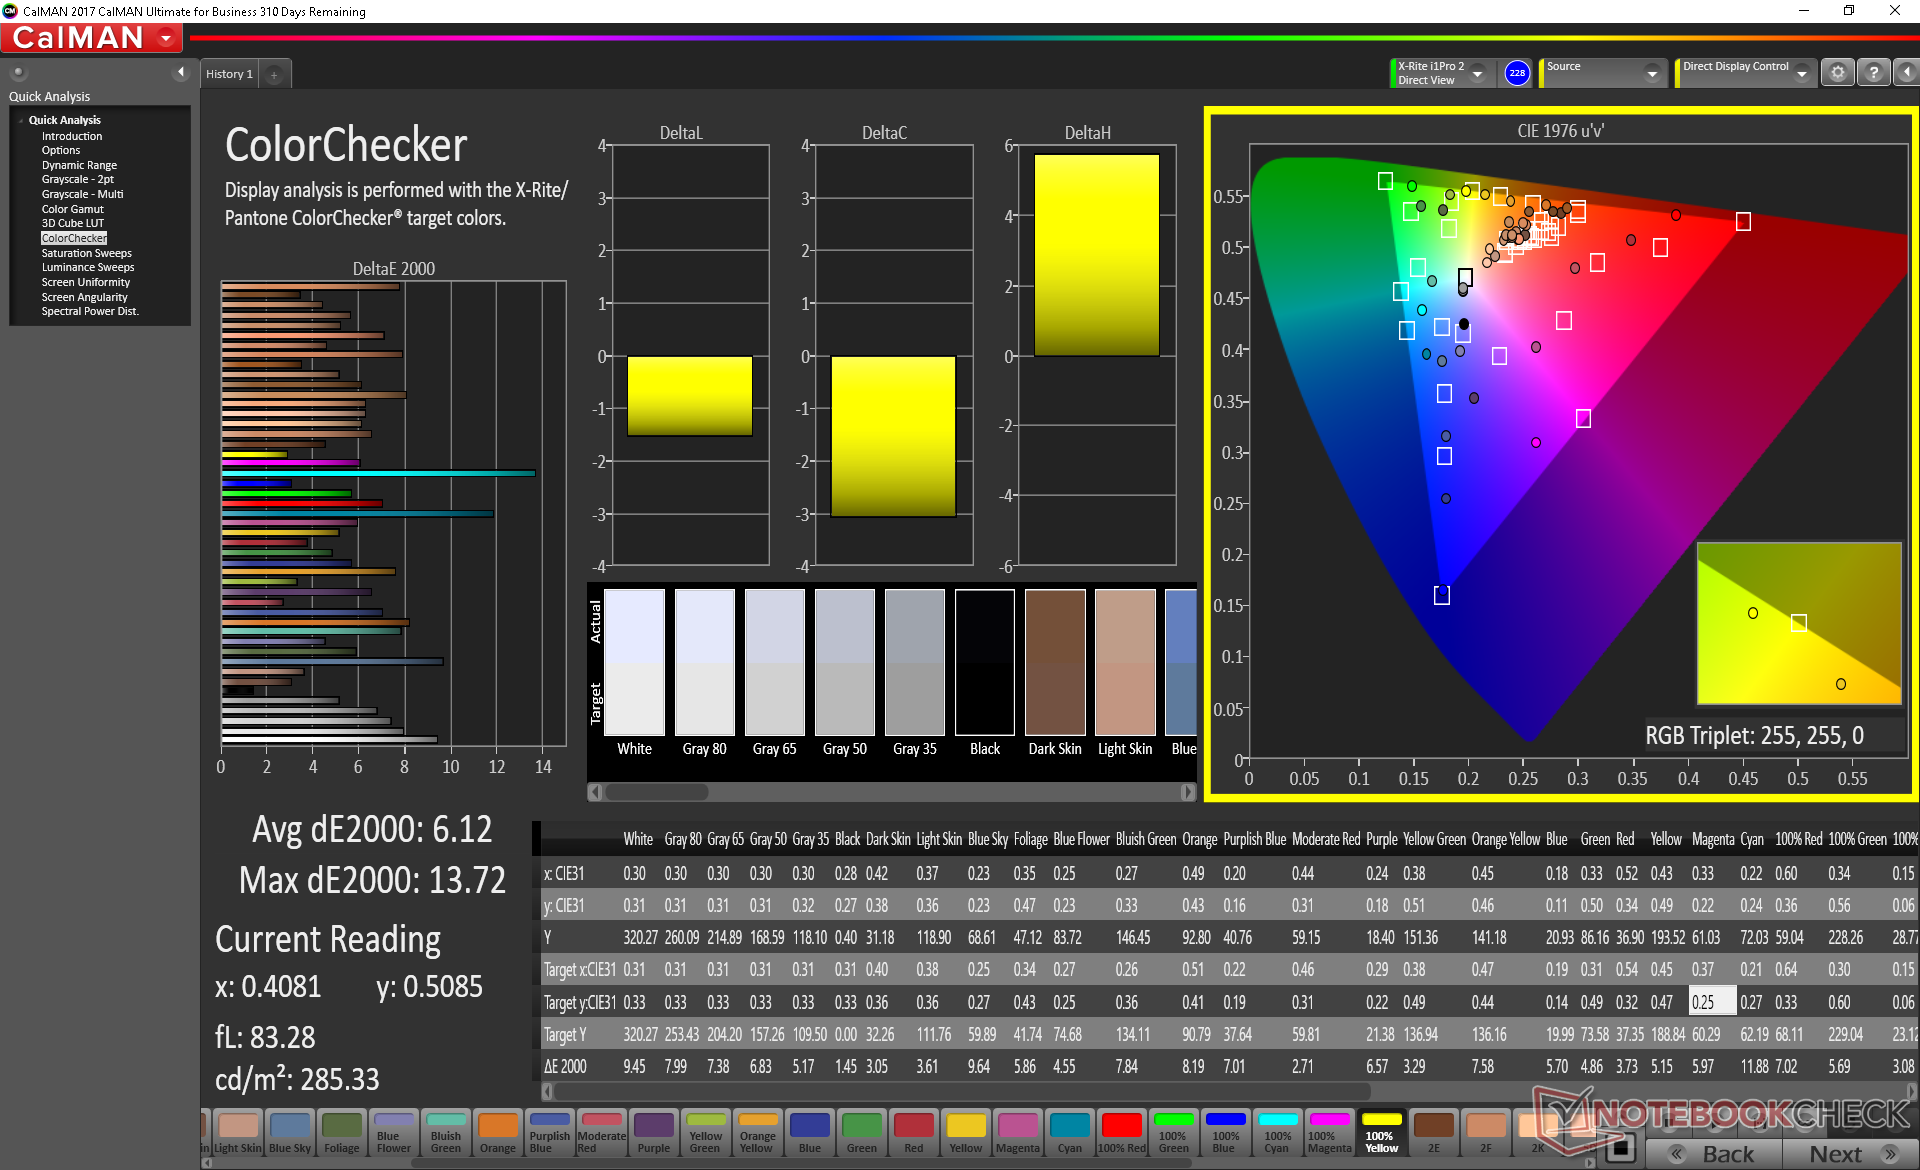
ΔE ColorChecker Calman: 6.12 | ∀{0.5-29.43 Ø4.73}
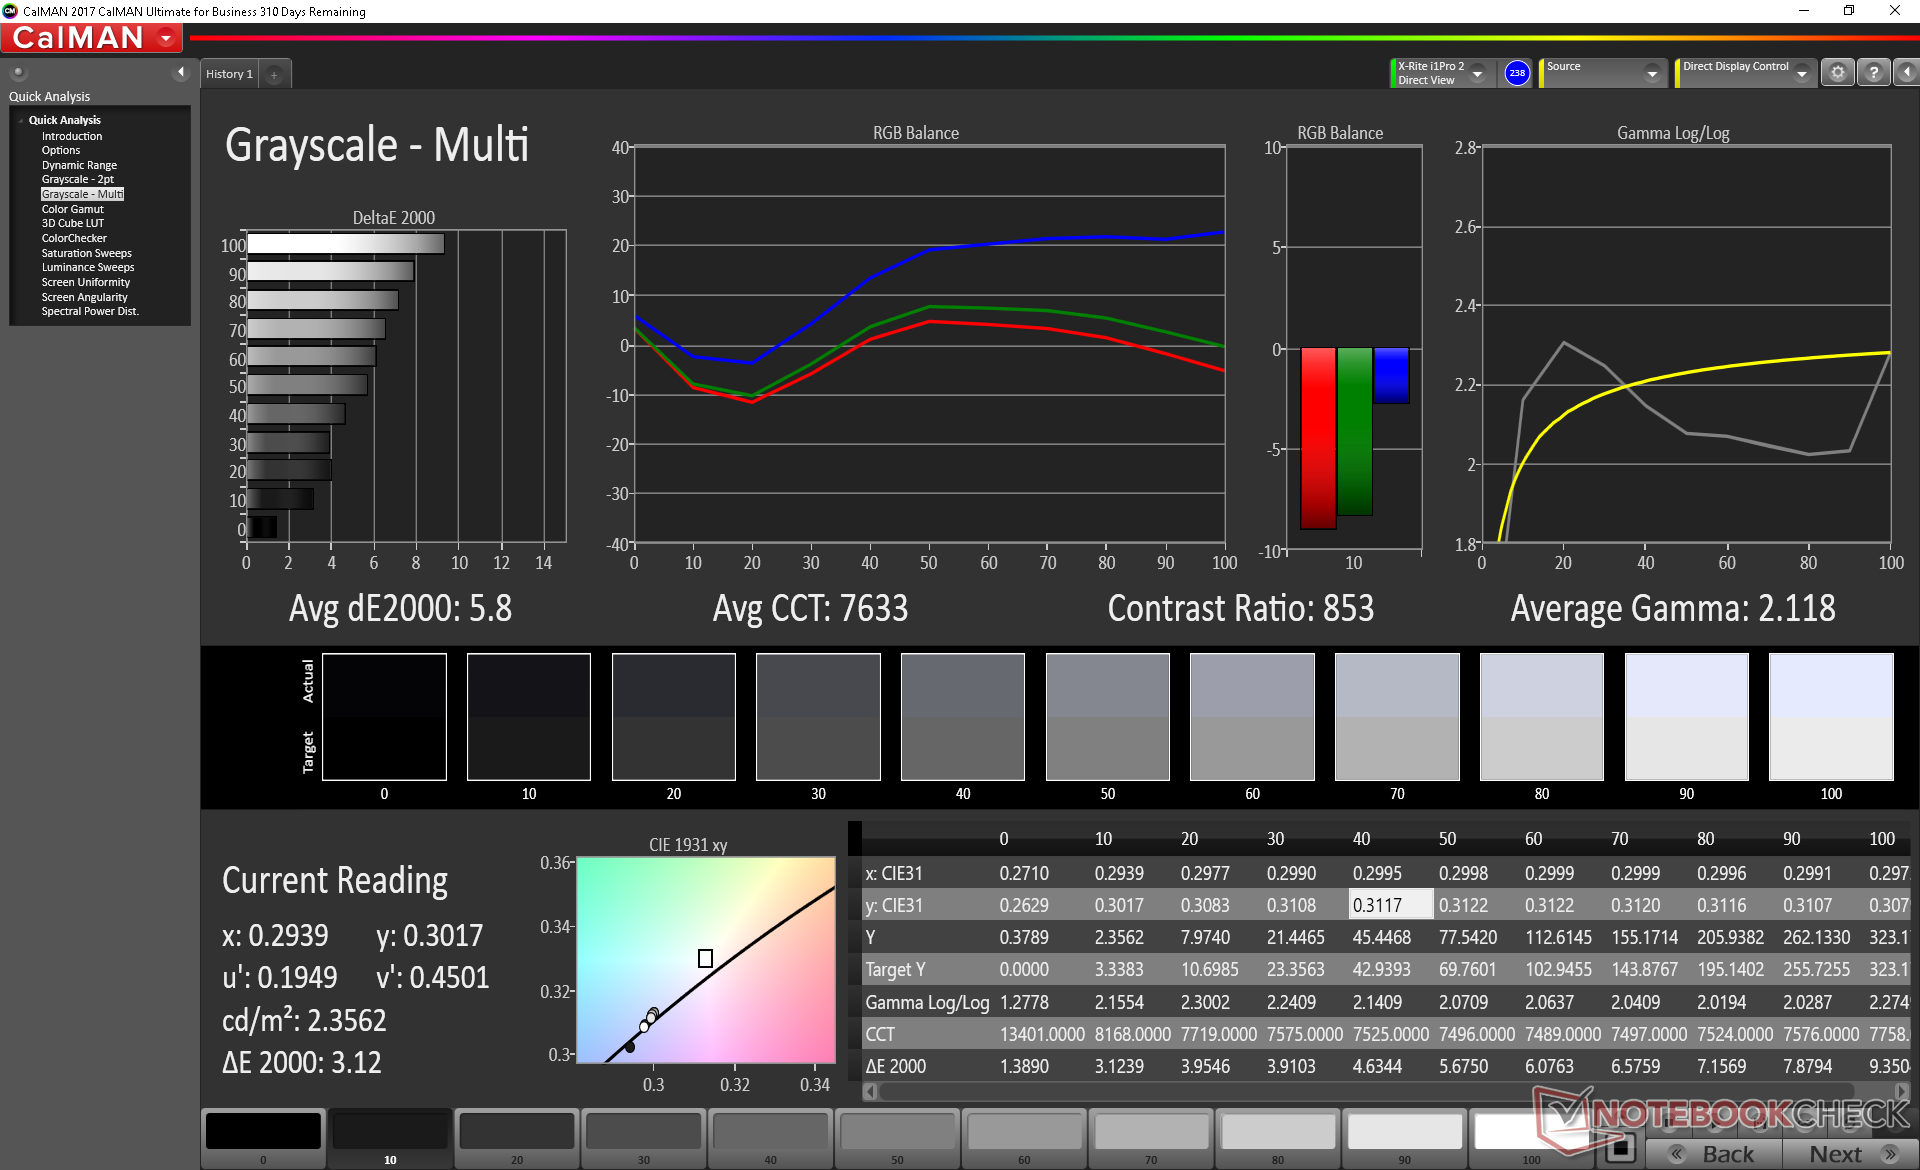
ΔE Greyscale Calman: 5.8 | ∀{0.09-98 Ø4.97}
Gamma: 2.12
CCT: 7633 K
| Alldocube M8 T801 IPS, 8", 1920x1200 | Amazon Fire HD 8 2018 IPS, 8", 1280x800 | Asus ZenPad 3 8.0 Z581KL-1A001A IPS, 7.9", 2048x1536 | Huawei MediaPad M5 8.4 IPS, 8.4", 2560x1600 | Xiaomi Mi Pad 4 IPS LCD, 8", 1920x1200 | Chuwi HiPad IPS, 10.1", 1920x1200 | |
|---|---|---|---|---|---|---|
| Response Times | -41% | -4% | 44% | 7% | -24% | |
| Response Time Grey 50% / Grey 80% * (ms) | 32 ? | 48 ? -50% | 31 ? 3% | 13 ? 59% | 42 ? -31% | 33.2 ? -4% |
| Response Time Black / White * (ms) | 28.8 ? | 38 ? -32% | 32 ? -11% | 20.5 ? 29% | 16 ? 44% | 41.2 ? -43% |
| PWM Frequency (Hz) | 2451 ? | 2358 ? | ||||
| Screen | -19% | 24% | 3% | 11% | 21% | |
| Brightness middle (cd/m²) | 317.5 | 359 13% | 386 22% | 405 28% | 454 43% | 408.7 29% |
| Brightness (cd/m²) | 320 | 358 12% | 364 14% | 392 23% | 411 28% | 396 24% |
| Brightness Distribution (%) | 94 | 89 -5% | 88 -6% | 92 -2% | 83 -12% | 85 -10% |
| Black Level * (cd/m²) | 0.5 | 0.85 -70% | 0.57 -14% | 0.67 -34% | 0.73 -46% | 0.51 -2% |
| Contrast (:1) | 635 | 422 -34% | 677 7% | 604 -5% | 622 -2% | 801 26% |
| Colorchecker dE 2000 * | 6.12 | 6.8 -11% | 3.3 46% | 5.78 6% | 5.2 15% | 4.13 33% |
| Colorchecker dE 2000 max. * | 13.72 | 17.3 -26% | 7.1 48% | 9.82 28% | 8.36 39% | 7.34 47% |
| Greyscale dE 2000 * | 5.8 | 7.6 -31% | 1.7 71% | 7.2 -24% | 4.7 19% | 4.4 24% |
| Gamma | 2.12 104% | 2.19 100% | 2.42 91% | 2.278 97% | 2.271 97% | 2.24 98% |
| CCT | 7633 85% | 7160 91% | 6397 102% | 8405 77% | 7361 88% | 7389 88% |
| Total Average (Program / Settings) | -30% /
-23% | 10% /
18% | 24% /
11% | 9% /
10% | -2% /
12% |
* ... smaller is better
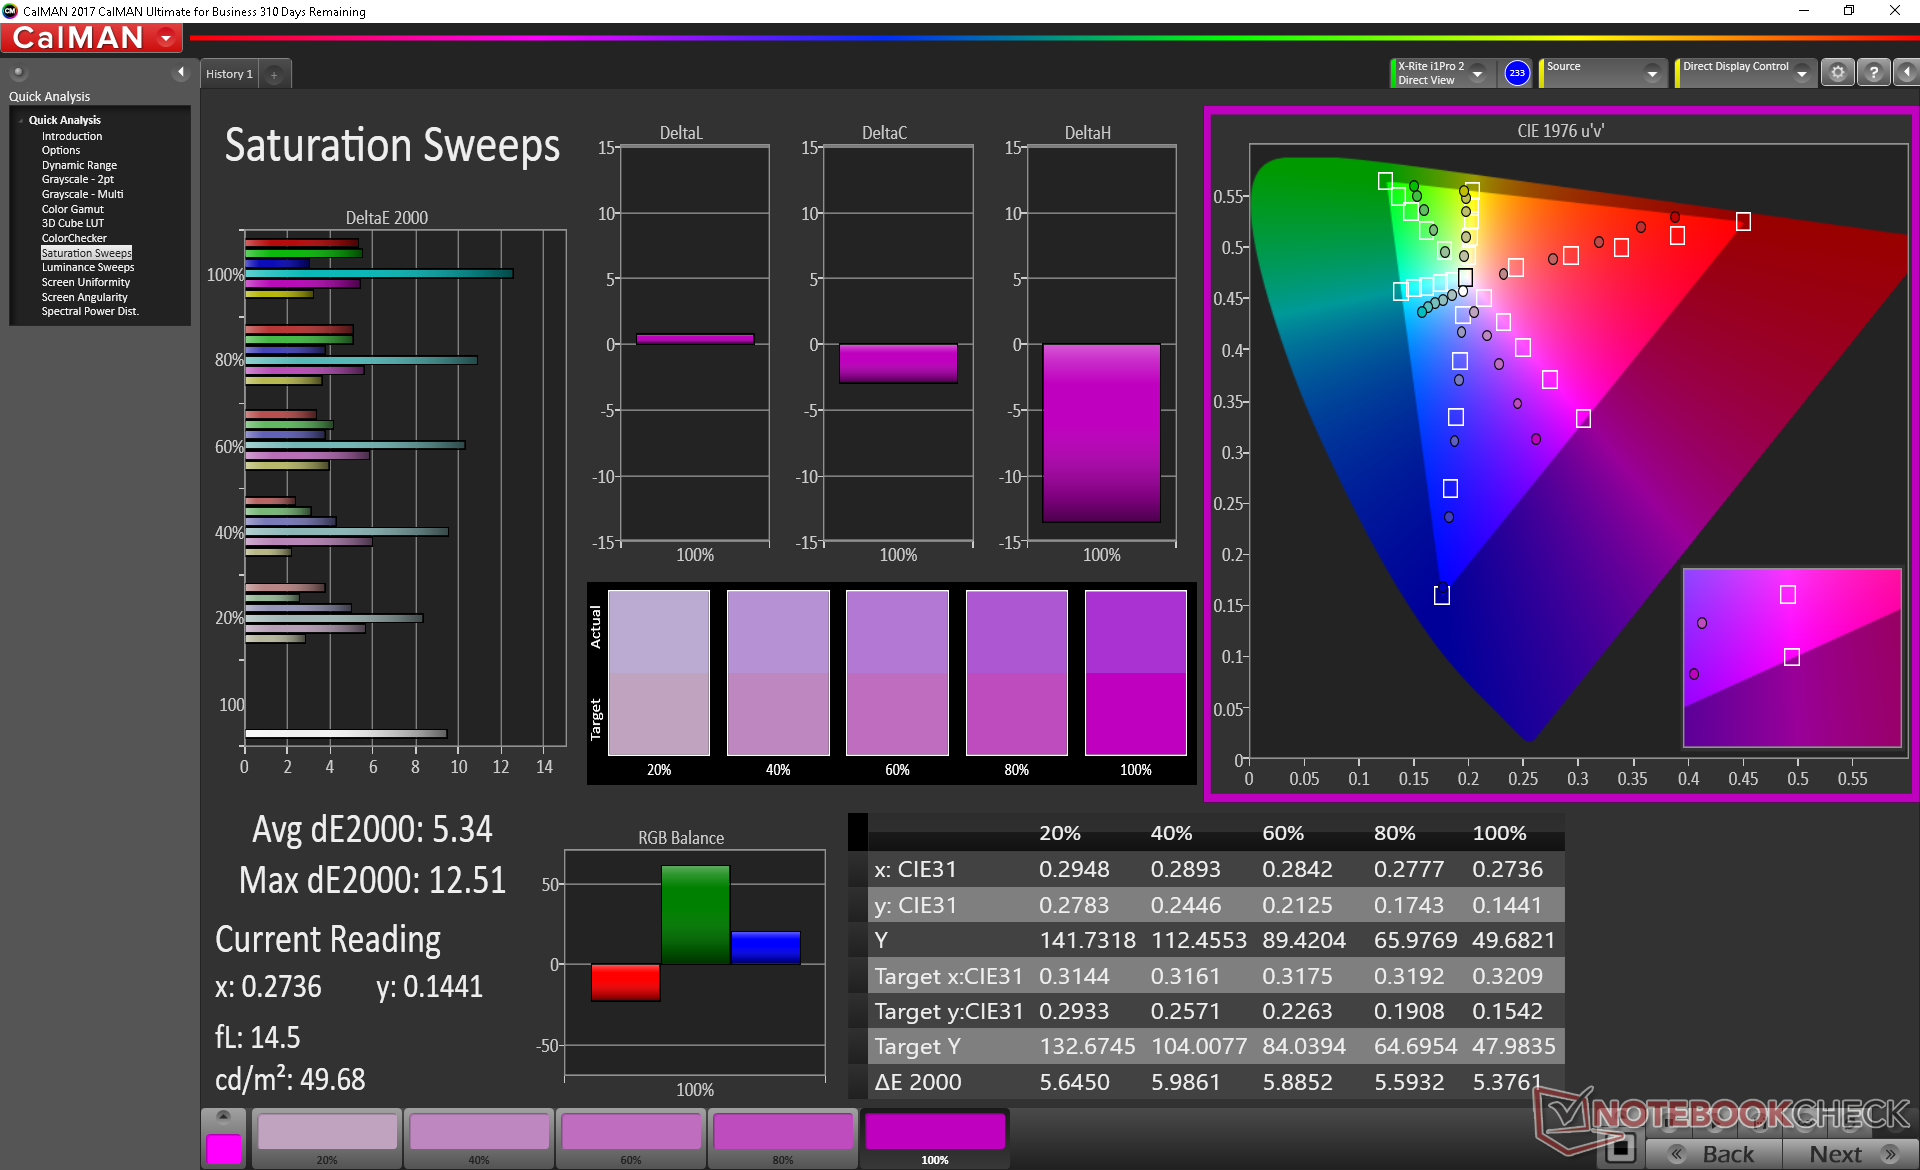
Color temperature is too cool with generally inaccurate colors. Teal in particular is significantly more inaccurate than others at all tested saturation levels.
Display Response Times
| ↔ Response Time Black to White | ||
|---|---|---|
| 28.8 ms ... rise ↗ and fall ↘ combined | ↗ 14.8 ms rise | 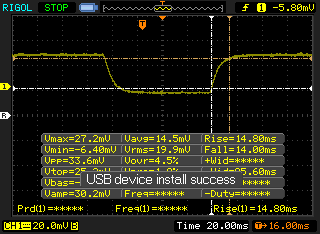 |
| ↘ 14 ms fall | ||
| The screen shows relatively slow response rates in our tests and may be too slow for gamers. In comparison, all tested devices range from 0.1 (minimum) to 240 (maximum) ms. » 76 % of all devices are better. This means that the measured response time is worse than the average of all tested devices (19.9 ms). | ||
| ↔ Response Time 50% Grey to 80% Grey | ||
| 32 ms ... rise ↗ and fall ↘ combined | ↗ 13.2 ms rise | 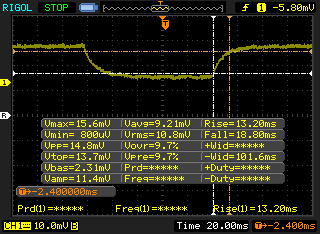 |
| ↘ 18.8 ms fall | ||
| The screen shows slow response rates in our tests and will be unsatisfactory for gamers. In comparison, all tested devices range from 0.165 (minimum) to 636 (maximum) ms. » 43 % of all devices are better. This means that the measured response time is similar to the average of all tested devices (31.1 ms). | ||
Screen Flickering / PWM (Pulse-Width Modulation)
| Screen flickering / PWM not detected | 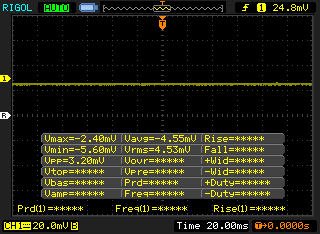 | ||
In comparison: 52 % of all tested devices do not use PWM to dim the display. If PWM was detected, an average of 7791 (minimum: 5 - maximum: 343500) Hz was measured. | |||
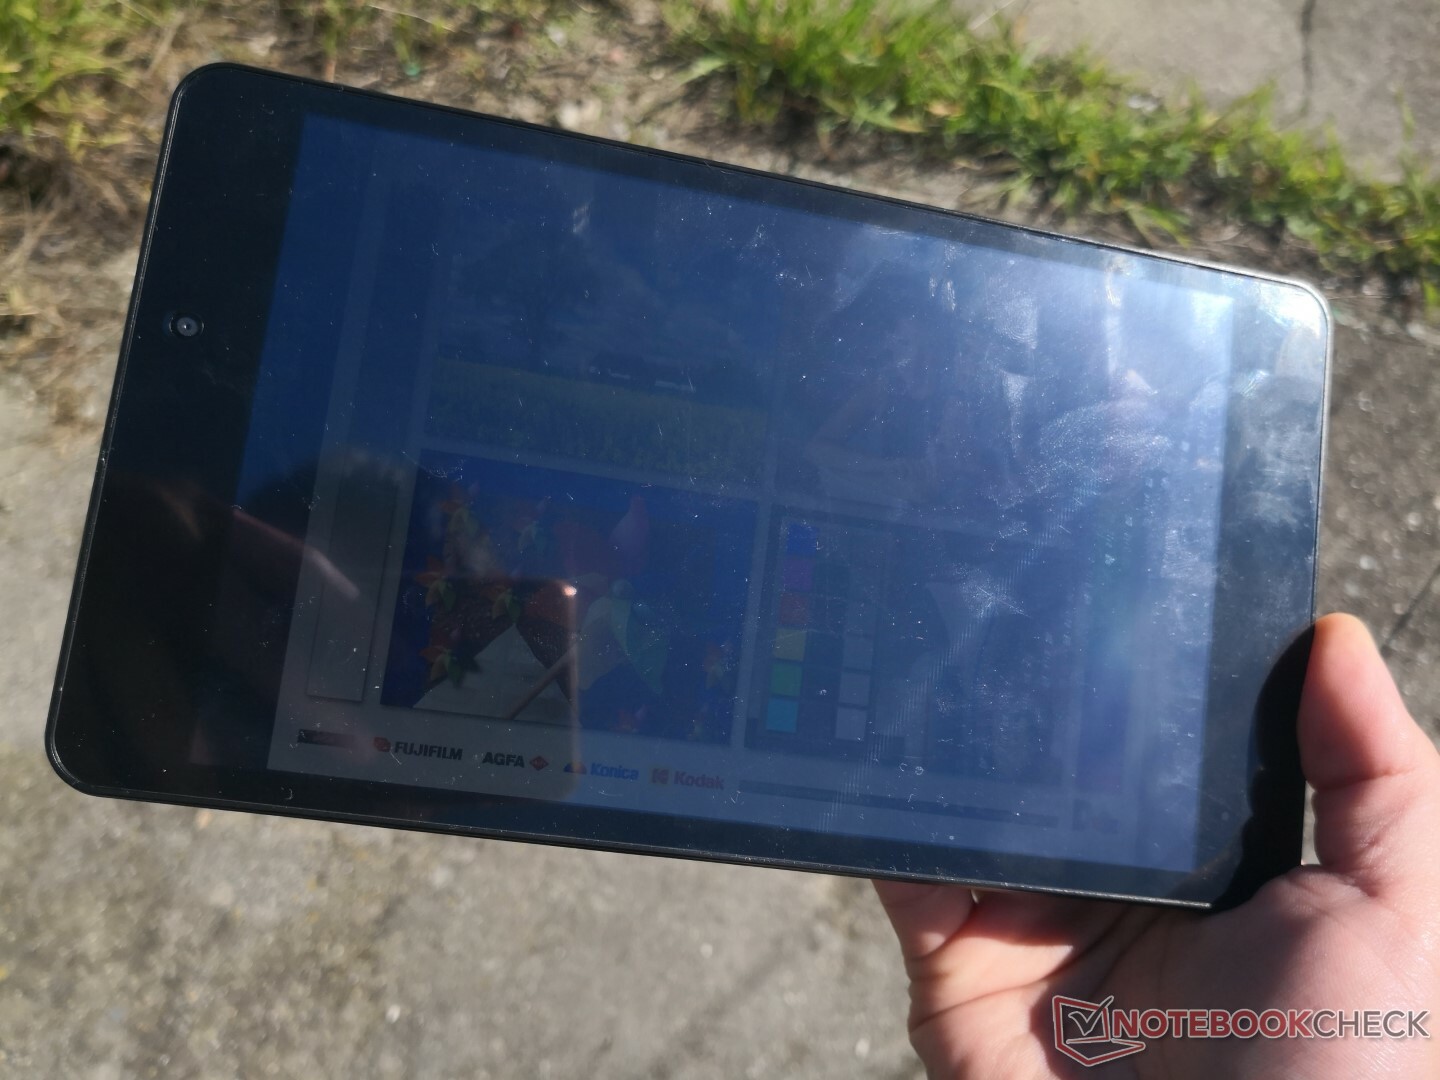
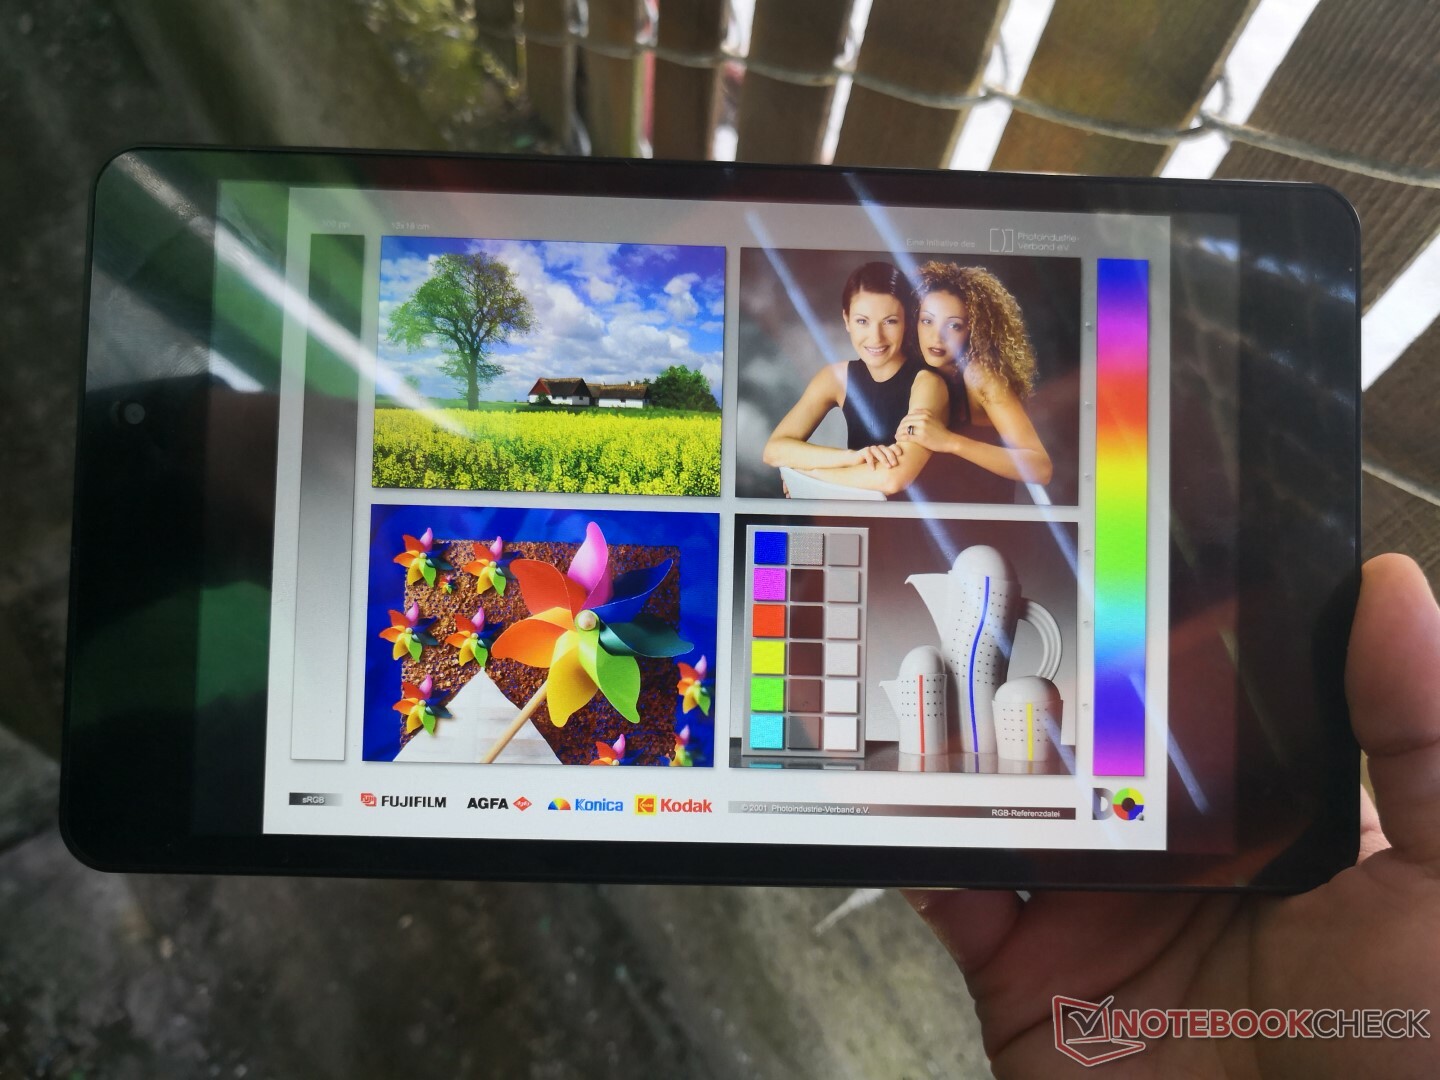
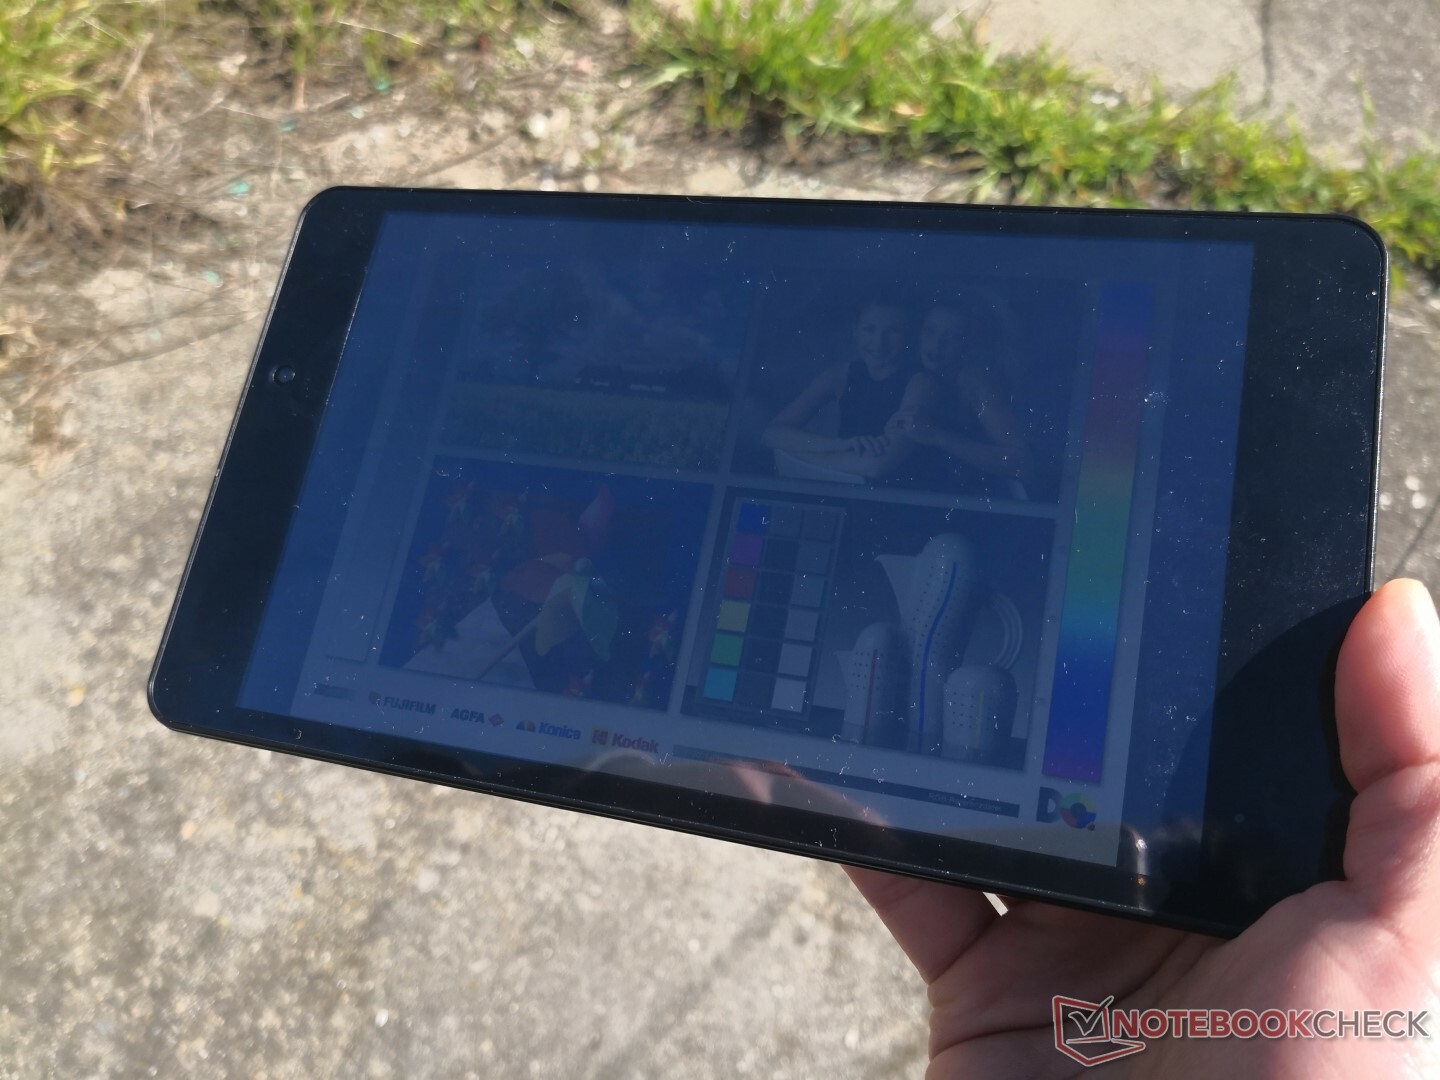
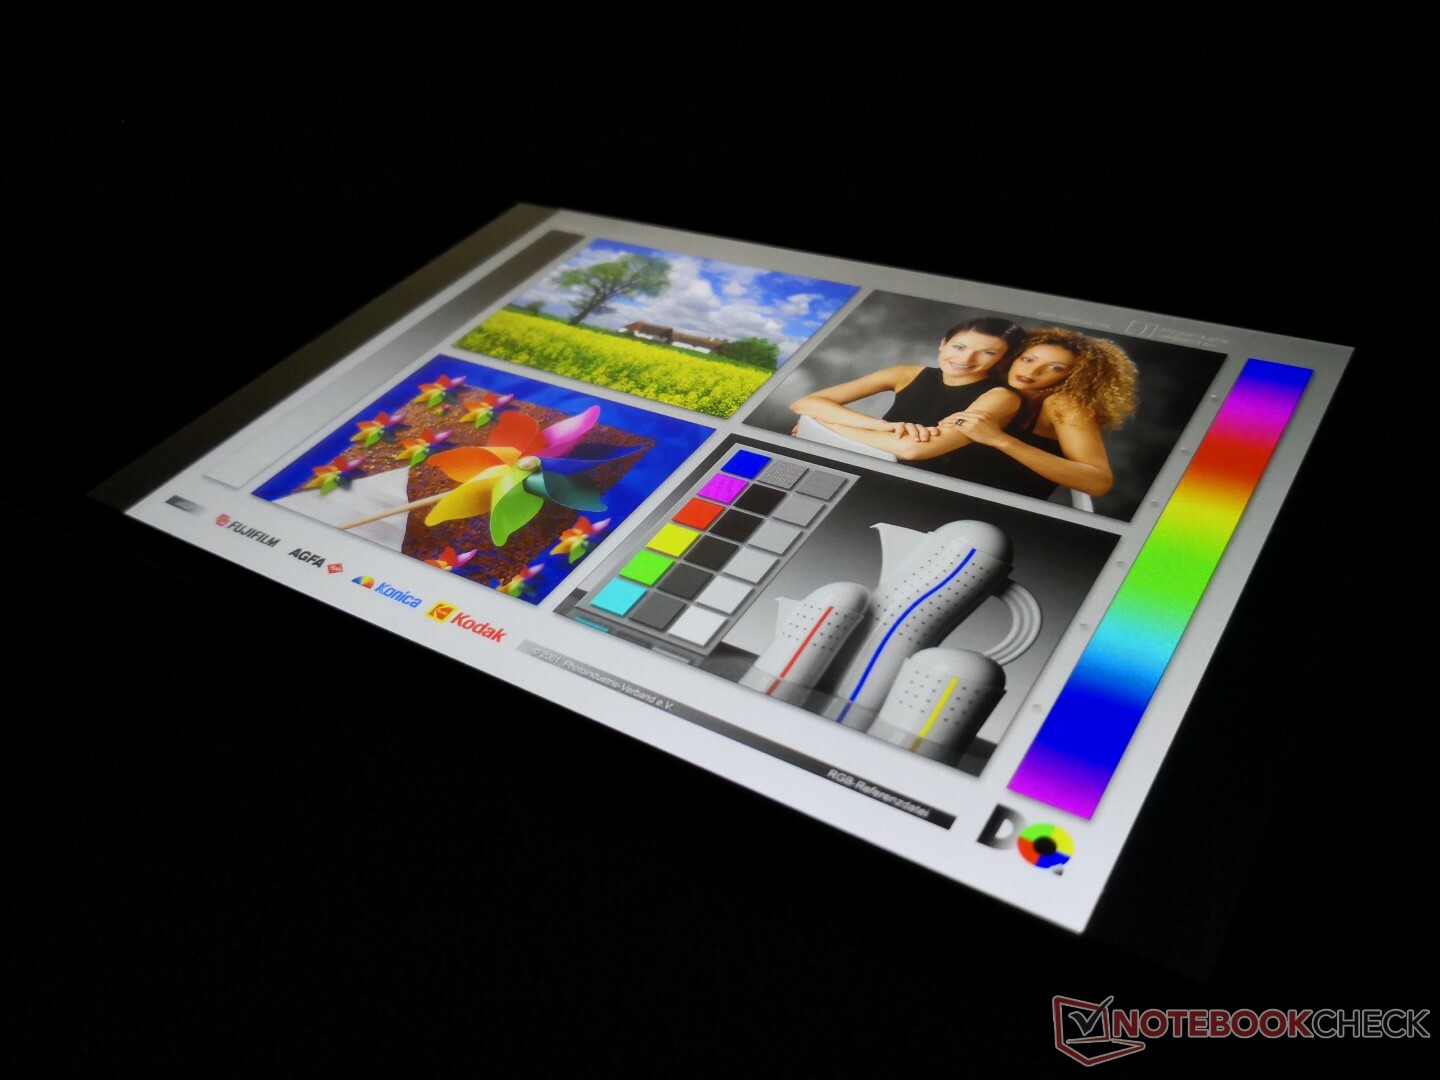
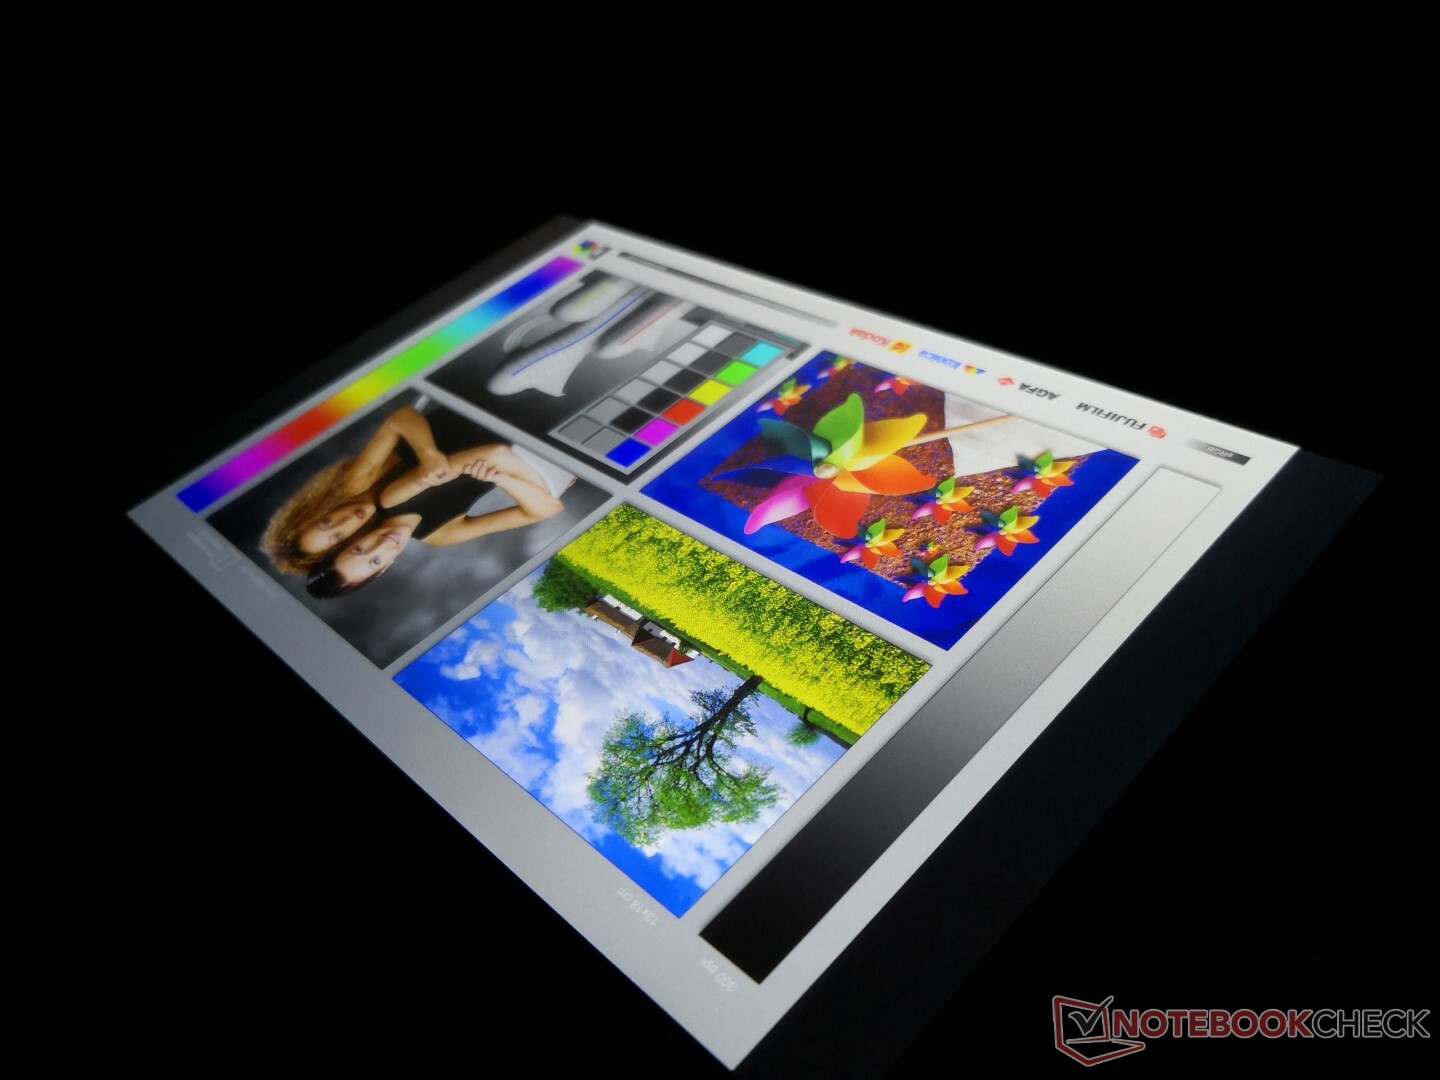
Outdoor visibility is poorer than other tablets and smartphones since the backlight is relatively weak. Glare will be present even when working under shade. Viewing angles are thankfully wide without any major color shifting when in the landscape or portrait orientations.
Performance
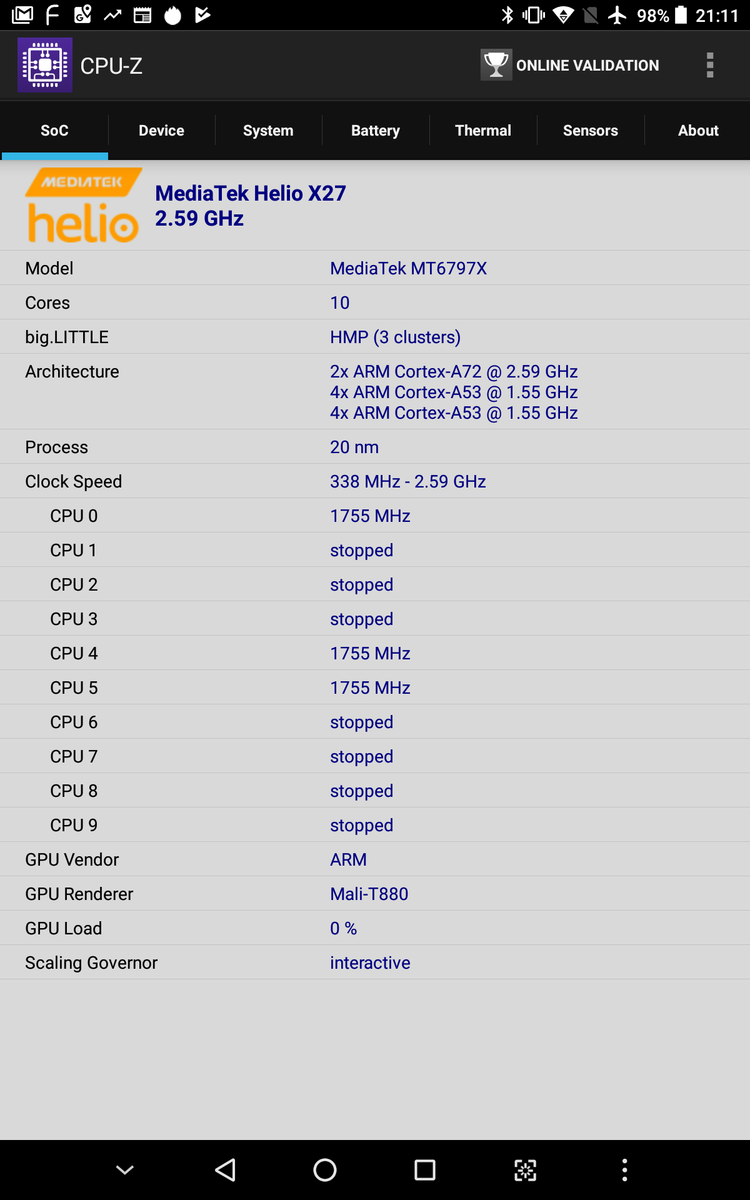
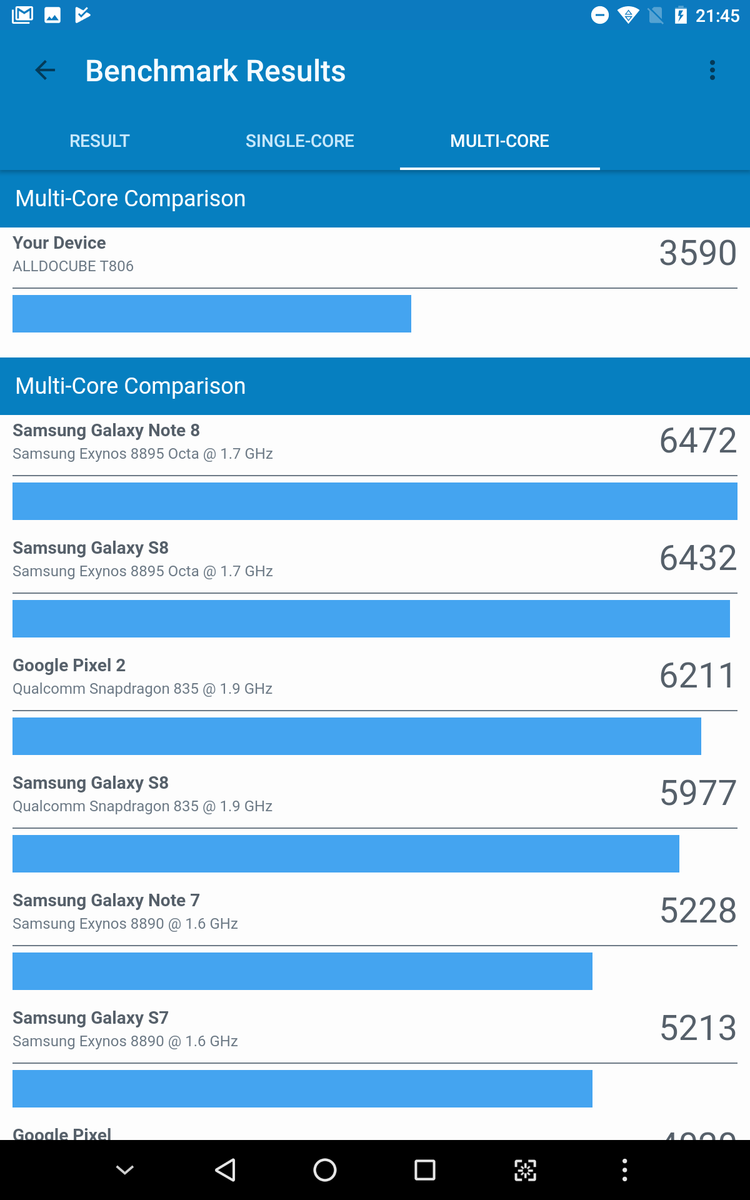
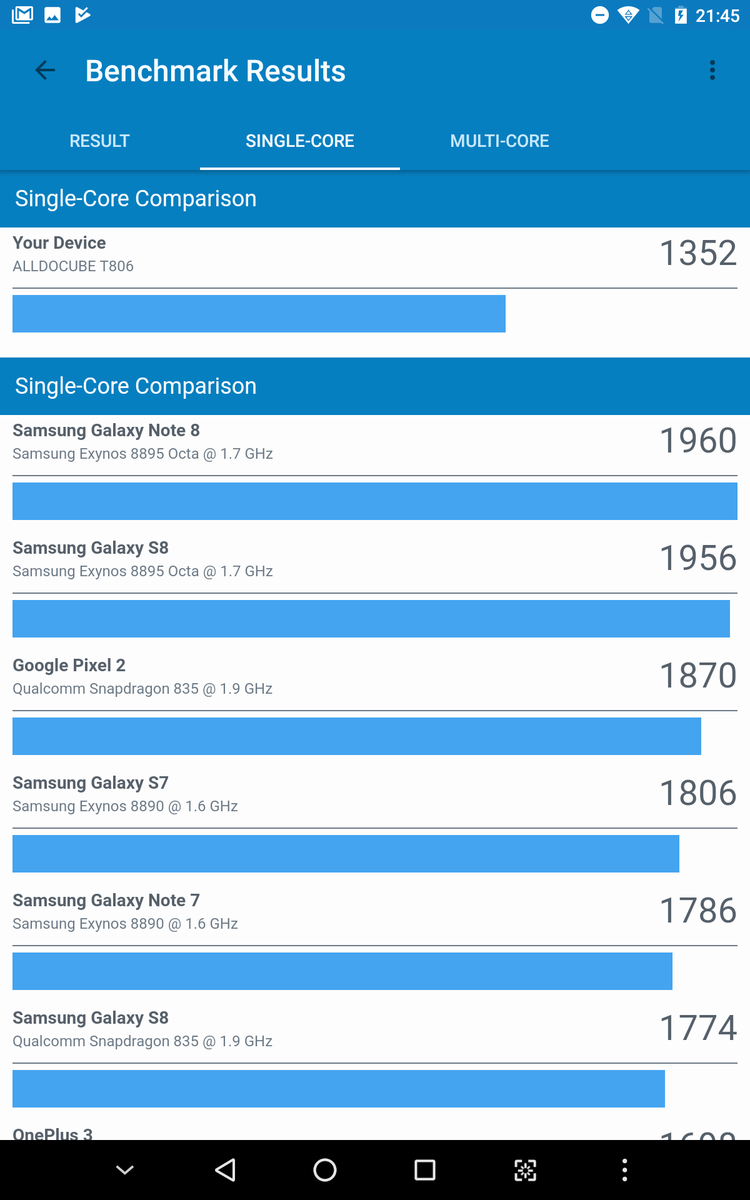
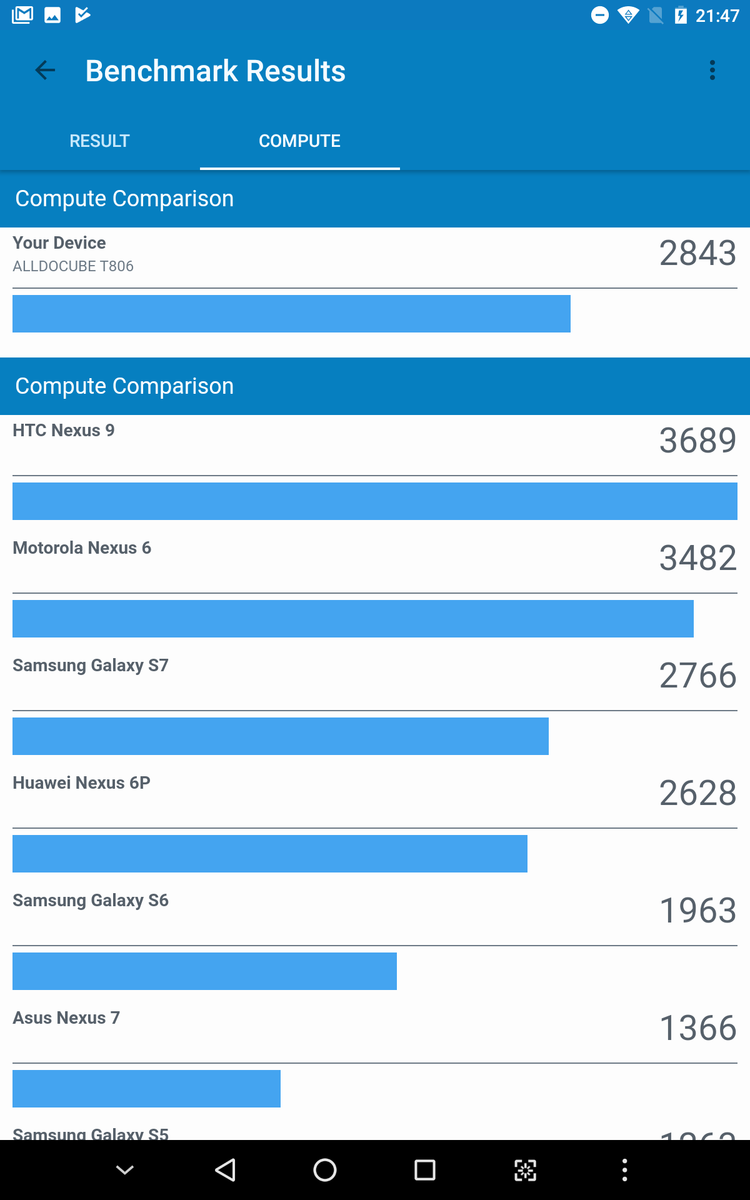
The MediaTek Helio X27 MT6797X is a mid-range deca-core SoC. While fairly uncommon, it can be found on some inexpensive Chinese tablets like the Chuwi HiPad or HiPad Plus. For what it's worth, GeekBench 4.3 Multi-Thread ranks it within 10 percent of the HiSilicon Kirin 659 and 2017 Snapdragon 835.
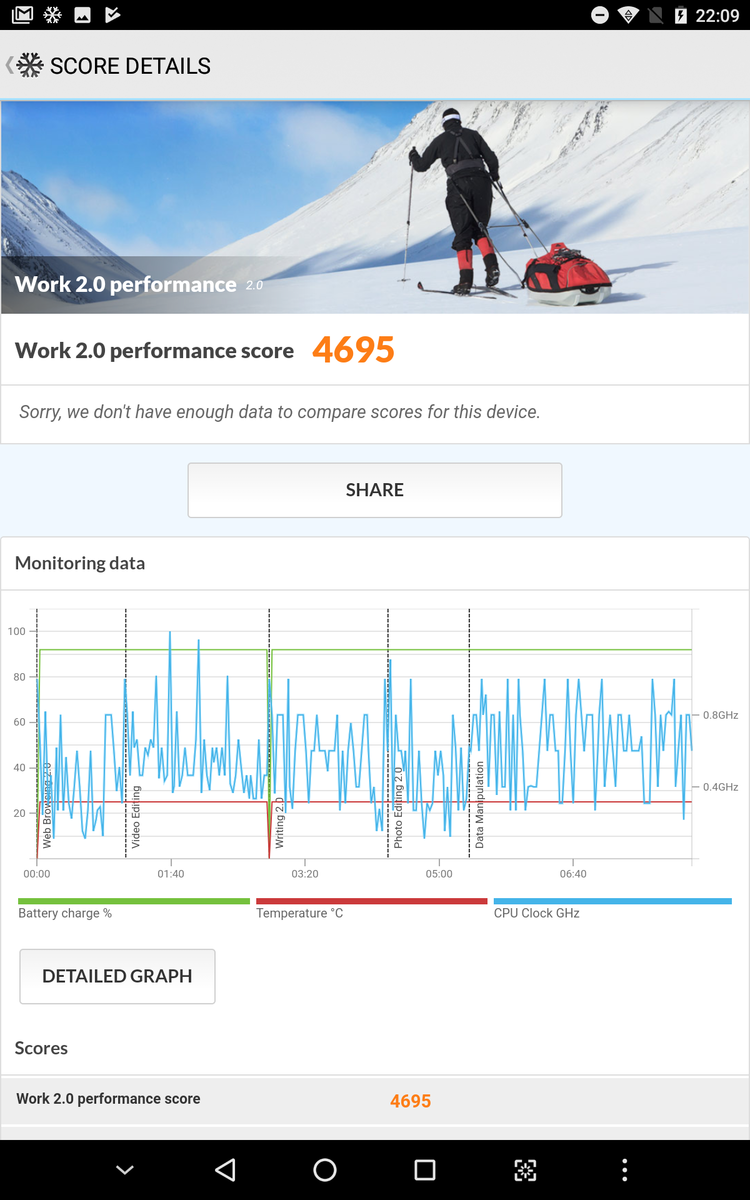
Subjectively, system performance is less than smooth. Frame skips are common and there are delays when multi-tasking between applications. This is nonetheless common amongst budget Android tablets and a major differentiator when compared to high-end alternatives.
| Basemark GPU 1.1 | |
| 1920x1080 Vulkan Medium Offscreen | |
| Samsung Galaxy Tab S4 | |
| Vulkan Medium Native | |
| Samsung Galaxy Tab S4 | |
| 1920x1080 OpenGL Medium Offscreen | |
| Samsung Galaxy Tab S4 | |
| Average MediaTek Helio X27 MT6797X (n=1) | |
* ... smaller is better
Storage Devices
Sequential write rate is average for the budget category, but sequential read is slightly slower than expected at just 143 MB/s according to AndroBench. The OEM does not appear to offer any 64 GB SKUs and so users will have to make do with just 32 GB.
| Alldocube M8 T801 32 GB eMMC Flash | Acer Iconia Tab 10 A3-A50 64 GB eMMC Flash | Alldocube Alldocube X 64 GB eMMC Flash | Huawei MediaPad M5 10.8 Pro 64 GB eMMC Flash | Samsung Galaxy Tab S4 64 GB UFS 2.1 Flash | |
|---|---|---|---|---|---|
| AndroBench 3-5 | -8% | 17% | 45% | 320% | |
| Sequential Write 256KB SDCard (MB/s) | 56.8 | 66.1 | 73.1 | 59.1 | |
| Sequential Read 256KB SDCard (MB/s) | 80.4 | 87.2 | 84.9 | 80.1 | |
| Random Write 4KB (MB/s) | 10.01 | 8.77 -12% | 11.62 16% | 15.35 53% | 24.43 144% |
| Random Read 4KB (MB/s) | 19.5 | 13.7 -30% | 14.62 -25% | 27.41 41% | 142 628% |
| Sequential Write 256KB (MB/s) | 103 | 92.4 -10% | 101.1 -2% | 94.1 -9% | 195.8 90% |
| Sequential Read 256KB (MB/s) | 142.8 | 173.7 22% | 255.4 79% | 278.6 95% | 741 419% |
| 3DMark Sling Shot Extreme (ES 3.1) Unlimited | 1157 points | |
Help | ||
Games
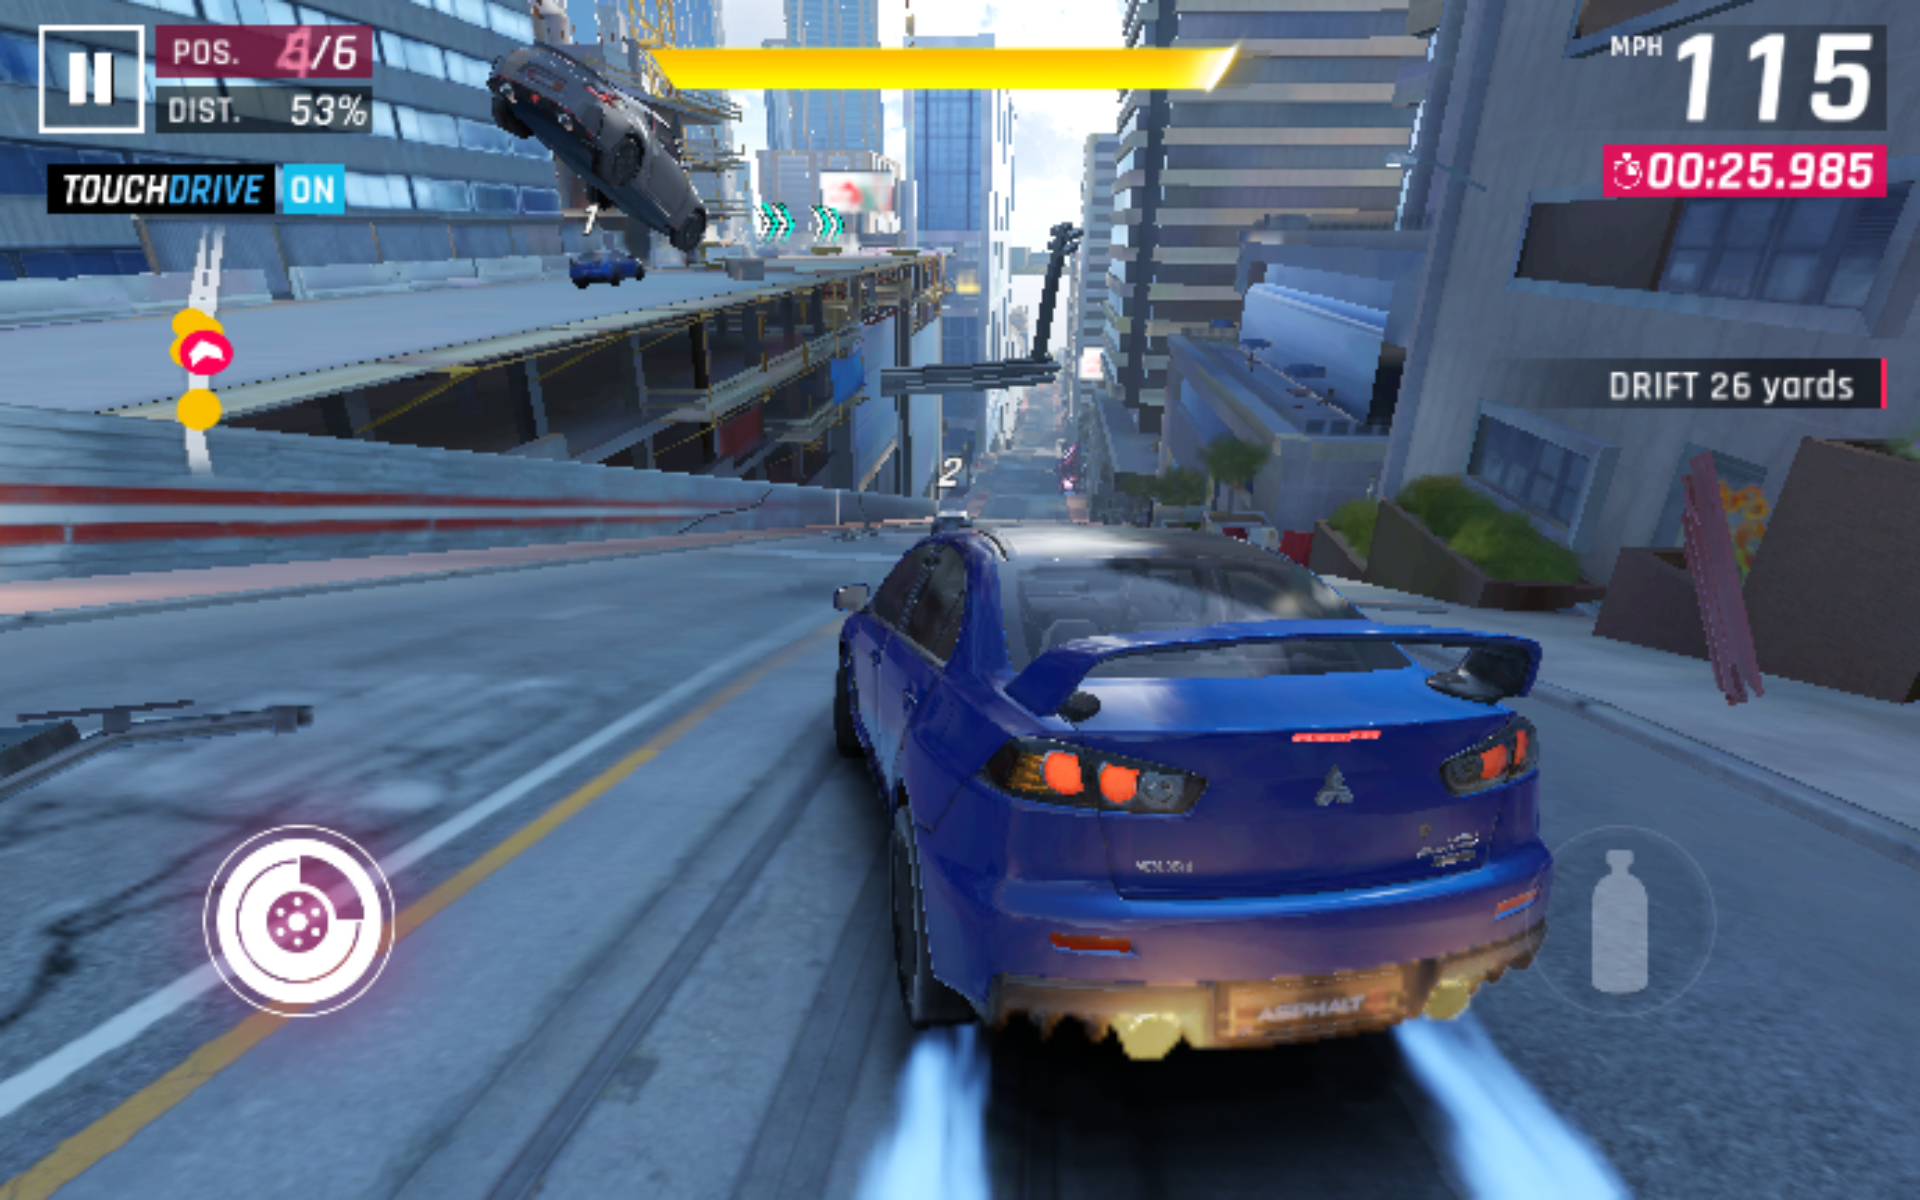
The integrated ARM Mali T880 MP4 GPU is able to run demanding titles from the Play Store, albeit at limited frame rates and with blocky textures. Asphalt 9 in particular struggles to maintain stable frame rates for a somewhat poor gaming experience. Less demanding sprite-based titles like Plants vs. Zombies run without any issues.
Emissions
Temperature
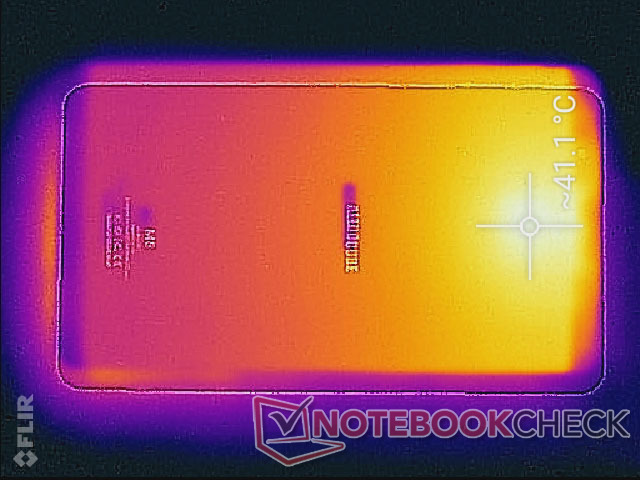
Surface temperatures are generally flat on both sides when idling on the Home screen. When under extreme loads, the top of the tablet can become as warm as 40 C as shown by the temperature maps below. Results are similar to what we found on the Snapdragon-powered Lenovo Tab 4 8. Even so, the tablet never becomes uncomfortable to hold since the concentrated hot spot can be easily avoided.
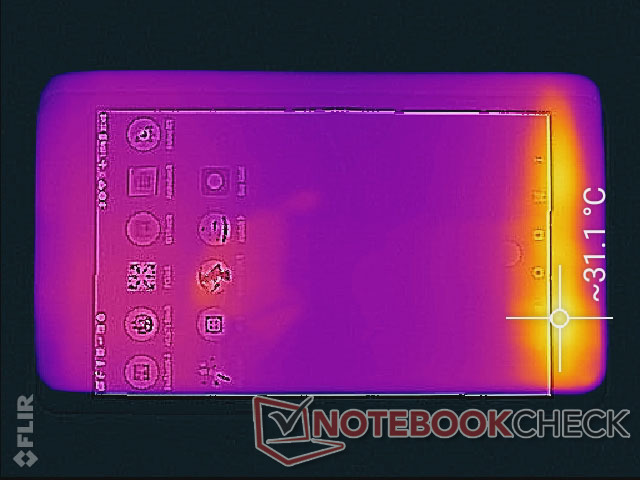
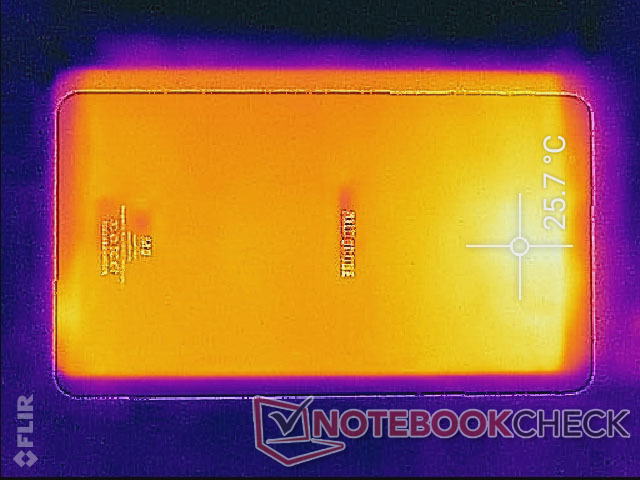
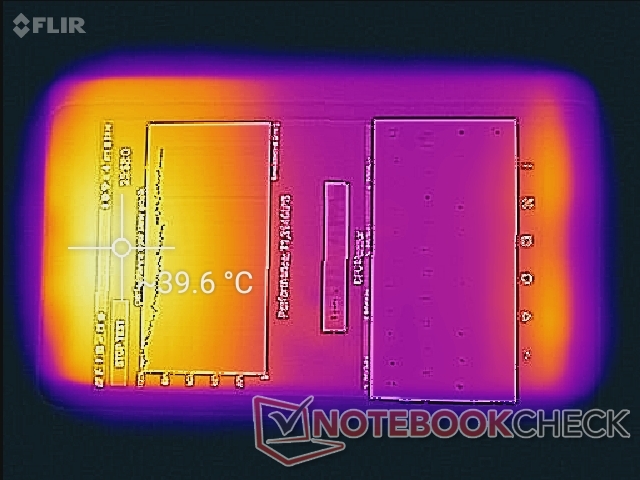
(+) The maximum temperature on the upper side is 39.8 °C / 104 F, compared to the average of 33.6 °C / 92 F, ranging from 20.7 to 53.2 °C for the class Tablet.
(±) The bottom heats up to a maximum of 41.2 °C / 106 F, compared to the average of 33.2 °C / 92 F
(+) In idle usage, the average temperature for the upper side is 24.7 °C / 76 F, compared to the device average of 30 °C / 86 F.
Speakers
The monaural speaker is louder than expected to make the tablet a good choice for video playback. Quality, on the other hand, is lacking especially in terms of bass. Our pink noise measurements show a drop at about 1000 Hz compared to 500 Hz on many laptops.

Alldocube M8 T801 audio analysis
(+) | speakers can play relatively loud (83.3 dB)
Bass 100 - 315 Hz
(-) | nearly no bass - on average 38% lower than median
(+) | bass is linear (4.9% delta to prev. frequency)
Mids 400 - 2000 Hz
(±) | reduced mids - on average 7.8% lower than median
(±) | linearity of mids is average (13% delta to prev. frequency)
Highs 2 - 16 kHz
(±) | higher highs - on average 6% higher than median
(±) | linearity of highs is average (8.3% delta to prev. frequency)
Overall 100 - 16.000 Hz
(-) | overall sound is not linear (34.6% difference to median)
Compared to same class
» 94% of all tested devices in this class were better, 2% similar, 4% worse
» The best had a delta of 7%, average was 20%, worst was 129%
Compared to all devices tested
» 93% of all tested devices were better, 1% similar, 6% worse
» The best had a delta of 4%, average was 24%, worst was 134%
Apple MacBook 12 (Early 2016) 1.1 GHz audio analysis
(+) | speakers can play relatively loud (83.6 dB)
Bass 100 - 315 Hz
(±) | reduced bass - on average 11.3% lower than median
(±) | linearity of bass is average (14.2% delta to prev. frequency)
Mids 400 - 2000 Hz
(+) | balanced mids - only 2.4% away from median
(+) | mids are linear (5.5% delta to prev. frequency)
Highs 2 - 16 kHz
(+) | balanced highs - only 2% away from median
(+) | highs are linear (4.5% delta to prev. frequency)
Overall 100 - 16.000 Hz
(+) | overall sound is linear (10.2% difference to median)
Compared to same class
» 7% of all tested devices in this class were better, 2% similar, 91% worse
» The best had a delta of 5%, average was 18%, worst was 53%
Compared to all devices tested
» 5% of all tested devices were better, 1% similar, 94% worse
» The best had a delta of 4%, average was 24%, worst was 134%
Energy Management
Power Consumption
The M8 is not very power efficient. Strangely, it still pulls about 2 W from the outlet when powered off or in Sleep mode even when the battery is fully charged. Consumption when idling on the Home screen is higher than most other tablets as well as shown by the table below. Watching a video draws about 6 W while full CPU utilization with the CPU Throttling Test app draws just over 11 W.
| Off / Standby | |
| Idle | |
| Load |
|
Key:
min: | |
| Alldocube M8 T801 MT6797X, Mali-T880 MP4, 32 GB eMMC Flash, IPS, 1920x1200, 8" | Amazon Fire HD 8 2018 MT8163 V/B 1.3 GHz, Mali-T720, 16 GB eMMC Flash, IPS, 1280x800, 8" | Lenovo Tab 4 8 425, Adreno 308, 16 GB eMMC Flash, IPS, 1280x800, 8" | Huawei MediaPad M5 8.4 Kirin 960, Mali-G71 MP8, 32 GB eMMC Flash, IPS, 2560x1600, 8.4" | Xiaomi Mi Pad 4 SD 660, Adreno 512, 64 GB eMMC Flash, IPS LCD, 1920x1200, 8" | Asus ZenPad 3 8.0 Z581KL-1A001A 650 MSM8956, Adreno 510, 32 GB eMMC Flash, IPS, 2048x1536, 7.9" | |
|---|---|---|---|---|---|---|
| Power Consumption | 39% | 37% | 20% | 20% | 31% | |
| Idle Minimum * (Watt) | 3.4 | 0.97 71% | 1.1 68% | 2.1 38% | 1.2 65% | 1.01 70% |
| Idle Average * (Watt) | 5.1 | 3.26 36% | 3.51 31% | 3.74 27% | 2.2 57% | 2.71 47% |
| Idle Maximum * (Watt) | 5.3 | 3.37 36% | 4.14 22% | 4.33 18% | 4.1 23% | 2.75 48% |
| Load Average * (Watt) | 6 | 5.68 5% | 4.86 19% | 6.32 -5% | 8.2 -37% | 7.28 -21% |
| Load Maximum * (Watt) | 11.5 | 6.21 46% | 6.13 47% | 9.13 21% | 12.2 -6% | 10.02 13% |
* ... smaller is better
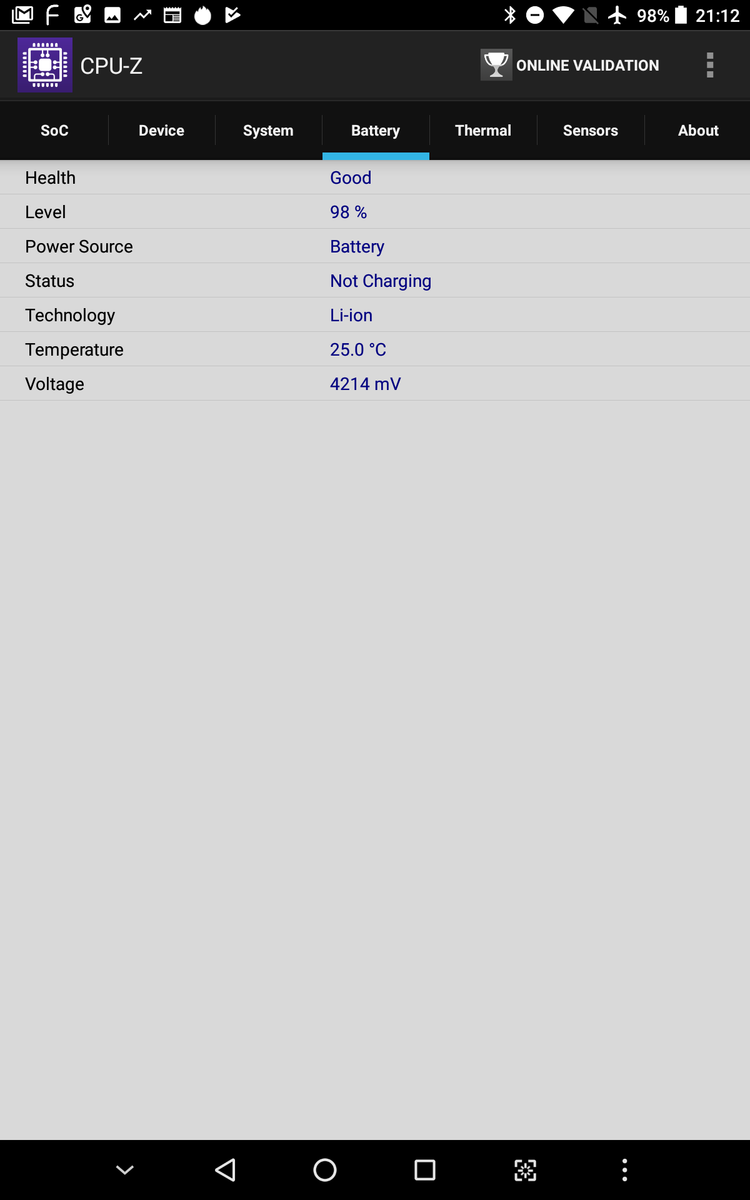
Battery Life
Runtimes from the 5500 mAh battery are slightly below average for a tablet possibly due to the higher-than-usual power consumption measured above. Expect a real-world WLAN runtime of about 7 hours compared to almost twice that on the Xiaomi Mi Pad 4.
| Alldocube M8 T801 5500 mAh | Lenovo Tab 4 8 4850 mAh | Amazon Fire HD 8 2018 4750 mAh | Huawei MediaPad M5 8.4 5100 mAh | Xiaomi Mi Pad 4 6000 mAh | Asus ZenPad 3 8.0 Z581KL-1A001A 4680 mAh | |
|---|---|---|---|---|---|---|
| Battery runtime | 7% | 17% | 50% | 97% | 11% | |
| WiFi v1.3 (h) | 7 | 7.5 7% | 8.2 17% | 10.5 50% | 13.8 97% | 7.8 11% |
| Reader / Idle (h) | 20.1 | 19.5 | 19.2 | 22.7 | 19.1 | |
| Load (h) | 4.6 | 5.3 | 5 | 3.7 | 4.4 |
Pros
Cons
Verdict
The strongest qualities of the Alldocube M8 are its relatively strong build and optional 4G LTE. The unit feels tougher than most in its price range since it is slightly thicker. We're more comfortable recommending the tablet for children or general family use since it can more likely survive the inevitable bumps and bruises compared to thinner or lighter alternatives.
Otherwise, the rest of the tablet is standard budget fare. The display is dimmer than average, battery life is unimpressive, cameras are lackluster, and performance is not perfectly smooth. Luxurious extras like NFC, IR remote, automatic brightness sensor, and USB Type-C are all omitted.
The Alldocube M8 works best as an at-home tablet or secondary tablet when on the road. While it gets the job done, it doesn't have the performance, brightness, storage, cameras, longevity, or features to replace a mid-range alternative or smartphone.
Alldocube M8 T801
- 03/15/2019 v6 (old)
Allen Ngo
Price comparison
