TrekStor Surftab Theatre L15 Tablet Review

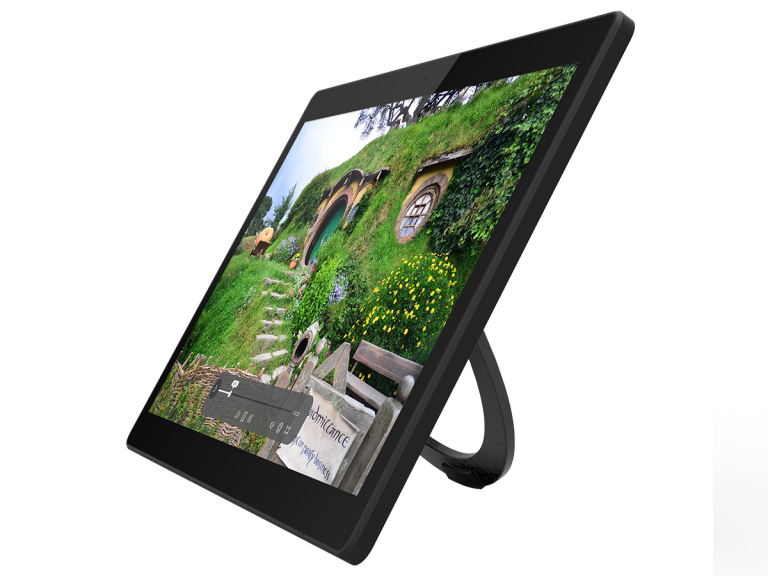
Why go small, when you can go big? This is probably what German manufacturer TrekStor asked when designing its Surftab Theatre series, which all have huge displays by tablet standards. The focus of this review is the Surftab Theatre L15, which has a 15.6-inch IPS panel that operates natively at 1080p. Interestingly, TrekStor has equipped the tablet with just a 4,800 mAh battery, which is comparatively small for a device with such a large screen. The L15 can recharge at 7.4 V though, so it may not take long to reach 100% battery capacity again at least.
TrekStor has equipped the L15 with a MediaTek MT8163 V/A SoC, which integrates an ARM Mali-T720 MP2 GPU. The entry-level chip is complemented by 2 GB of RAM and 32 GB of eMMC flash storage. There is also a 2 MP front-facing camera for making video calls or for taking selfies.
Finding a direct competitor to the L15 proved difficult as many tablets have much smaller displays than our review unit. Hence, we have chosen to compare the TrekStor tablet against tablets with 10- and 11-inch displays instead. Our comparison devices will include the Alldocube X, Chuwi Hi9 Plus, Huawei MediaPad M5 10.8 Pro, and the Lenovo Tab M10.
Case
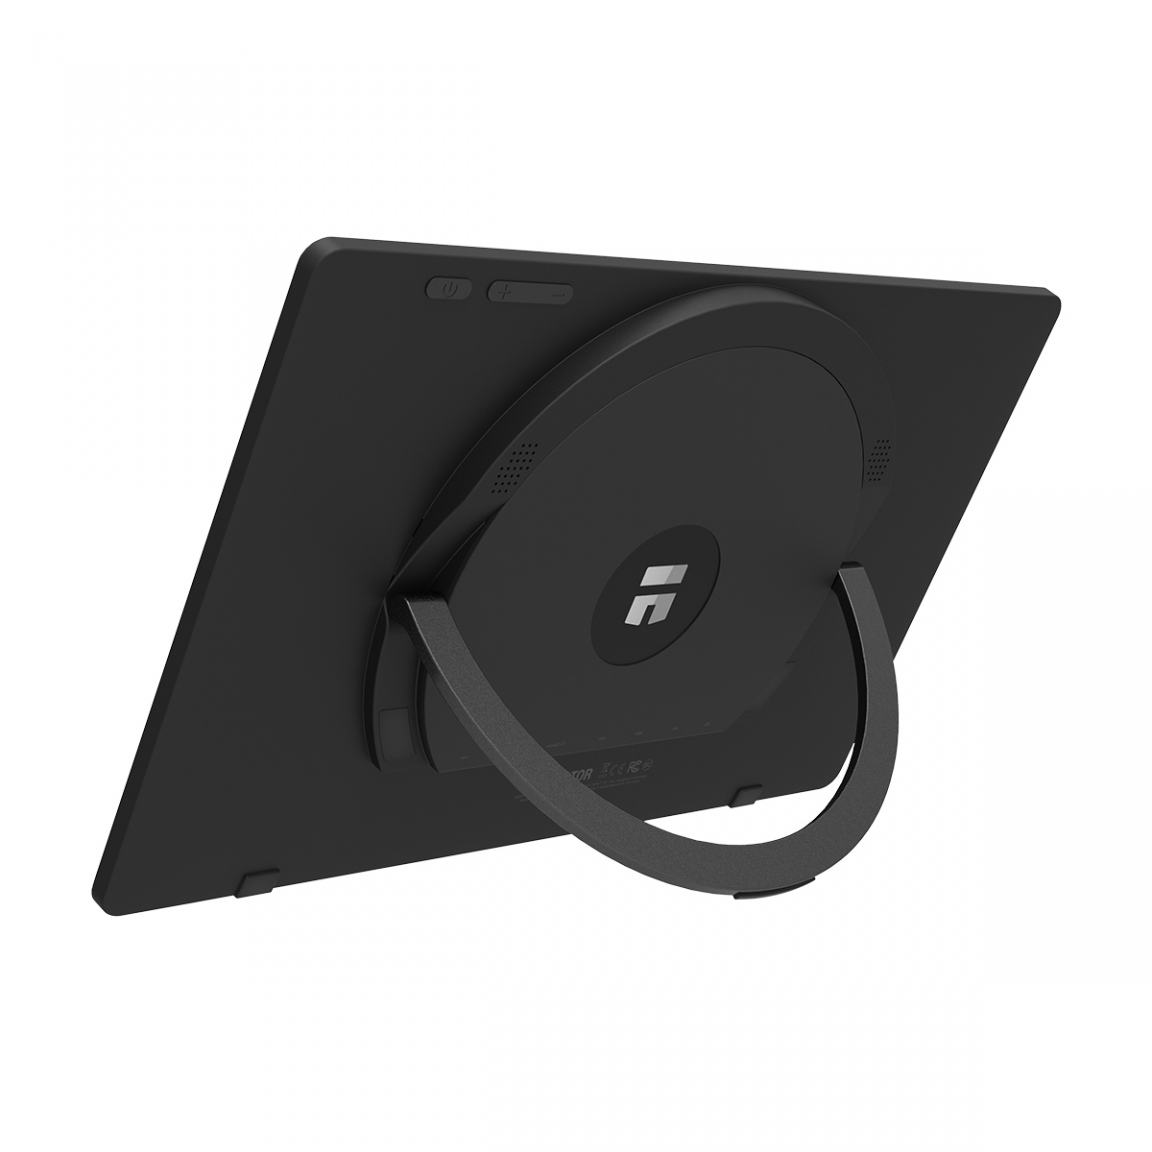
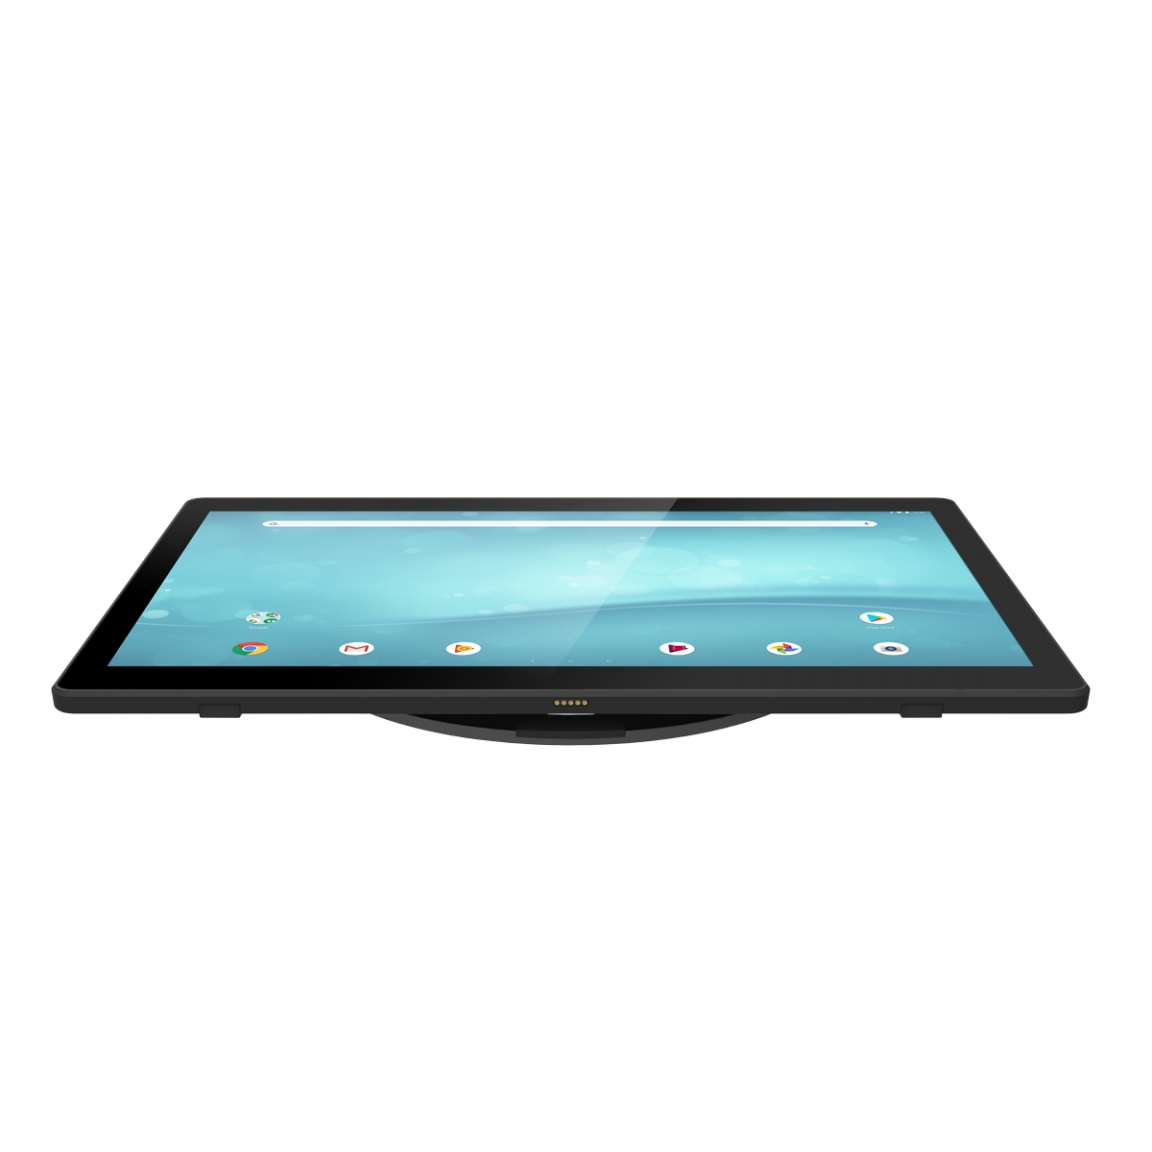
The Theatre L15 is only available in black and is made largely from plastic. The tablet has comparatively thick bezels by 2019 standards and only has a 73% screen-to-body ratio. Our review unit is thick and heavy too at 21.7 mm and 1.6 kg, respectively, which makes it too bulky to hold comfortably in our hands for a prolonged period. Thankfully, TrekStor has included a fold-out stand that can open to a maximum angle of around 80°.
Our test device is relatively well-built considering its size, the materials used and its price, but we can twist it without much force. Moreover, applying pressure to the front of the device causes the display to deform. In short, the L15 has acceptable build quality, but it will not win any awards.
The power and volume buttons sit firmly in their apertures at the back of the case. Both buttons hardly wobble, although we found them difficult to reach in daily use.
Connectivity
The L15 has 32 GB of eMMC flash storage, of which 25 GB is available. This is rather limited by today’s standards, but you can expand the available storage with a microSD card. Our review unit cannot read the exFAT file system, which limits it to being able to only read up to 4 GB files. You could also connect a USB stick via the L15’s three USB 2.0 Type-A ports, as you could do with other peripherals like a keyboard and mouse. Please keep in mind that the L15 lacks either a micro USB or USB Type-C port and charges using a proprietary barrel power connector.
TrekStor has also equipped the tablet with a Mini-HDMI port, a memory card reader and a 3.5 mm jack. You can either use the Mini-HDMI port to output audio and video to an external monitor or use Miracast to wirelessly cast the screen to a TV or monitor that supports such technology.
However, the L15 has only L3 DRM Widevine certification, which means that it is unable to stream HD content on services like Amazon Prime or Netflix. Devices require L1 certification to be able to do so, and it is not something that manufacturers can roll-out in an update. Hence, you will not be able to make use of the L15’s 1080p resolution with most streaming services.
Software
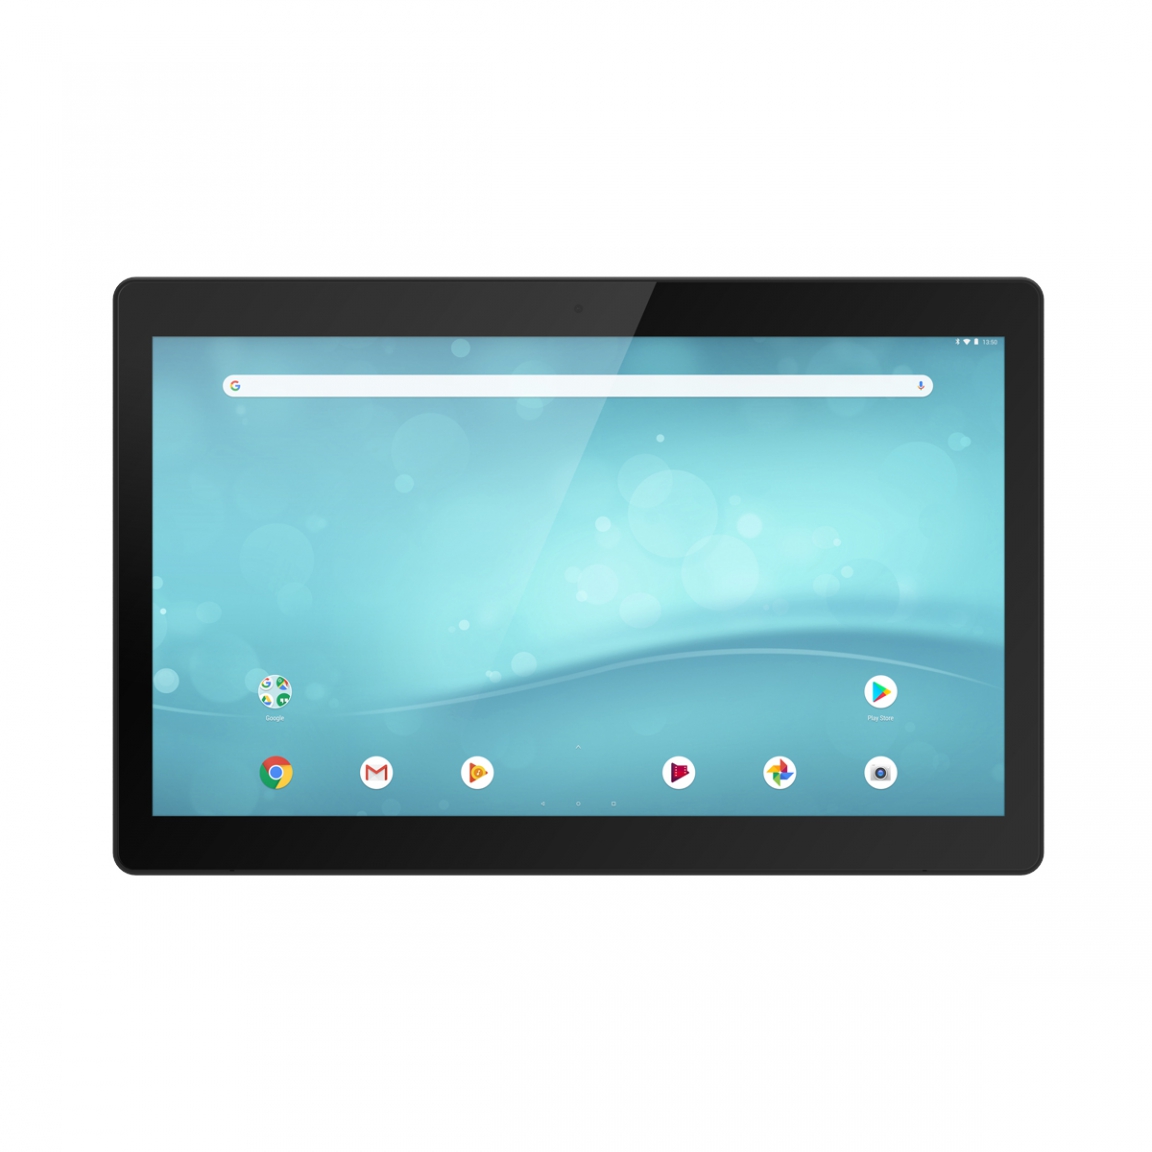
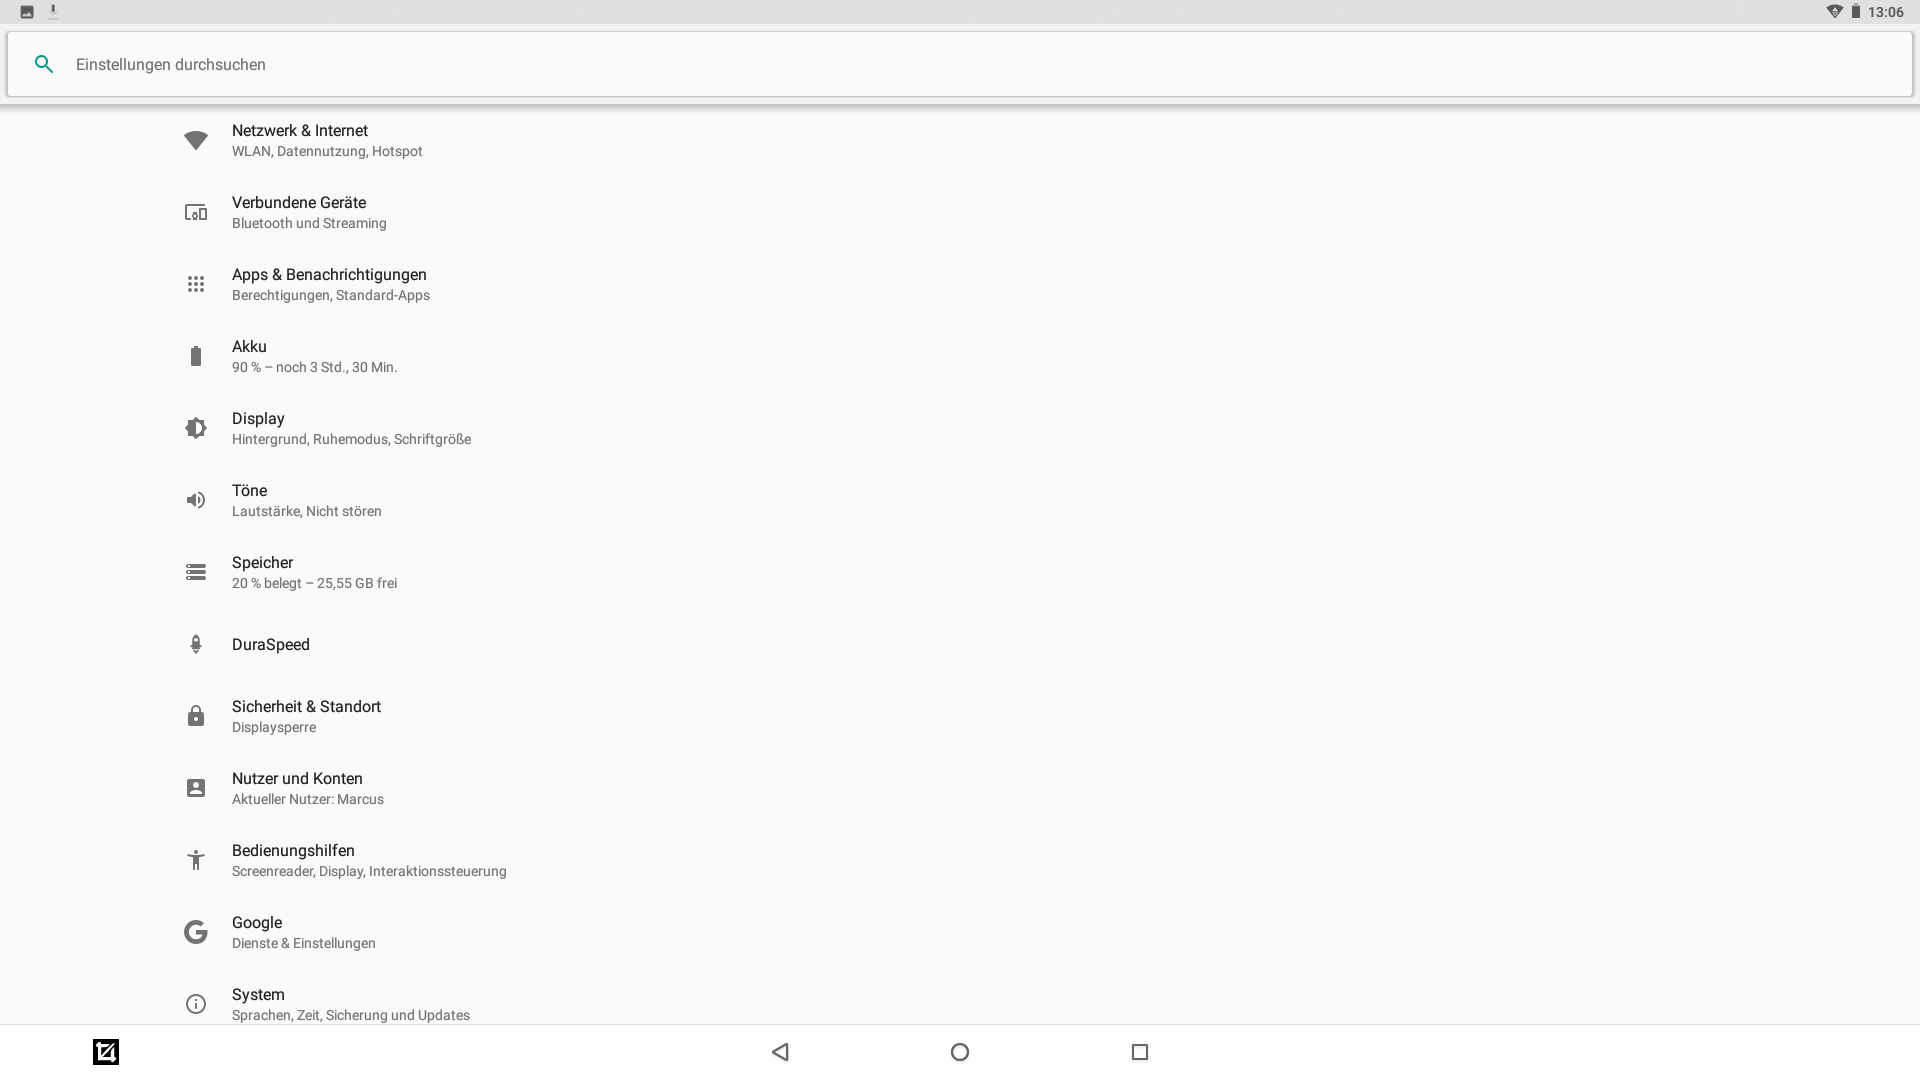
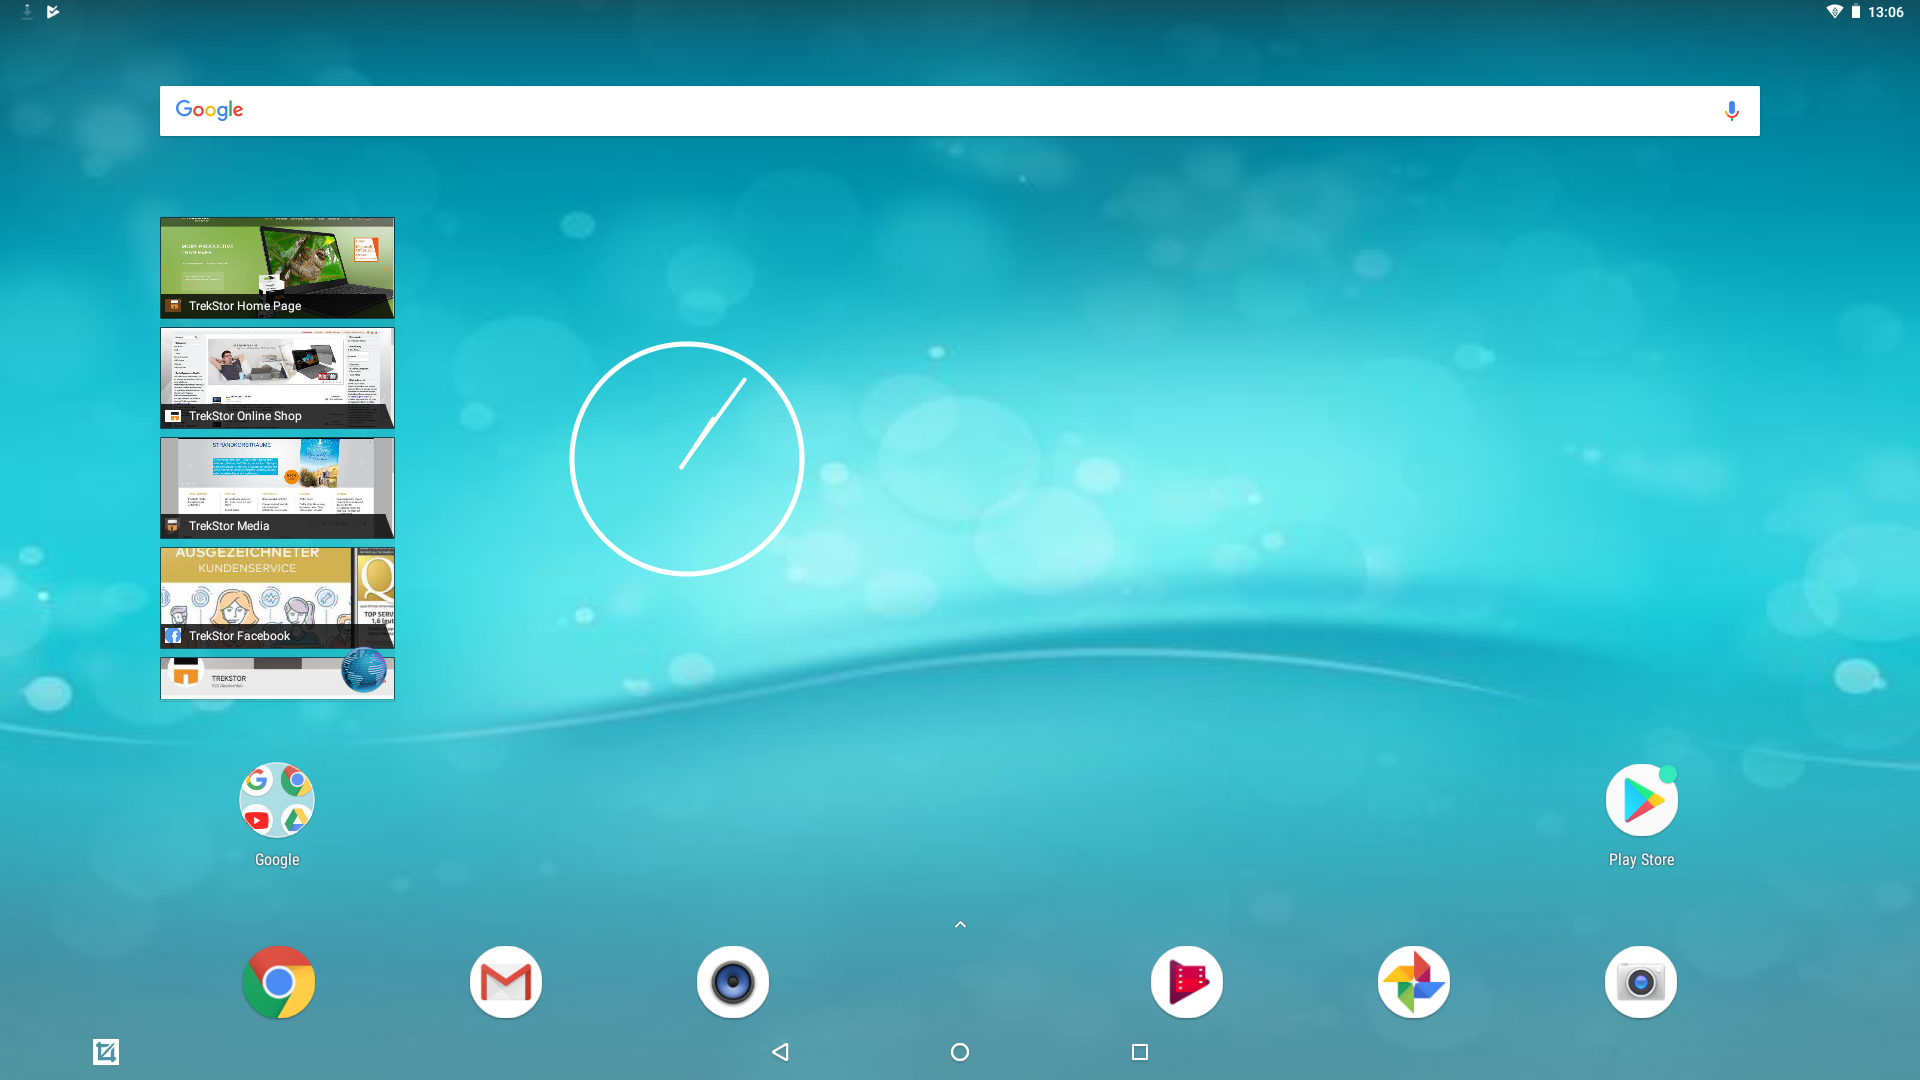
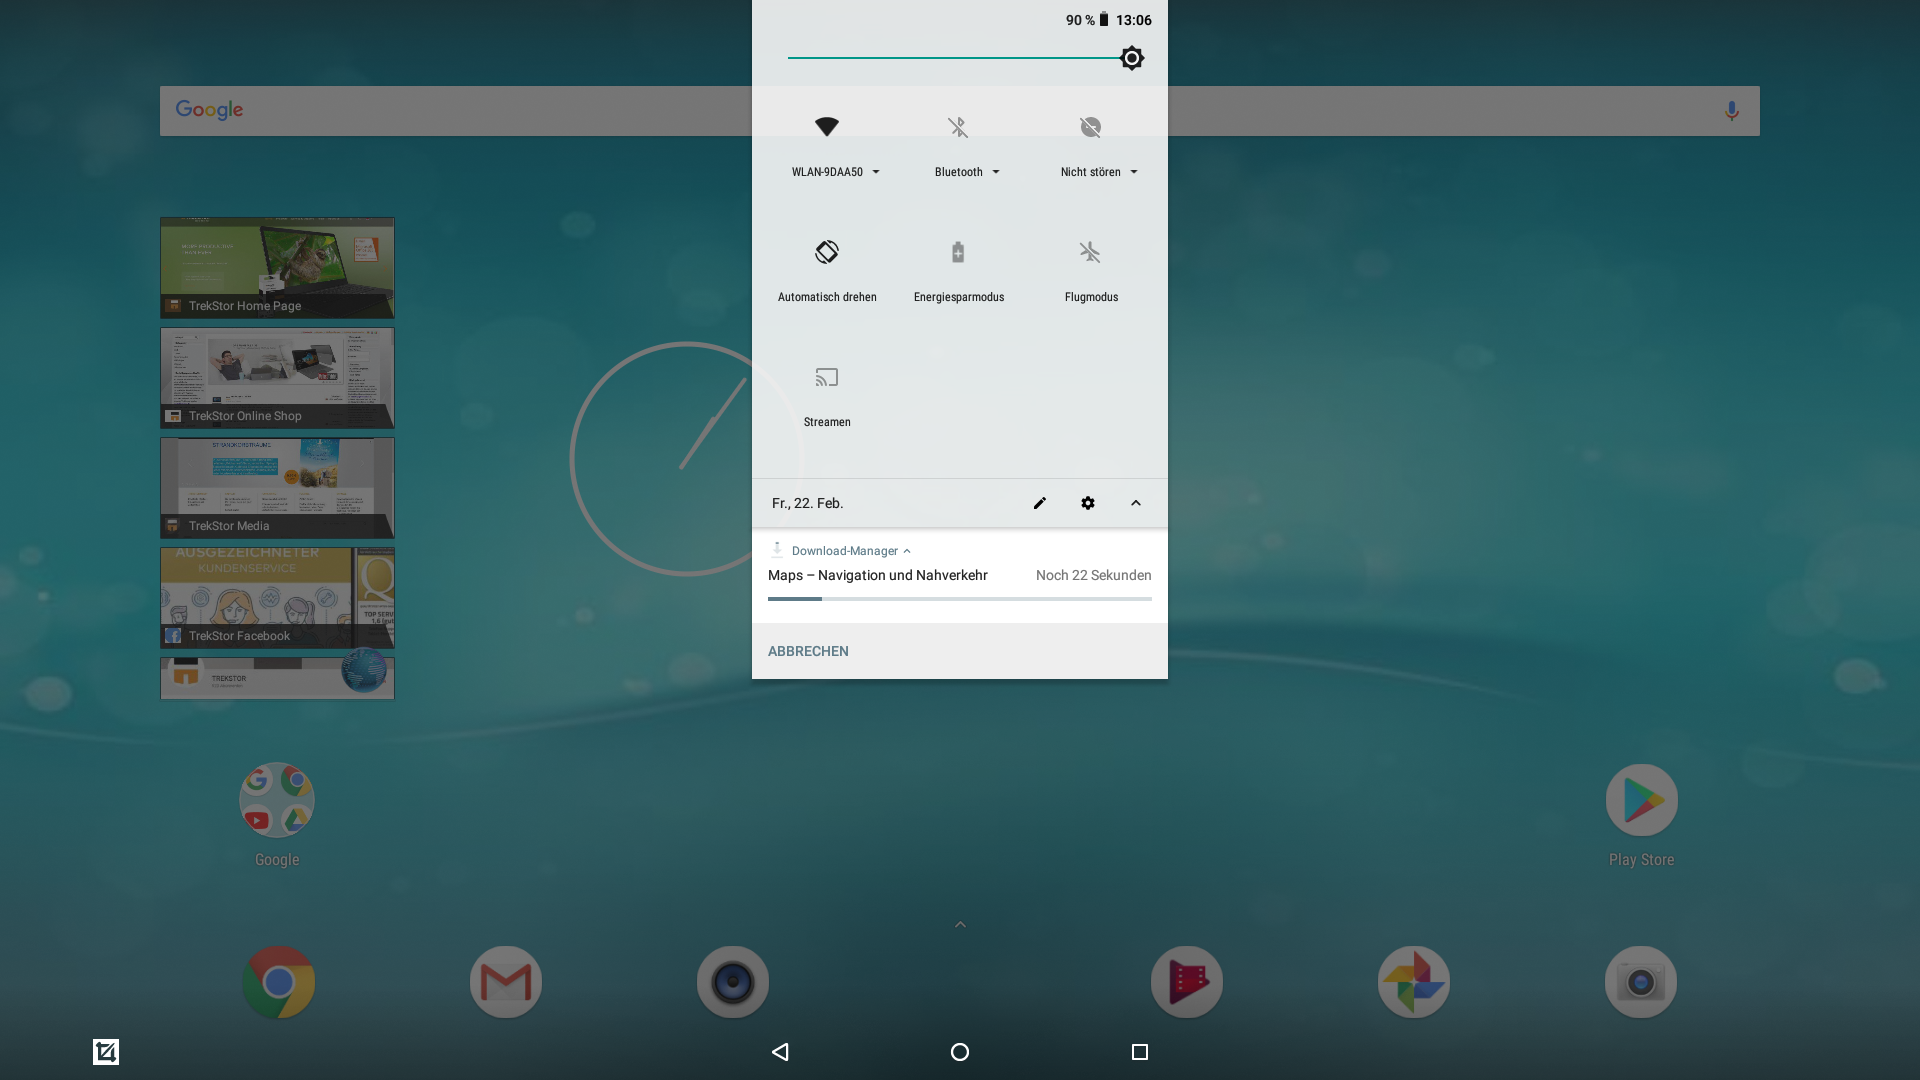
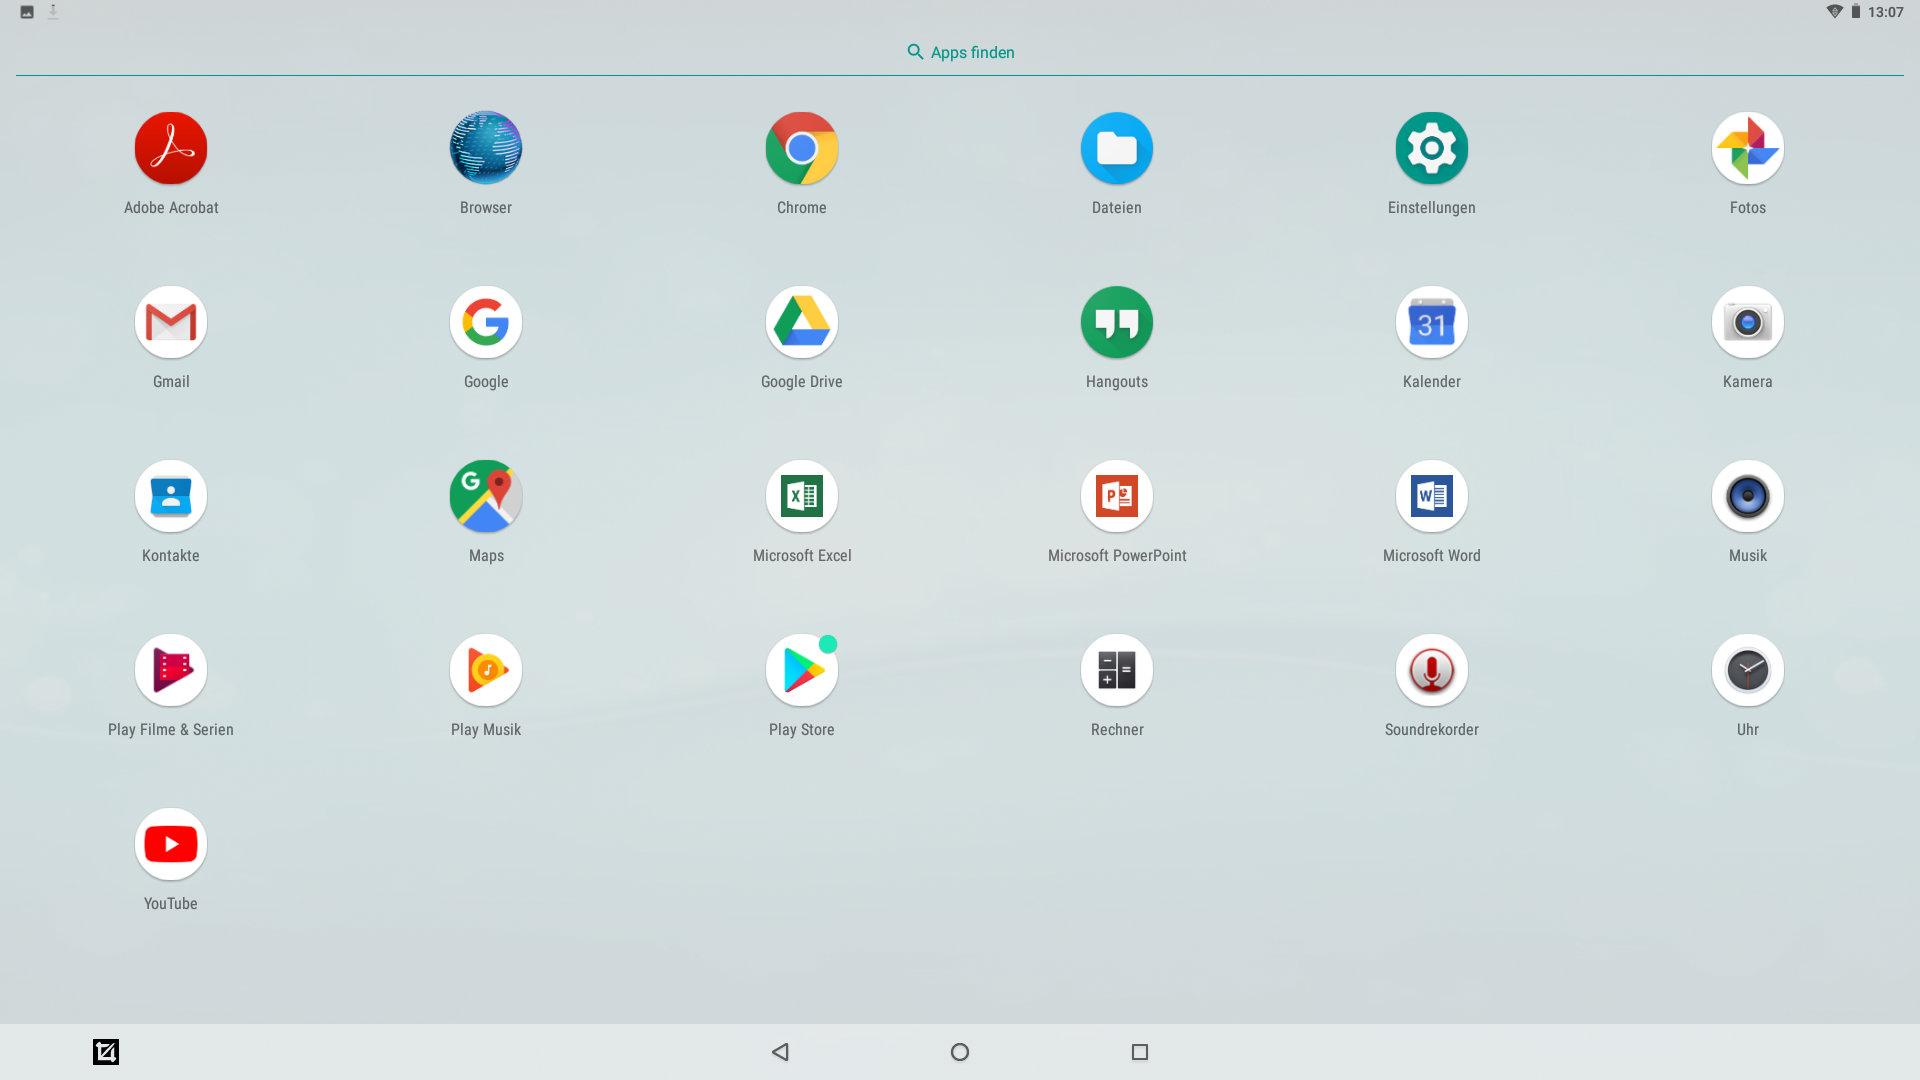
The L15 ships with Android 8.1 Oreo at the time of writing, which looks and feels much like stock Android. TrekStor has installed its own launcher among other subtle changes, but it should not take most people long to acclimatise to operating the L15 if they have previously used Android. TrekStor has preinstalled hardly any bloatware, which is always welcome.
Our review unit arrived with August 2018 security patches installed though, which were around five months old at the time of testing. TrekStor has not announced any upgrade schedule for the L15, so we would not hold our breath on the company updating the tablet to Android 9.0 Pie or beyond.
Communication
The L15 has comparatively poor near-field and Internet connectivity. The tablet supports Bluetooth 4.0, which is now outdated and does not have GPS or LTE connectivity. Likewise, the L15 supports up to IEEE 802.11n Wi-Fi and can connect to 2.4 GHz or 5 GHz networks, but there is no support for the faster 802.11ac standard. Correspondingly, our review unit finished bottom of our iperf3 Client comparison tables and averaged around 93 Mb/s in the two tests that we conducted. By contrast, all our comparison devices achieved almost 200 Mb/s or faster in the same tests, so the L15 offers worse value for money in this regard. Moreover, our review unit only achieved -49 dBm attenuation when sat next to our Linksys EA 8500 reference router, which is disappointingly weak.
We also tested the call quality of our review unit using Skype as we suspect that many people will use the L15 for video calls. The built-in microphone worked well during our tests with our call partner remarking that they could hear our voice clearly. However, the L15’s speakers distorted our call partner’s voice and made it sound unnatural, which makes the L15 a poor fit for those who make and receive plenty of video calls.
Camera

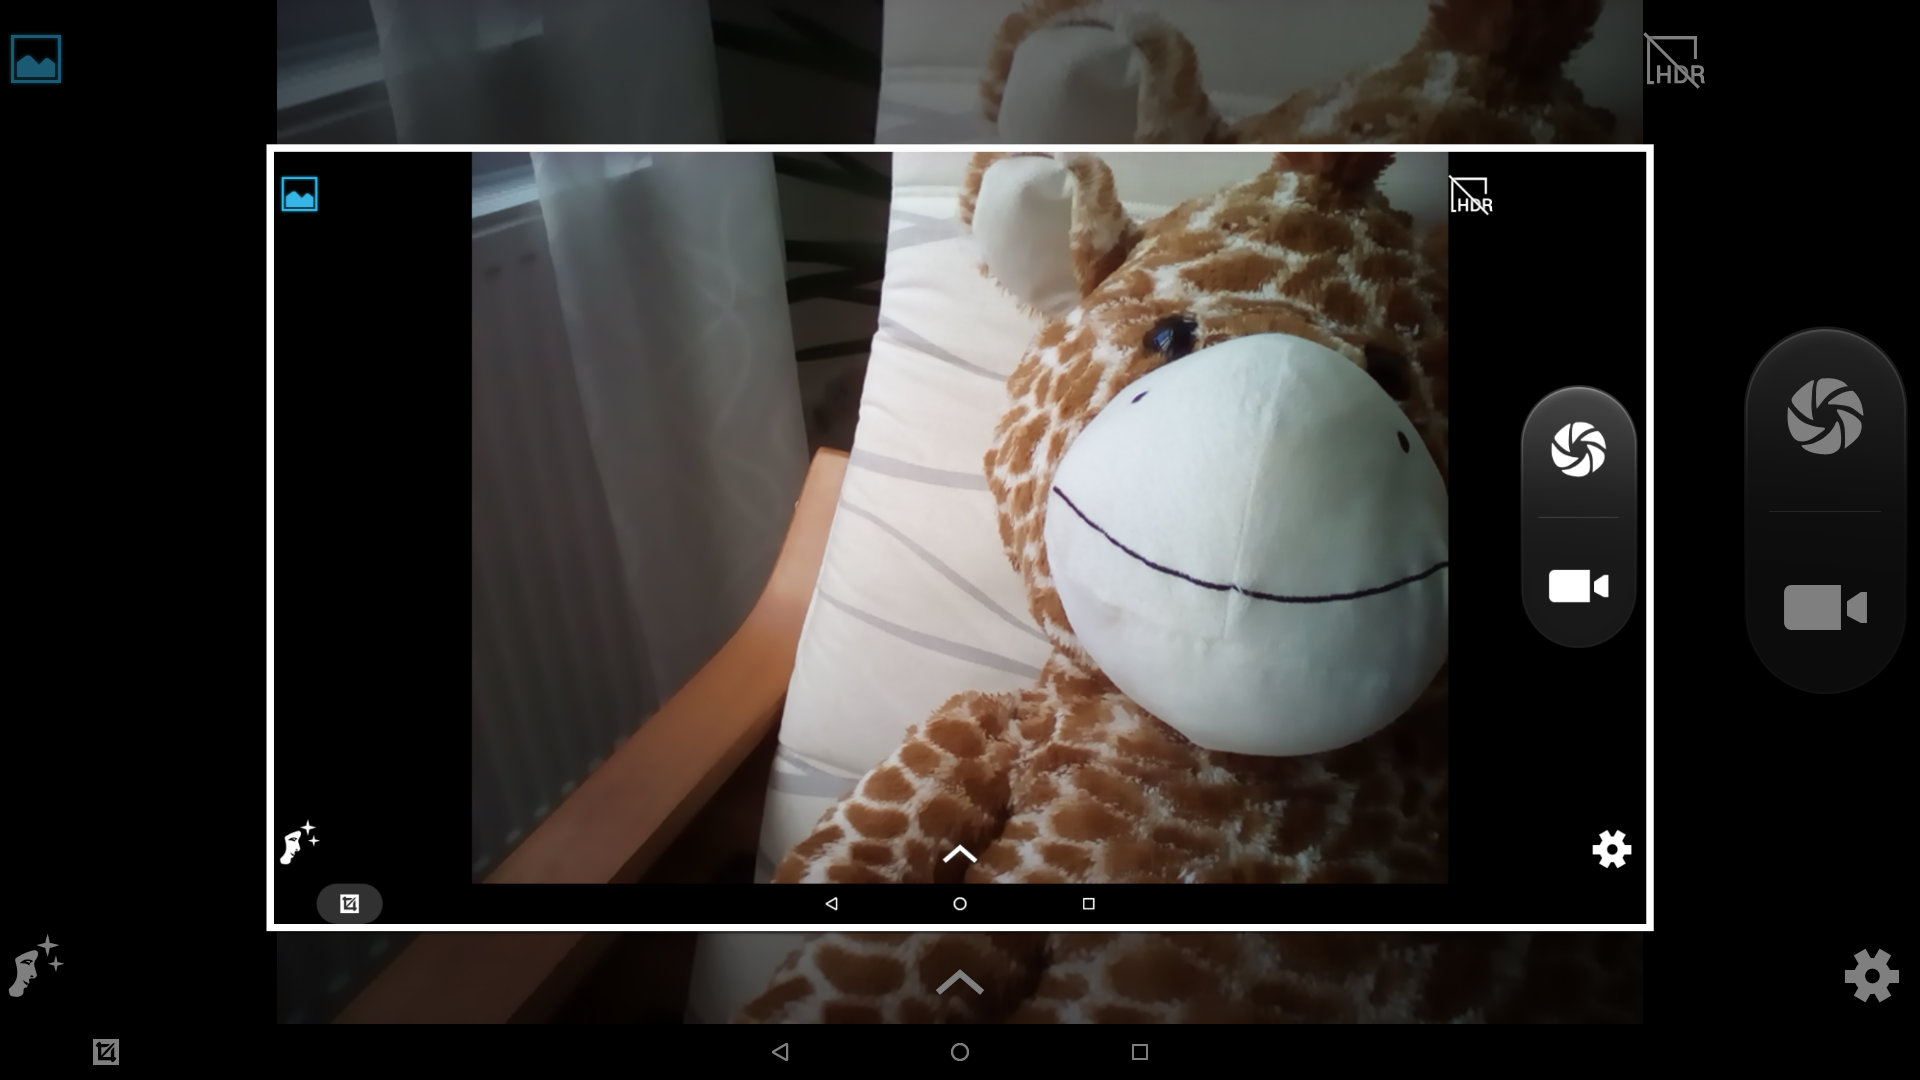
The L15 has a single 2 MP front-facing camera that can take pictures at up to 1600x1200 in a 4:3 aspect ratio. TrekStor does not provide any detailed information about the camera sensor that it has equipped the L15 with, but it is only good enough for making occasional video calls. The sensor can record videos in up to 1080p too, but the image quality is poor, as demonstrated by our photos here on the right.
Accessories & Warranty
The L15 comes with a 36 W DC power supply (12 V/3 A), a cleaning cloth and some documentation including legal information, a quick-start guide and safety instructions.
The tablet comes with 24 months manufacturer’s warranty. Please see our Guarantees, Return policies and Warranties FAQ for country-specific information.
Input Devices & Operation
The L15 has a 10-point multitouch capacitive touchscreen that remains accurate into the corners of the display and is protected by glass that feels smooth to the touch. Unfortunately, we noticed that our review unit sometimes took longer than we would have liked to reproduce our inputs and even inaccurately did so on some occasions. We suspect that TrekStor, or whoever manufactured the panel, did not affix the touchscreen to the display glass as most OEMs do and left a small air gap between the two components. Hence, this gap sometimes interferes with the tablet’s ability to reproduce inputs accurately.
TrekStor has not included any biometric authentication functionality like a fingerprint sensor, but you can still use a password, pattern or PIN to secure the tablet. The L15 also uses the standard three navigation buttons, which are arranged from left to right as Back, Home and Recents like many other Android devices. TrekStor has preinstalled Google Gboard as the default keyboard, which functions just as well as it does on other devices that we tested, except for the touchscreen issue that we described. You can install a different keyboard from places like the Google Play Store too if you are not a fan of Google Gboard.
Display
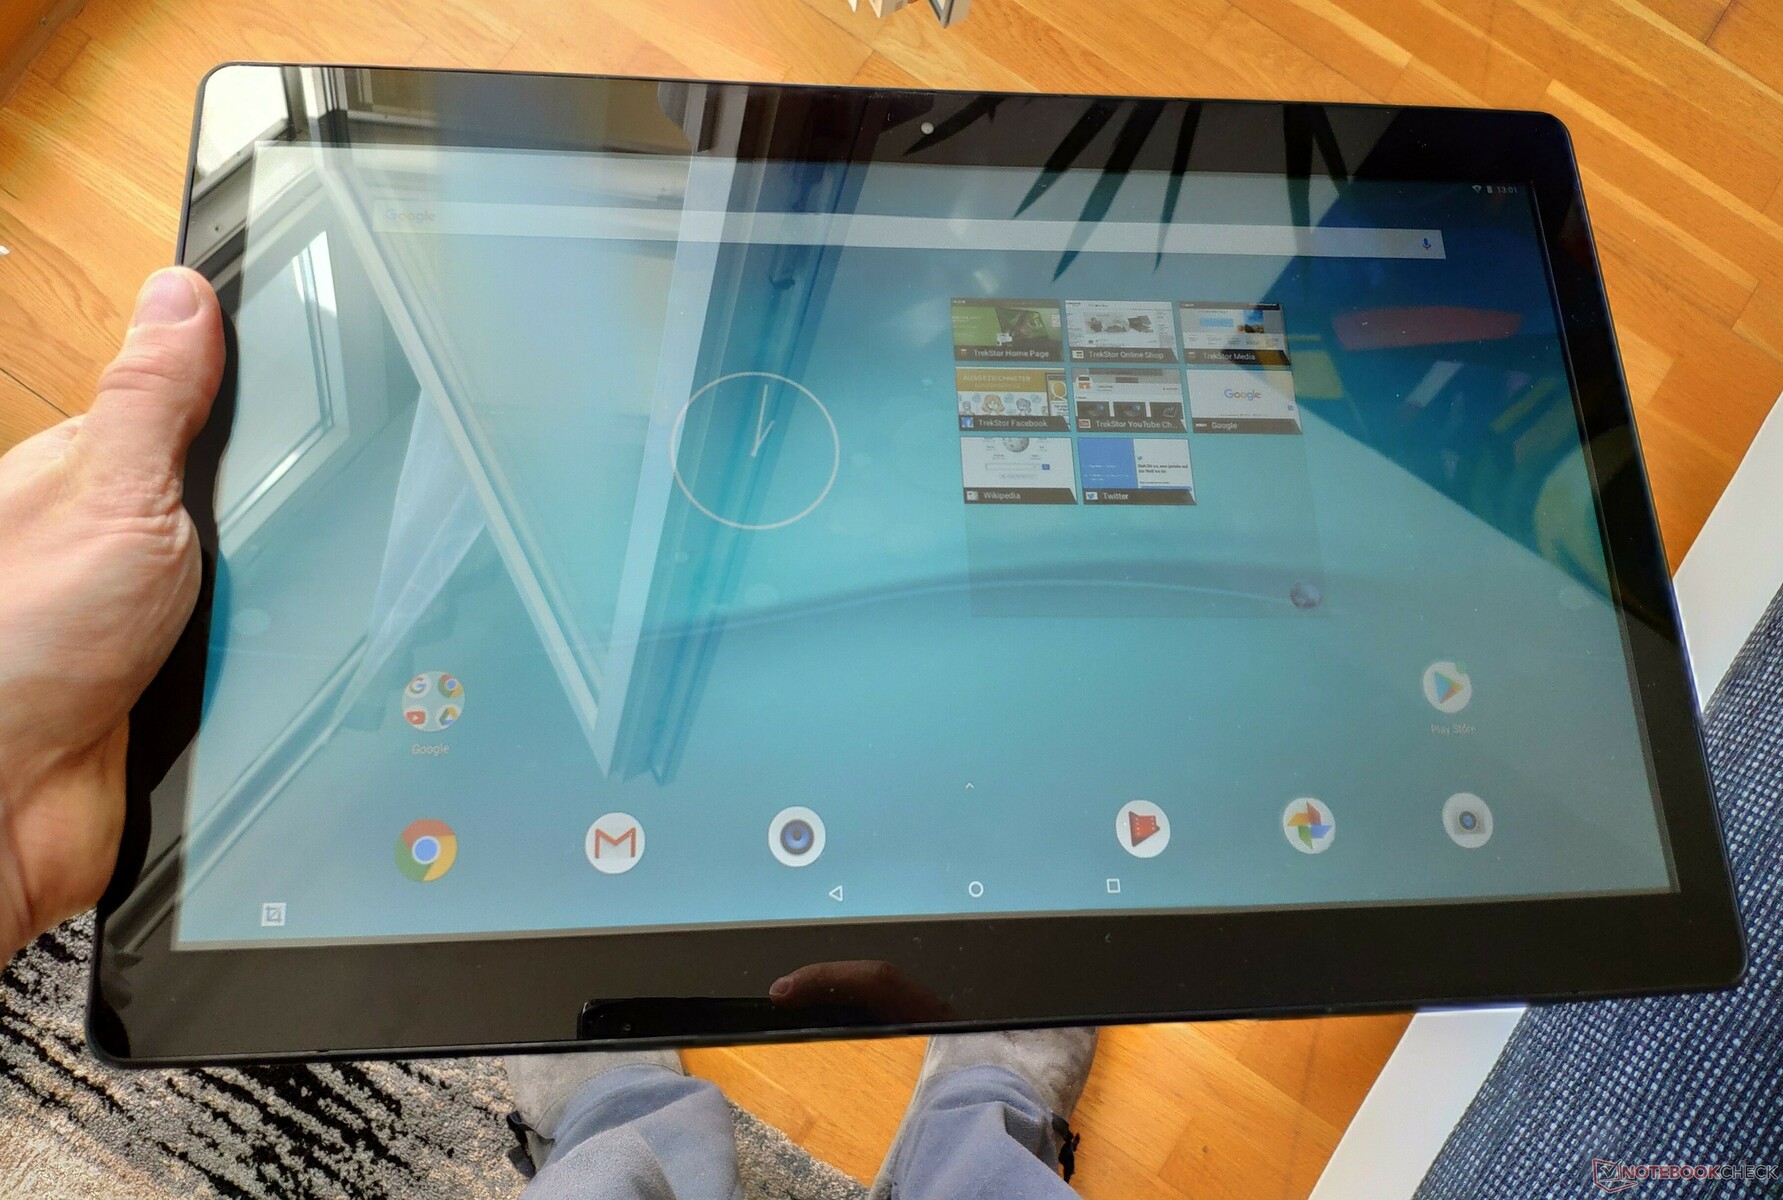
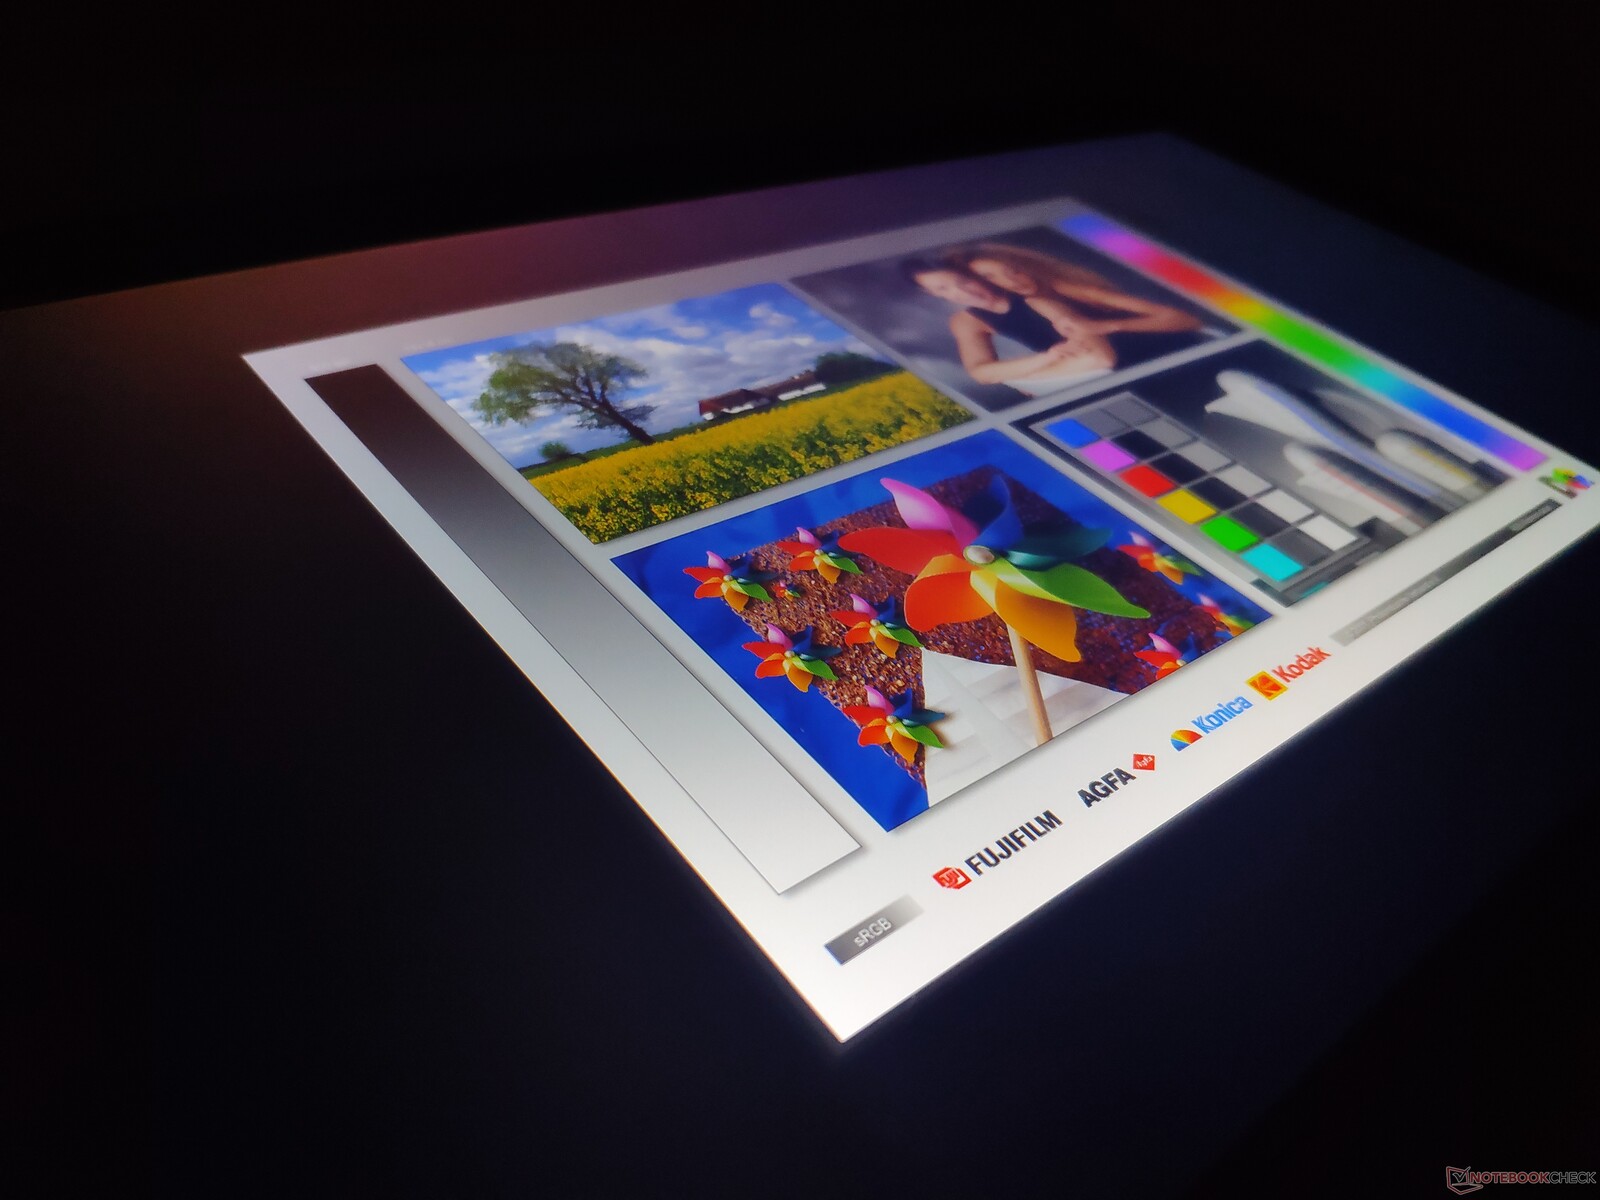
The L15 has a 15.6-inch IPS display that operates natively at 1920x1080 and with a pixel density of 141 PPI. The screen should look sharp enough for most people, but we can discern individual pixels with elements of the UI like digits and letters. Many of our comparison devices have higher resolution displays, but this is only useful for when you hold a device relatively close to your face, which we suspect most people will not do with the L15.
Our review unit achieves an average maximum luminosity of 206 cd/m² according to X-Rite i1Pro 2, which is noticeably darker than the displays in our comparison devices. Moreover, the screen is only 82% evenly lit, which means that large areas of the same colour will not look homogeneous. The more realistic APL50 test yields almost the same results, which demonstrates that the L15 just has a disappointingly dim display. It is also worth noting that the tablet has no ambient light sensor, so it cannot automatically adjust the display brightness to changing lighting conditions. Hence, you must change brightness manually, of which we would expect better from a 300-Euro (~$341) device.
It is uncommon for devices with LCD panels to use pulse-width modulation (PWM) to regulate display brightness, but the L15 does, which is disappointing. PWM can cause eye strain and headaches for some people, but we measure our review unit flickering at 1 kHz when set to 27% brightness and below, which should be high enough not to cause issues for most people.
| |||||||||||||||||||||||||
Brightness Distribution: 82 %
Center on Battery: 224 cd/m²
Contrast: 800:1 (Black: 0.28 cd/m²)
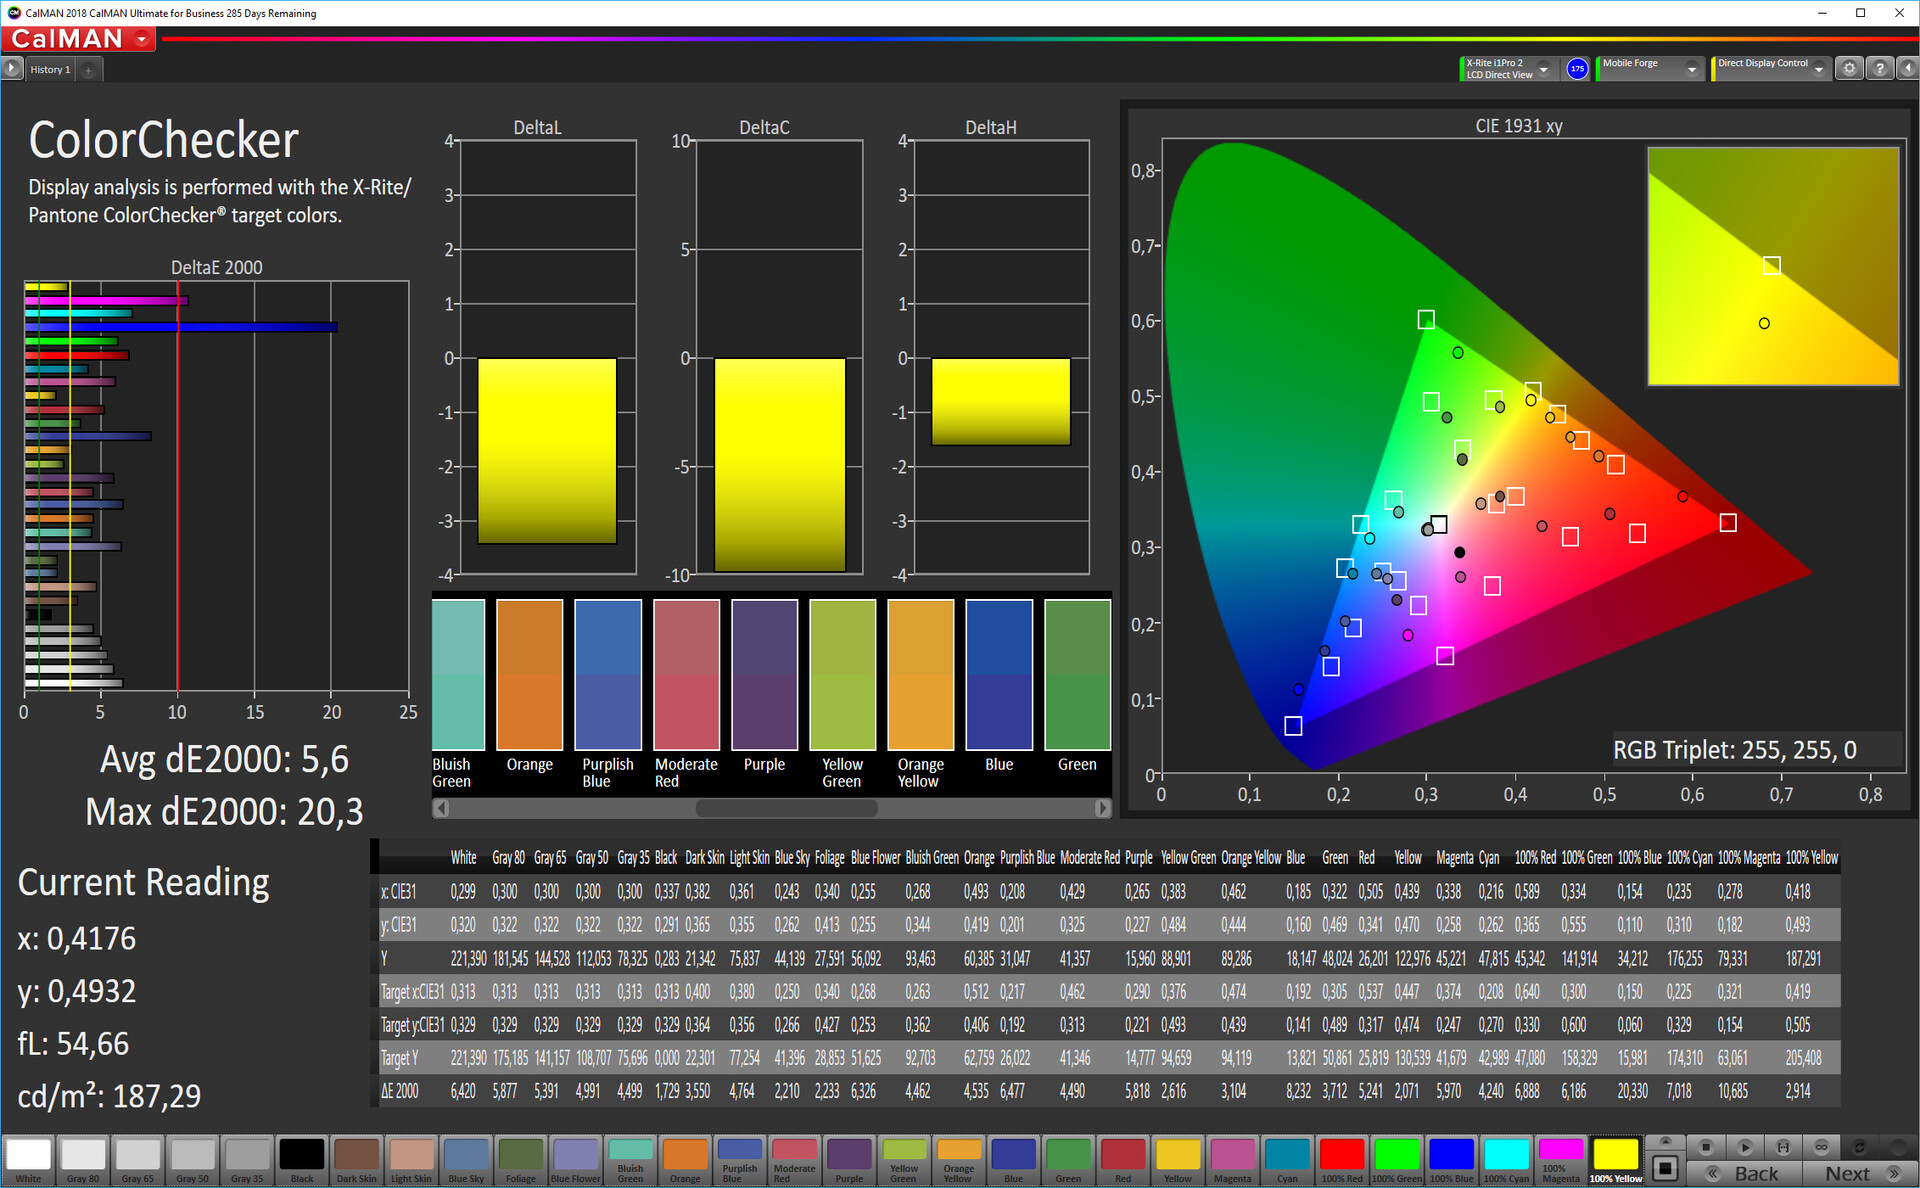
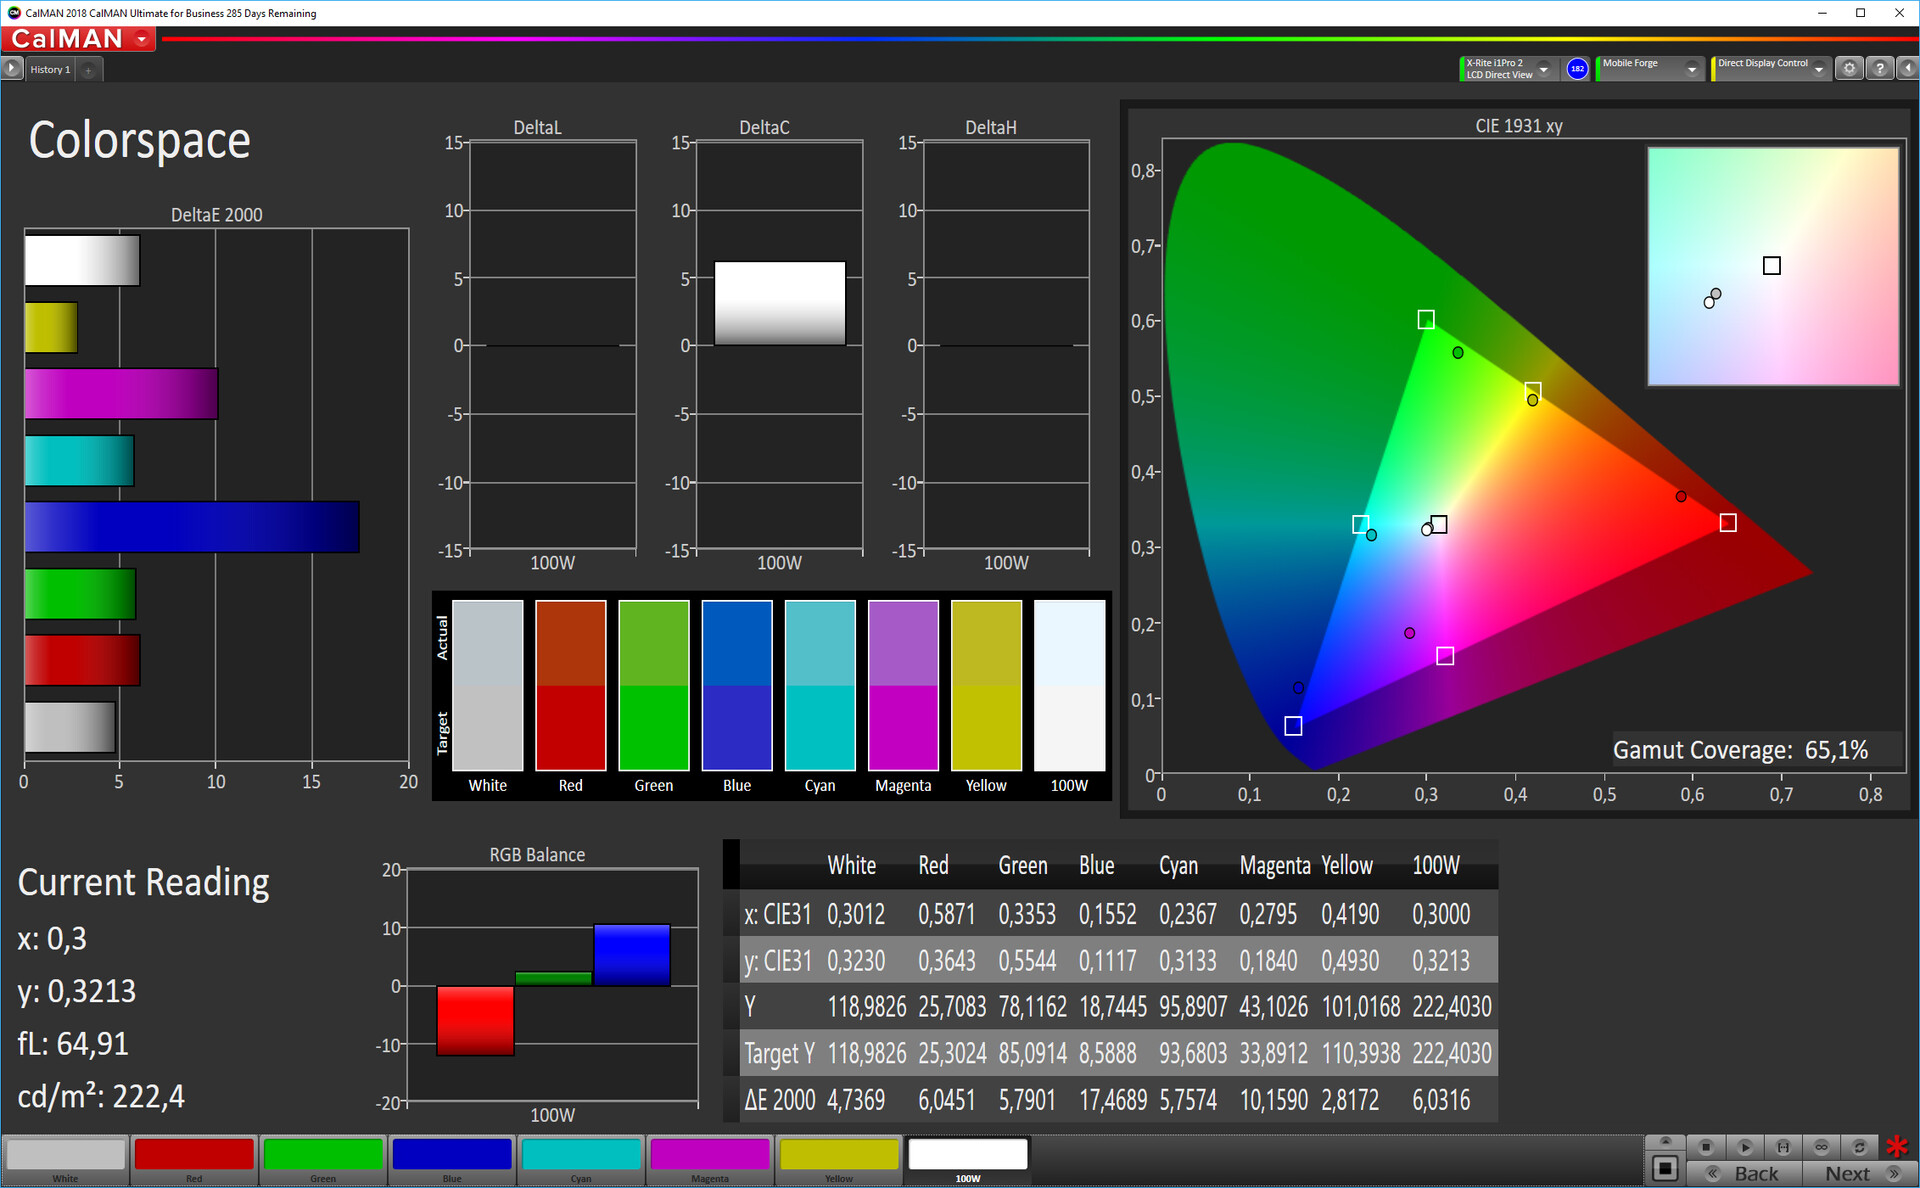
ΔE ColorChecker Calman: 5.6 | ∀{0.5-29.43 Ø4.73}
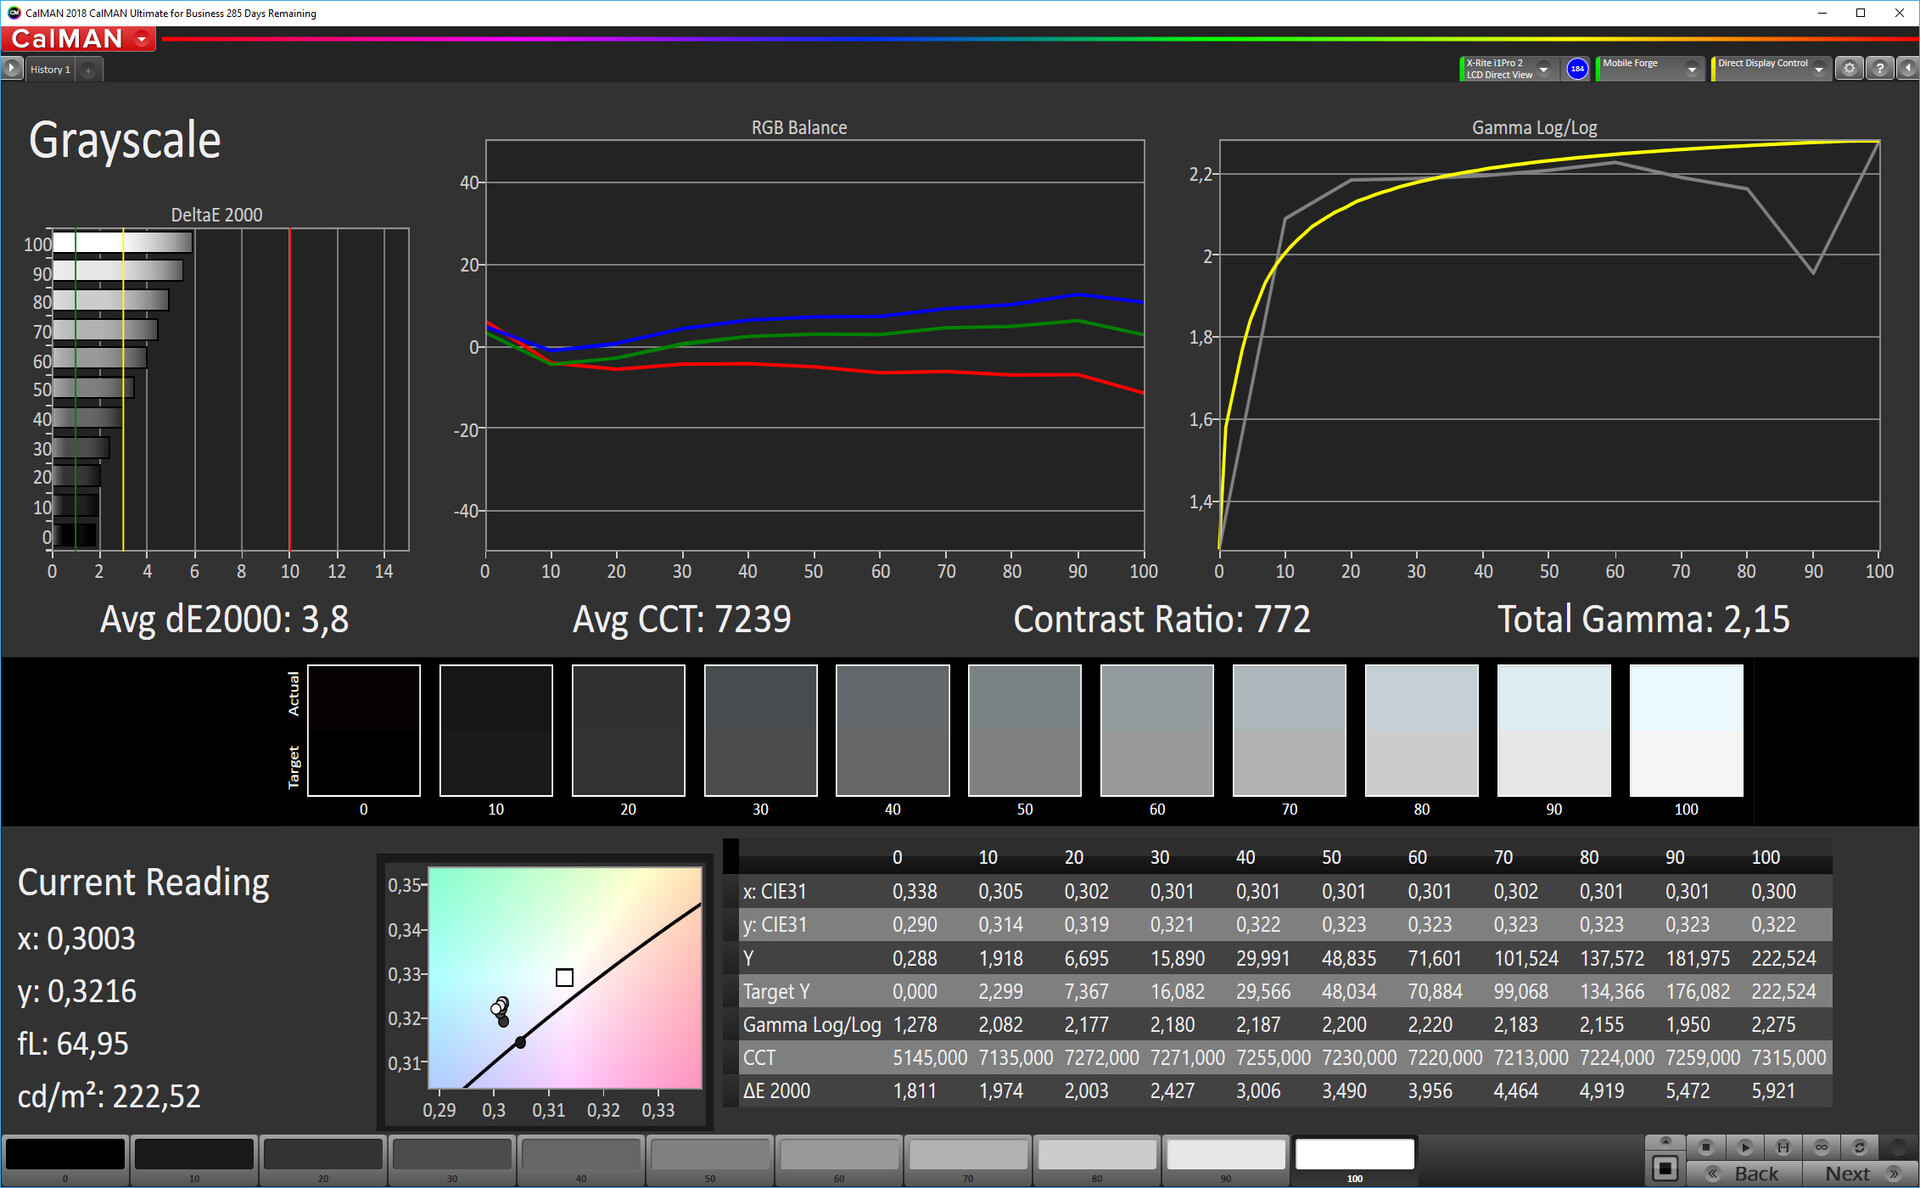
ΔE Greyscale Calman: 3.8 | ∀{0.09-98 Ø4.97}
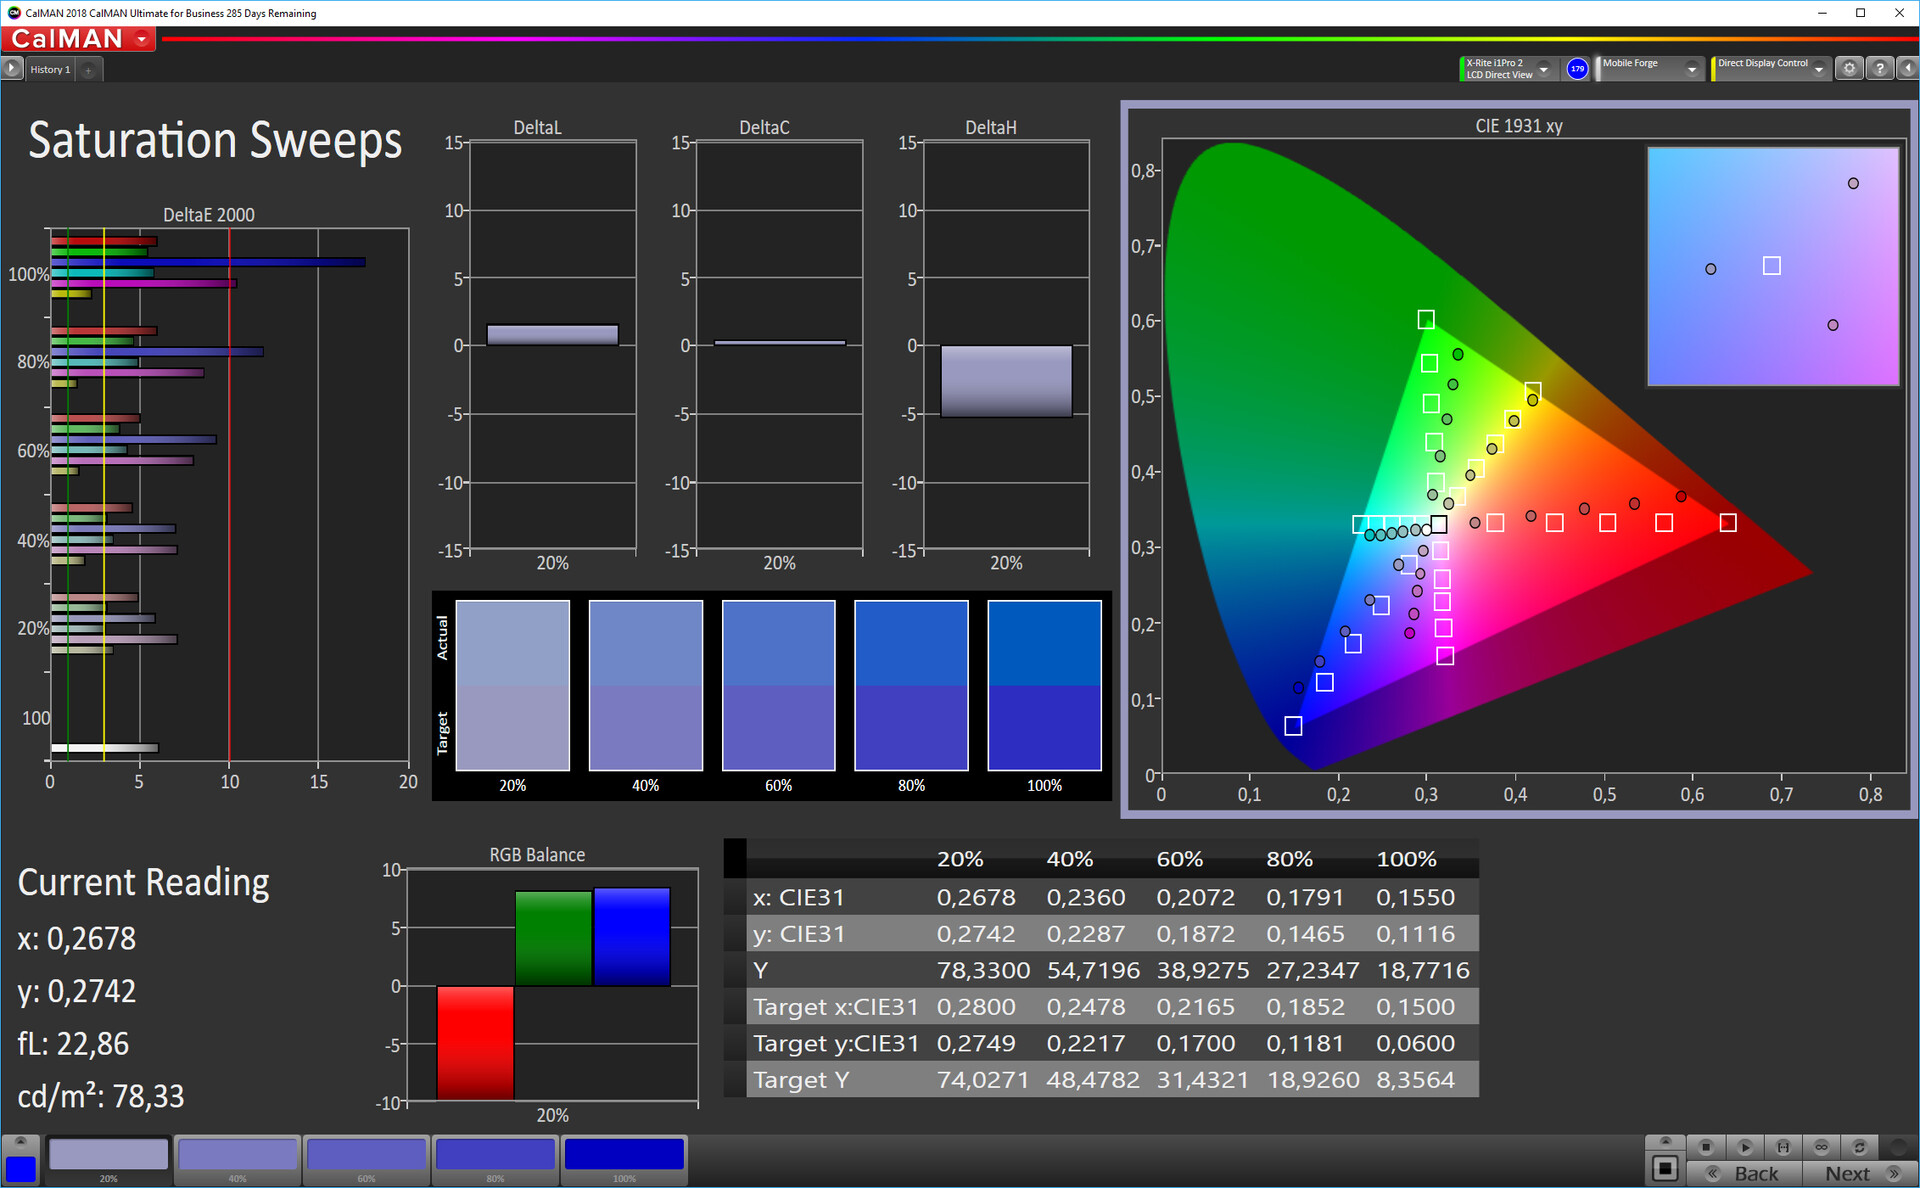
65.1% sRGB (Calman 2D)
Gamma: 2.15
CCT: 7239 K
| Trekstor Surftab Theatre L15 IPS, 1920x1080, 15.6" | Chuwi Hi9 Plus IPS, 2560x1600, 10.8" | Lenovo Tab M10 IPS, 1920x1200, 10.1" | Huawei MediaPad M5 10.8 Pro IPS, 2560x1600, 10.8" | Alldocube Alldocube X AMOLED, 2560x1600, 10.5" | |
|---|---|---|---|---|---|
| Screen | 11% | -3% | -20% | 22% | |
| Brightness middle (cd/m²) | 224 | 308 38% | 339 51% | 384 71% | 297.3 33% |
| Brightness (cd/m²) | 206 | 297 44% | 327 59% | 360 75% | 307 49% |
| Brightness Distribution (%) | 82 | 92 12% | 86 5% | 84 2% | 83 1% |
| Black Level * (cd/m²) | 0.28 | 0.29 -4% | 0.42 -50% | 0.8 -186% | |
| Contrast (:1) | 800 | 1062 33% | 807 1% | 480 -40% | |
| Colorchecker dE 2000 * | 5.6 | 6.2 -11% | 5.8 -4% | 6.83 -22% | 6.74 -20% |
| Colorchecker dE 2000 max. * | 20.3 | 10.5 48% | 11.6 43% | 12.7 37% | 14.42 29% |
| Greyscale dE 2000 * | 3.8 | 6.6 -74% | 8.6 -126% | 7.5 -97% | 2.2 42% |
| Gamma | 2.15 102% | 2.19 100% | 2.16 102% | 2.199 100% | 2.31 95% |
| CCT | 7239 90% | 8216 79% | 8718 75% | 8544 76% | 6719 97% |
* ... smaller is better
Screen Flickering / PWM (Pulse-Width Modulation)
| Screen flickering / PWM detected | 1000 Hz | ≤ 27 % brightness setting | 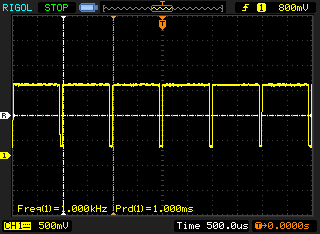 |
The display backlight flickers at 1000 Hz (worst case, e.g., utilizing PWM) Flickering detected at a brightness setting of 27 % and below. There should be no flickering or PWM above this brightness setting. The frequency of 1000 Hz is quite high, so most users sensitive to PWM should not notice any flickering. In comparison: 52 % of all tested devices do not use PWM to dim the display. If PWM was detected, an average of 7791 (minimum: 5 - maximum: 343500) Hz was measured. | |||
Our mixed impressions about the display continue with its colour accuracy. X-Rite i1Pro 2 measures the display’s black value at a pleasingly low 0.28 cd/m², which rises to a still decent 0.35 cd/m² when tested with APL50. However, the low maximum brightness results in a dissatisfying 800:1 contrast ratio. Moreover, the display’s colour temperature is well above the ideal value of 6,500 K, which makes content look bluer than it should do. Equally, while Delta E deviations are acceptably low, our review unit covers hardly any of the sRGB colour space. In short, the L15’s display left us feeling underwhelmed.
Display Response Times
| ↔ Response Time Black to White | ||
|---|---|---|
| 46.8 ms ... rise ↗ and fall ↘ combined | ↗ 28 ms rise | 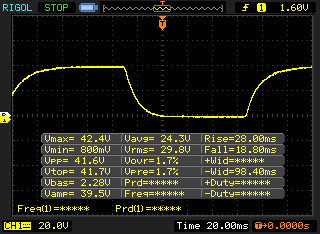 |
| ↘ 18.8 ms fall | ||
| The screen shows slow response rates in our tests and will be unsatisfactory for gamers. In comparison, all tested devices range from 0.1 (minimum) to 240 (maximum) ms. » 99 % of all devices are better. This means that the measured response time is worse than the average of all tested devices (19.9 ms). | ||
| ↔ Response Time 50% Grey to 80% Grey | ||
| 59.2 ms ... rise ↗ and fall ↘ combined | ↗ 29.2 ms rise | 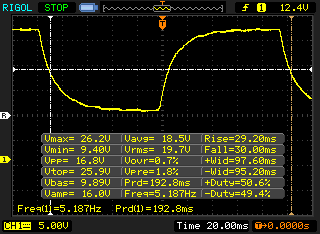 |
| ↘ 30 ms fall | ||
| The screen shows slow response rates in our tests and will be unsatisfactory for gamers. In comparison, all tested devices range from 0.165 (minimum) to 636 (maximum) ms. » 95 % of all devices are better. This means that the measured response time is worse than the average of all tested devices (31.1 ms). | ||
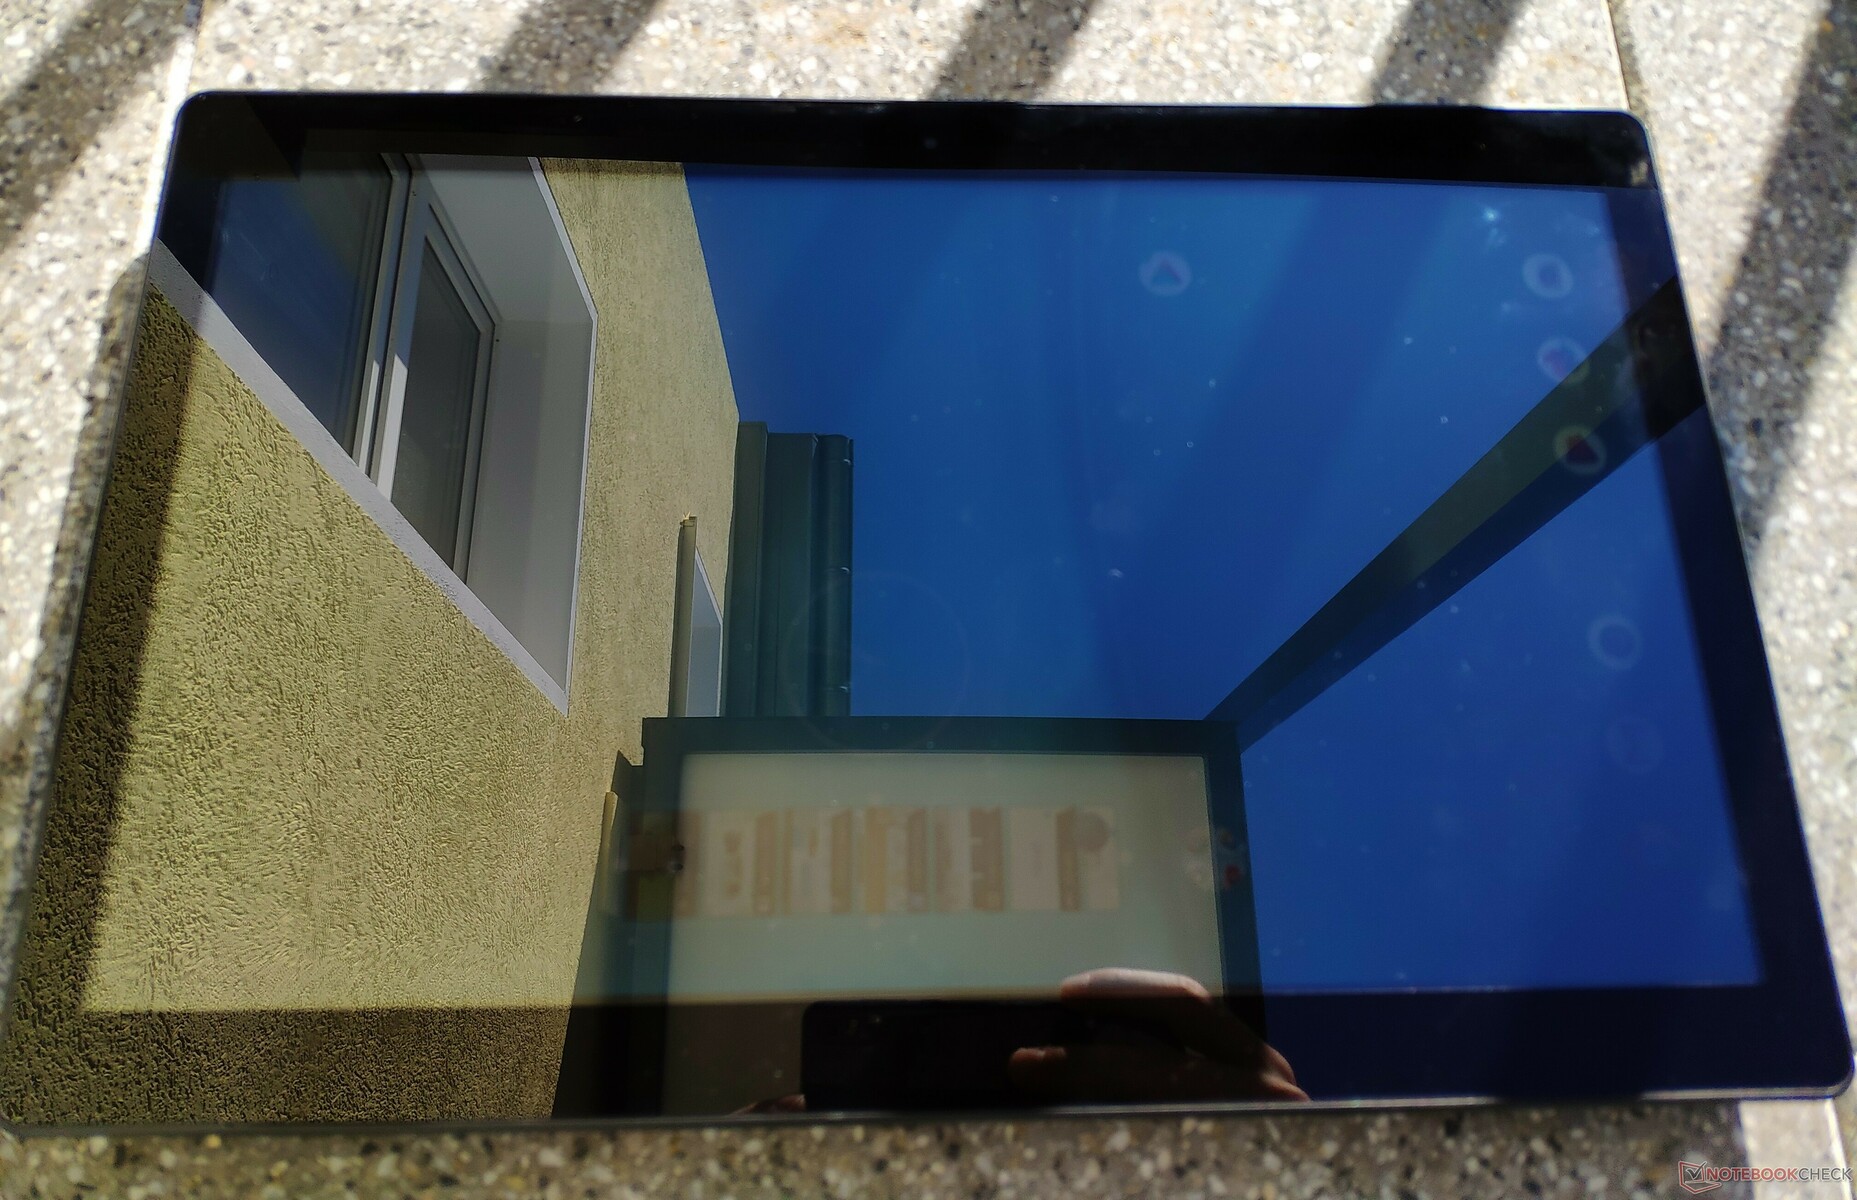
The L15 is difficult to use outdoors because of its low maximum brightness, as demonstrated by the photos below. Even brightly lit rooms are a problem for the TrekStor tablet because its low contrast screen can often look washed-out to the point where it is difficult to read what is being displayed onscreen.
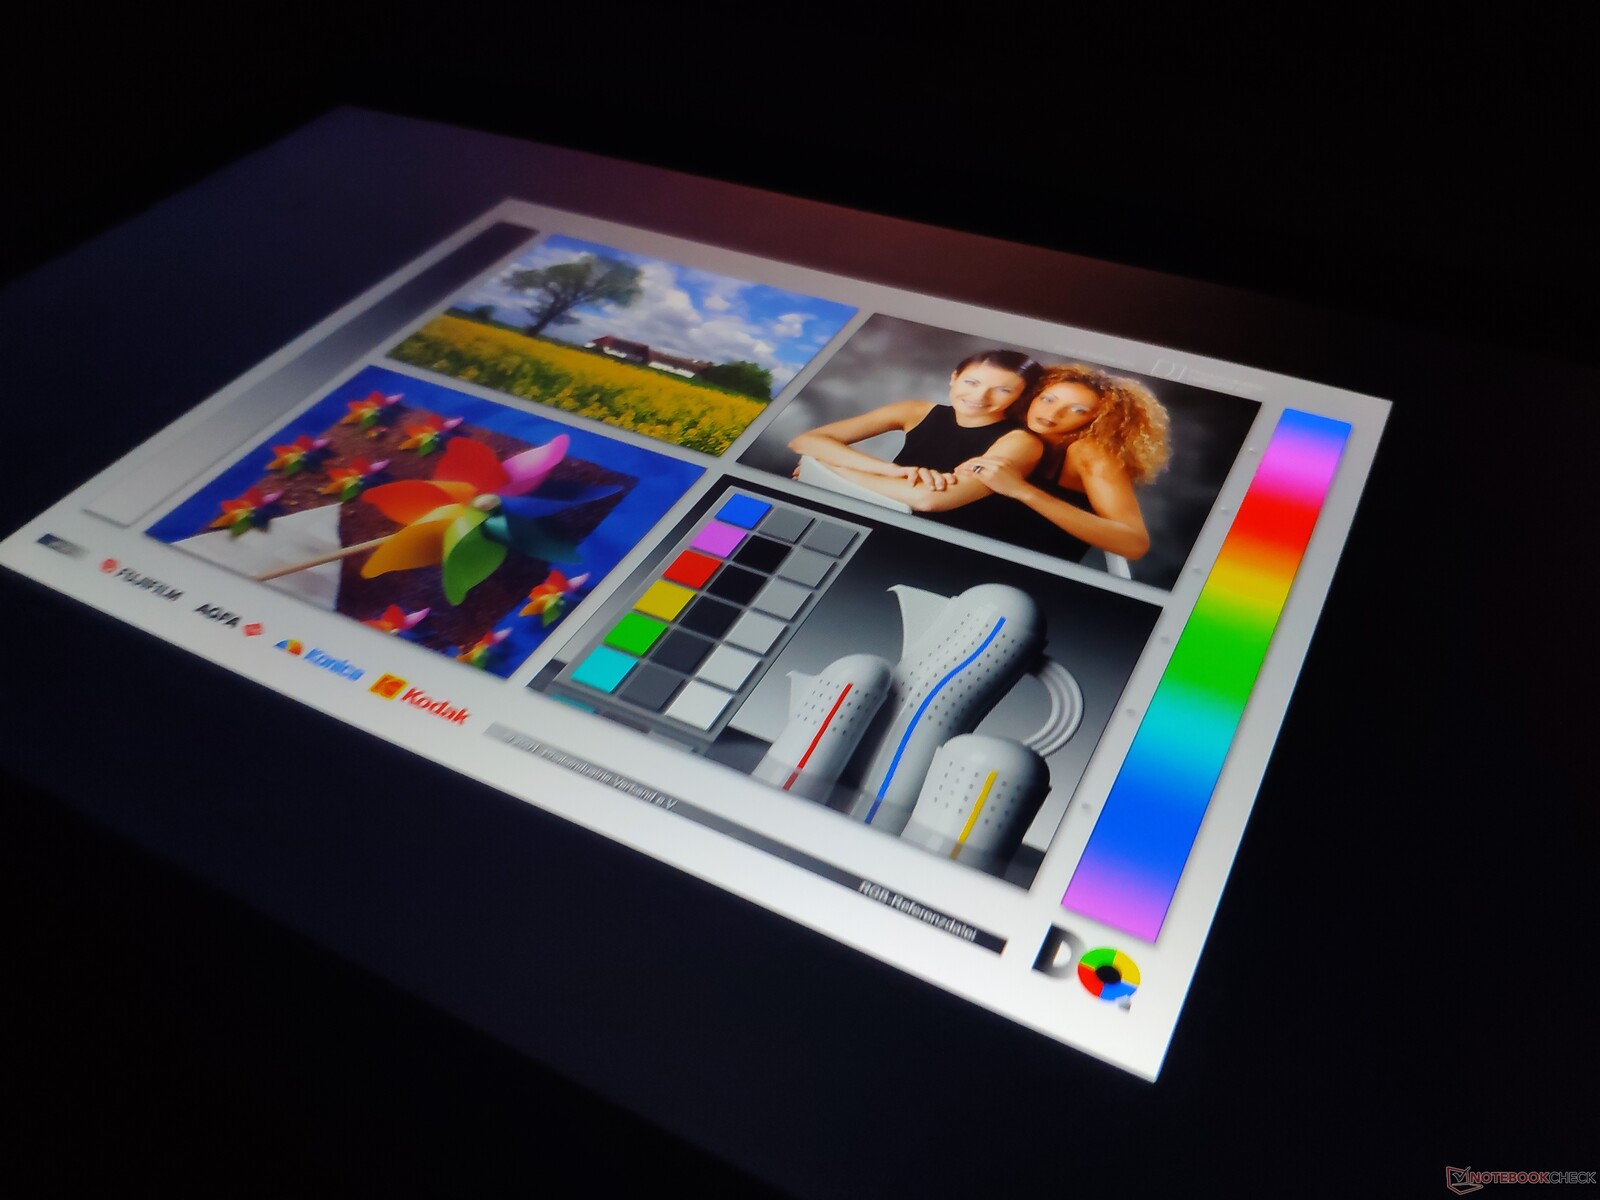
Our review unit has stable viewing angles though. We noticed no brightness, colour or image distortions even at acute angles, so you should be able to read the L15 from practically any angle, if you are in a suitably dark room.
Performance
TrekStor has equipped the L15 with a MediaTek MT8163 V/A SoC that integrates four ARM Cortex-A53 cores that can clock up to 1.5 GHz and an ARM Mali-T720 MP2 GPU. The SoC is complemented by 2 GB RAM, but both components are outdated by today’s standards.
Our review unit has acceptable system performance, but the tablet does not run smoothly, and we regularly experienced prolonged delays when multitasking. Moreover, the L15 finished bottom in all our synthetic benchmark comparison tables and is outperformed by much cheaper tablets. In short, the L15 delivers poor performance for a tablet at this price.
| GFXBench | |
| on screen Car Chase Onscreen | |
| Average of class Tablet (3.8 - 110, n=57, last 2 years) | |
| Huawei MediaPad M5 10.8 Pro | |
| Chuwi Hi9 Plus | |
| Lenovo Tab M10 | |
| Alldocube Alldocube X | |
| Trekstor Surftab Theatre L15 | |
| 1920x1080 Car Chase Offscreen | |
| Average of class Tablet (4 - 256, n=57, last 2 years) | |
| Huawei MediaPad M5 10.8 Pro | |
| Chuwi Hi9 Plus | |
| Alldocube Alldocube X | |
| Lenovo Tab M10 | |
| Trekstor Surftab Theatre L15 | |
| on screen Aztec Ruins High Tier Onscreen | |
| Average of class Tablet (3.1 - 94, n=82, last 2 years) | |
| Chuwi Hi9 Plus | |
| 2560x1440 Aztec Ruins High Tier Offscreen | |
| Average of class Tablet (2 - 125, n=82, last 2 years) | |
| Chuwi Hi9 Plus | |
| on screen Aztec Ruins Normal Tier Onscreen | |
| Average of class Tablet (5.2 - 301, n=82, last 2 years) | |
| Chuwi Hi9 Plus | |
| 1920x1080 Aztec Ruins Normal Tier Offscreen | |
| Average of class Tablet (5.6 - 323, n=82, last 2 years) | |
| Chuwi Hi9 Plus | |
| AnTuTu v6 - Total Score | |
| Huawei MediaPad M5 10.8 Pro | |
| Lenovo Tab M10 | |
| Trekstor Surftab Theatre L15 | |
| Average MediaTek MT8163 V/A 1.5 GHz (33452 - 42179, n=2) | |
| AnTuTu v7 - Total Score | |
| Huawei MediaPad M5 10.8 Pro | |
| Chuwi Hi9 Plus | |
| Alldocube Alldocube X | |
| Lenovo Tab M10 | |
| Trekstor Surftab Theatre L15 | |
| Average MediaTek MT8163 V/A 1.5 GHz (39551 - 48234, n=2) | |
Perhaps predictably, the L15 scored poorly in synthetic browser benchmarks, which we conducted with Google Chrome. Moreover, webpages generally load slowly and media content takes a while to appear. Scrolling remained largely fluid throughout our tests though, which is good.
| JetStream 1.1 - 1.1 Total | |
| Huawei MediaPad M5 10.8 Pro (Chrome 68.0.3440.91) | |
| Alldocube Alldocube X (Chrome 71.0.3578.99) | |
| Chuwi Hi9 Plus (Google Chrome 70) | |
| Lenovo Tab M10 (Chrome 71.0.3578.99) | |
| Trekstor Surftab Theatre L15 (Chrome 72) | |
| Average MediaTek MT8163 V/A 1.5 GHz (16.7 - 19.7, n=2) | |
| Octane V2 - Total Score | |
| Average of class Tablet (763 - 138481, n=73, last 2 years) | |
| Huawei MediaPad M5 10.8 Pro (Chrome 68.0.3440.91) | |
| Alldocube Alldocube X (Chrome 71.0.3578.99) | |
| Chuwi Hi9 Plus (Chrome 70) | |
| Lenovo Tab M10 (Chrome 71.0.3578.99) | |
| Trekstor Surftab Theatre L15 (Chrome 72) | |
| Average MediaTek MT8163 V/A 1.5 GHz (2972 - 3550, n=2) | |
| Mozilla Kraken 1.1 - Total | |
| Average MediaTek MT8163 V/A 1.5 GHz (12550 - 15571, n=2) | |
| Trekstor Surftab Theatre L15 (Chrome 72) | |
| Lenovo Tab M10 (Chrome 71.0.3578.99) | |
| Chuwi Hi9 Plus (Chrome 70) | |
| Alldocube Alldocube X (Chrome 71.0.3578.99) | |
| Huawei MediaPad M5 10.8 Pro (Chrome 68.0.3440.91) | |
| Average of class Tablet (243 - 27101, n=67, last 2 years) | |
* ... smaller is better
To make matters worse, TrekStor has also equipped the L15 with slow eMMC flash storage. Our review unit achieved below average transfer speeds in AndroBench 3-5 and again is beaten by considerably cheaper devices. These slow transfer speeds compound the underwhelming system performance and result in long loading times when closing or opening applications.
The microSD card reader is comparatively slow too. Our test device averaged just 37.3 MB/s sequential write and 44.06 MB/s sequential read speeds, which are well below average and most of our comparison devices. All devices fall way short of our Toshiba Exceria Pro M501 reference card’s 270 MB/s write and 150 MB/s read speeds though.
| Trekstor Surftab Theatre L15 | Chuwi Hi9 Plus | Lenovo Tab M10 | Huawei MediaPad M5 10.8 Pro | Alldocube Alldocube X | Average 32 GB eMMC Flash | Average of class Tablet | |
|---|---|---|---|---|---|---|---|
| AndroBench 3-5 | 64% | 121% | 118% | 89% | 132% | 2730% | |
| Sequential Read 256KB (MB/s) | 78.2 | 145 85% | 279.9 258% | 278.6 256% | 255.4 227% | 242 ? 209% | 1987 ? 2441% |
| Sequential Write 256KB (MB/s) | 59.2 | 132.5 124% | 52.6 -11% | 94.1 59% | 101.1 71% | 100.5 ? 70% | 1580 ? 2569% |
| Random Read 4KB (MB/s) | 14.16 | 42.2 198% | 52.5 271% | 27.41 94% | 14.62 3% | 43.1 ? 204% | 268 ? 1793% |
| Random Write 4KB (MB/s) | 7.4 | 13.01 76% | 11.32 53% | 15.35 107% | 11.62 57% | 22.3 ? 201% | 312 ? 4116% |
| Sequential Read 256KB SDCard (MB/s) | 44.06 ? | 21.16 -52% | 83.5 ? 90% | 84.9 ? 93% | 87.2 98% | 71.8 ? 63% | |
| Sequential Write 256KB SDCard (MB/s) | 37.3 ? | 20.44 -45% | 61.2 ? 64% | 73.1 ? 96% | 66.1 77% | 52.9 ? 42% |
Games
The ARM Mali-T720 MP2 is now four years old and can use just two out of its eight possible cores. Correspondingly, graphics performance is low, and it cannot handle complex games like Asphalt 9: Legends. Asphalt Xtreme and PUBG Mobile are playable at reduced graphics, but regular stutters ruin the gaming experience. Hence, the L15 can only play simple or older games comfortably.
The accelerometer and touchscreen worked well during our gaming tests. The L15 is just too big in our opinion to hold during prolonged gaming sessions. Using a controller would make for a better gaming experience though.
Emissions
Temperature
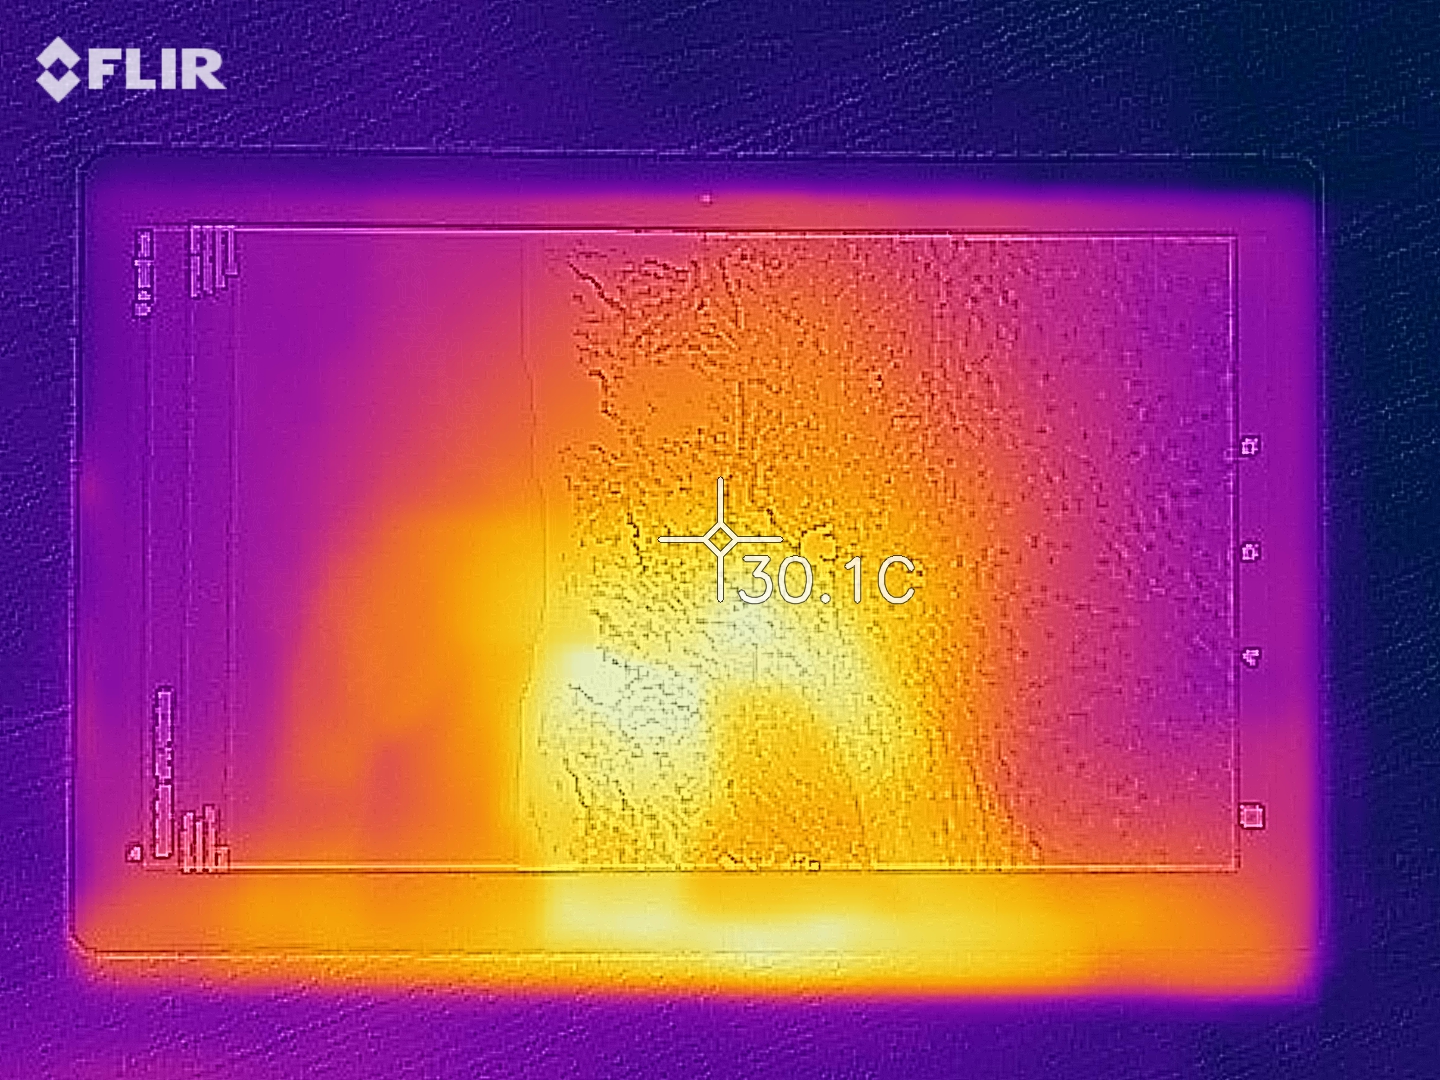
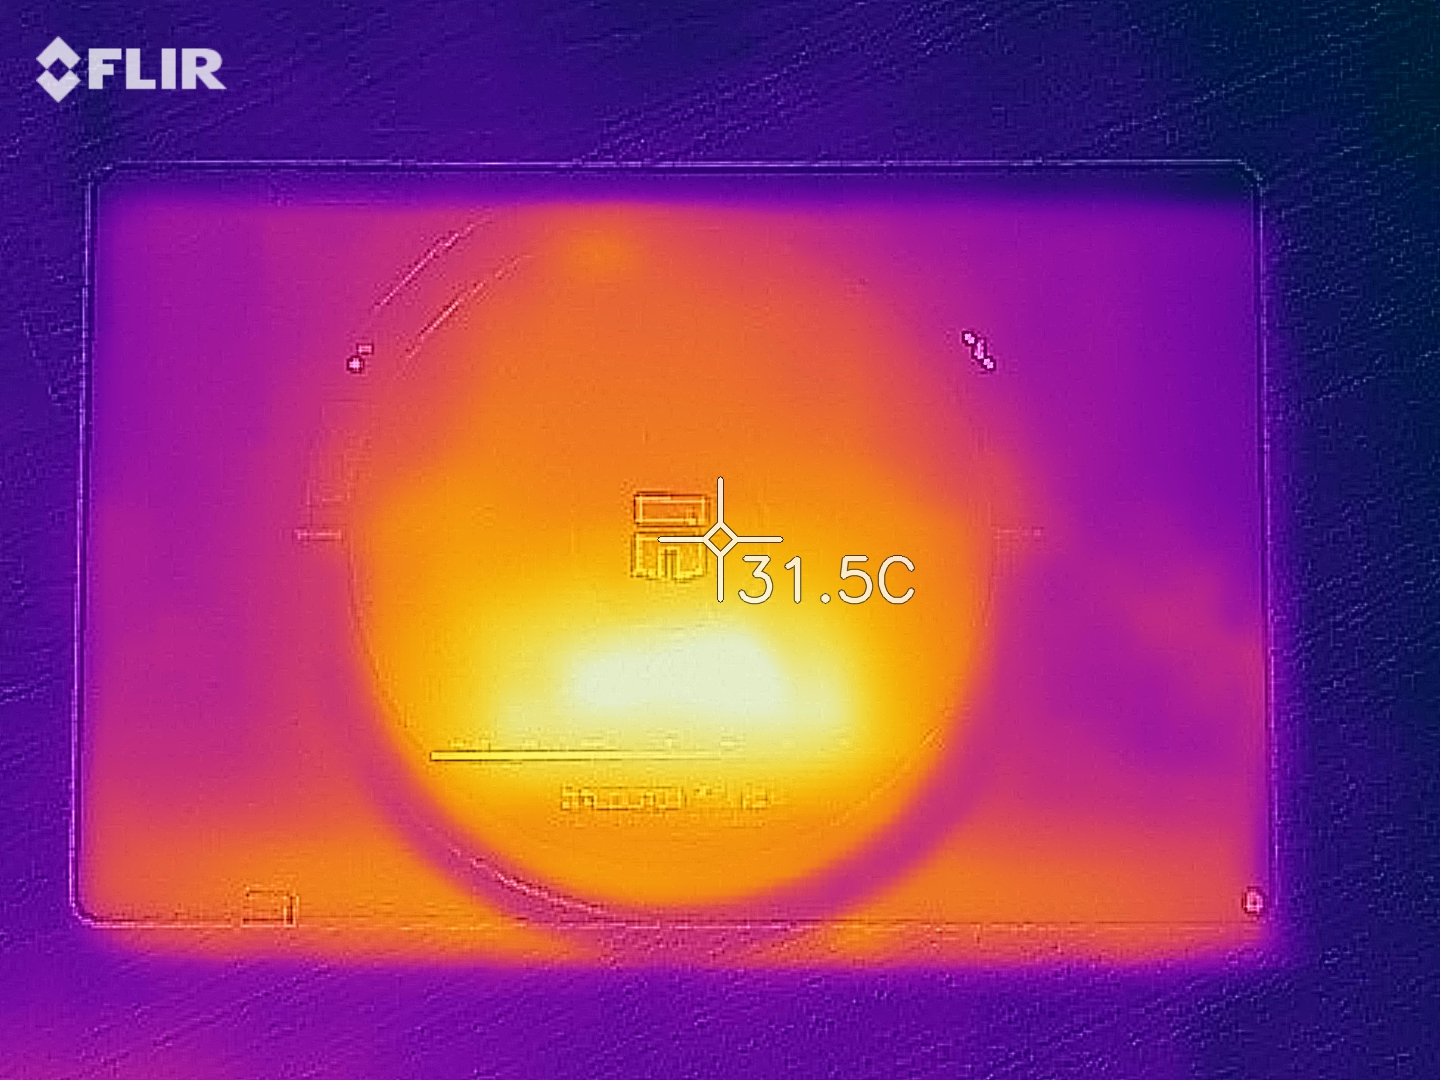
The L15 largely remains cool to the touch under sustained load apart from a hotspot at the centre of its back case, which reached a maximum of 37.4 °C during our tests. The tablet should remain cool in daily use and averaged around 25 °C when idling.
(+) The maximum temperature on the upper side is 27 °C / 81 F, compared to the average of 33.6 °C / 92 F, ranging from 20.7 to 53.2 °C for the class Tablet.
(+) The bottom heats up to a maximum of 37.4 °C / 99 F, compared to the average of 33.2 °C / 92 F
(+) In idle usage, the average temperature for the upper side is 24.5 °C / 76 F, compared to the device average of 30 °C / 86 F.
Speakers
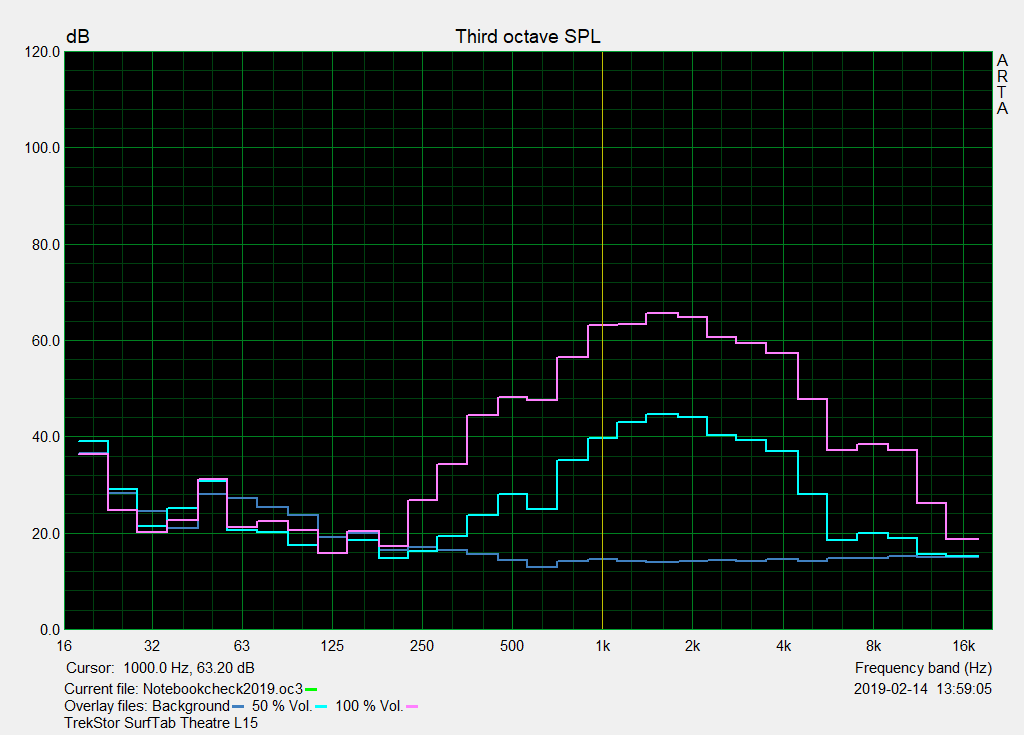
The L15 has stereo speakers but they are comparatively quiet and deliver poor audio quality. The speakers in our review unit reached a maximum of 72 dB(A), which is much quieter than the speakers in the Alldocube X. Moreover, audio sounds distorted and tinny even at low volumes, which is disappointing. Likewise, the speakers are dominated by mid frequencies, while bass and high tones are all but absent. In short, the L15 has terrible speakers.
Our review unit reproduced audio clearly via its 3.5 mm headphone jack and over Bluetooth though. Overall, the L15 should not stop high-quality accessories from delivering enjoyable-sounding music.
Trekstor Surftab Theatre L15 audio analysis
(±) | speaker loudness is average but good (72.4 dB)
Bass 100 - 315 Hz
(-) | nearly no bass - on average 21.9% lower than median
(-) | bass is not linear (17.4% delta to prev. frequency)
Mids 400 - 2000 Hz
(±) | higher mids - on average 12.3% higher than median
(±) | linearity of mids is average (14% delta to prev. frequency)
Highs 2 - 16 kHz
(±) | higher highs - on average 9.7% higher than median
(±) | linearity of highs is average (14.5% delta to prev. frequency)
Overall 100 - 16.000 Hz
(-) | overall sound is not linear (52.7% difference to median)
Compared to same class
» 98% of all tested devices in this class were better, 0% similar, 2% worse
» The best had a delta of 7%, average was 20%, worst was 129%
Compared to all devices tested
» 96% of all tested devices were better, 0% similar, 4% worse
» The best had a delta of 4%, average was 24%, worst was 134%
Alldocube Alldocube X audio analysis
(-) | not very loud speakers (71.3 dB)
Bass 100 - 315 Hz
(-) | nearly no bass - on average 25.8% lower than median
(±) | linearity of bass is average (9.5% delta to prev. frequency)
Mids 400 - 2000 Hz
(±) | higher mids - on average 6.2% higher than median
(±) | linearity of mids is average (9.6% delta to prev. frequency)
Highs 2 - 16 kHz
(+) | balanced highs - only 4.8% away from median
(±) | linearity of highs is average (7.1% delta to prev. frequency)
Overall 100 - 16.000 Hz
(-) | overall sound is not linear (31.4% difference to median)
Compared to same class
» 91% of all tested devices in this class were better, 2% similar, 7% worse
» The best had a delta of 7%, average was 20%, worst was 129%
Compared to all devices tested
» 90% of all tested devices were better, 2% similar, 8% worse
» The best had a delta of 4%, average was 24%, worst was 134%
Power Management
Power Consumption
The L15 also has comparatively high power consumption. Our review unit consumed a minimum of 7.21 W at idle, which is higher than the Lenovo Tab M10 consumes under sustained load. Likewise, the L15 consumes a maximum of 15.27 W under load, which is astronomically high for a tablet powered by an entry-level SoC.
Our review unit recharges fully in just over 3 hours with the included charger.
| Off / Standby | |
| Idle | |
| Load |
|
Key:
min: | |
| Trekstor Surftab Theatre L15 4800 mAh | Chuwi Hi9 Plus 7000 mAh | Lenovo Tab M10 4850 mAh | Huawei MediaPad M5 10.8 Pro 7500 mAh | Alldocube Alldocube X 8000 mAh | |
|---|---|---|---|---|---|
| Power Consumption | 41% | 60% | 32% | 42% | |
| Idle Minimum * (Watt) | 7.21 | 2.18 70% | 0.98 86% | 3.3 54% | 3.8 47% |
| Idle Average * (Watt) | 9.77 | 5.29 46% | 4.45 54% | 4.2 57% | 5.9 40% |
| Idle Maximum * (Watt) | 9.89 | 5.37 46% | 4.51 54% | 7 29% | 6.3 36% |
| Load Average * (Watt) | 11.72 | 8.56 27% | 5.78 51% | 10.4 11% | 7.4 37% |
| Load Maximum * (Watt) | 15.27 | 12.86 16% | 7.18 53% | 13.8 10% | 7.6 50% |
* ... smaller is better
Battery Life
The L15 has a 4,800 mAh battery that achieved surprisingly good runtimes in our tests. Our review unit lasted for 9:09 hours in our Wi-Fi battery life test, which is significantly longer than the Alldocube X and is only 22% short of the Huawei MediaPad M5 10.8 Pro with its 7,500 mAh battery. We conduct our Wi-Fi battery life test by running a script that simulates the load required to render websites, for reference. We also adjust the display to around 150 cd/m² and turn any power-saving features off.
This section may make for surprising reading given the L15’s high power consumption, but there is a reason for its better than expected battery life. The L15 has a higher voltage battery than those equipped in our comparison devices, so it can correspondingly last longer. However, we suspect that TrekStor could have equipped the tablet with a larger battery considering its huge case.
| Trekstor Surftab Theatre L15 4800 mAh | Chuwi Hi9 Plus 7000 mAh | Lenovo Tab M10 4850 mAh | Huawei MediaPad M5 10.8 Pro 7500 mAh | Alldocube Alldocube X 8000 mAh | |
|---|---|---|---|---|---|
| Battery runtime | |||||
| WiFi v1.3 (h) | 9.2 | 10.6 15% | 9.7 5% | 11.2 22% | 4.2 -54% |
Pros
Cons
Verdict
The TrekStor Surftab Theatre L15 could have been a good tablet, but it is hard to find any positives on which we could focus. Simply put, the L15 is a mess. Its huge form factor is a unique selling point for an Android tablet, but its poor execution destroys any potential that the L15 had.
The TrekStor Surftab Theatre L15 could have been a solid midrange Android tablet. We would recommend looking elsewhere though, as the L15 is underpowered and overpriced.
The L15 is outdated, too expensive and struggles in almost all areas against cheaper competition. Moreover, the display is so dark that we often struggled to use it indoors and the stereo speakers are awful. To make matters worse, the entry-level SoC has incredibly high power consumption, and the tablet only has 2 GB RAM. In short, we would not recommend the TrekStor Surftab Theatre L15 to anyone as it gets almost everything wrong.
Trekstor Surftab Theatre L15
- 02/28/2019 v6 (old)
Marcus Herbrich
Price comparison

