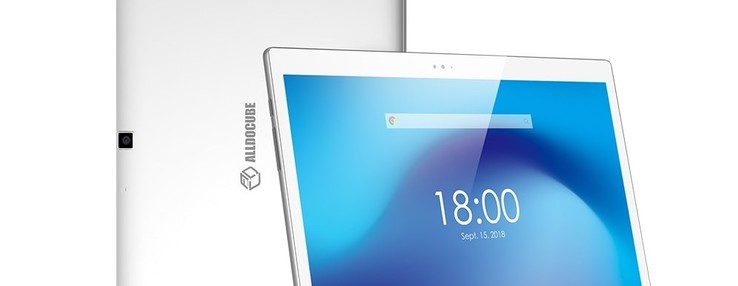
Alldocube X Tablet Review
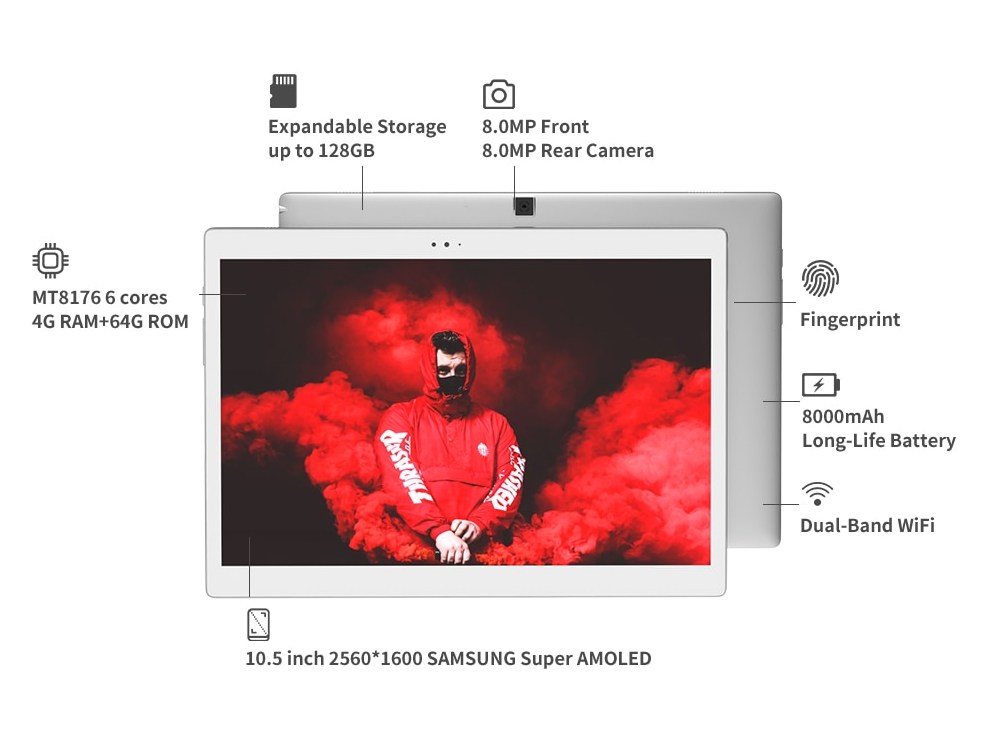
The Alldocube X started life as an Indiegogo project early last year and — unlike many other crowd-funded products — it managed to ship to consumers as originally promised. The tablet is notable for its mid-range $270 USD price while carrying high-end features like a 2560 x 1600 resolution AMOLED panel and fingerprint reader not normally found inexpensive alternatives. The Samsung Galaxy Tab S4, for example, carries the same AMOLED display for a whopping $650 USD.
Direct competitors to the 10.5-inch Alldocube X are numerous including the Samsung Galaxy Tab S4, Huawei MediaPad T5 lite, Samsung Galaxy Tab A 10.5, Acer Iconia Tab 10, and the Lenovo Tab 4 10 Plus to name a few. We'll be comparing it to models from veteran OEMs to see how it stacks up against more popular alternatives.
Case
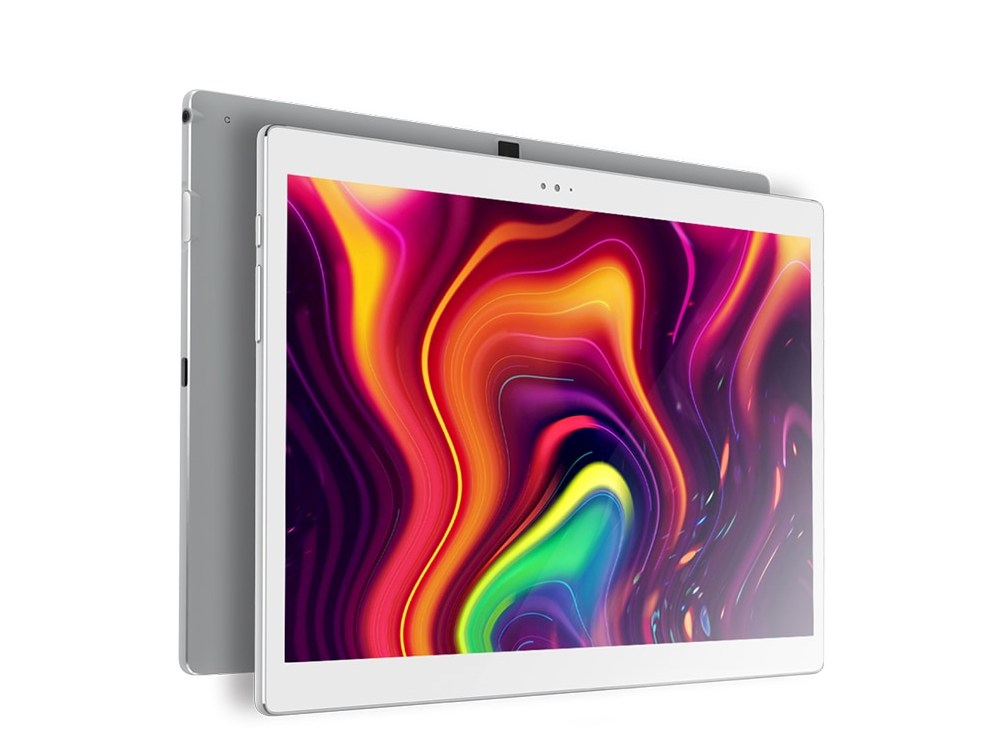
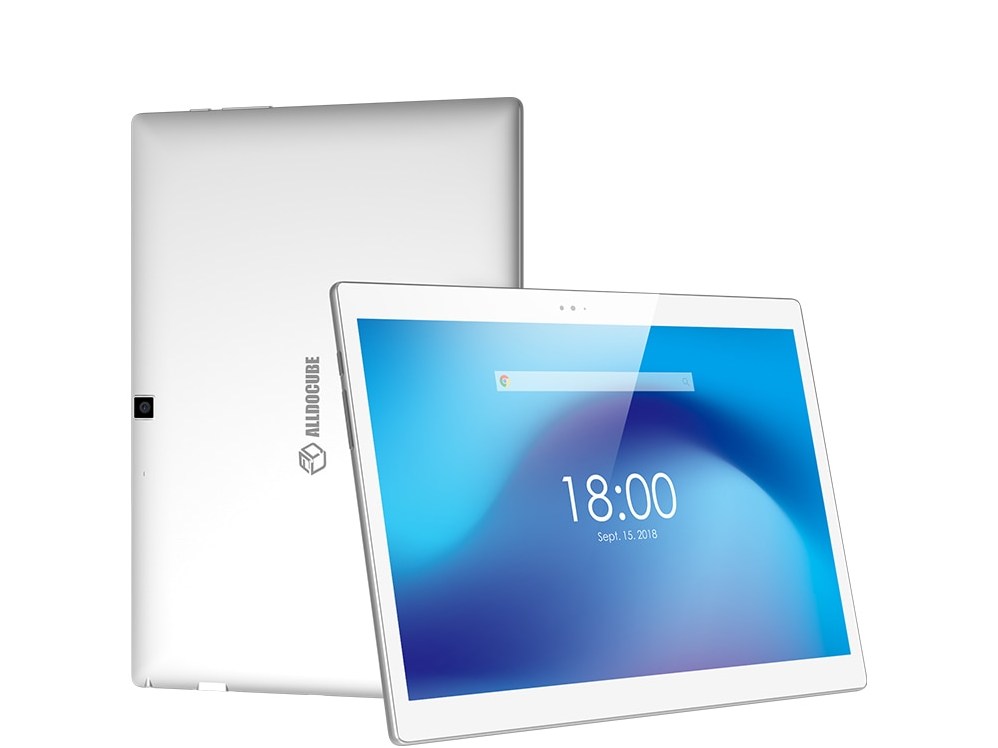
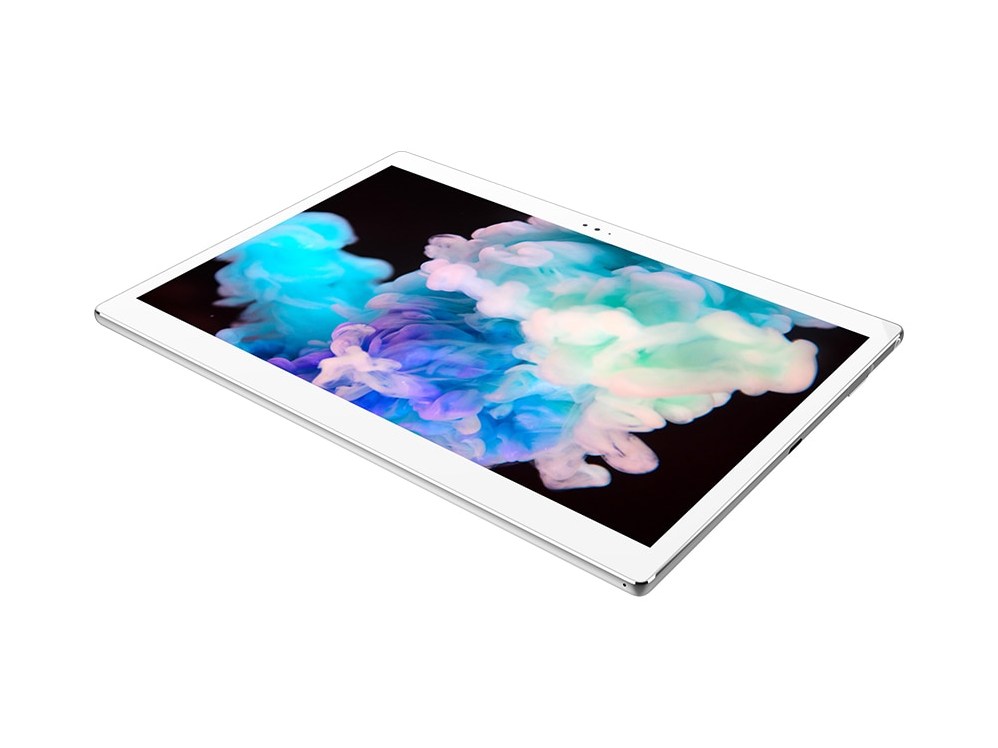
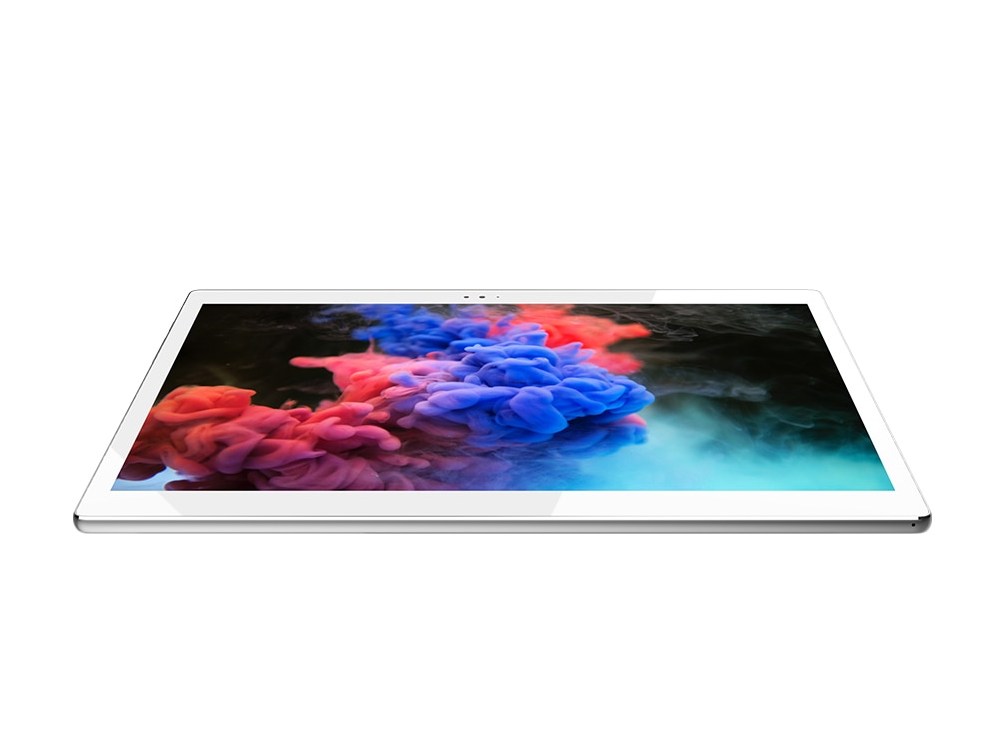
It's hard to not comment on the compact size of the tablet when first picking it up. The device is smaller than the Surface Go in all three dimensions while offering a slightly larger screen in the process. Its bezels are thus very narrow even when considering competitors costing more than twice the price of the Alldocube.
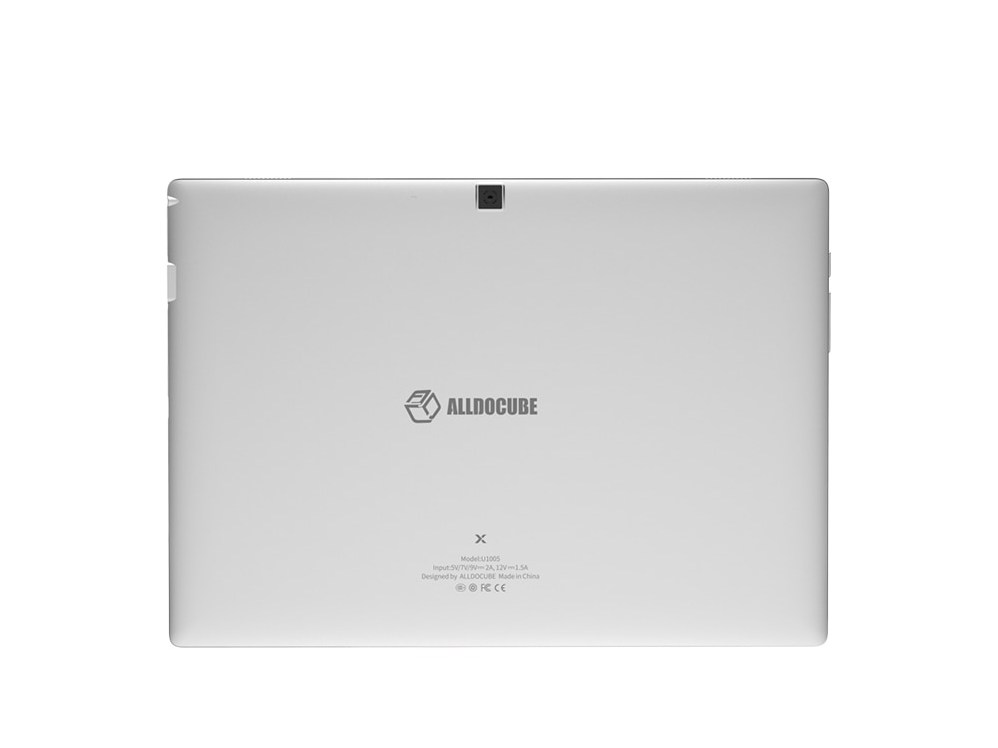
In terms of design, the metal unibody chassis is completely smooth along the matte back and edges while being excellent at hiding fingerprints. The edge-to-edge front glass and sharper corners give the system a high-end look compared to the rounder Surface Go or Galaxy Tab S4. As nice as it may be to hold, the Alldocube is more fragile and prone to scratches and damage. For example, attempting to twist the device with low-medium force results in some slight but audible creaking.
Build quality is imperfect on our test unit. The chrome-cut perimeter should be smooth all around when gliding a finger across, but there are visible scratches and tangible bumps that mar the otherwise sleek and super-thin design.
Connectivity
The tablet integrates USB Type-C, 3.5 mm earphones, and a MicroSD reader. We're able to connect devices like mice and keyboards with an appropriate adapter without any issues.
There are no POGO pins for attaching keyboards or other accessories unlike on the Galaxy Tab S4.
Communication and GPS
We experienced no issues when connected to an 802.11ac network. While transmit rates are slower than the radios on pricier tablets, this had no performance impact when video streaming or browsing. Integrated Bluetooth 4.0 is available for paring wireless devices.
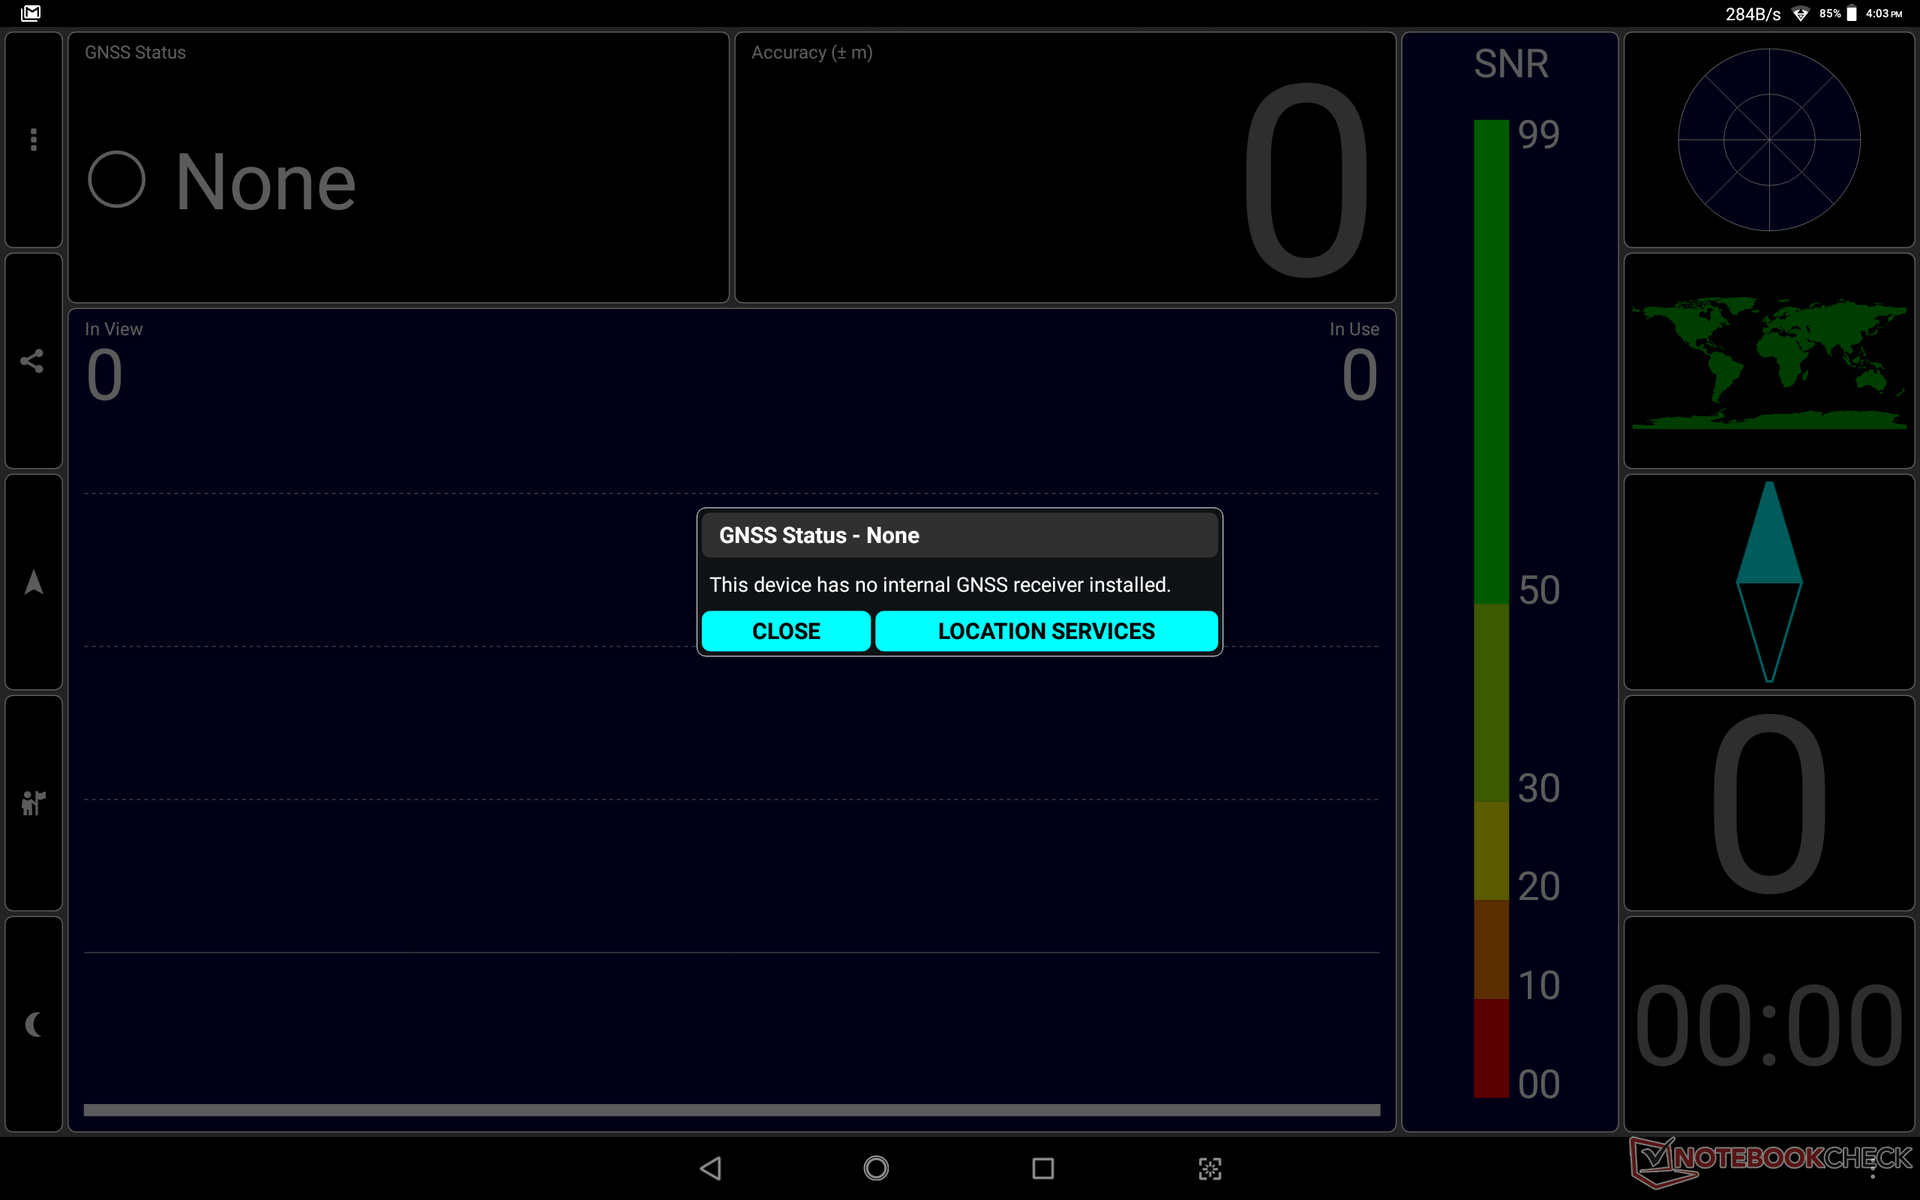
The GPS appears to be non-functional on our test unit. Indeed, the official product spec sheet does not list any GPS features.
Fingerprint Reader
The side fingerprint reader works reliably with little delay. Its main issue is instead related to positioning rather than performance. Picking up the tablet in any other orientation other than landscape mode will make the fingerprint reader clunky to use.
Cameras
Both the front and rear cameras are 8 MP each. Like essentially all budget tablets, however, camera quality is poor. Pictures are grainy and easily overexposed with shallower colors and lost details.
Accessories and Warranty
Included extras are an AC adapter and a USB Type-A to Type-C cable. We're unable to find any official warranty information on the official website, but the service center is based in China meaning that any returns made overseas will likely take longer than usual. Please see our Guarantees, Return policies and Warranties article for country-specific information.
Input Devices
Keyboard
Touch-typing on the 10-point capacitive screen is made more difficult by the lack of any haptic feedback. Even the much cheaper Chuwi HiPad includes vibration. Aside from this small detail, the touchscreen is precise with no inaccurate input occurrences. With that said, the large screen and narrow bezels make certain keys difficult to reach no matter the orientation.
Active pen does not appear to be supported.


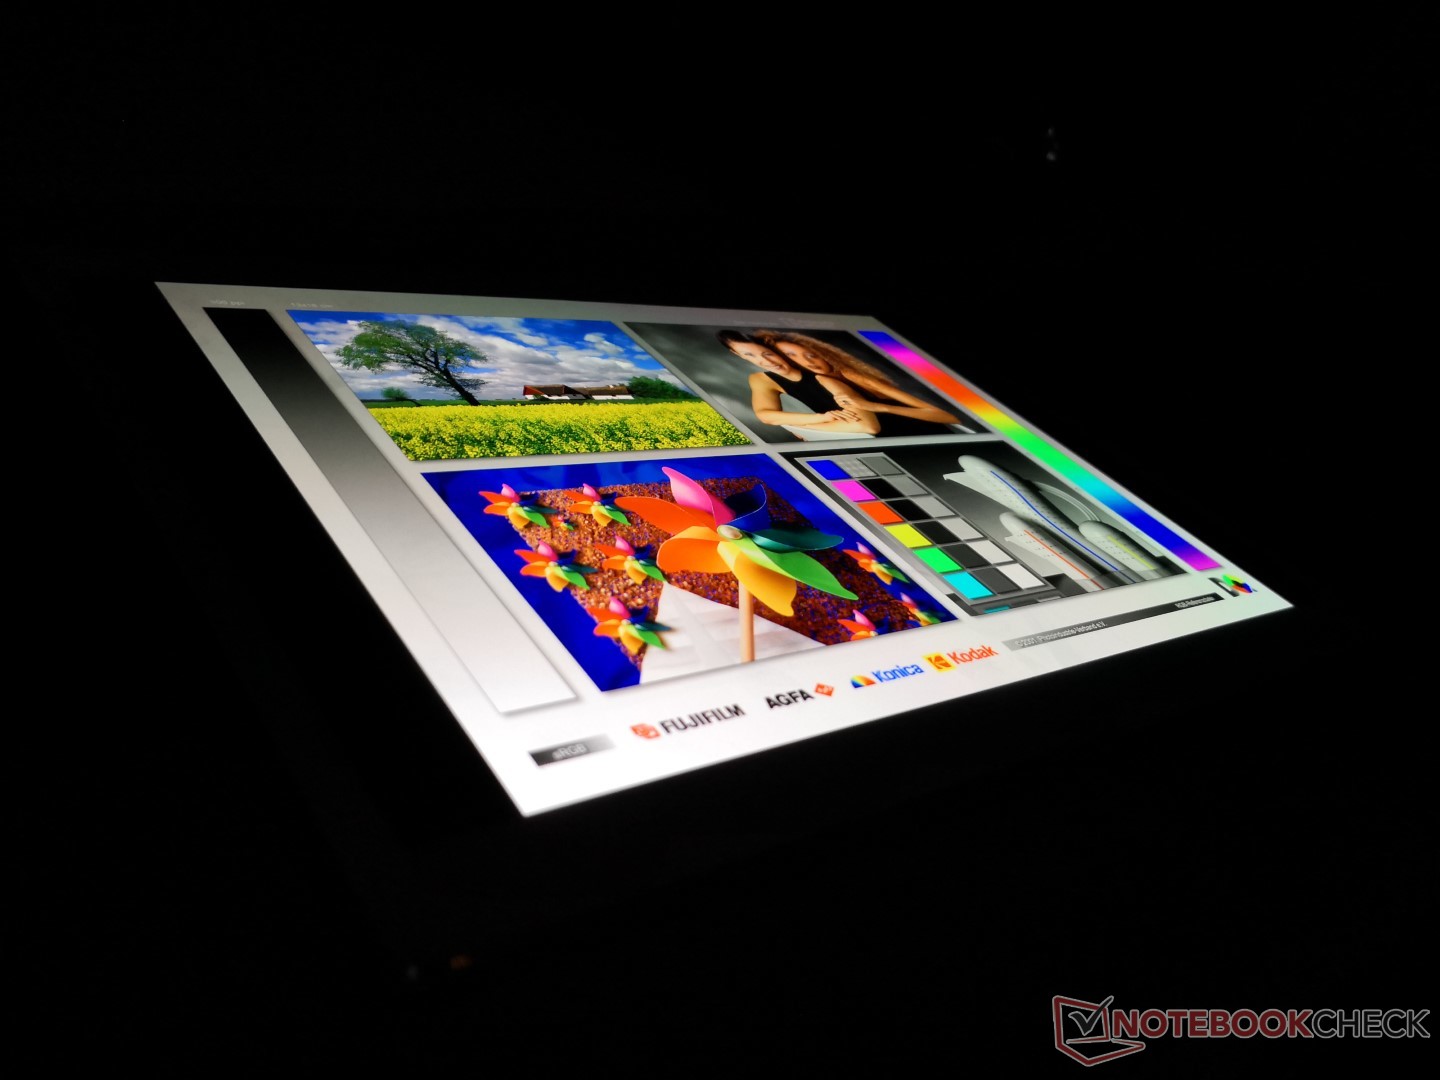
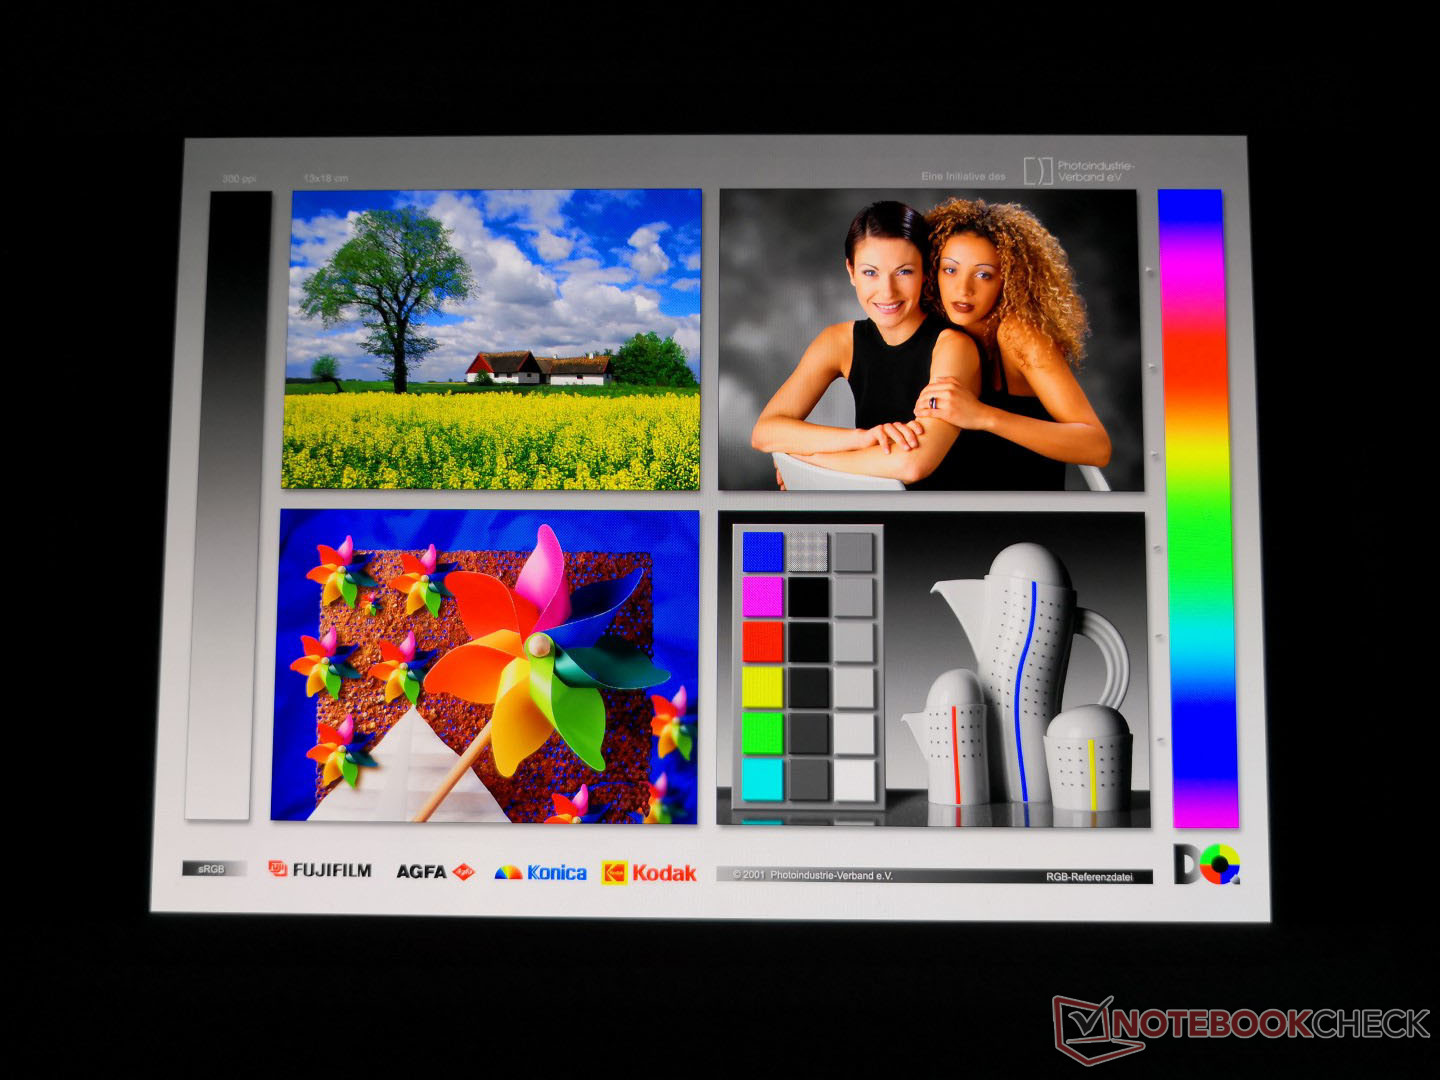
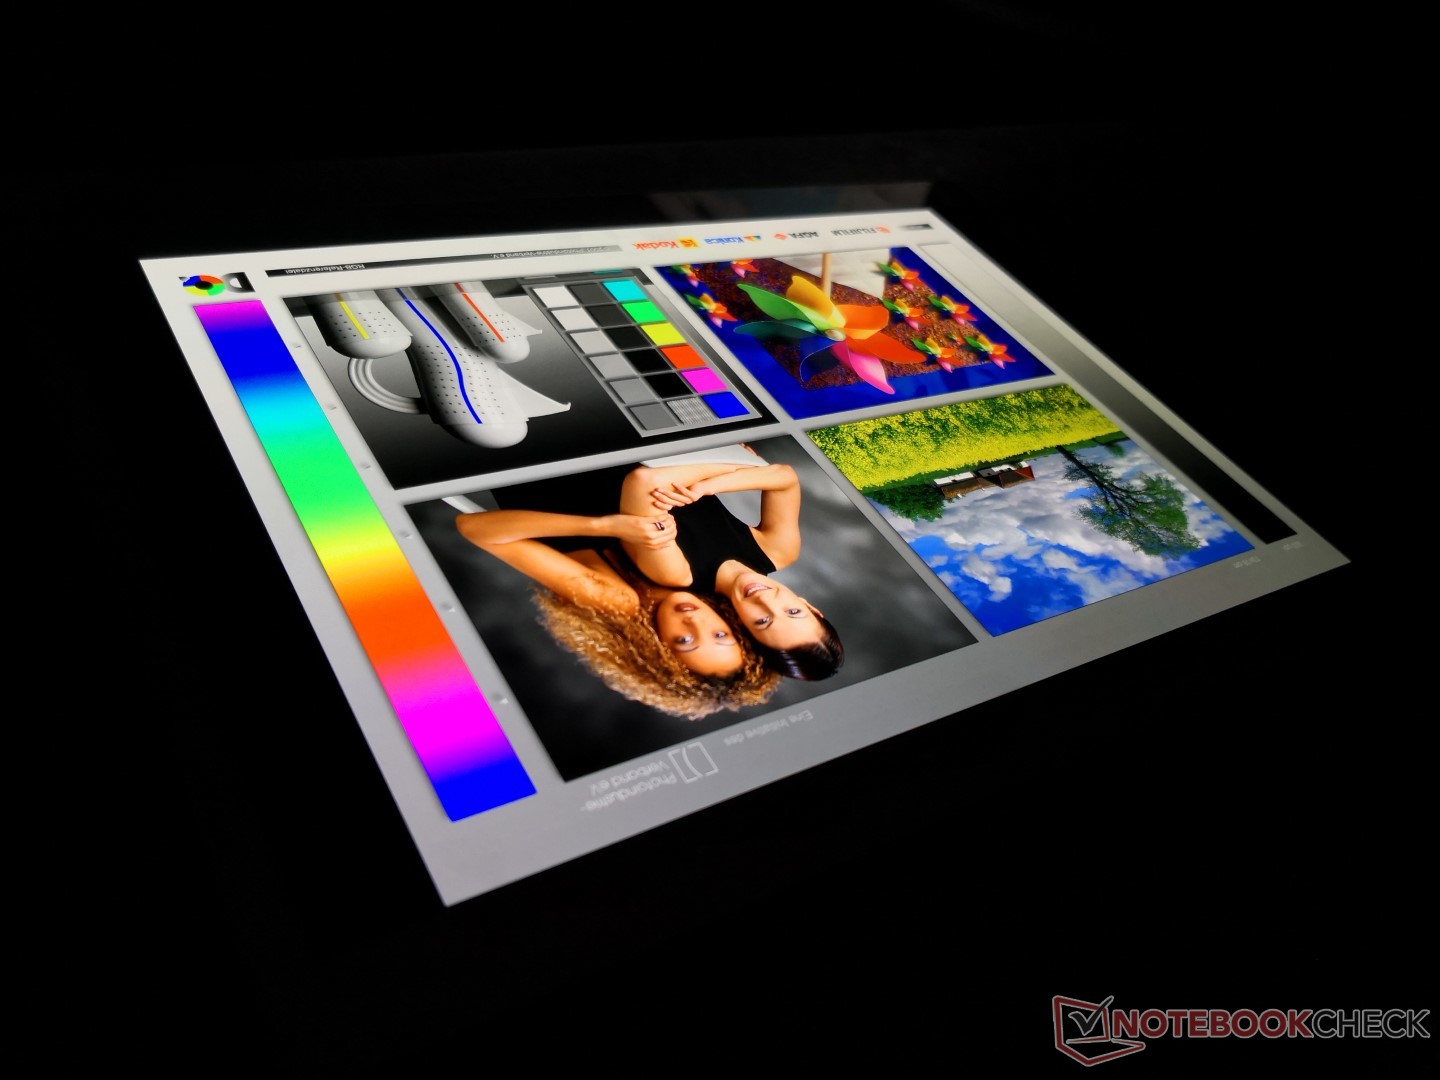
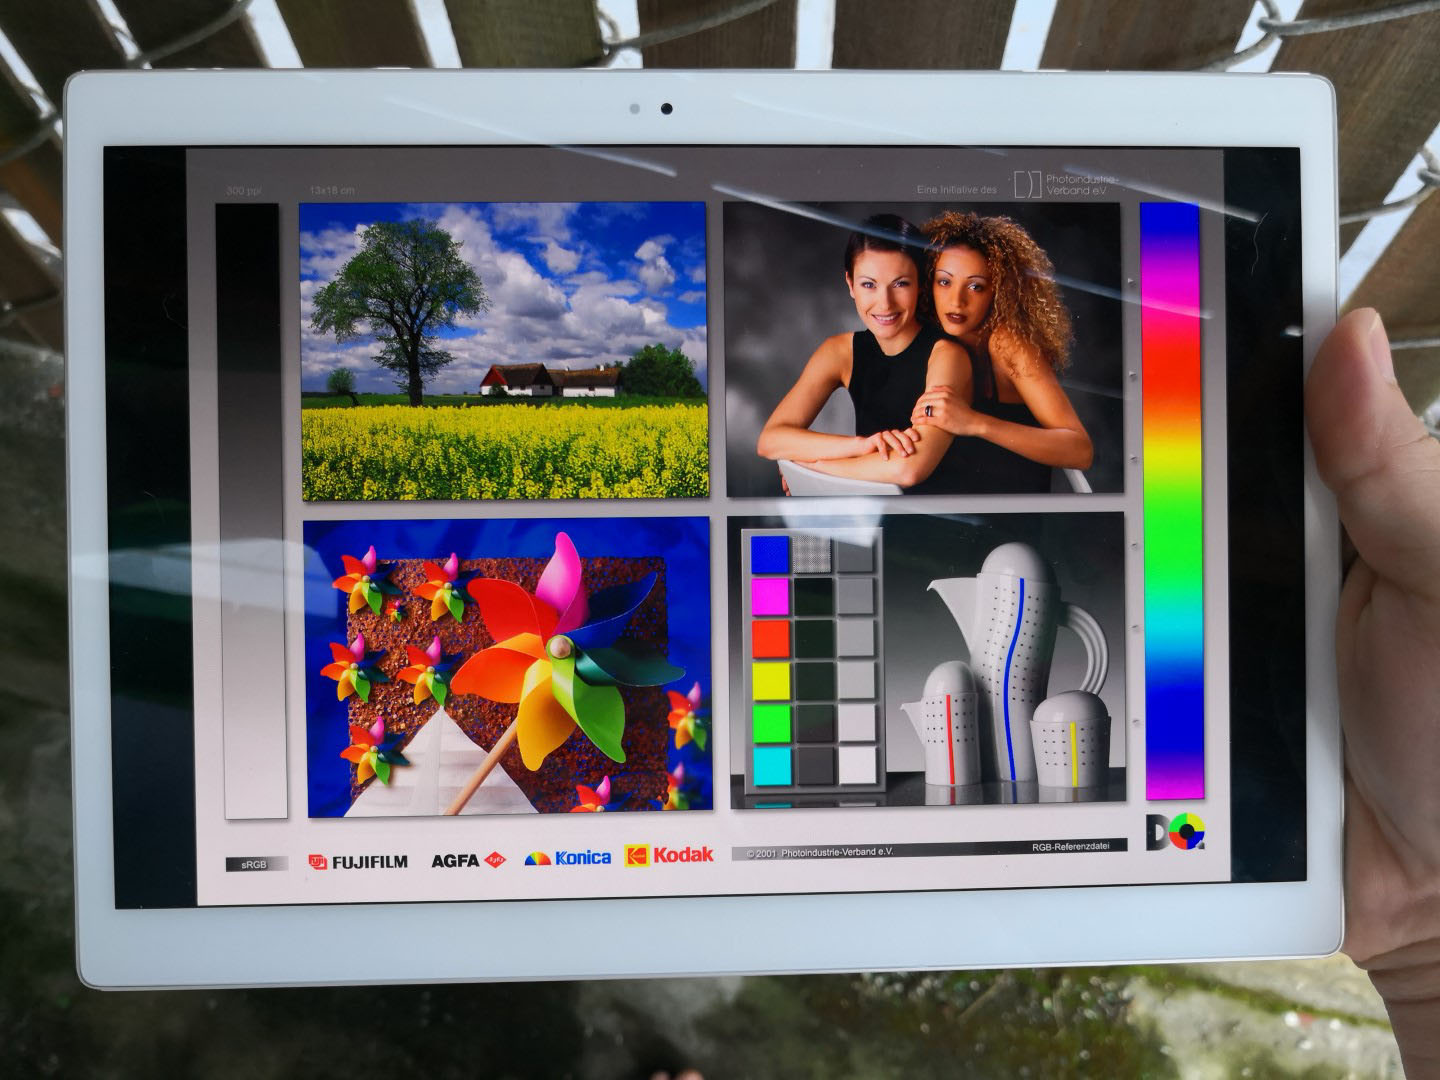
Display
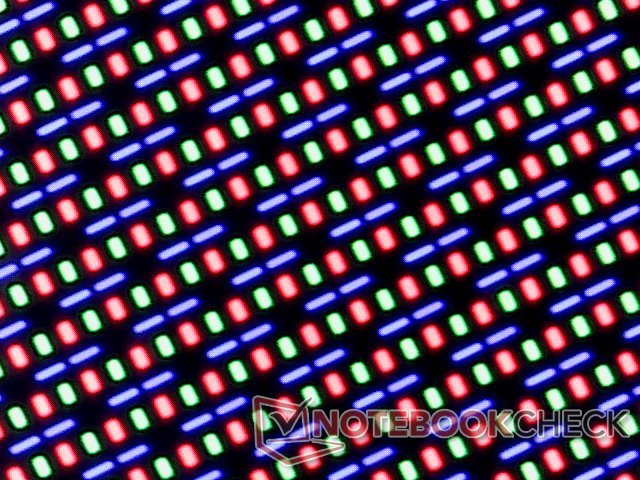
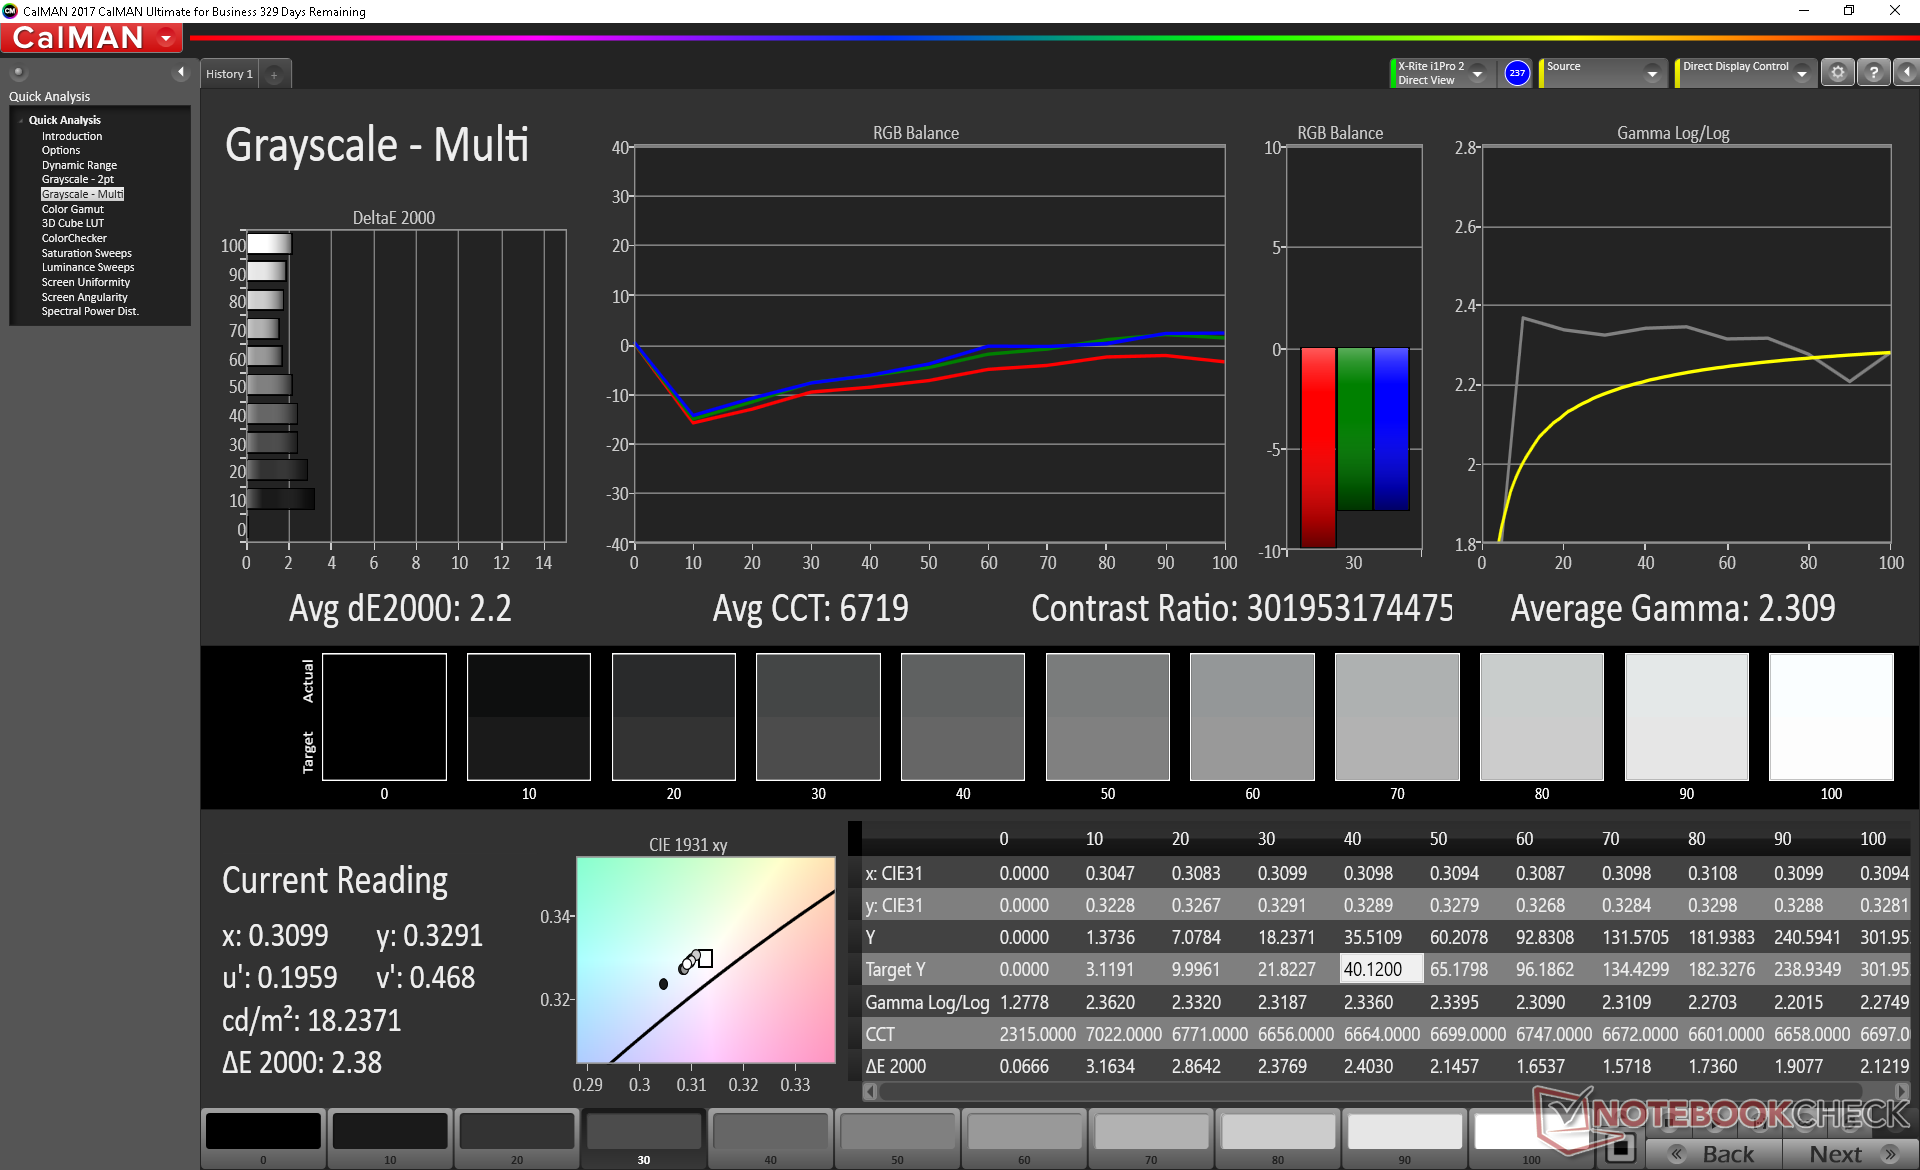
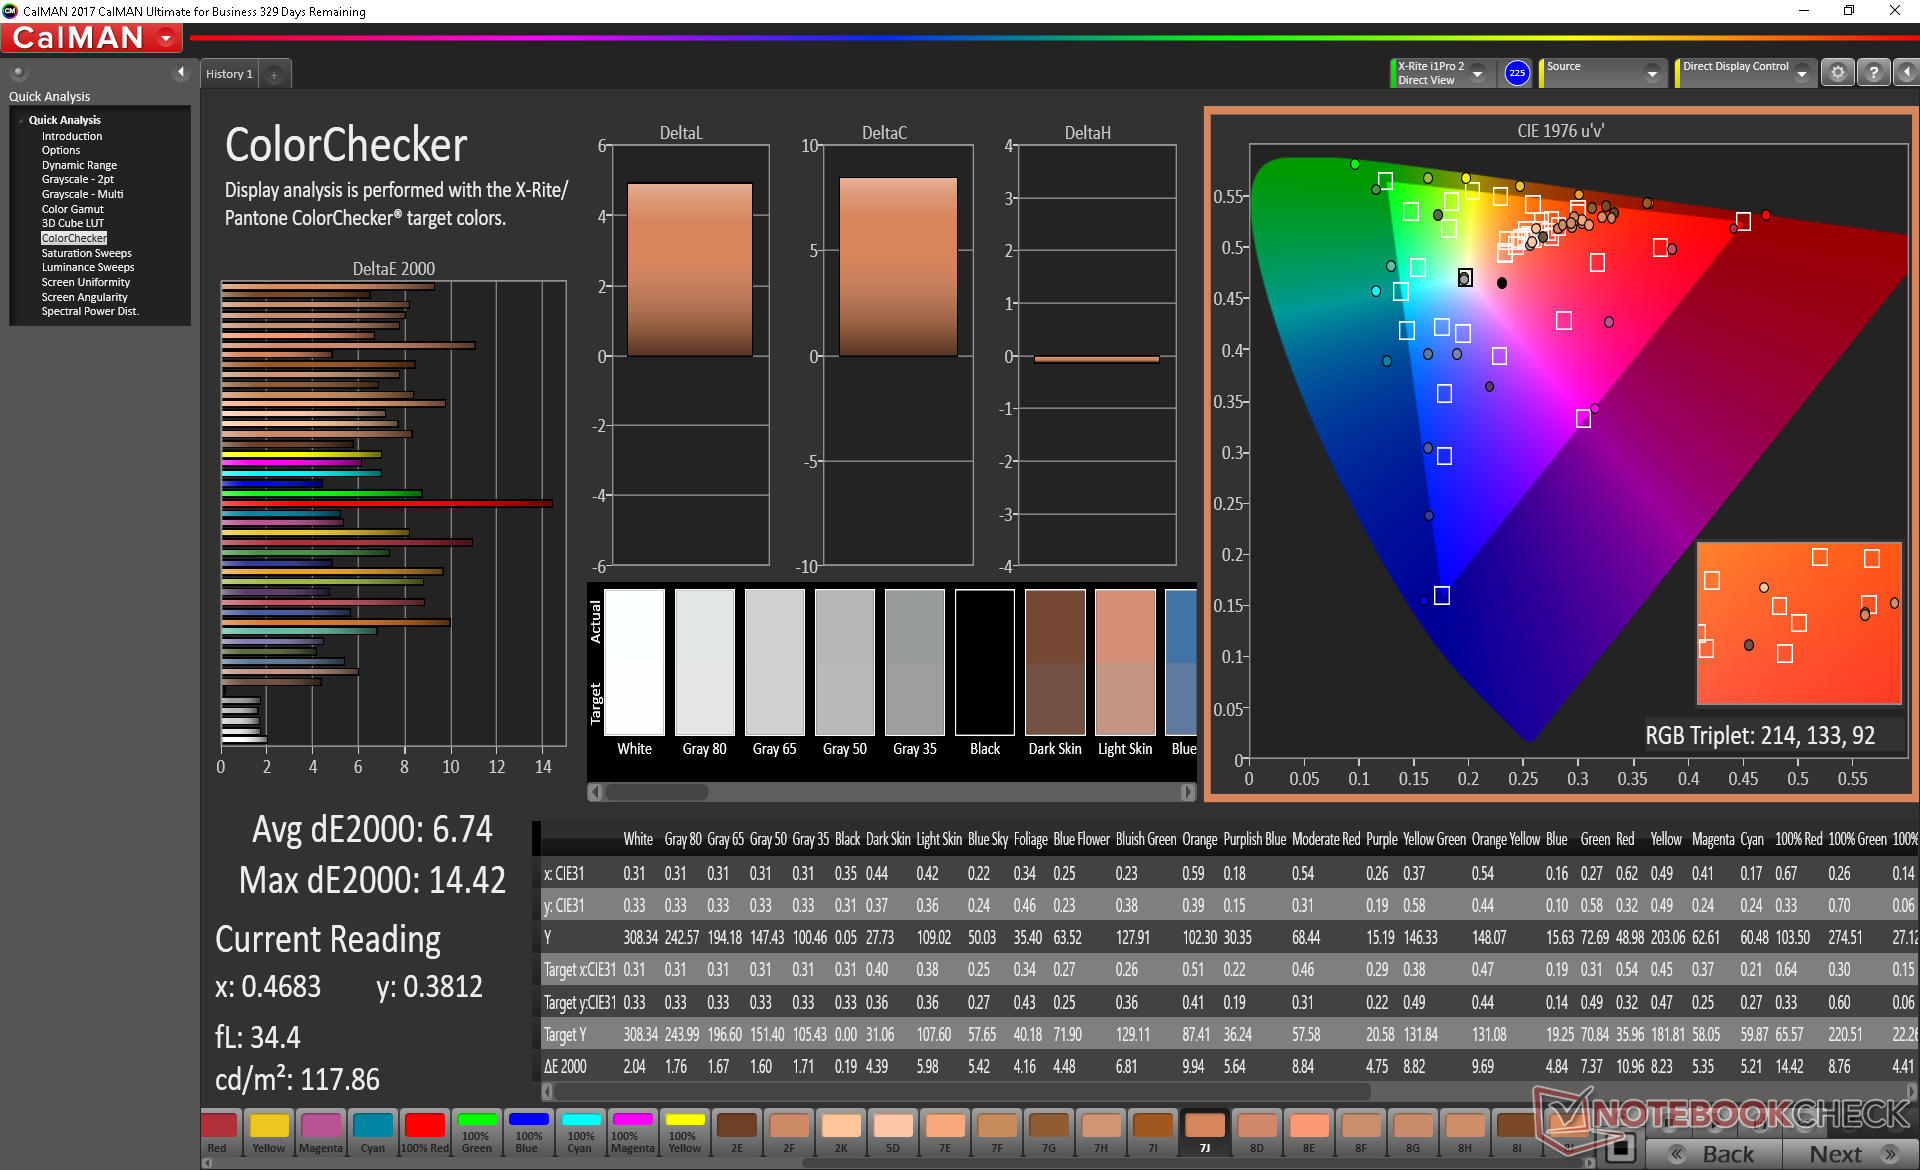
The AMOLED touchscreen is the highlight and selling point of the Alldocube X. Its high resolution, dense PPI, and OLED panel are normally reserved for costlier tablets well above the $250 range. Black-white response times are insanely fast for almost no ghosting while contrast ratio is essentially infinite with no backlight bleeding due to the panel technology. The thin glass, vibrant colors, and crisp text give the impression that this tablet is worth more than it really is. The Samsung panel in use here appears to be the exact same panel as found on the Samsung Galaxy Tab S4.
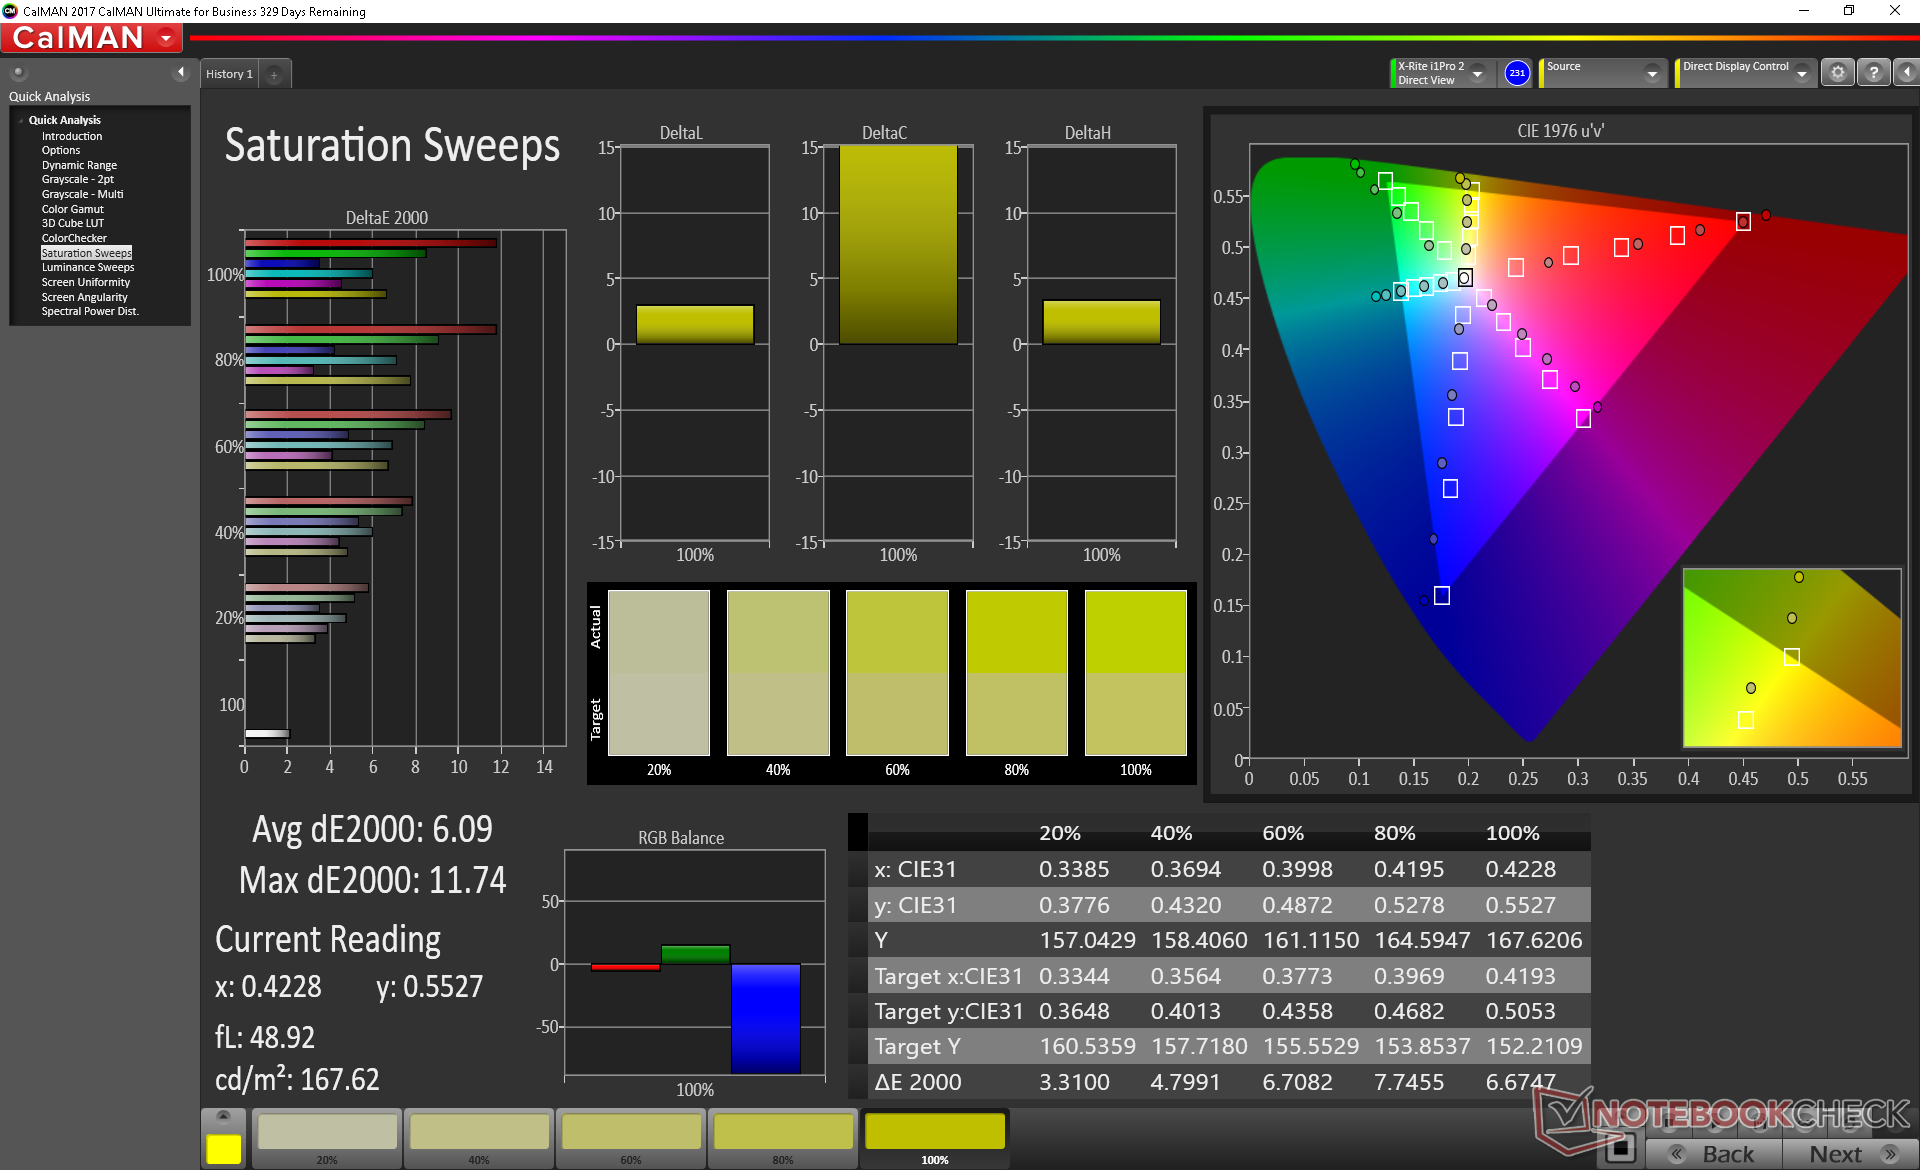
There are some noteworthy faults to the display. Subjectively, colors appear to be inaccurate and overly saturated even for a budget tablet. Colors look poorly balanced at first glance which is a shame since OLED technology is technically capable of very accurate colors. The maximum brightness of just under 300 nits is also mediocre as it is half as bright as the iPad Pro 10.5 and Samsung Galaxy Tab A 10.5.
We are able to detect pulse-width modulation at brightness levels below 75 percent. Its frequency of 238 Hz is low enough that users sensitive to onscreen flickering may want to avoid using this tablet for long periods.
| |||||||||||||||||||||||||
Brightness Distribution: 83 %
Center on Battery: 297.3 cd/m²
Contrast: ∞:1 (Black: 0 cd/m²)
ΔE ColorChecker Calman: 6.74 | ∀{0.5-29.43 Ø4.73}
ΔE Greyscale Calman: 2.2 | ∀{0.09-98 Ø4.97}
Gamma: 2.31
CCT: 6719 K
| Alldocube Alldocube X AMOLED, 10.5", 2560x1600 | Samsung Galaxy Tab S4 Super AMOLED, 10.5", 2560x1600 | Samsung Galaxy Tab A 10.5 SM-T590N IPS, 10.5", 1920x1200 | Microsoft Surface Go MHN-00003 Sharp SHP14A6, IPS, 10", 1800x1200 | Huawei MediaPad T5 10 IPS, 10.1", 1920x1200 | Apple iPad Pro 10.5 2017 IPS, 10.5", 2224x1668 | |
|---|---|---|---|---|---|---|
| Display | ||||||
| Display P3 Coverage (%) | 66.5 | |||||
| sRGB Coverage (%) | 97.5 | |||||
| AdobeRGB 1998 Coverage (%) | 67.5 | |||||
| Response Times | -44% | -1198% | -1036% | -855% | -832% | |
| Response Time Grey 50% / Grey 80% * (ms) | 3.1 ? | 4.8 ? -55% | 54.8 ? -1668% | 44 ? -1319% | 28.4 ? -816% | 39.6 ? -1177% |
| Response Time Black / White * (ms) | 3 ? | 4 ? -33% | 24.8 ? -727% | 25.6 ? -753% | 29.8 ? -893% | 17.6 ? -487% |
| PWM Frequency (Hz) | 238.1 ? | 240.4 ? | 1020 ? | 67.6 ? | ||
| Screen | 42% | 52% | 49% | 33% | 57% | |
| Brightness middle (cd/m²) | 297.3 | 474 59% | 556 87% | 456 53% | 356 20% | 634 113% |
| Brightness (cd/m²) | 307 | 477 55% | 514 67% | 426 39% | 340 11% | 625 104% |
| Brightness Distribution (%) | 83 | 91 10% | 87 5% | 88 6% | 92 11% | 87 5% |
| Black Level * (cd/m²) | 0.42 | 0.31 | 0.5 | 0.39 | ||
| Colorchecker dE 2000 * | 6.74 | 2.5 63% | 1.8 73% | 1.3 81% | 2.3 66% | 1.9 72% |
| Colorchecker dE 2000 max. * | 14.42 | 5.8 60% | 3.2 78% | 3 79% | 6.5 55% | 3.9 73% |
| Greyscale dE 2000 * | 2.2 | 2.1 5% | 2.2 -0% | 1.4 36% | 1.4 36% | 2.8 -27% |
| Gamma | 2.31 95% | 2.08 106% | 2.26 97% | 2.24 98% | 2.16 102% | 2.26 97% |
| CCT | 6719 97% | 6281 103% | 6819 95% | 6687 97% | 6565 99% | 7027 93% |
| Contrast (:1) | 1324 | 1471 | 712 | 1626 | ||
| Colorchecker dE 2000 calibrated * | 1.1 | |||||
| Color Space (Percent of AdobeRGB 1998) (%) | 62.3 | |||||
| Color Space (Percent of sRGB) (%) | 96.8 | |||||
| Total Average (Program / Settings) | -1% /
21% | -573% /
-261% | -494% /
-222% | -411% /
-189% | -388% /
-166% |
* ... smaller is better
Measurements with our X-Rite colorimeter reveal both an accurate grayscale and an inaccurate color profile to confirm our suspicions above. Red and green colors in particular are represented more poorly than other tested colors across all saturation levels. Thus, while color temperature is very good for a budget tablet, actual color accuracy is not up to par for overall mixed results.
Fortunately, the below average color accuracy does not impact multimedia or gaming very much. Colorful, stylized games in particular tend to pop and look brighter when color saturation is high.
Display Response Times
| ↔ Response Time Black to White | ||
|---|---|---|
| 3 ms ... rise ↗ and fall ↘ combined | ↗ 1.3 ms rise | 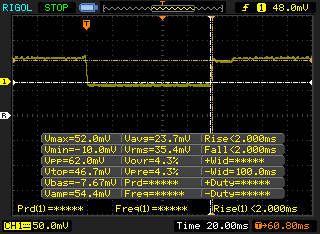 |
| ↘ 1.7 ms fall | ||
| The screen shows very fast response rates in our tests and should be very well suited for fast-paced gaming. In comparison, all tested devices range from 0.1 (minimum) to 240 (maximum) ms. » 14 % of all devices are better. This means that the measured response time is better than the average of all tested devices (19.9 ms). | ||
| ↔ Response Time 50% Grey to 80% Grey | ||
| 3.1 ms ... rise ↗ and fall ↘ combined | ↗ 1.7 ms rise | 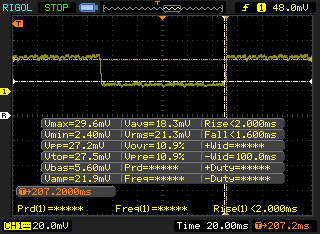 |
| ↘ 1.4 ms fall | ||
| The screen shows very fast response rates in our tests and should be very well suited for fast-paced gaming. In comparison, all tested devices range from 0.165 (minimum) to 636 (maximum) ms. » 13 % of all devices are better. This means that the measured response time is better than the average of all tested devices (31.1 ms). | ||
Screen Flickering / PWM (Pulse-Width Modulation)
| Screen flickering / PWM detected | 238.1 Hz | ≤ 75 % brightness setting | 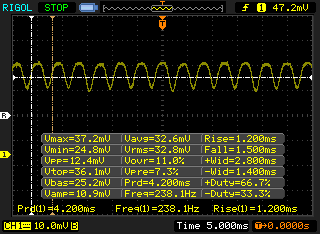 |
The display backlight flickers at 238.1 Hz (worst case, e.g., utilizing PWM) Flickering detected at a brightness setting of 75 % and below. There should be no flickering or PWM above this brightness setting. The frequency of 238.1 Hz is relatively low, so sensitive users will likely notice flickering and experience eyestrain at the stated brightness setting and below. In comparison: 52 % of all tested devices do not use PWM to dim the display. If PWM was detected, an average of 7791 (minimum: 5 - maximum: 343500) Hz was measured. | |||
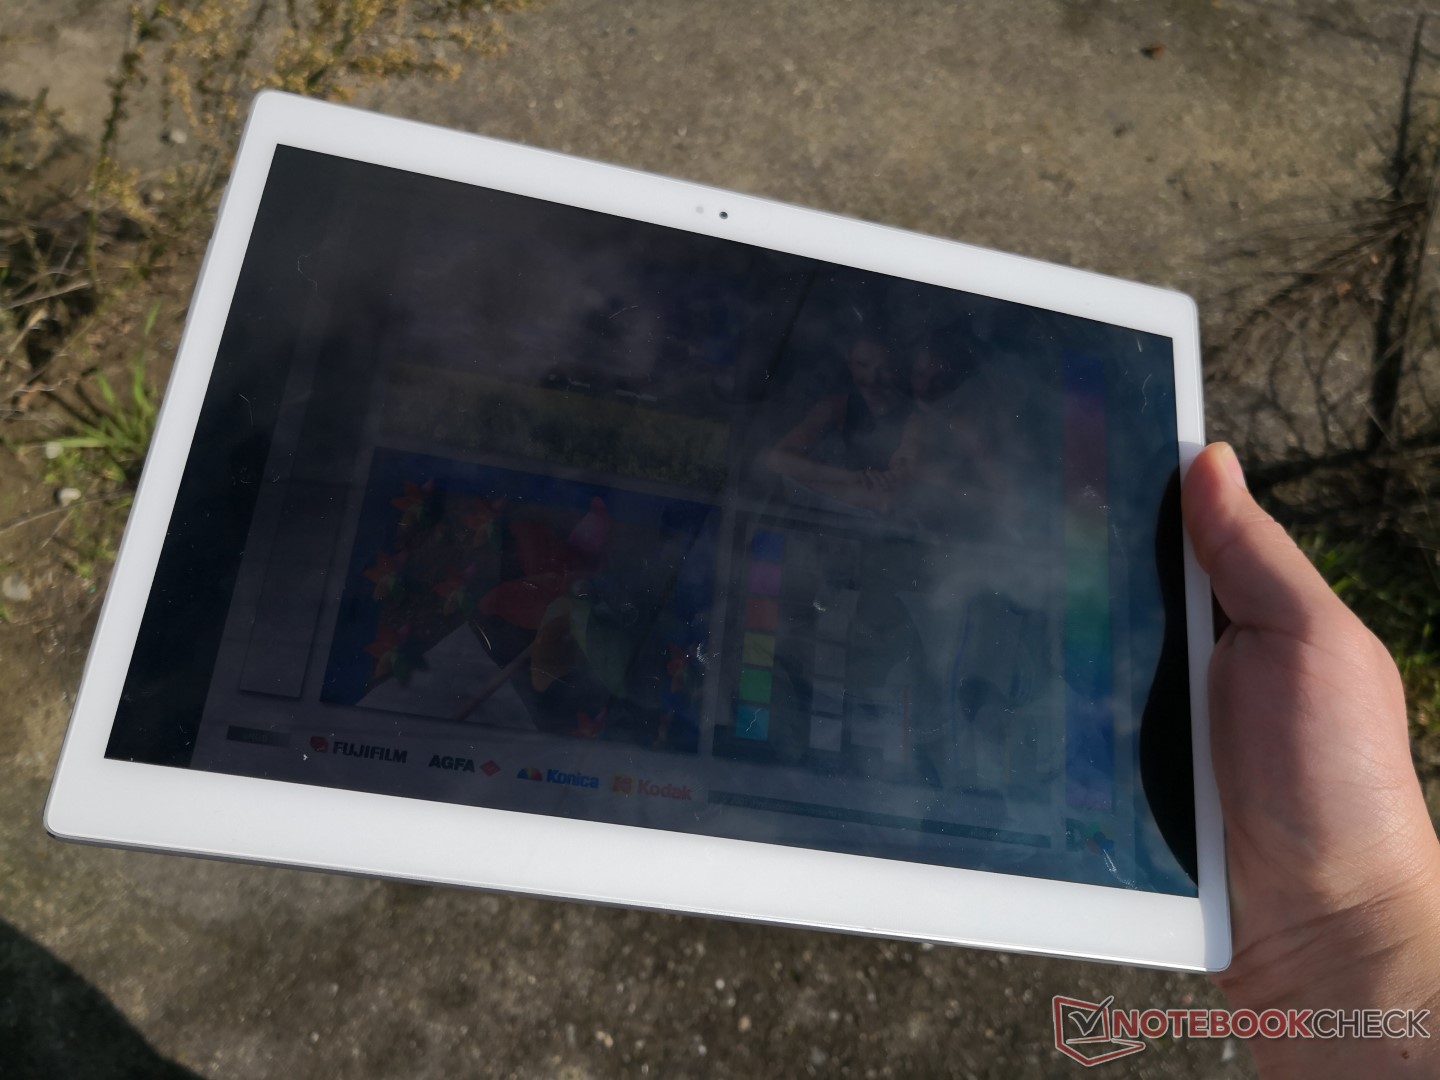
Viewing angles are wider than a typical IPS panel with no major discoloration or contrast changes from extreme angles. Outdoor visibility is limited to areas with lots of shade as the backlight is dimmer than most other tablets. The brighter Galaxy Tab S4 display does a much better job with the same panel technology in this regard.
Performance
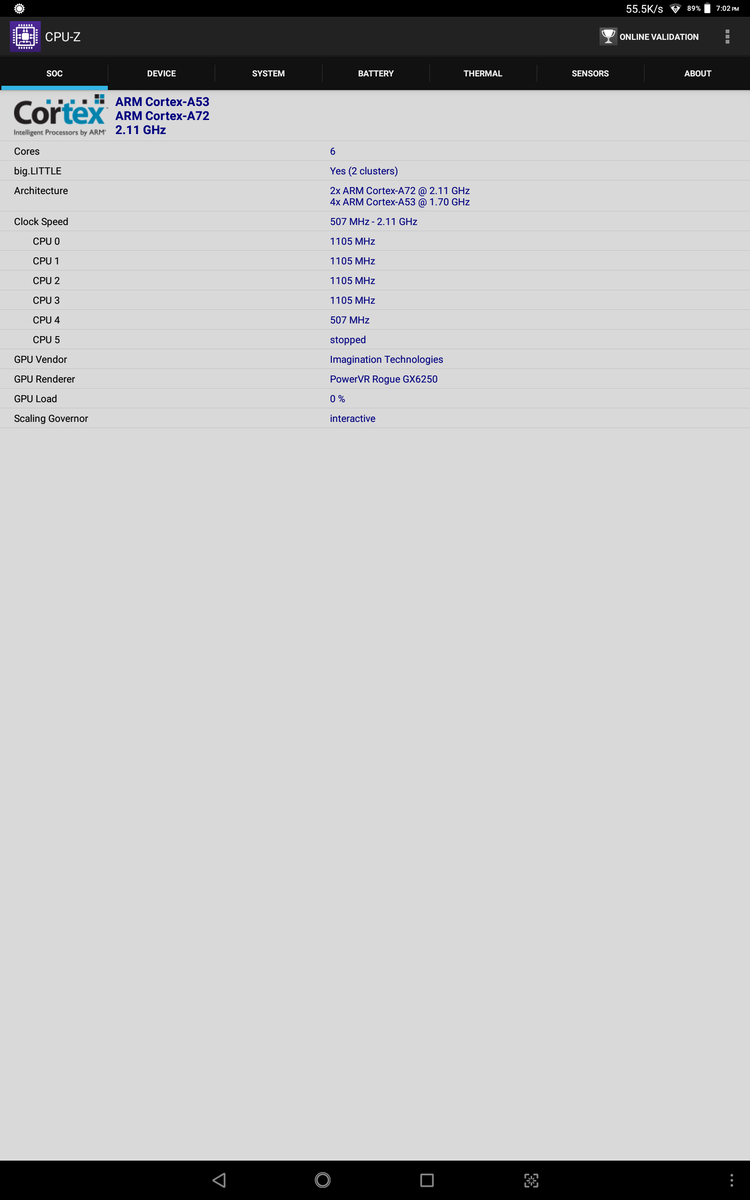
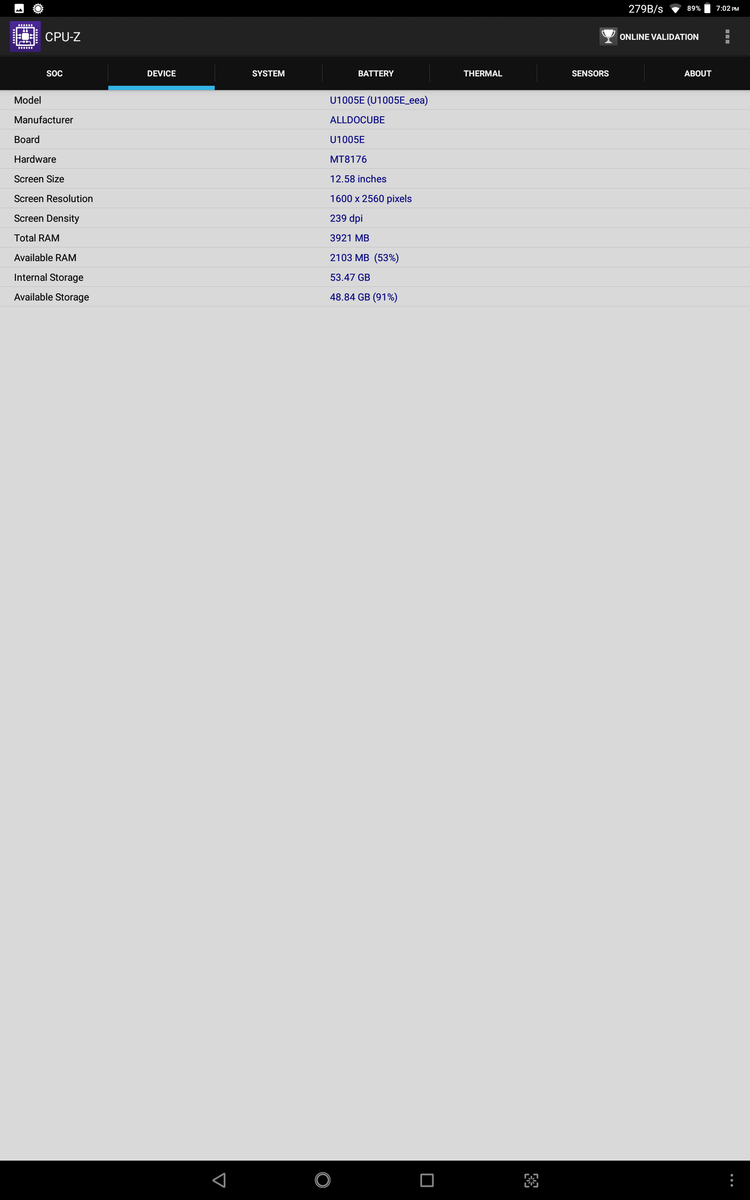
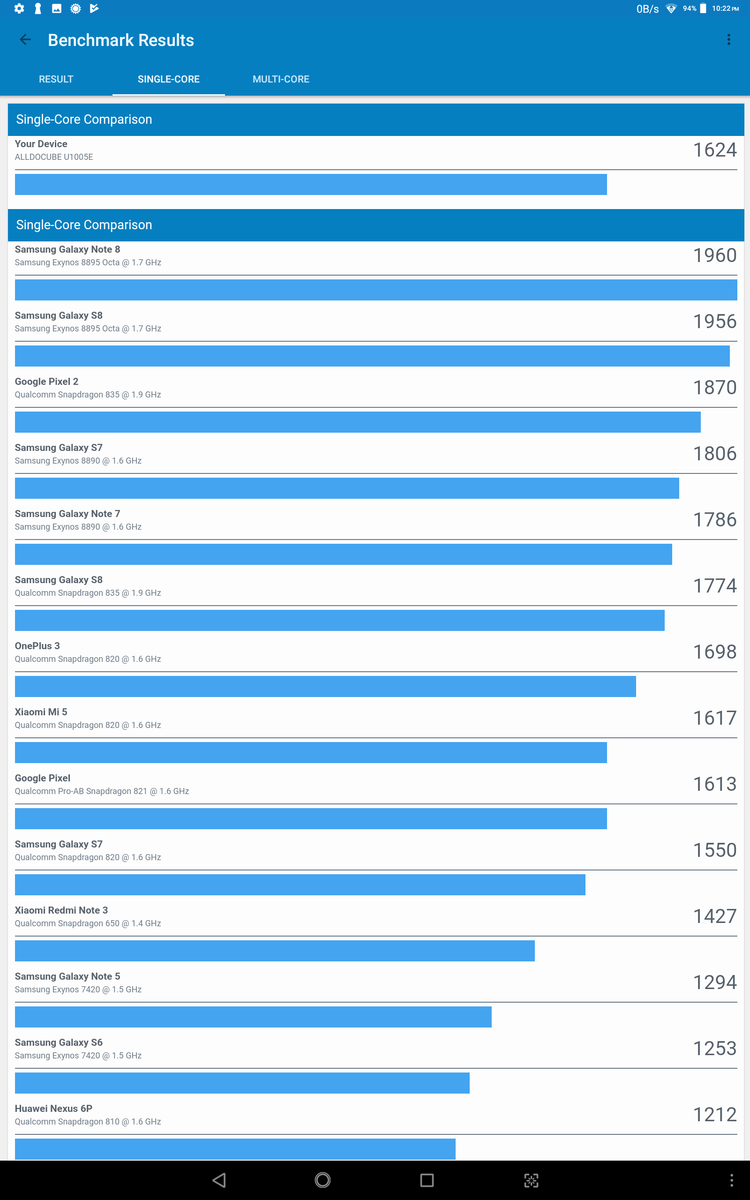
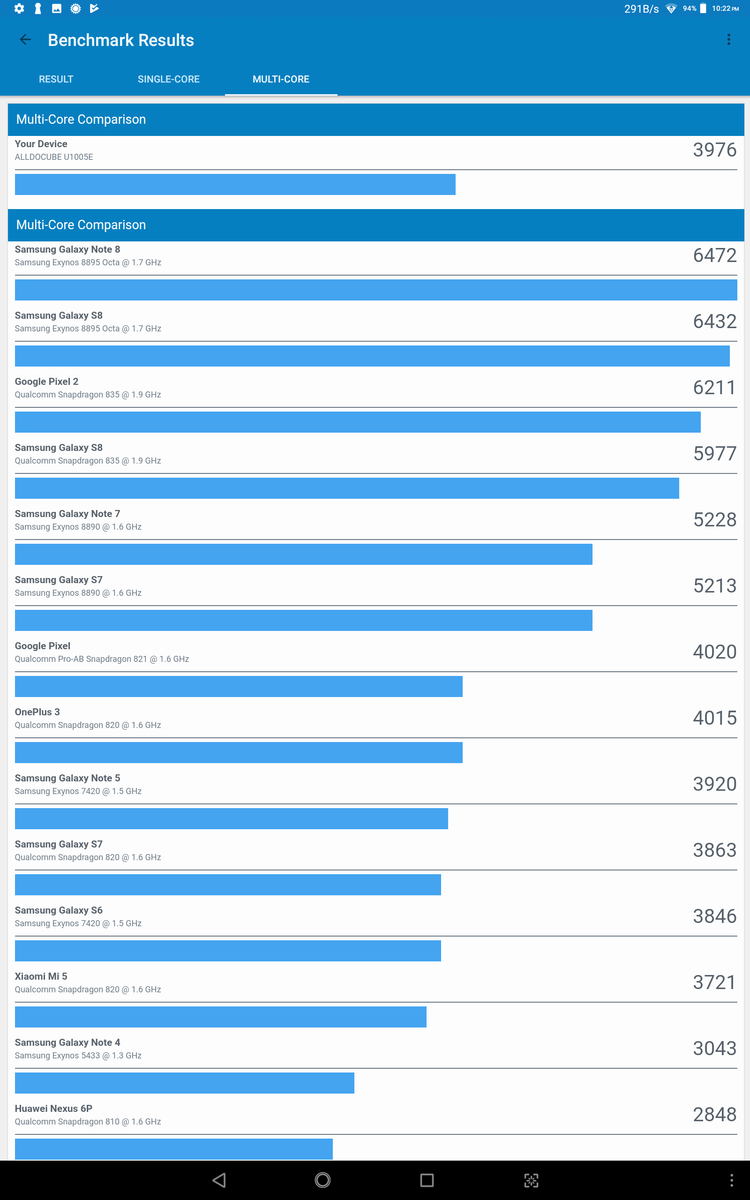
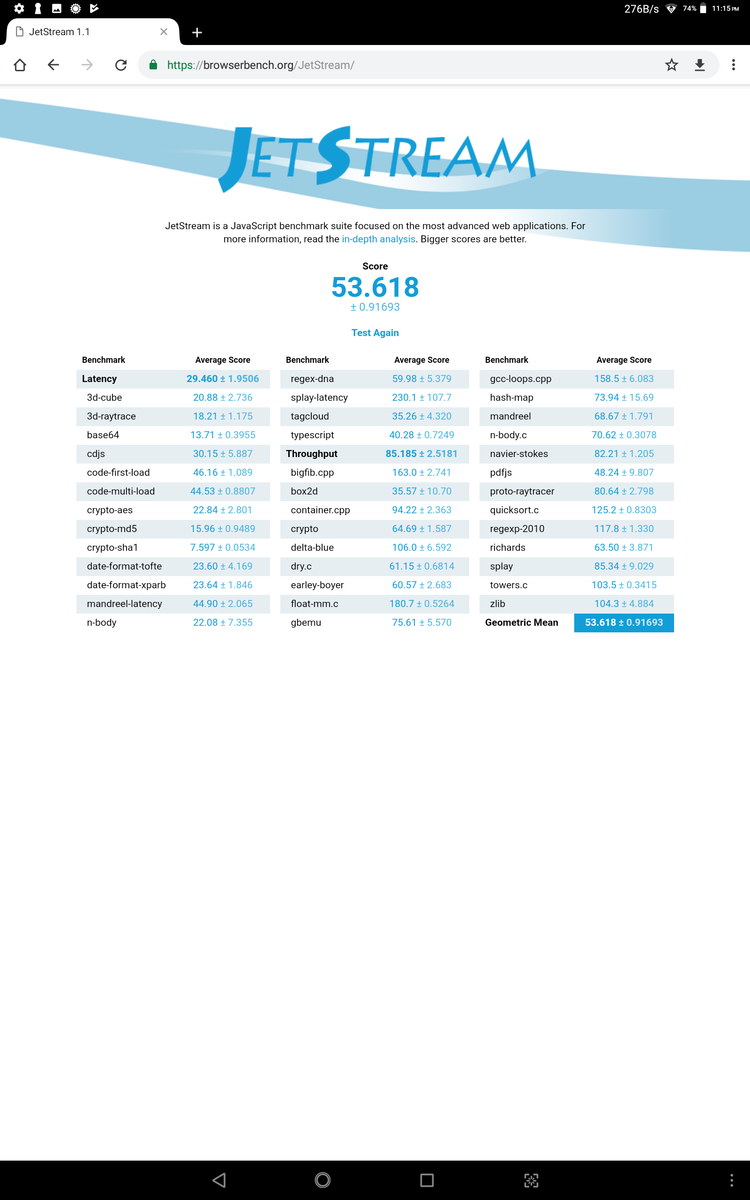
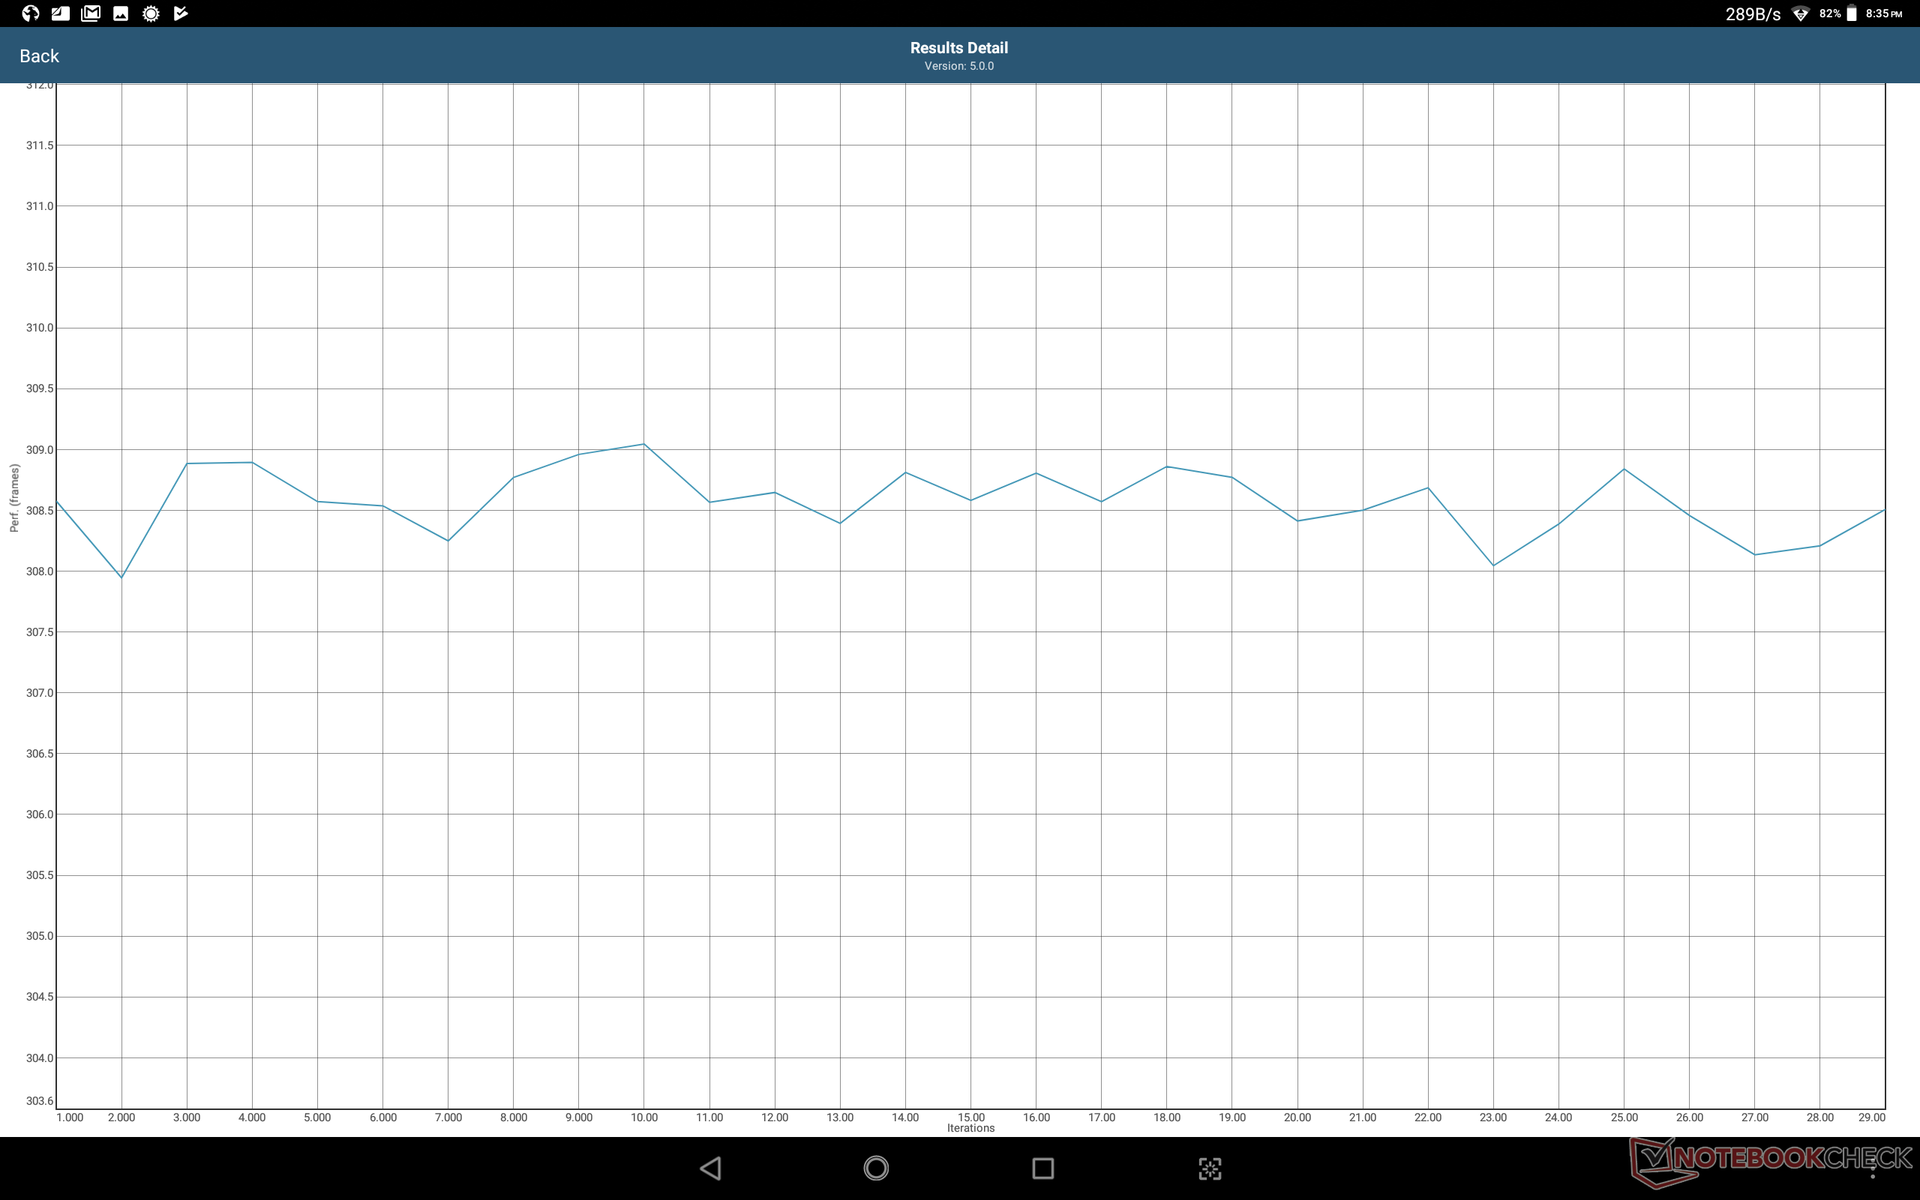
The Mediatek MT8176 is a mid-range but uncommon hexa-core SoC. Its 28 nm manufacturing technology is ancient in today's world of flagships where <10 nm chips are becoming common. Nonetheless, Geekbench scores show the MediaTek SoC to be comparable to the mid-range 14 nm Snapdragon 625. Browser-based benchmarks like Octane score highly relative to what we would've expected from this CPU. Its Jetstream score, for example, is 80 percent higher than the MediaPad M5 lite even though their SoCs perform somewhat similarly in GeekBench.
Subjectively, system performance is smoother than many cheaper tablets like the Chuwi HiPad but with more frame skips and latency than the pricier iPad Pro 10.5. This becomes particularly noticeable when scrolling through long web pages, multi-tasking, or waking from sleep. In other words, system performance is typical of a mid-range Android tablet.
| Basemark GPU 1.1 | |
| 1920x1080 Vulkan Medium Offscreen | |
| Samsung Galaxy Tab S4 | |
| Vulkan Medium Native | |
| Samsung Galaxy Tab S4 | |
| 1920x1080 OpenGL Medium Offscreen | |
| Samsung Galaxy Tab S4 | |
* ... smaller is better
Storage Devices
Performance from the 64 GB eMMC is average at best when compared to other eMMC and UHS solutions on other tablets. Random read and write rates of small 4 KB blocks are particularly slow at about 12 MB/s each whereas the Huawei MediaPad T5 10 clocks in at 76 MB/s in the same AndroBench benchmark. Transfer rates from the MicroSD card reader are at least comparable to the card readers on competitors.
| Alldocube Alldocube X 64 GB eMMC Flash | Samsung Galaxy Tab S4 64 GB UFS 2.1 Flash | Samsung Galaxy Tab A 10.5 SM-T590N 32 GB eMMC Flash | Microsoft Surface Go MHN-00003 64 GB eMMC Flash | Huawei MediaPad T5 10 32 GB eMMC Flash | Chuwi HiPad 32 GB eMMC Flash | |
|---|---|---|---|---|---|---|
| AndroBench 3-5 | 208% | 66% | 165% | 12% | ||
| Sequential Write 256KB SDCard (MB/s) | 66.1 | 59.1 -11% | 60.4 -9% | 72.5 10% | 66.8 1% | |
| Sequential Read 256KB SDCard (MB/s) | 87.2 | 80.1 -8% | 80.6 -8% | 83.9 -4% | 65.9 -24% | |
| Random Write 4KB (MB/s) | 11.62 | 24.43 110% | 13.39 15% | 76.1 555% | 10.28 -12% | |
| Random Read 4KB (MB/s) | 14.62 | 142 871% | 71.1 386% | 76.7 425% | 40.21 175% | |
| Sequential Write 256KB (MB/s) | 101.1 | 195.8 94% | 103.3 2% | 83.8 -17% | 73.6 -27% | |
| Sequential Read 256KB (MB/s) | 255.4 | 741 190% | 285.6 12% | 312.2 22% | 144.3 -44% |
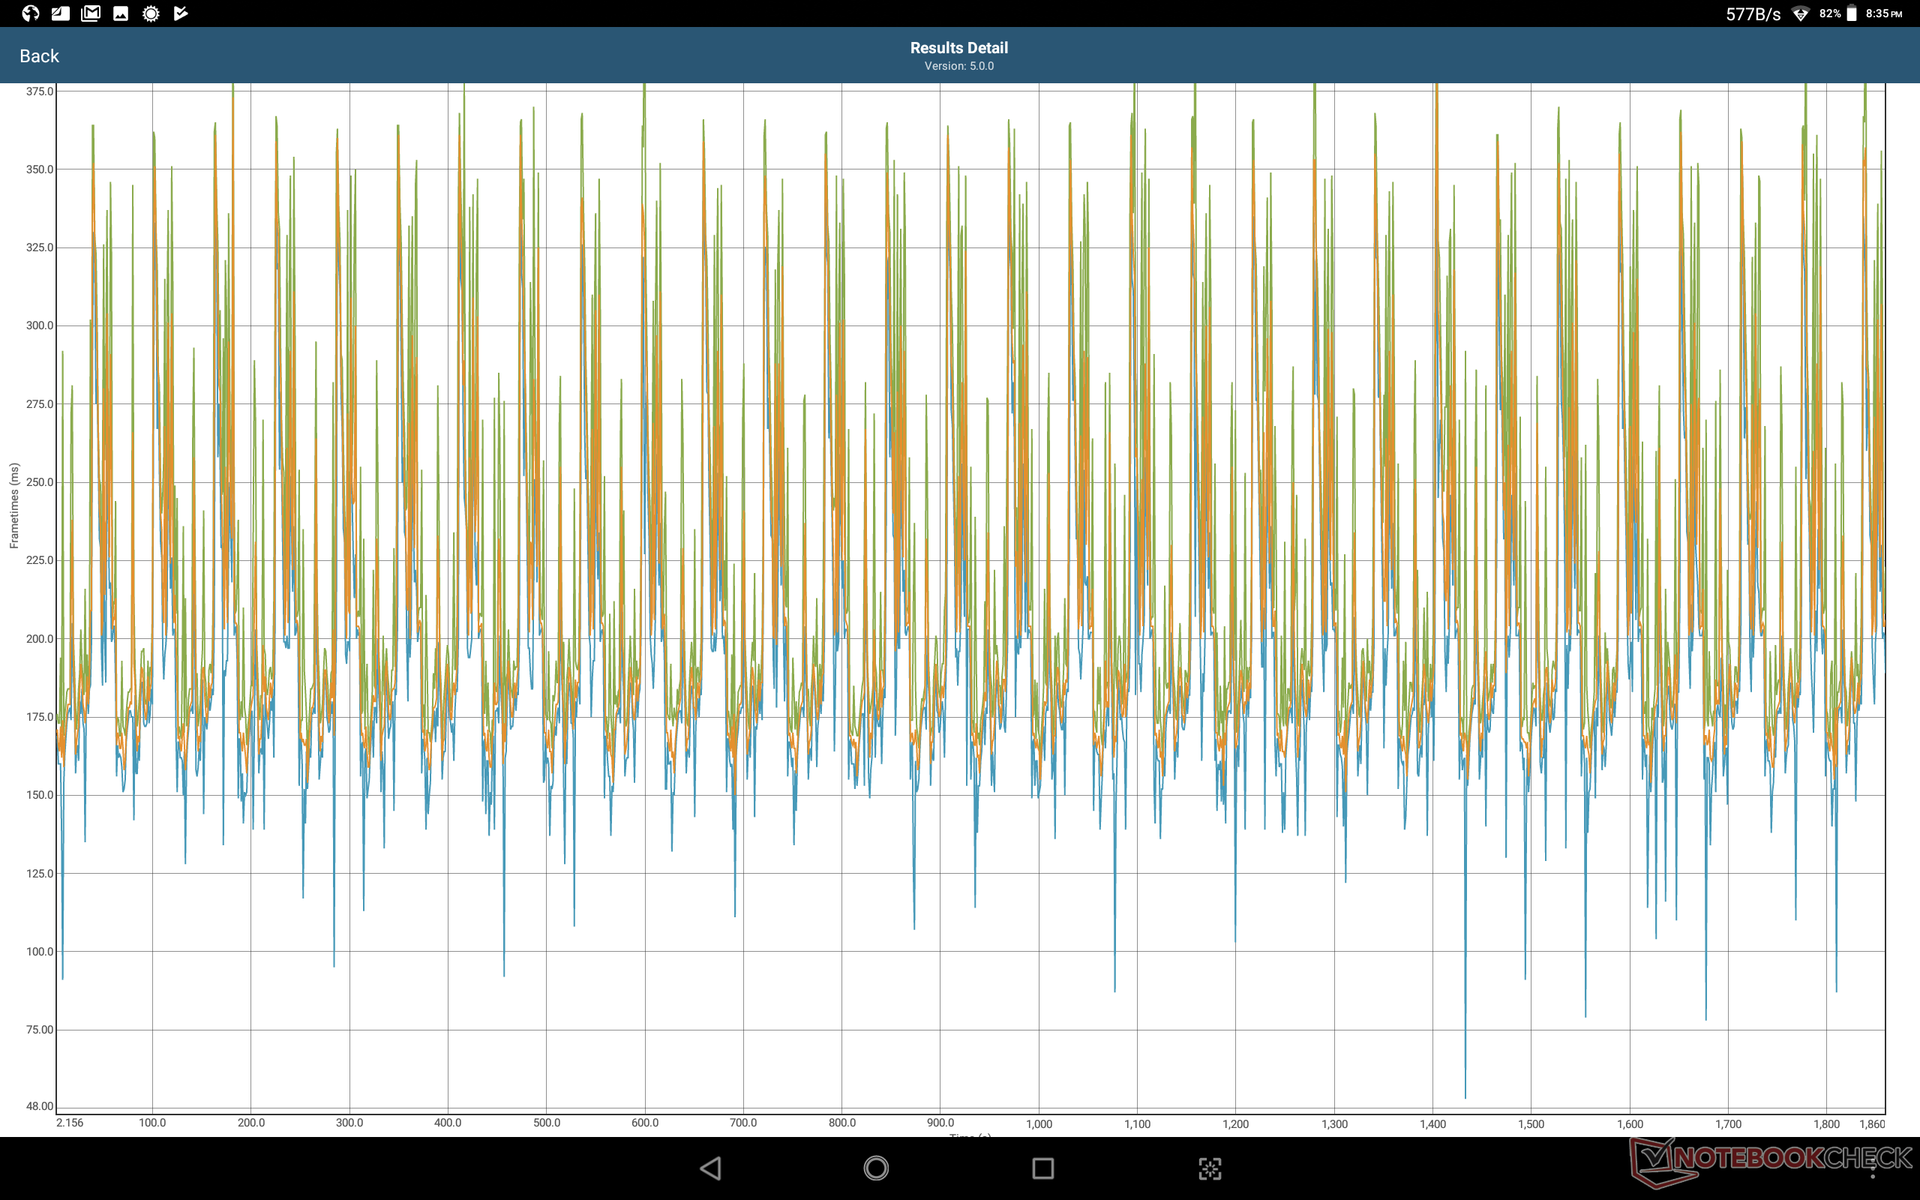
Games
The PowerVR GX6250 is a budget GPU also found on the Amazon Fire HD 10 and Acer Iconia Tab 10. It's able to run demanding games like Asphalt 9 adequately between 30 and 60 FPS. There is very noticeable aliasing during gameplay since the game is not running at the high native resolution of the tablet. Less demanding sprite-based games will not have this issue and are a better fit for the Alldocube.

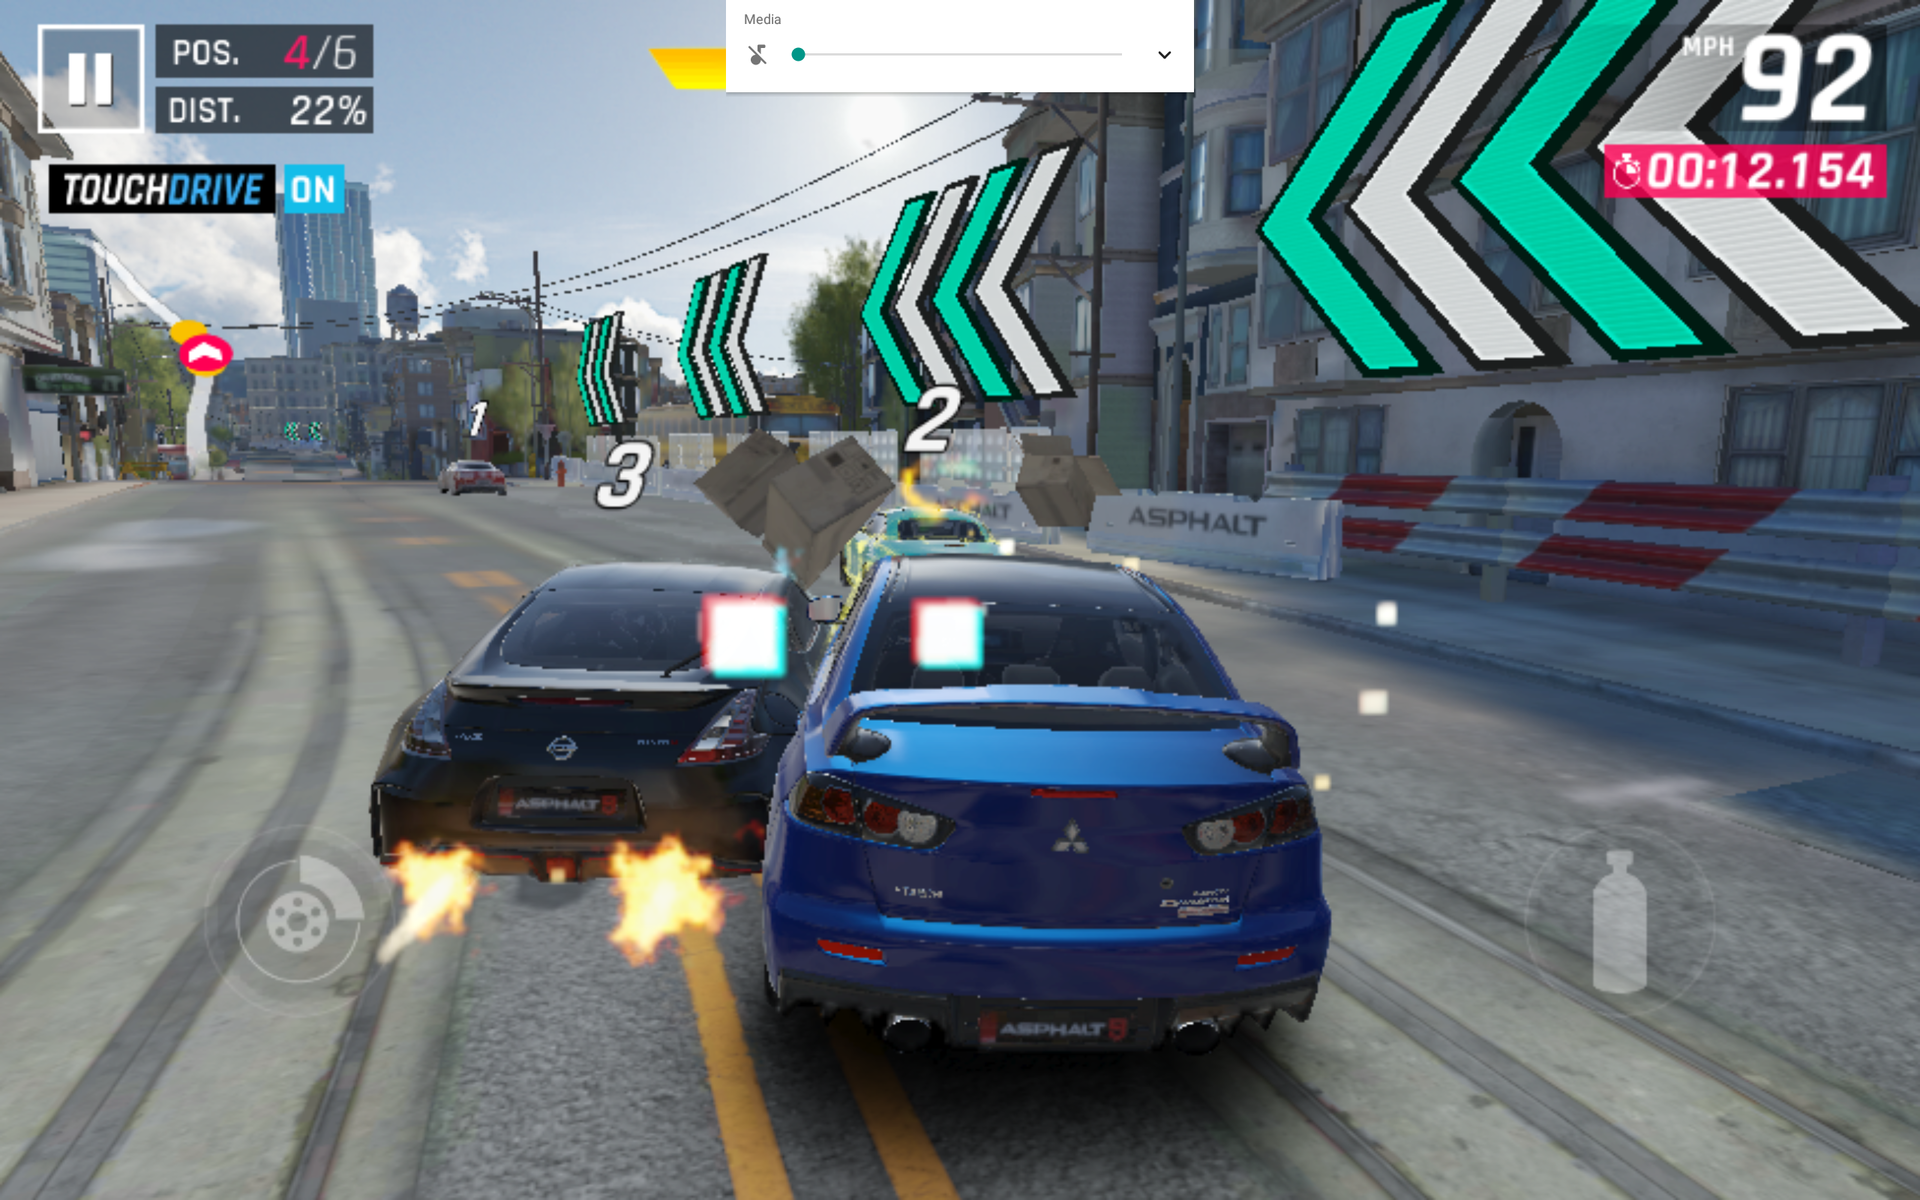
| 3DMark Sling Shot Extreme (ES 3.1) Unlimited | 926 points | |
Help | ||
Emissions
Temperature
Surface temperatures are warmer on the right half of the tablet closer to the USB port. We are able to record a hot spot of 38 C when running very high loads compared to 33 C and 41 C on the MediaPad T5 10 and iPad Pro 10.5, respectively. We never found the unit to be uncomfortable to hold even if gaming.
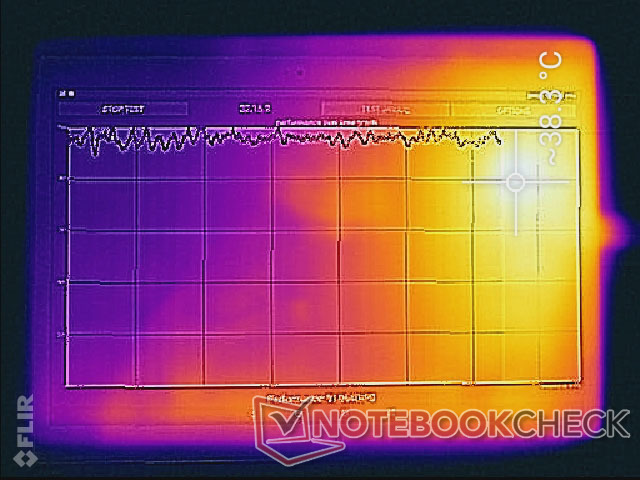
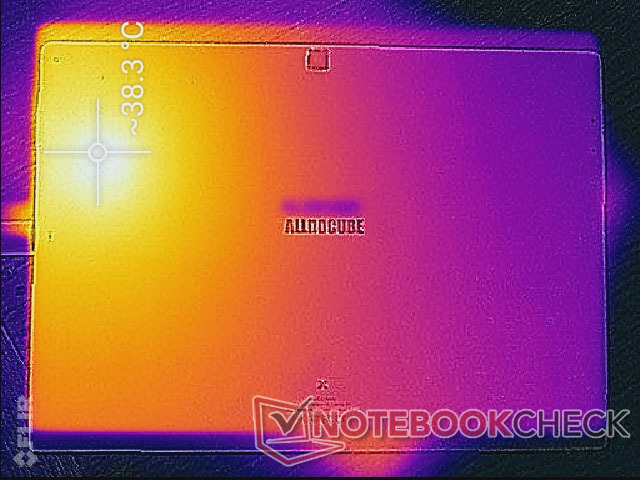
(+) The maximum temperature on the upper side is 38.2 °C / 101 F, compared to the average of 33.6 °C / 92 F, ranging from 20.7 to 53.2 °C for the class Tablet.
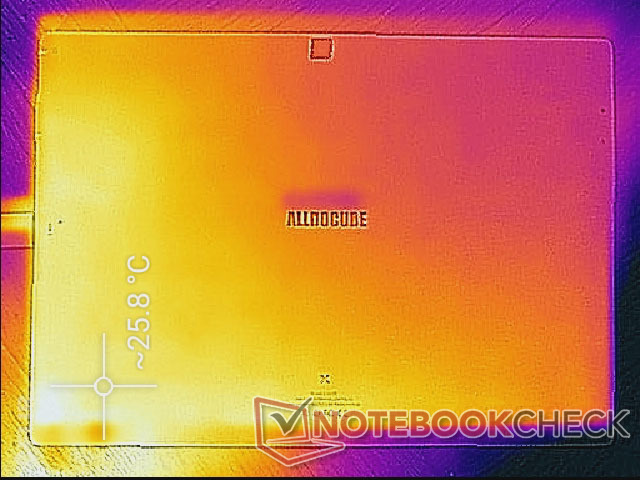
(+) The bottom heats up to a maximum of 38.2 °C / 101 F, compared to the average of 33.2 °C / 92 F
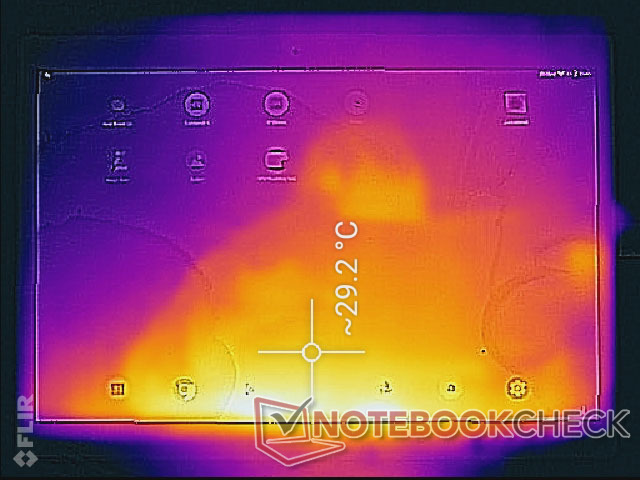
(+) In idle usage, the average temperature for the upper side is 25.8 °C / 78 F, compared to the device average of 30 °C / 86 F.
Speakers
The stereo speakers are sufficiently loud at maximum volume with no chassis reverberations. Bass reproduction is poor as illustrated by our pink noise measurements below. Alldocube isn't trying to break any ground here so the audio holds nothing surprising in relation to other mid-range Android tablets.

Alldocube Alldocube X audio analysis
(-) | not very loud speakers (71.3 dB)
Bass 100 - 315 Hz
(-) | nearly no bass - on average 25.8% lower than median
(±) | linearity of bass is average (9.5% delta to prev. frequency)
Mids 400 - 2000 Hz
(±) | higher mids - on average 6.2% higher than median
(±) | linearity of mids is average (9.6% delta to prev. frequency)
Highs 2 - 16 kHz
(+) | balanced highs - only 4.8% away from median
(±) | linearity of highs is average (7.1% delta to prev. frequency)
Overall 100 - 16.000 Hz
(-) | overall sound is not linear (31.4% difference to median)
Compared to same class
» 91% of all tested devices in this class were better, 2% similar, 7% worse
» The best had a delta of 7%, average was 20%, worst was 129%
Compared to all devices tested
» 90% of all tested devices were better, 2% similar, 8% worse
» The best had a delta of 4%, average was 24%, worst was 134%
Apple MacBook 12 (Early 2016) 1.1 GHz audio analysis
(+) | speakers can play relatively loud (83.6 dB)
Bass 100 - 315 Hz
(±) | reduced bass - on average 11.3% lower than median
(±) | linearity of bass is average (14.2% delta to prev. frequency)
Mids 400 - 2000 Hz
(+) | balanced mids - only 2.4% away from median
(+) | mids are linear (5.5% delta to prev. frequency)
Highs 2 - 16 kHz
(+) | balanced highs - only 2% away from median
(+) | highs are linear (4.5% delta to prev. frequency)
Overall 100 - 16.000 Hz
(+) | overall sound is linear (10.2% difference to median)
Compared to same class
» 7% of all tested devices in this class were better, 2% similar, 91% worse
» The best had a delta of 5%, average was 18%, worst was 53%
Compared to all devices tested
» 5% of all tested devices were better, 1% similar, 94% worse
» The best had a delta of 4%, average was 24%, worst was 134%
Energy Management
Power Consumption
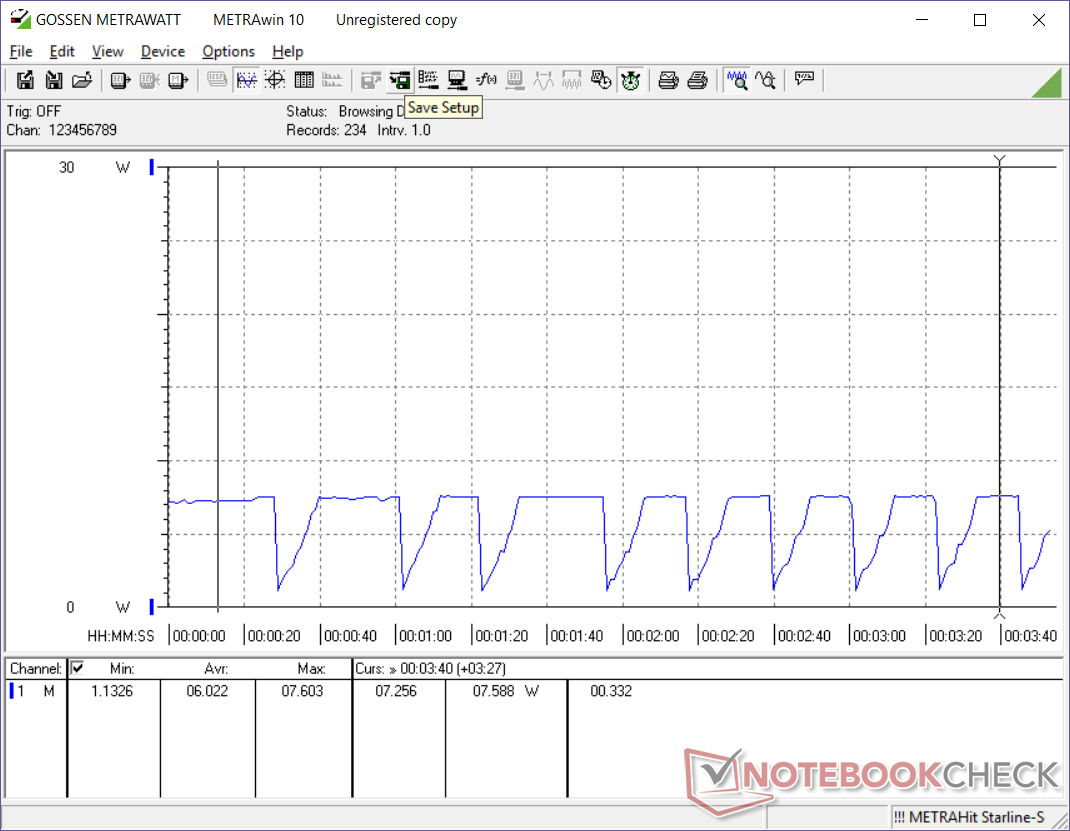
Idling on the Home screen demands anywhere between 3.8 W and 6.3 W on average depending on the brightness level compared to just 1.7 W to 4.3 W on the more efficient Galaxy Tab S4. When video streaming browsing, expect a power demand of about 7.4 W.
Power consumption behavior is strange and even abnormal in some cases. For example, the tablet consumes more power when turned off than when on standby (2.7 W vs. 0.45 W) even after double-checking. Consumption also cycles between 1.1 W and 7.6 W when under extreme loads (CPU stress) to suggest some sort of throttling in place. This fortunately has no impact during day-to-day use.
The included 12 V/1.5 A AC adapter can also be used to charge other USB Type-C devices.
| Off / Standby | |
| Idle | |
| Load |
|
Key:
min: | |
| Alldocube Alldocube X MT8176, PowerVR GX6250, 64 GB eMMC Flash, AMOLED, 2560x1600, 10.5" | Samsung Galaxy Tab S4 SD 835, Adreno 540, 64 GB UFS 2.1 Flash, Super AMOLED, 2560x1600, 10.5" | Samsung Galaxy Tab A 10.5 SM-T590N SD 450, Adreno 506, 32 GB eMMC Flash, IPS, 1920x1200, 10.5" | Microsoft Surface Go MHN-00003 Pentium 4415Y, UHD Graphics 615, 64 GB eMMC Flash, IPS, 1800x1200, 10" | Huawei MediaPad T5 10 Kirin 659, Mali-T830 MP2, 32 GB eMMC Flash, IPS, 1920x1200, 10.1" | Apple iPad Pro 10.5 2017 A10X Fusion, A10X Fusion GPU, Toshiba THGBX669D4LLDXG 64 GB NAND , IPS, 2224x1668, 10.5" | |
|---|---|---|---|---|---|---|
| Power Consumption | 31% | 33% | -63% | -30% | 1% | |
| Idle Minimum * (Watt) | 3.8 | 1.76 54% | 1.26 67% | 2.88 24% | 2.33 39% | 1.44 62% |
| Idle Average * (Watt) | 5.9 | 4.22 28% | 4.22 28% | 4.8 19% | 8.46 -43% | 6.12 -4% |
| Idle Maximum * (Watt) | 6.3 | 4.25 33% | 4.29 32% | 7.5 -19% | 8.49 -35% | 6.14 3% |
| Load Average * (Watt) | 7.4 | 4.52 39% | 5.48 26% | 16.9 -128% | 11.14 -51% | 8.55 -16% |
| Load Maximum * (Watt) | 7.6 | 7.35 3% | 6.57 14% | 23.8 -213% | 12.3 -62% | 10.62 -40% |
* ... smaller is better
Battery Life
Runtimes are below average for a tablet despite its sizable 8000 mAh battery. We are only able to record a real-world WLAN runtime of just under 4.5 hours compared to twice that or more on the Samsung Galaxy Tab S4 or Huawei MediaPad T5 10. The strange power consumption behavior we noted above may the culprit as the 30 Wh internal battery is similar in capacity to the iPad Pro 10.5 even though the apple can last almost three times longer when subjected to similar WLAN conditions.
| Alldocube Alldocube X MT8176, PowerVR GX6250, 30.4 Wh | Samsung Galaxy Tab S4 SD 835, Adreno 540, Wh | Samsung Galaxy Tab A 10.5 SM-T590N SD 450, Adreno 506, Wh | Microsoft Surface Go MHN-00003 Pentium 4415Y, UHD Graphics 615, 28 Wh | Huawei MediaPad T5 10 Kirin 659, Mali-T830 MP2, Wh | Apple iPad Pro 10.5 2017 A10X Fusion, A10X Fusion GPU, 30.8 Wh | |
|---|---|---|---|---|---|---|
| Battery runtime | 98% | 271% | 79% | 110% | 176% | |
| WiFi v1.3 (h) | 4.2 | 8.3 98% | 15.6 271% | 7.5 79% | 8.8 110% | 11.6 176% |
| Reader / Idle (h) | 20.5 | 32.7 | 12.9 | 55.5 | 33.9 | |
| Load (h) | 4.1 | 6.4 | 3 | 4 | 3.3 |
Verdict
Pros
Cons
Alldocube set out to create a $270 tablet with the same high quality 10.5-inch AMOLED display as the $650 Samsung Galaxy Tab S4. From this perspective, the Alldocube X is a success as its display is superior to most other tablets with IPS panels in its price range. The fast response times, deep blacks, fingerprint reader, and thin narrow bezel design are rarities for its category.
Dig a little deeper and the flaws begin to surface. Camera quality is mediocre at best, the screen could be brighter when outdoors, battery life is below average, the light chassis is fragile, and colors are noticeably inaccurate by default. These characteristics are common on budget tablets retailing in the $200 to $300 range.
The Alldocube X is a tablet of extremes. Its design and display could easily pass on a model retailing for twice the asking price, but many of its other qualities are more representative of the budget-mainstream category. It's an interesting balance that may appeal to users who are intrigued by its impressive first impressions and are not turned away by its aforementioned disadvantages.
A Galaxy Tab S4 experience for less than half the price. The Alldocube X had a lofty goal and it somehow manages to nail it on a few aspects. For every flagship feature it gets right, however, there is another characteristic elsewhere bringing it all down to the budget-mainstream level.
Alldocube Alldocube X
- 01/13/2019 v6 (old)
Allen Ngo
Price comparison
