Amazon Fire HD 8 (2018) Tablet Review
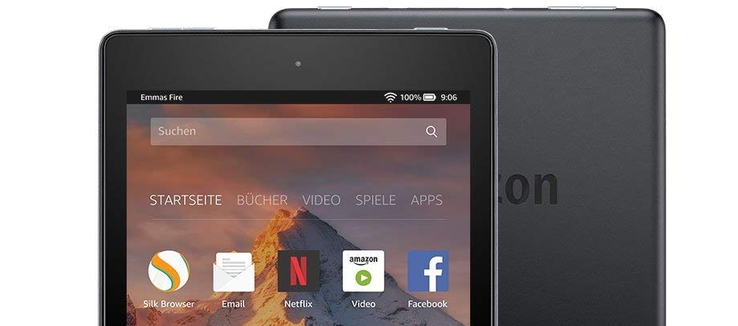
Amazon has updated its entry-level tablet Fire HD 8, but the changes between the new version and the Fire HD 8 (2017) are minor at best. This year’s model features the exact same case but lost 6 g of weight (363 vs. 369 g), supports microSD cards up to 400 GB instead of 256 GB, and the pitiful 0.3 MP webcam has been replaced with a 2 MP sensor. In addition, the new model now also supports wireless charging via the optional Show Mode dock.
On the software side the engineers replaced the underpinnings, and Amazon’s Fire OS is no longer based on Android 5.1.1 but Android 7 (aka Nougat) instead. A noteworthy enhancement is the addition of Amazon’s Alexa voice assistant.
Its main draw remains its low price, which starts at just $80 for the 16 GB model. Accordingly, the Fire HD 8 remains significantly cheaper than most of its 8-inch competitors. In our test, we not only attempted to determine whether it remained usable in day-to-day situations but also took a closer look at the Kids Edition developed specifically for children as well as the optional charging dock. Its main competitors are its own predecessor, the Huawei MediaPad M5 8.4, Lenovo Tab 4 8, Samsung Galaxy Tab Active 2, and the Xiaomi Mi Pad 4.
Case
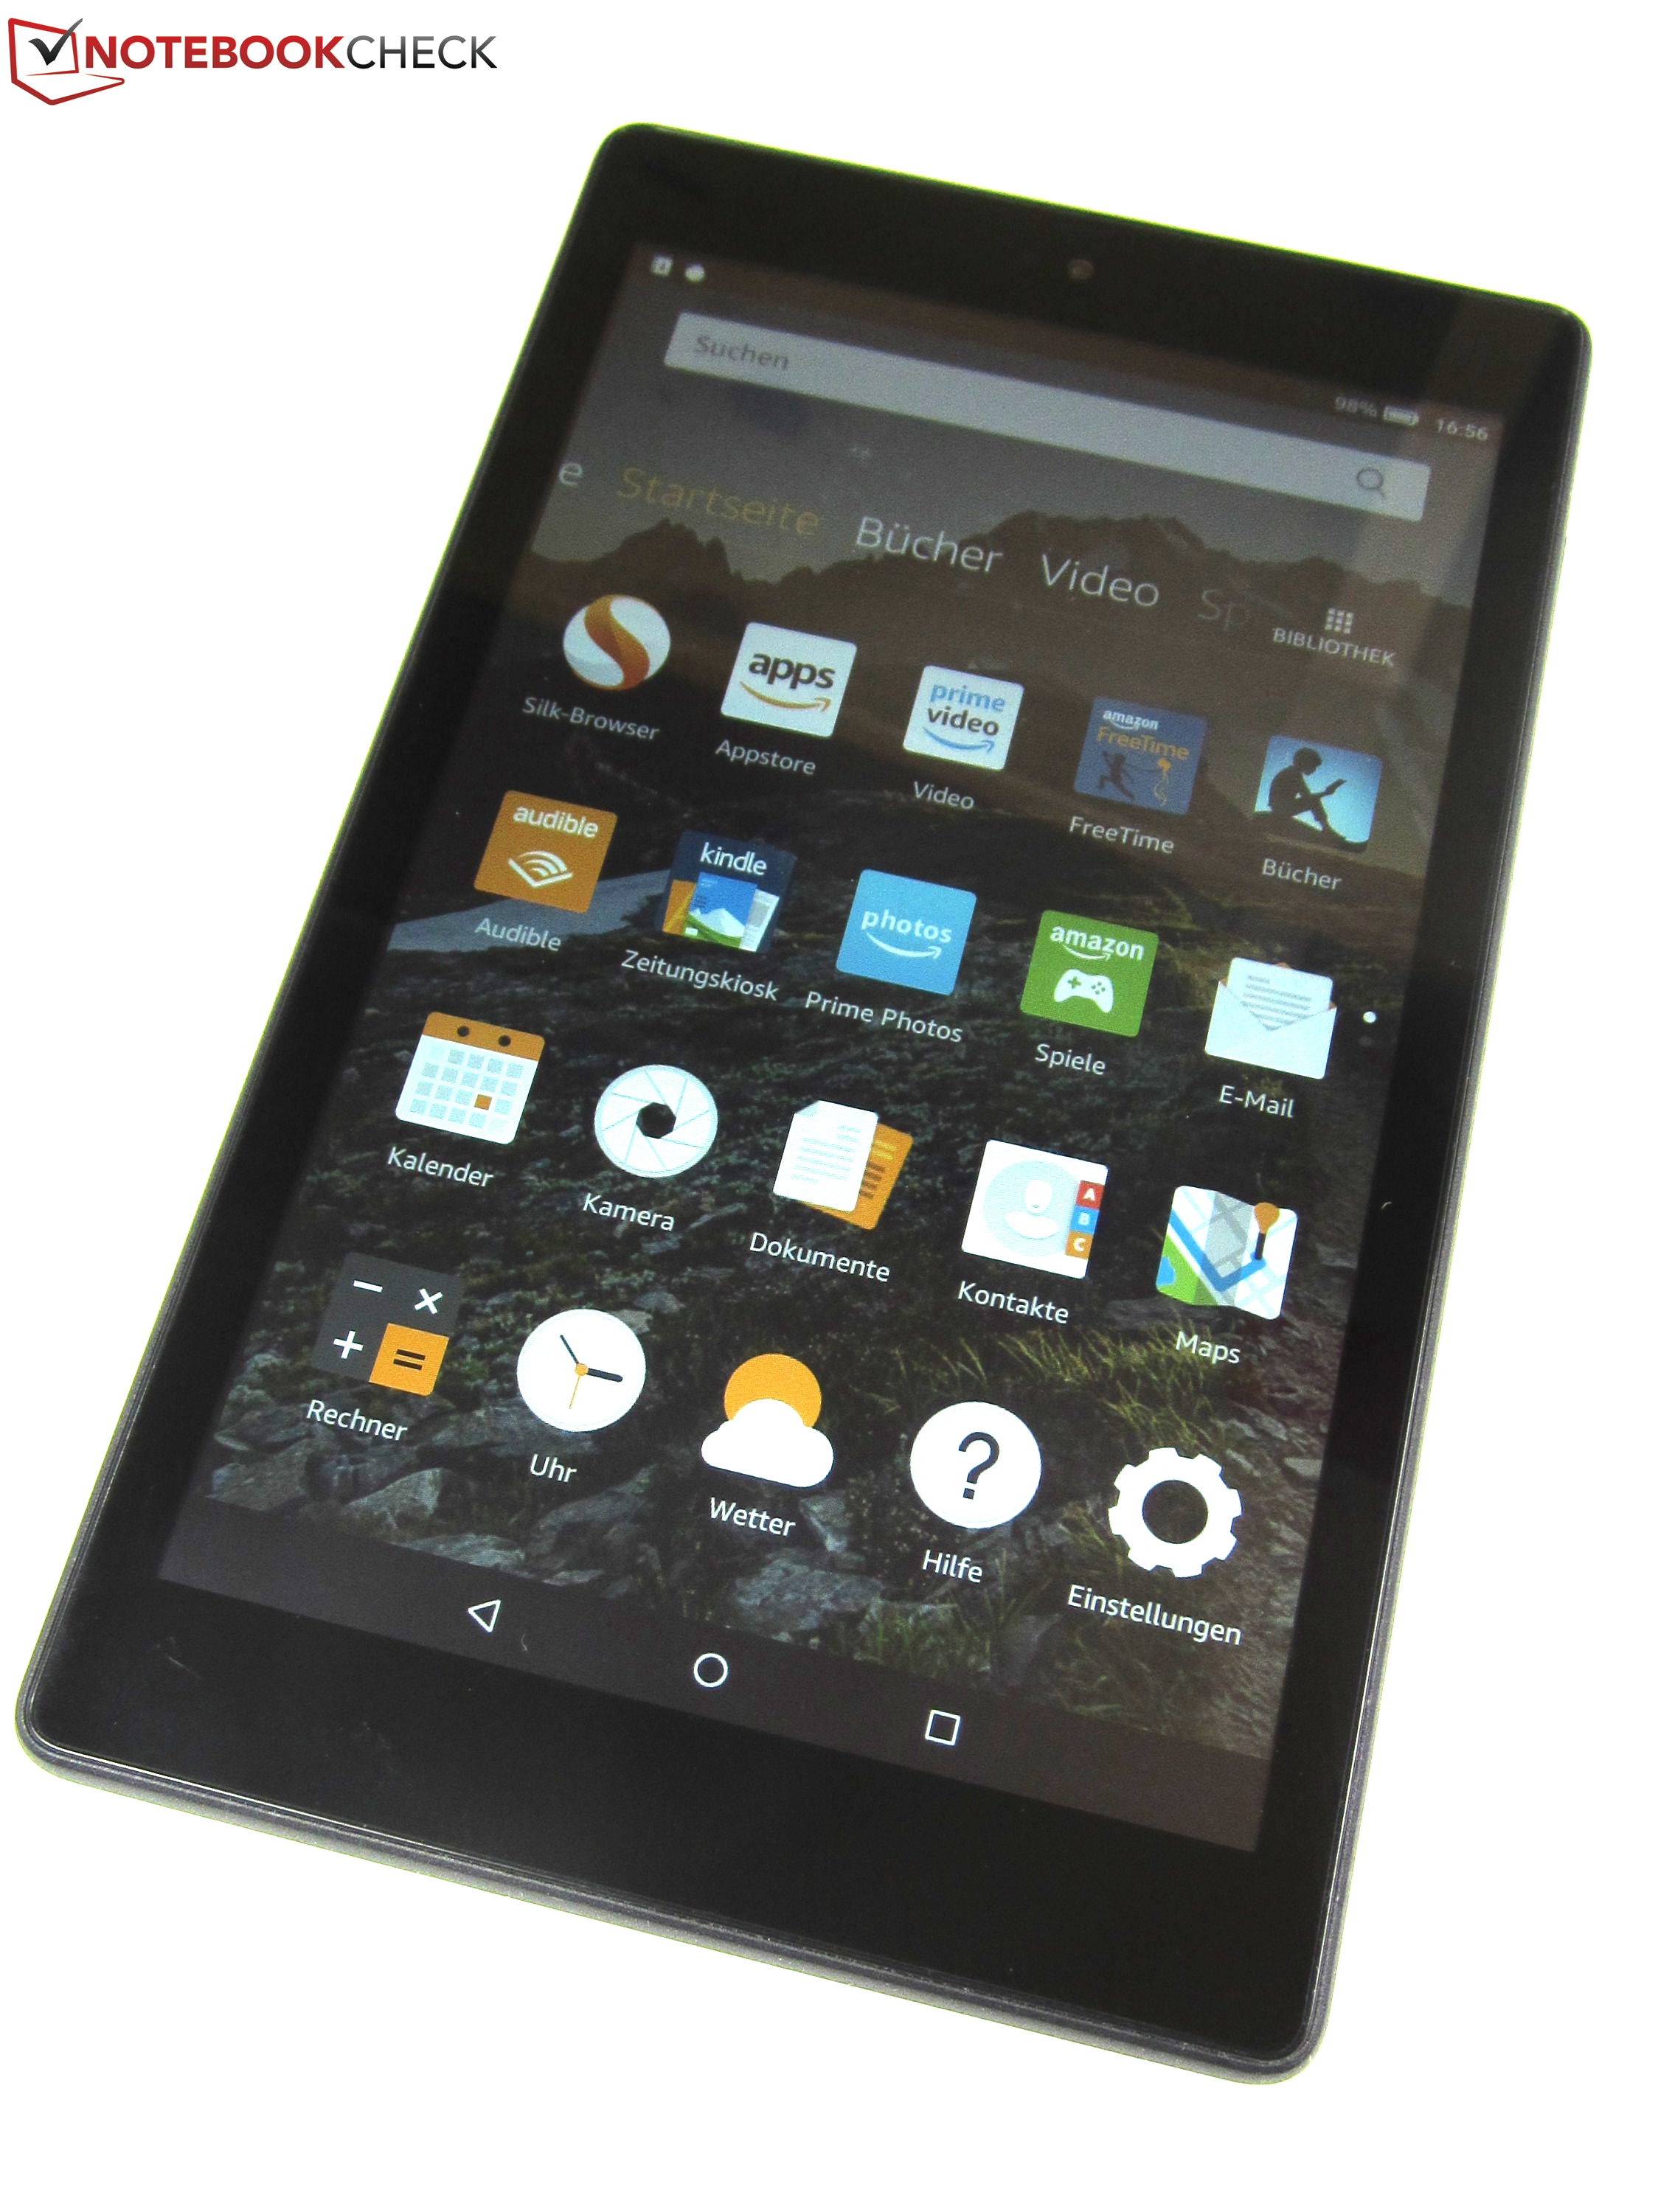
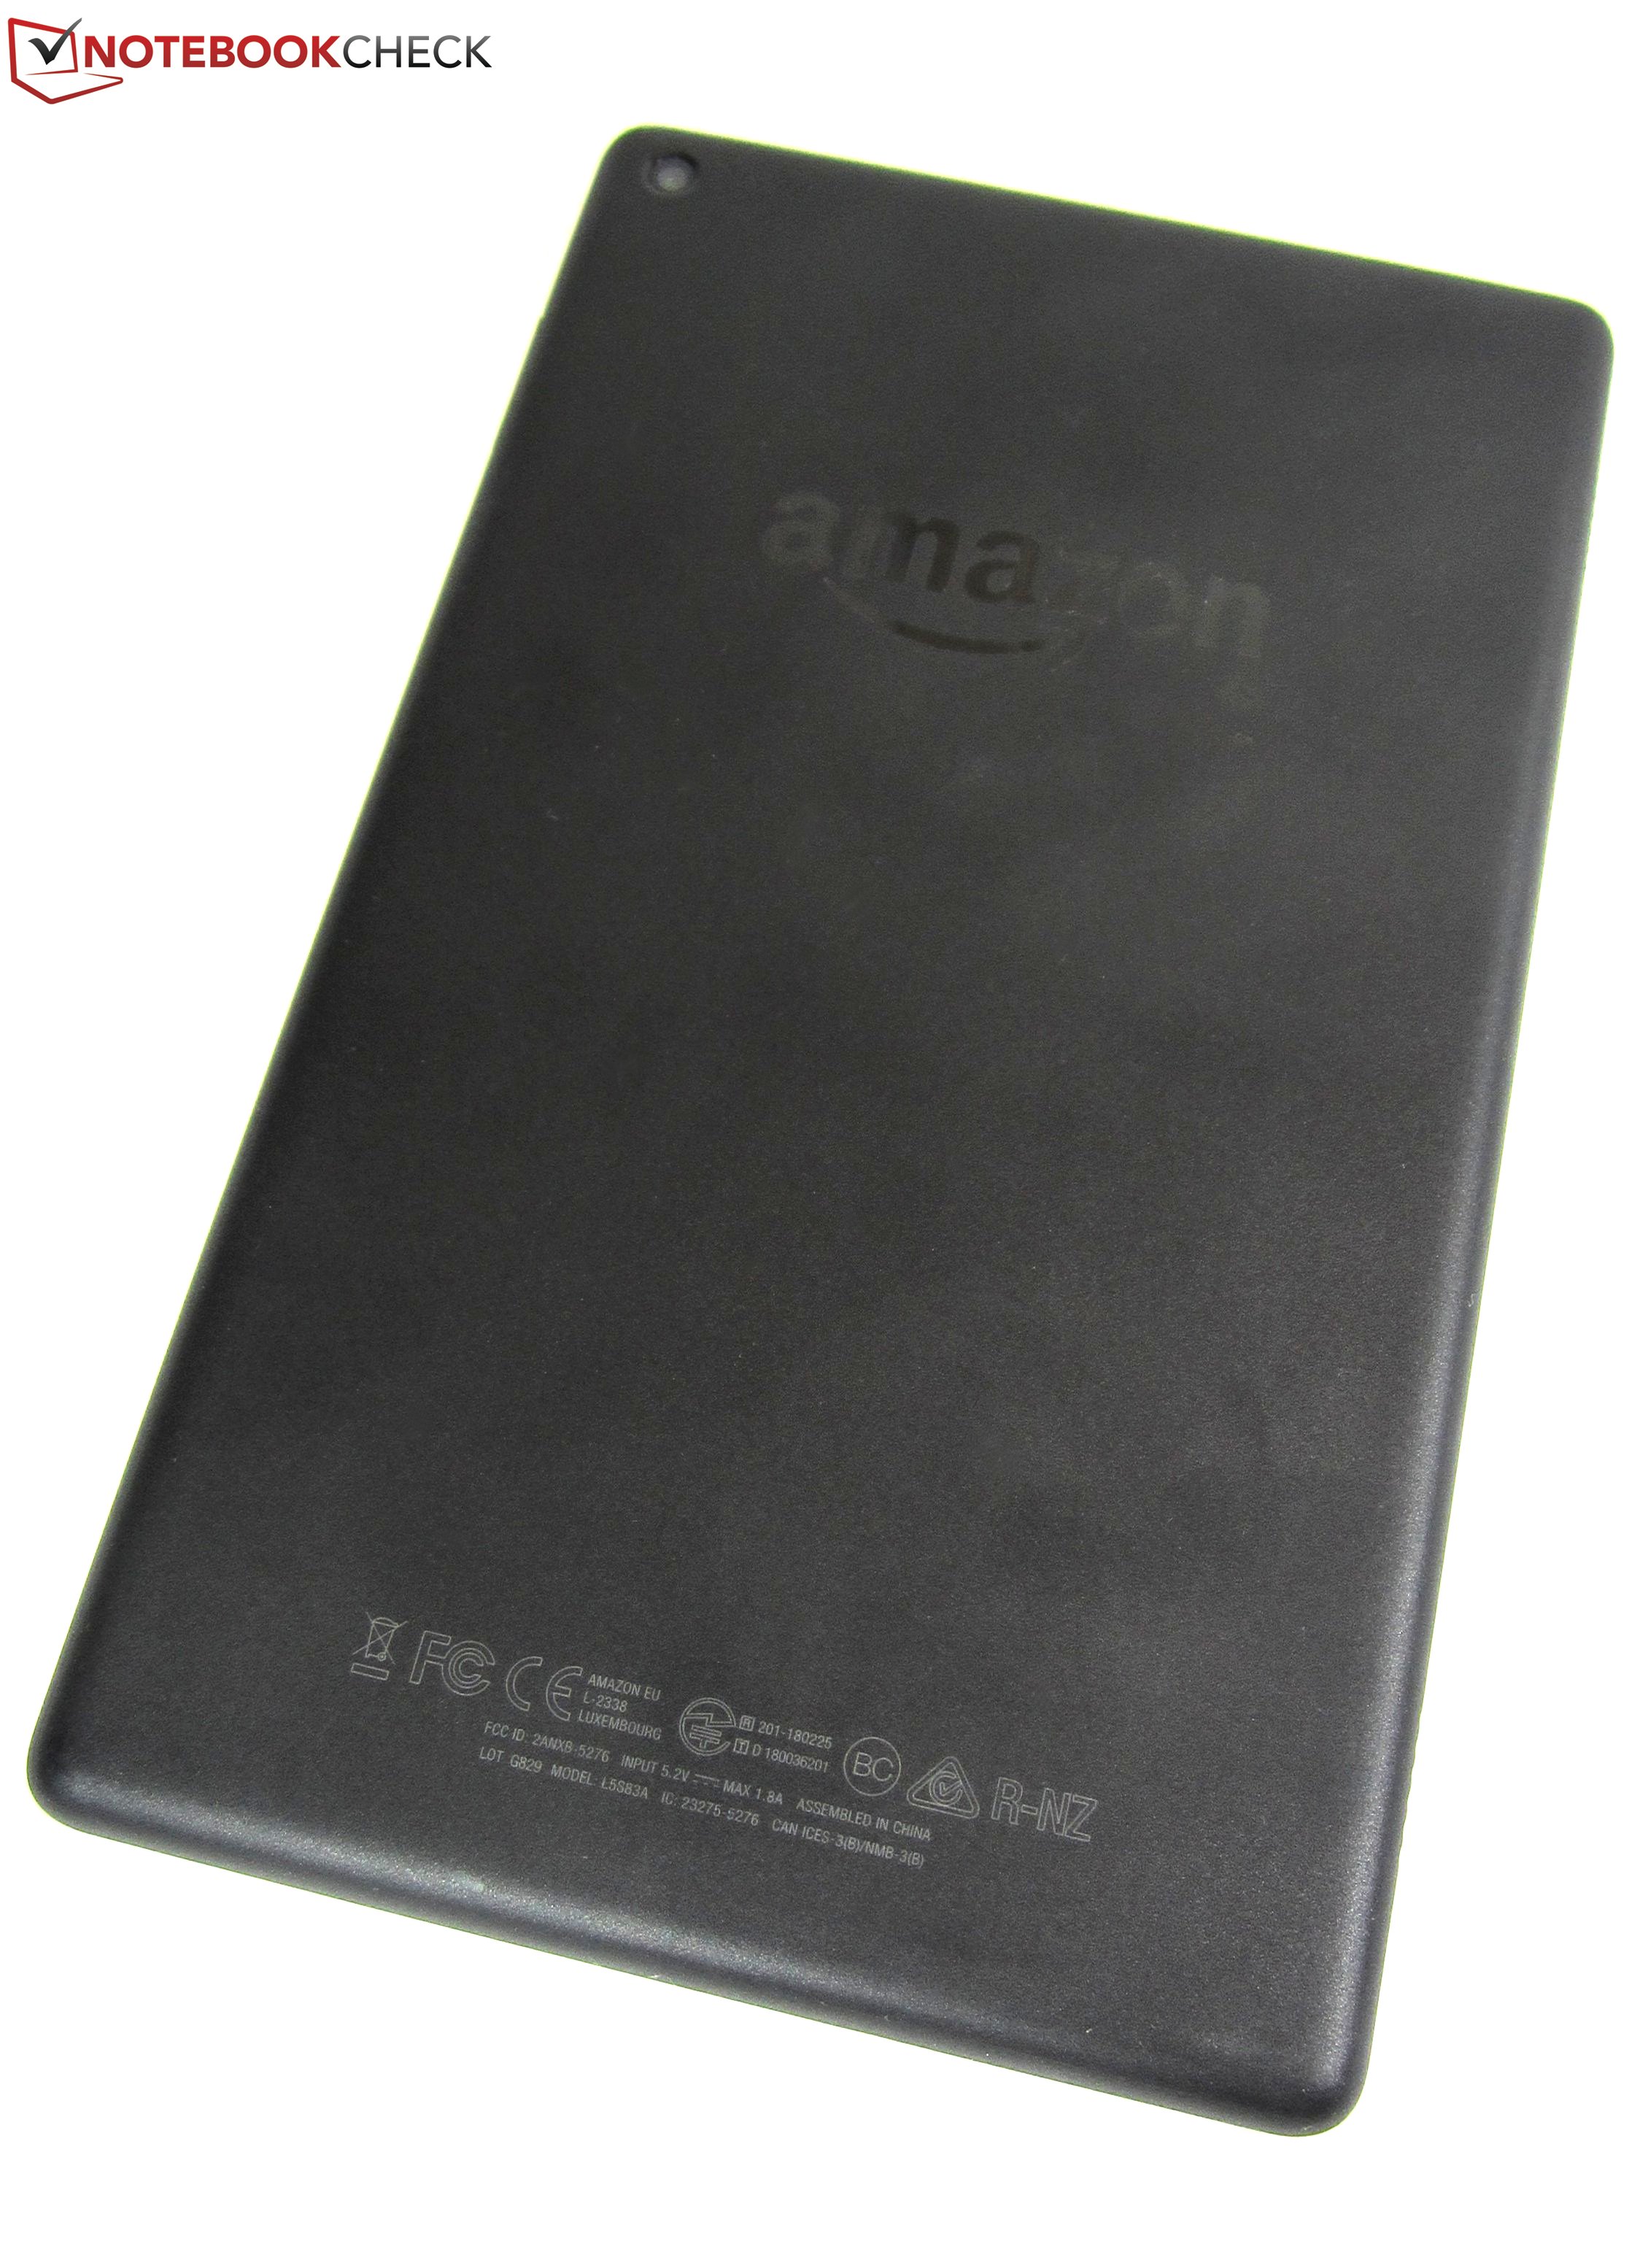
It is no surprise that an $80 tablet is not going to feature the most premium case ever made. However, Amazon has still managed to make a well-built tablet at a low price.
Its slightly roughened back cover feels somewhat grippy, but it is far from being slip-proof. The all-plastic case is available in various colors and features rounded corners and edges around its 1280x800 IPS display. Sturdiness was decent, and we were only able to twist and warp it slightly. The device never creaked and showed just minor bright spots when we applied torsional force.
At 363 g it weighs slightly less than its Fire HD 8 (2017) predecessor (369 g) but remained practically identical in size: 215 x 128 x 9.7 mm versus 214 x 128 x 9.7 mm.
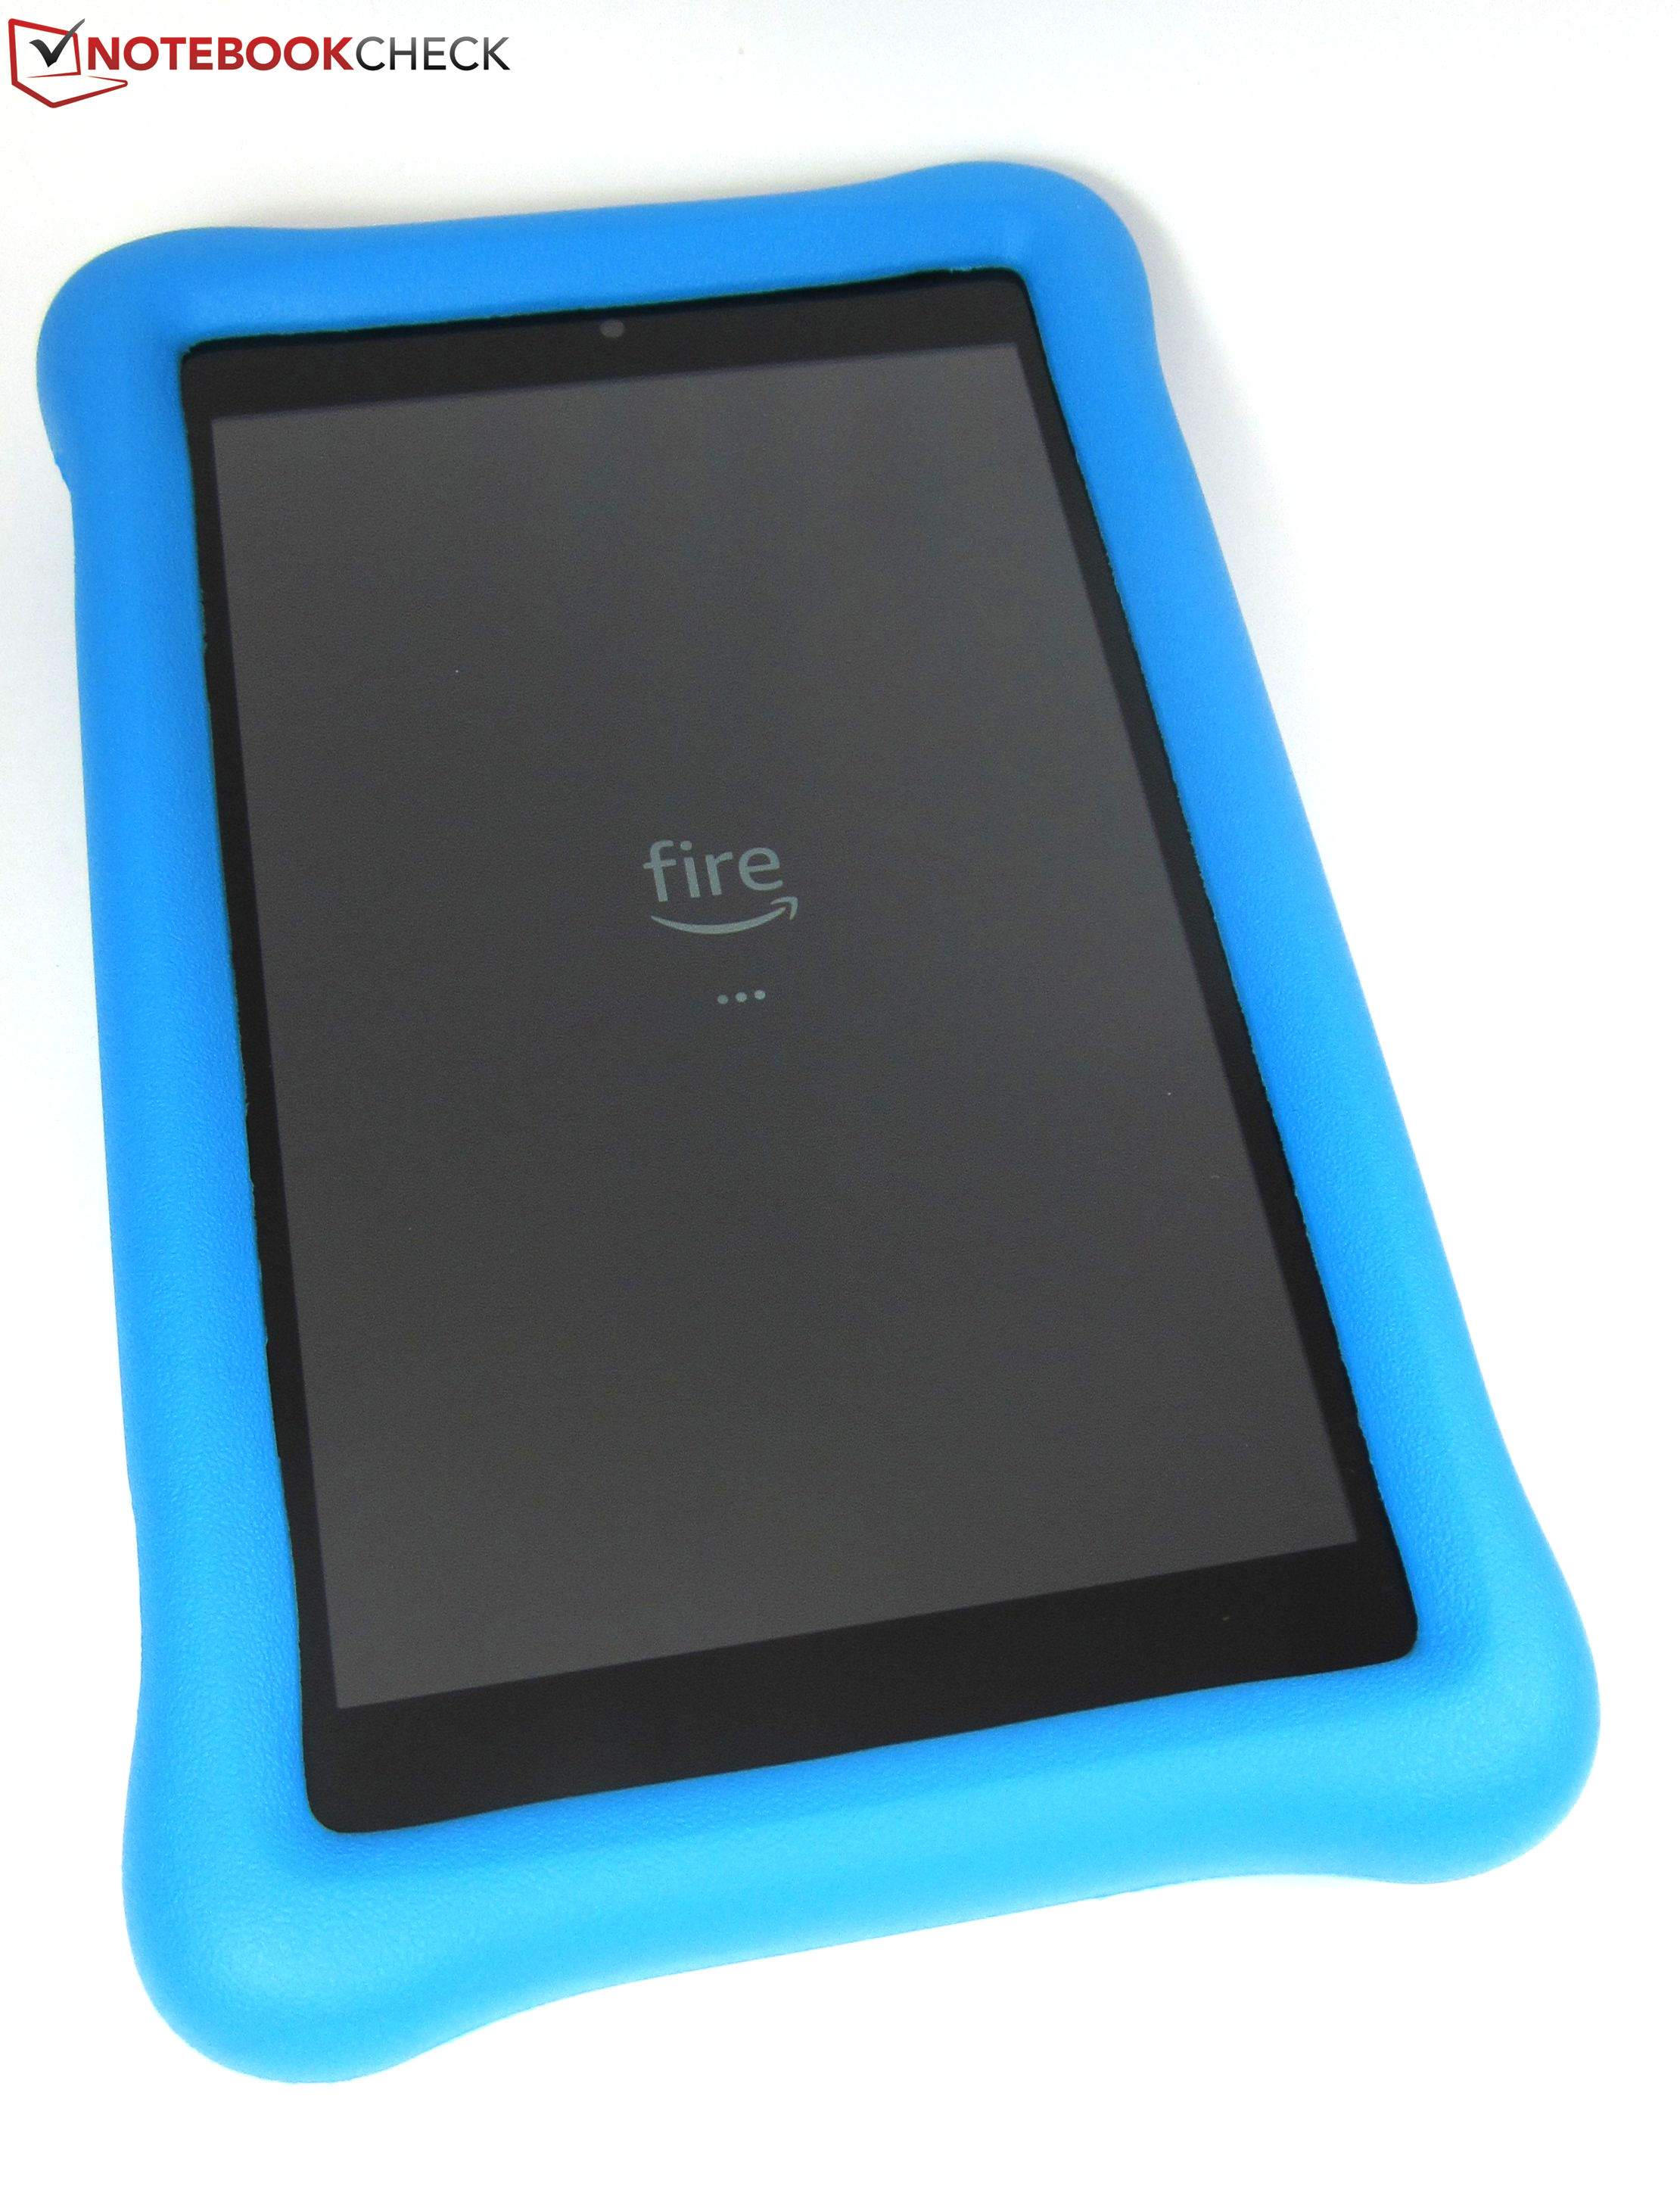
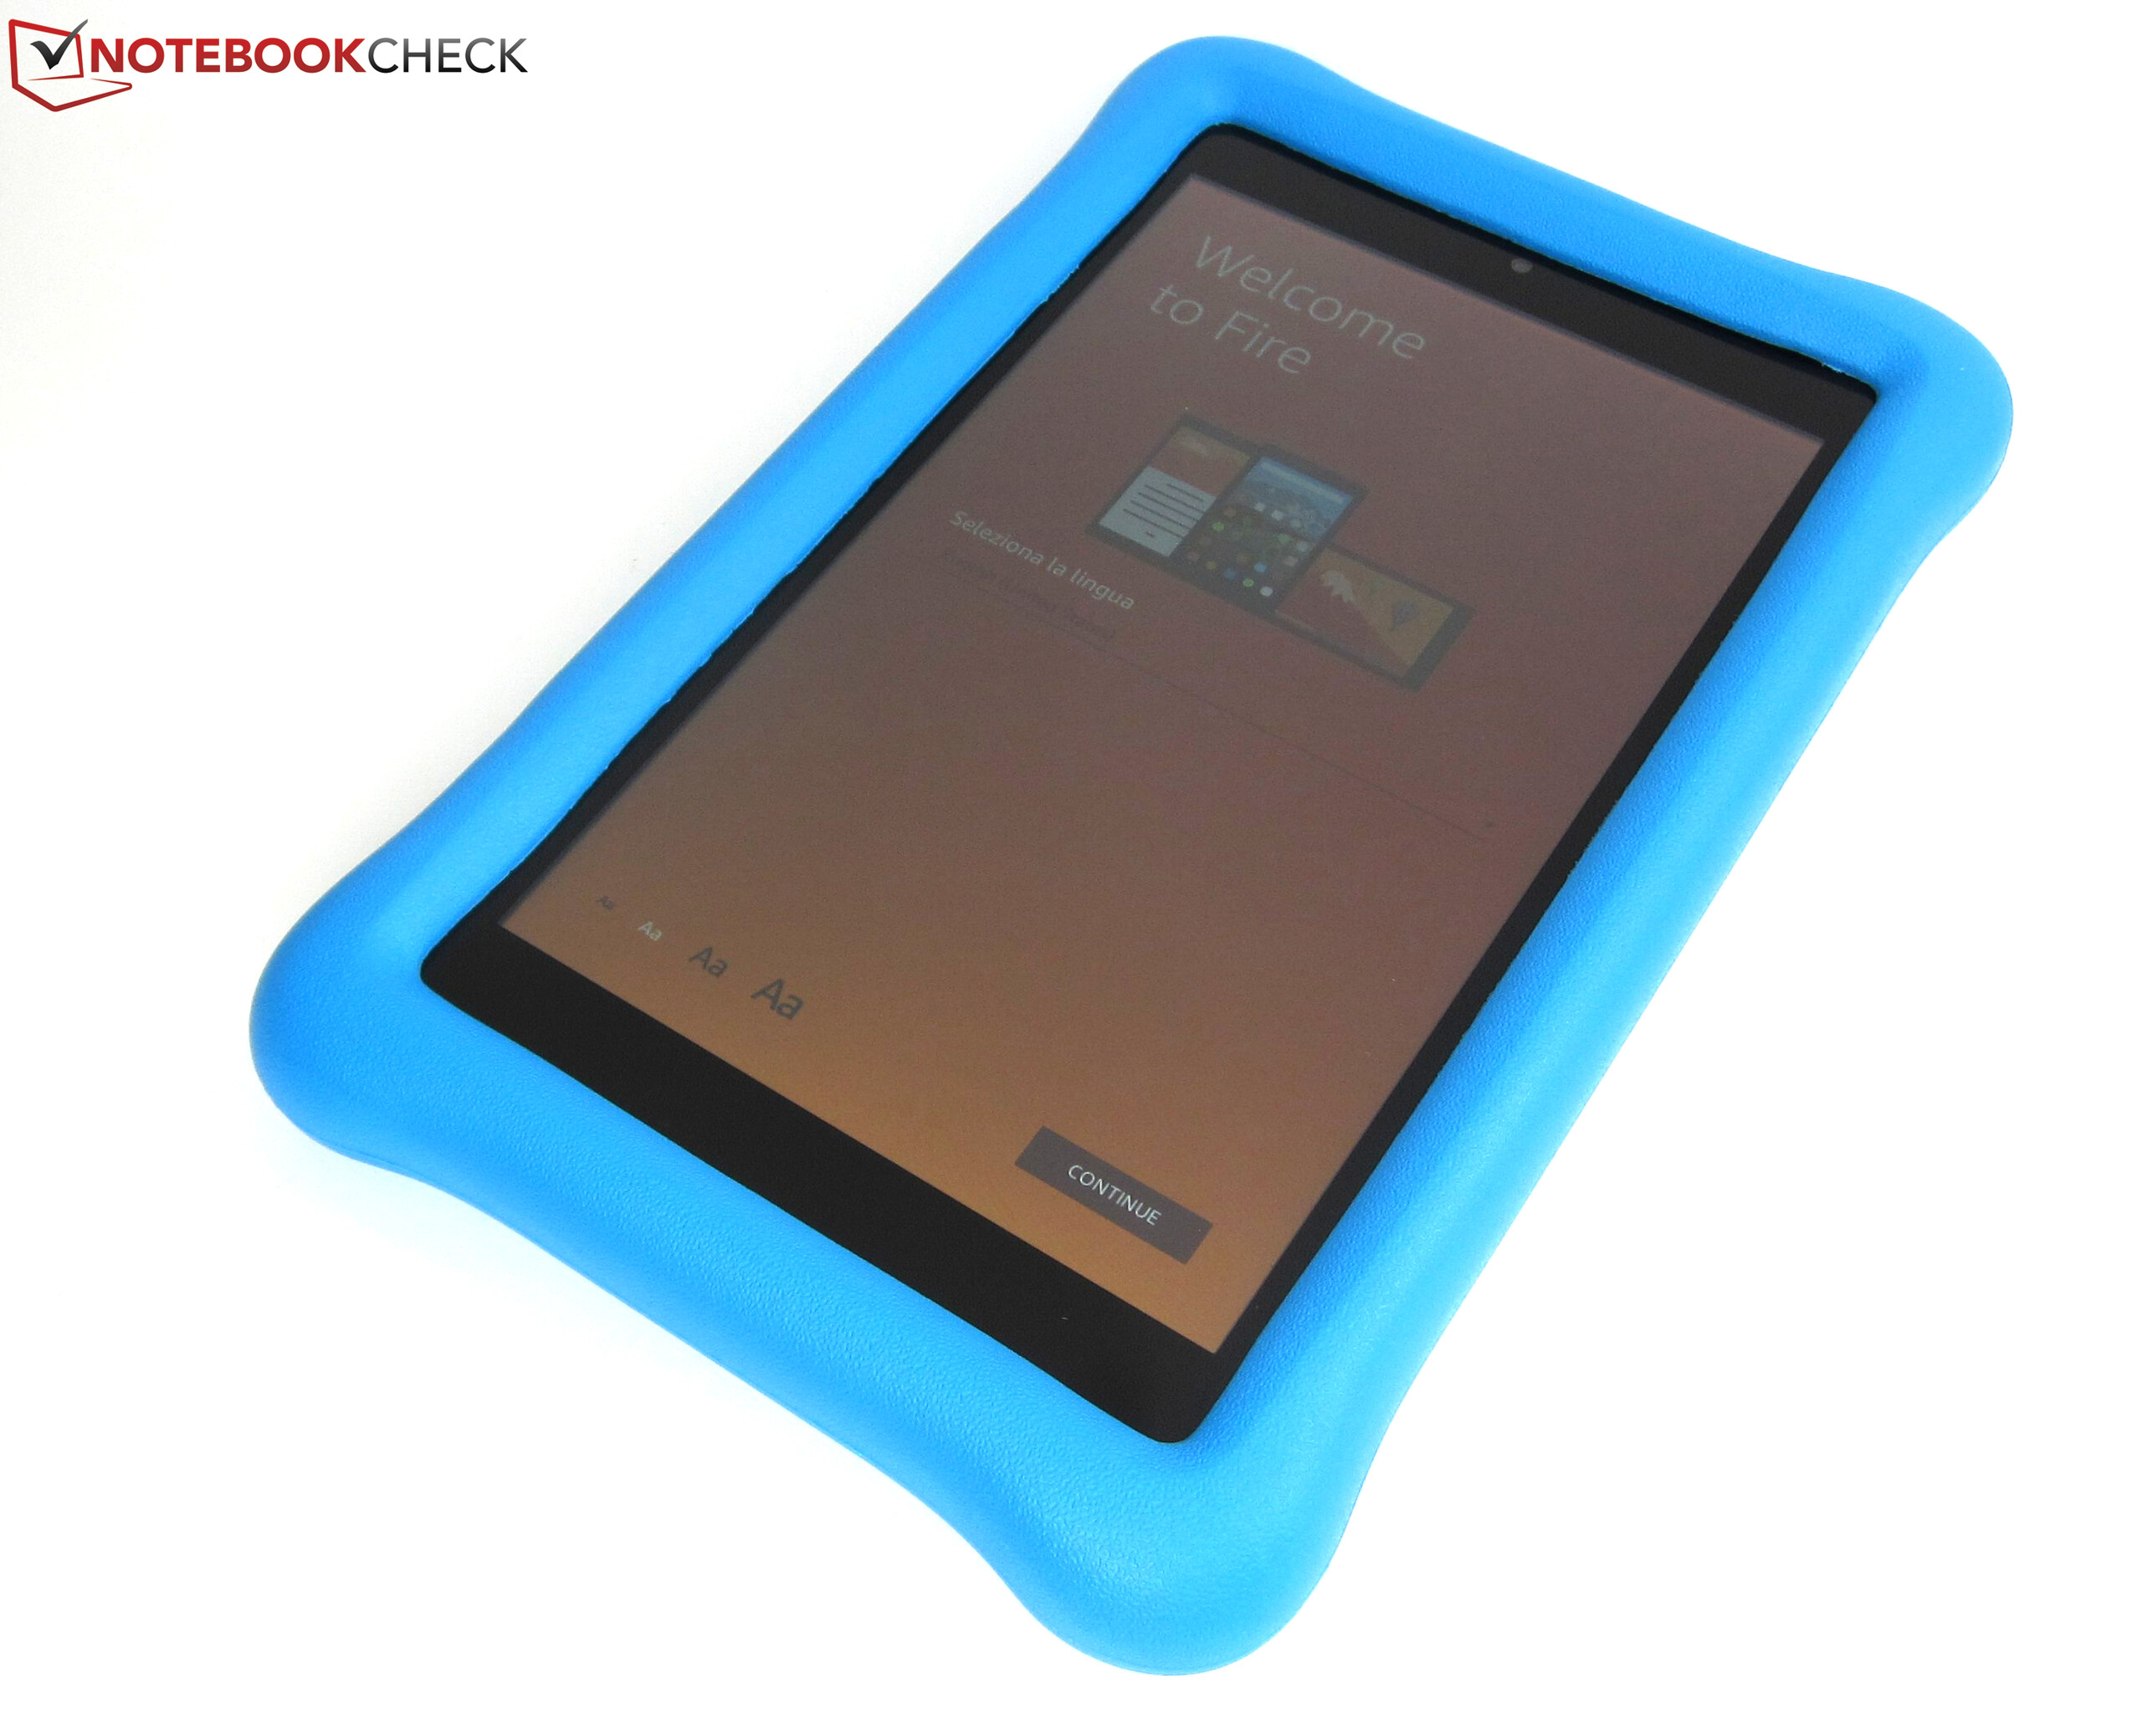
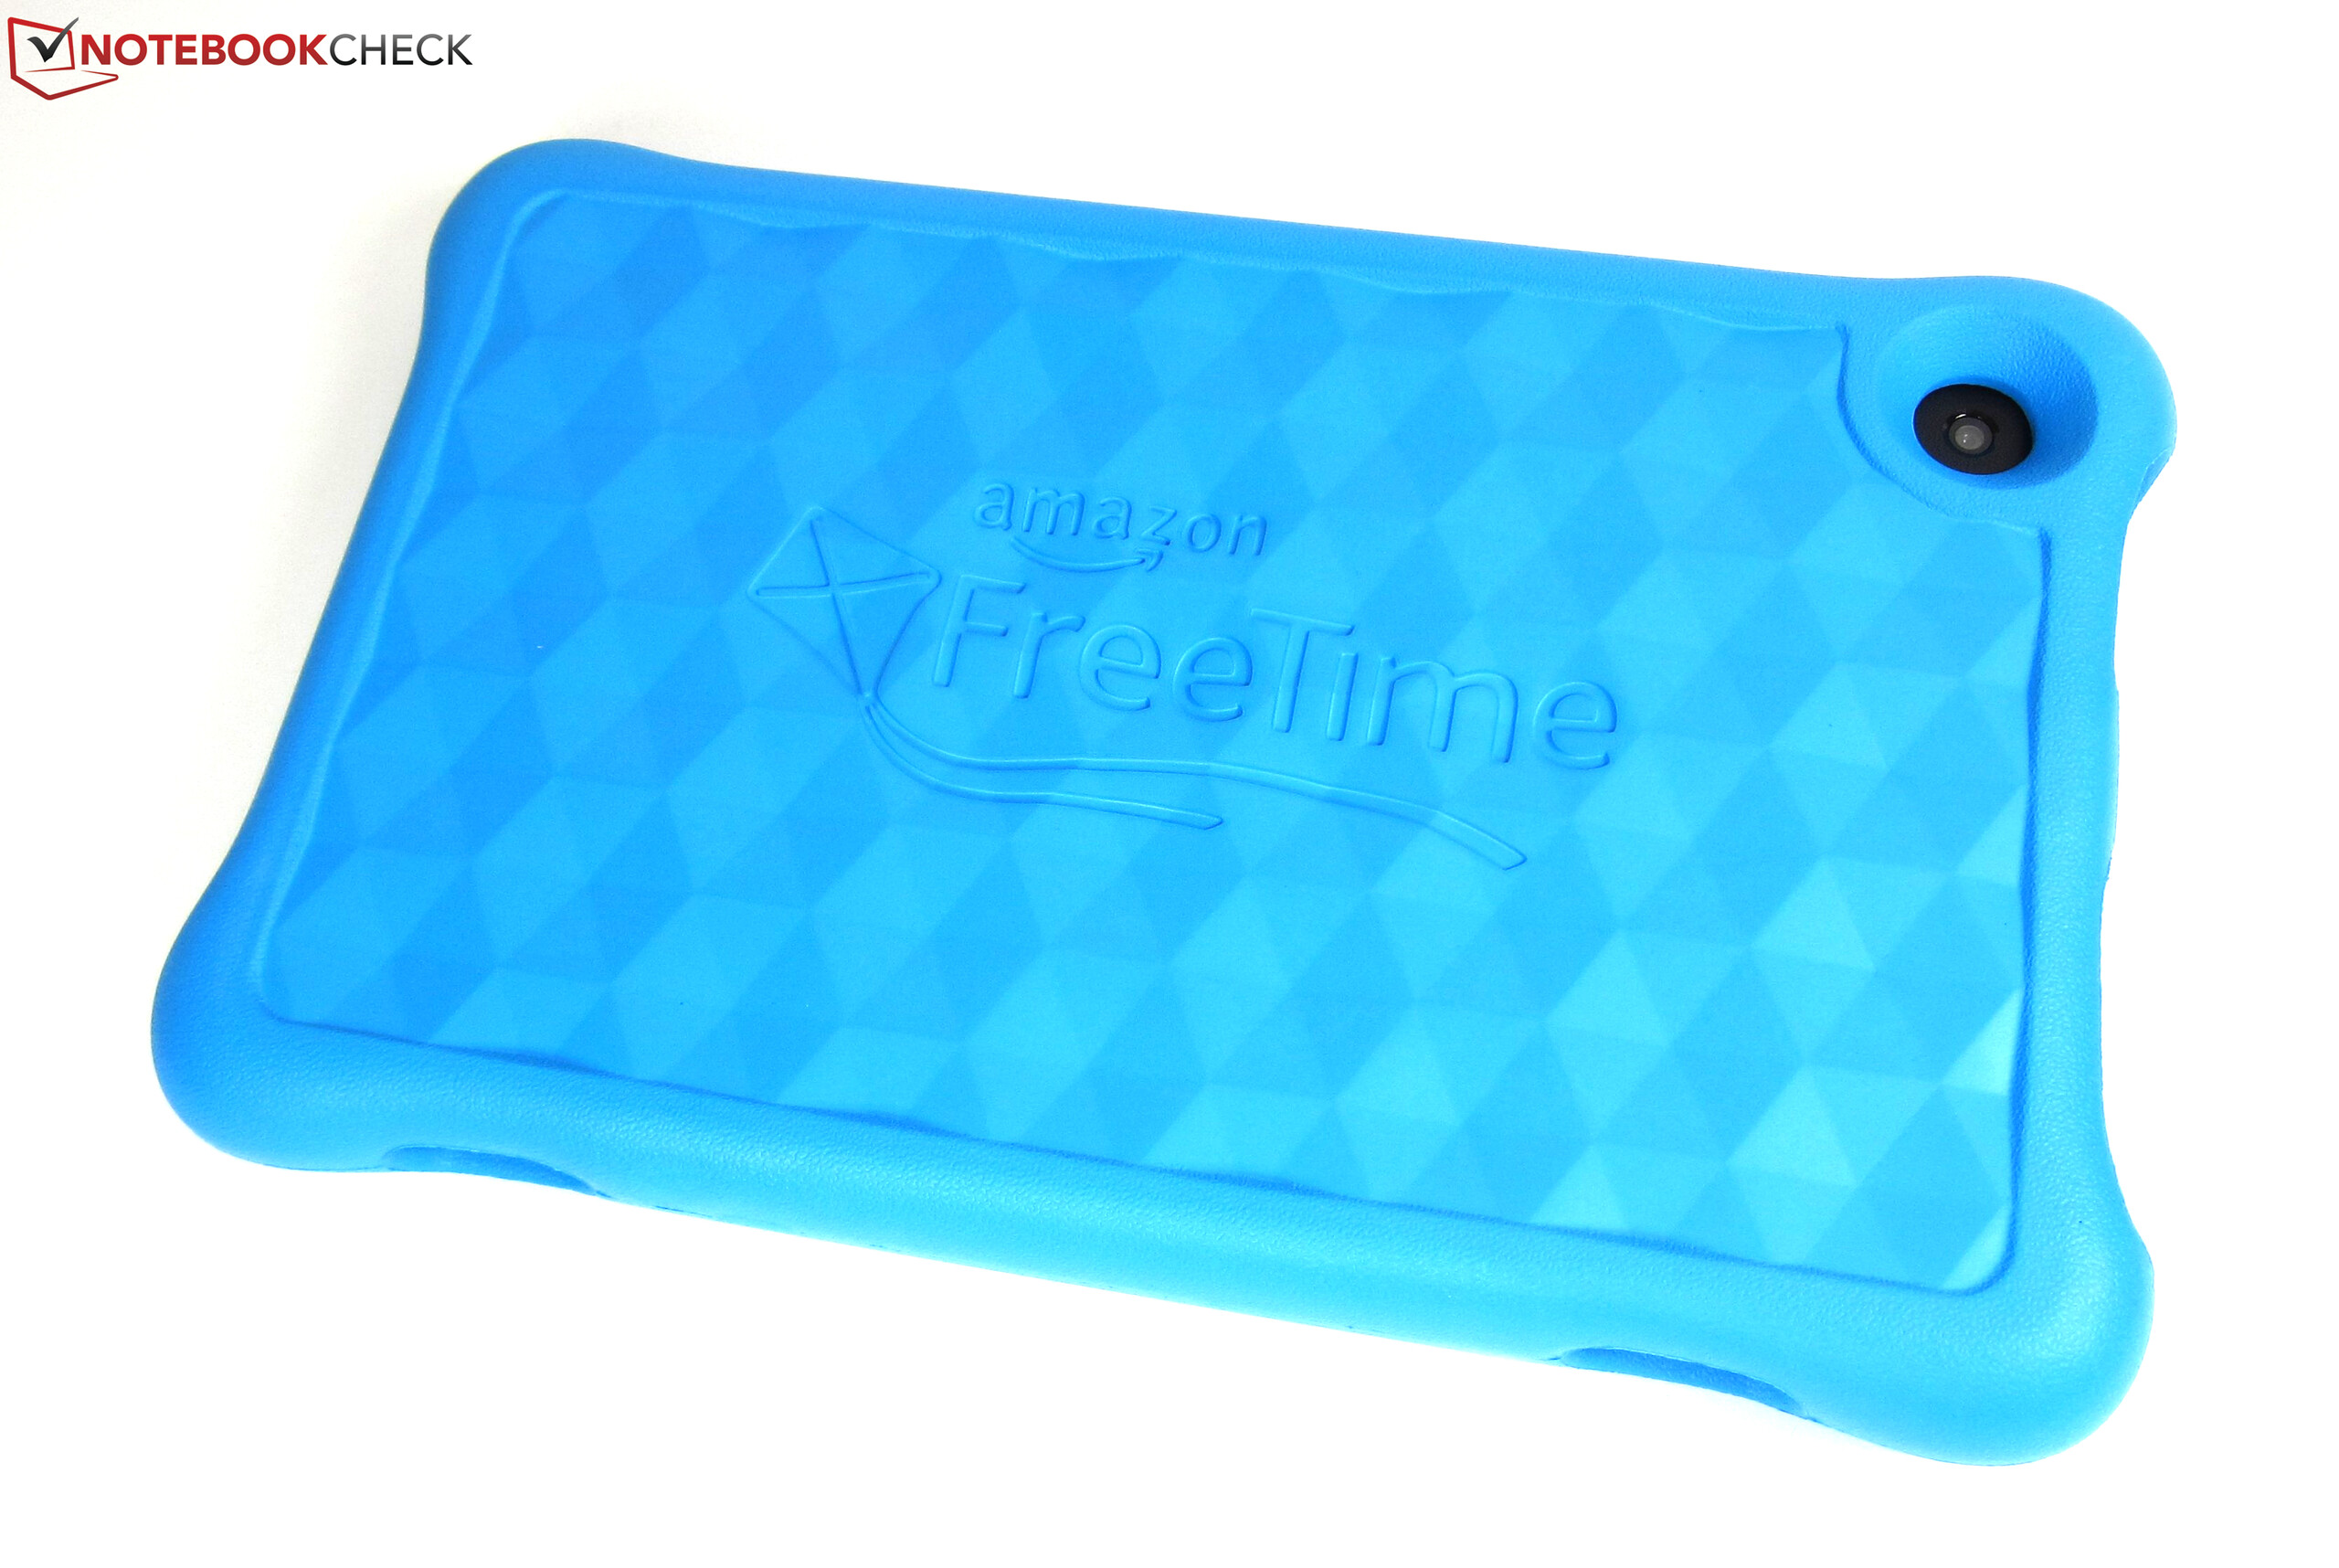
The Kids Edition developed specifically for children is equipped with 32 GB of storage and is protected by a thick either blue or pink plastic shell. Otherwise, it is identical to the Fire HD 8 (2018). The thick protective shell makes it easier to hold and much sturdier when dropped. It also comes with a two-year worry-free guarantee: If your kids manage to break it Amazon is going to replace it for free - no questions asked.
Connectivity
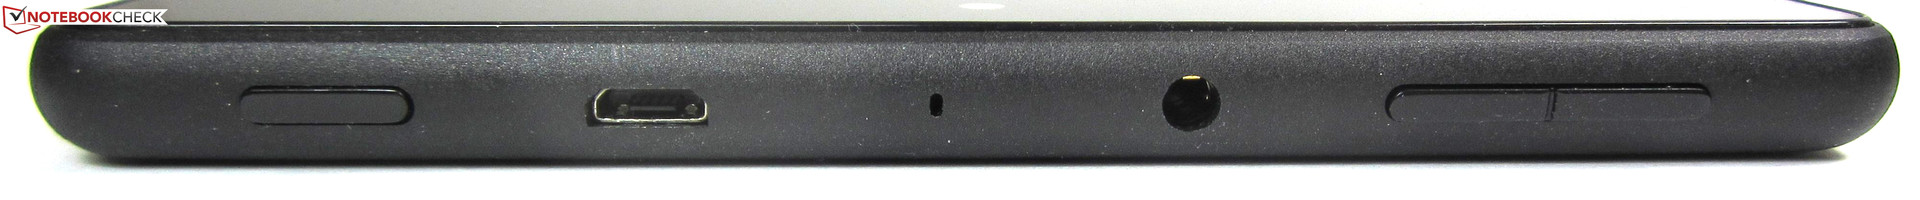
The Fire HD 8 (2018) is equipped with a MediaTek MT8163 quad-core SoC, an ARM Mali-T720 GPU, and 1.5 GB of RAM. Accordingly, it should be fast enough for everyday tasks and challenges. Unfortunately, it still lacks modern features like a GPS module, fast 802.11 ac Wi-Fi, or a USB-C port. Instead, its Wi-Fi modem supports just dual-band 802.11 b/g/n, and it is charged via a MicroUSB 2.0 port. The stereo speakers have remained identical as well and continue to support Dolby Atmos.
Hardware upgrades to last year’s model include a new front-facing 2 MP (1600x1200) camera, which is a significant step up from the previous 0.3 MP VGA camera (640x480), support for microSD cards of up to 400 GB (up from 256 GB), and a dedicated DSP in order to enable hands-free Alexa support when the tablet is neither plugged in nor in active use.
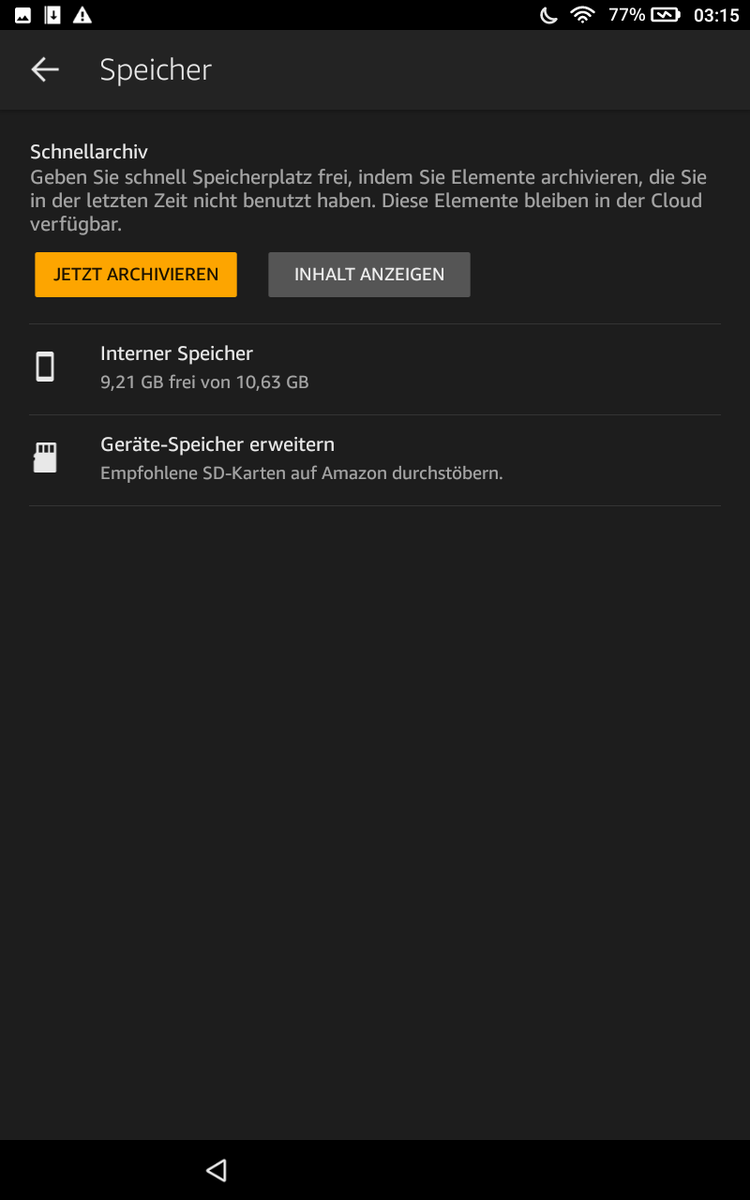
In addition to media files, the microSD storage can also be used for storing applications. Considering the meager 16 GB of storage on the base model (9.2 GB available out of the box) this is not just nice to have but is an absolute necessity. Alternatively, the Fire HD 8 is also available with 32 GB of internal storage space. The tablet supports the exFAT file system for external microSD media - a feature not commonly found on affordable tablets due to the licensing costs associated with it.
Both the 16 and 32 GB editions can be purchased either with or without “special offers” - a euphemism for ads. The cheaper, ad-supported edition has its ads embedded into the lock screen. Bundles including the optional Show Mode charging dock are also available. For further details see below.


Software
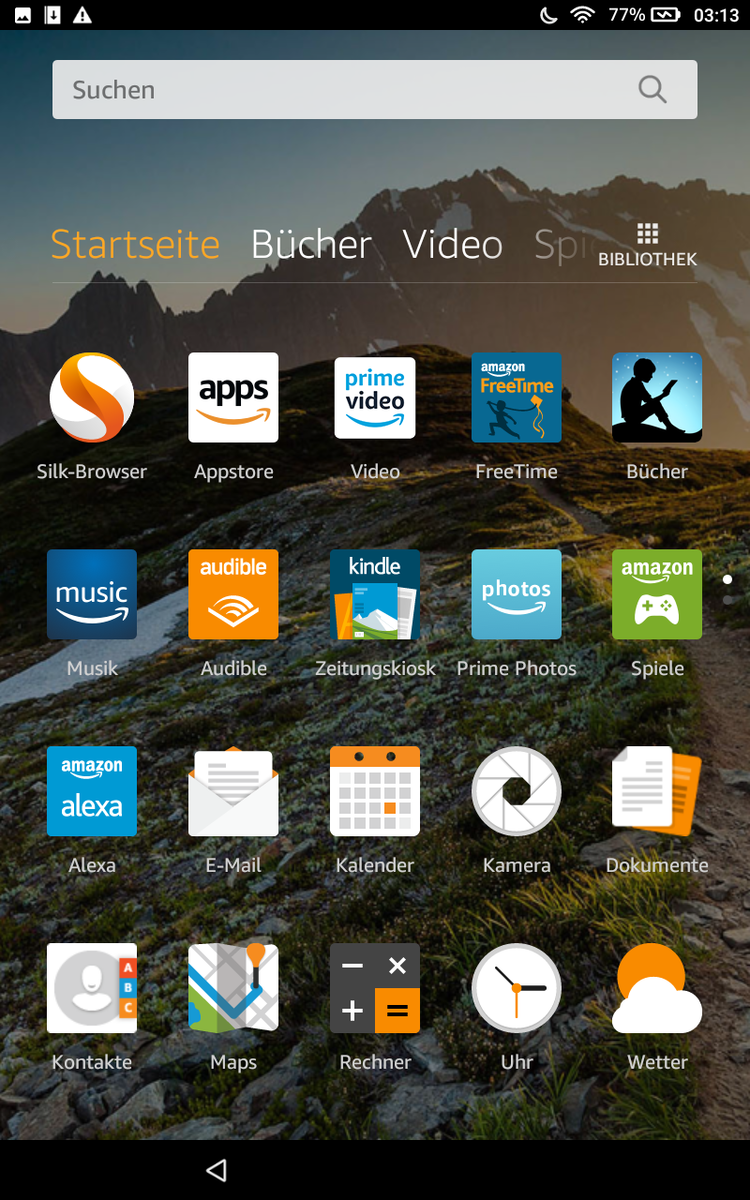
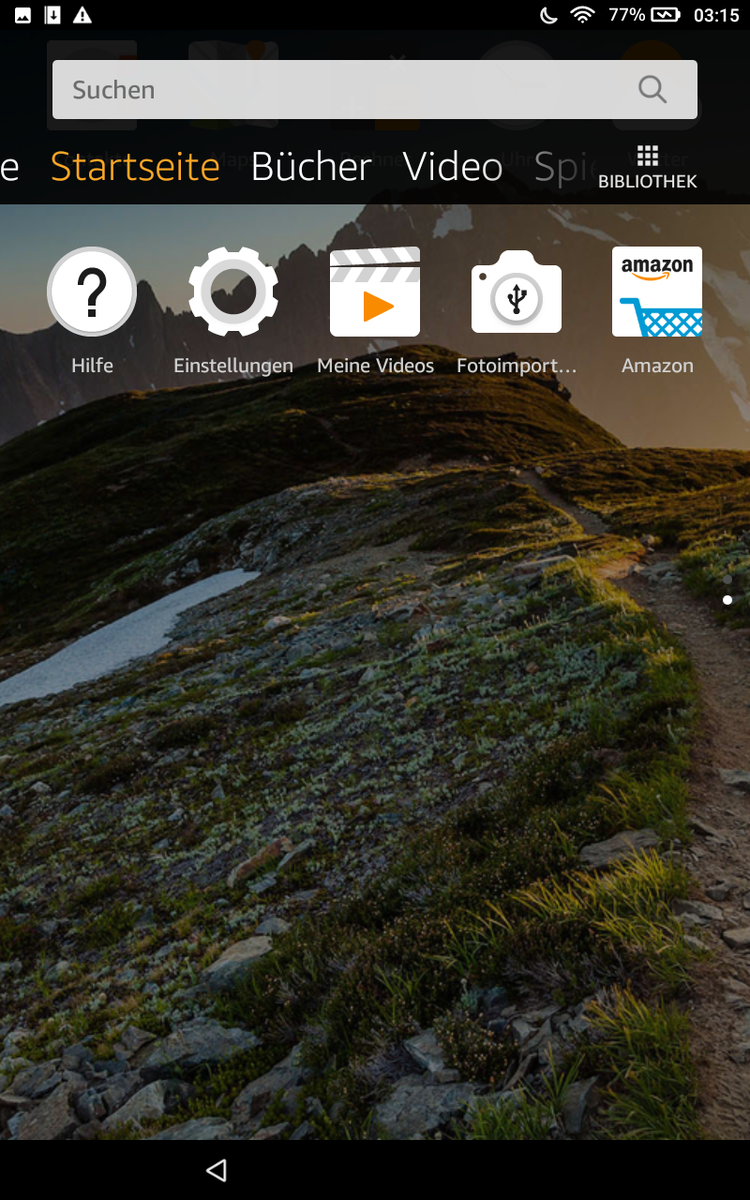
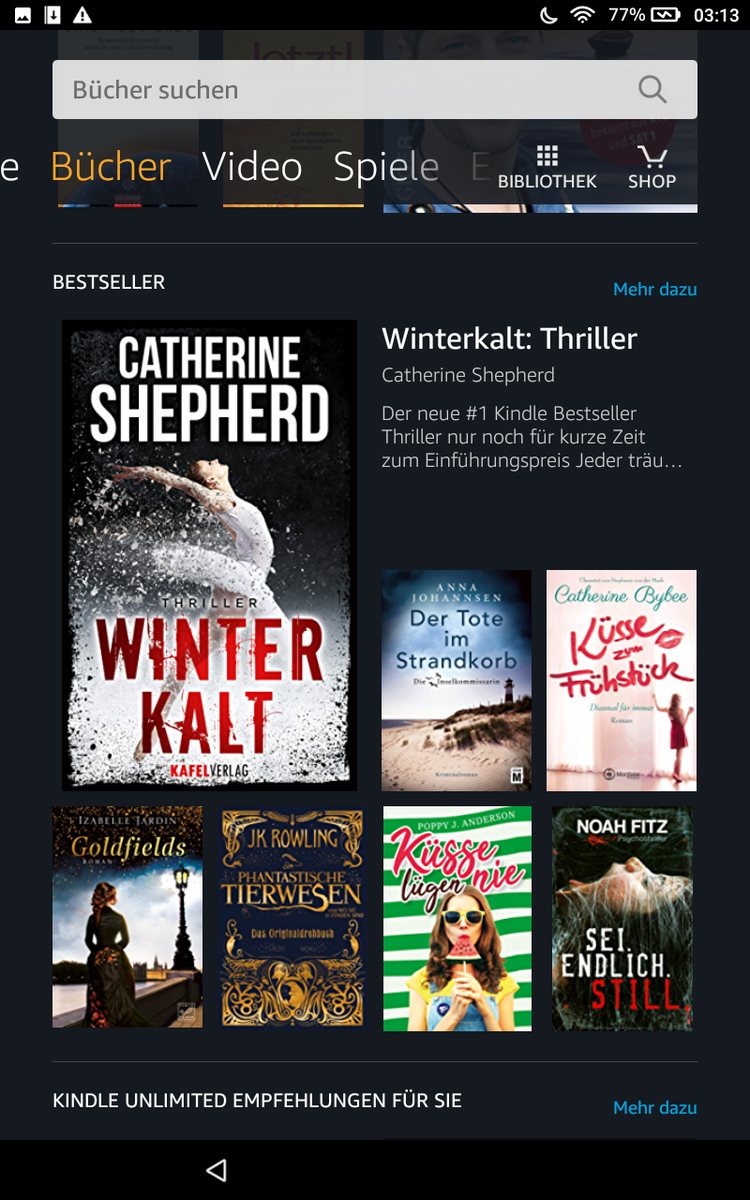
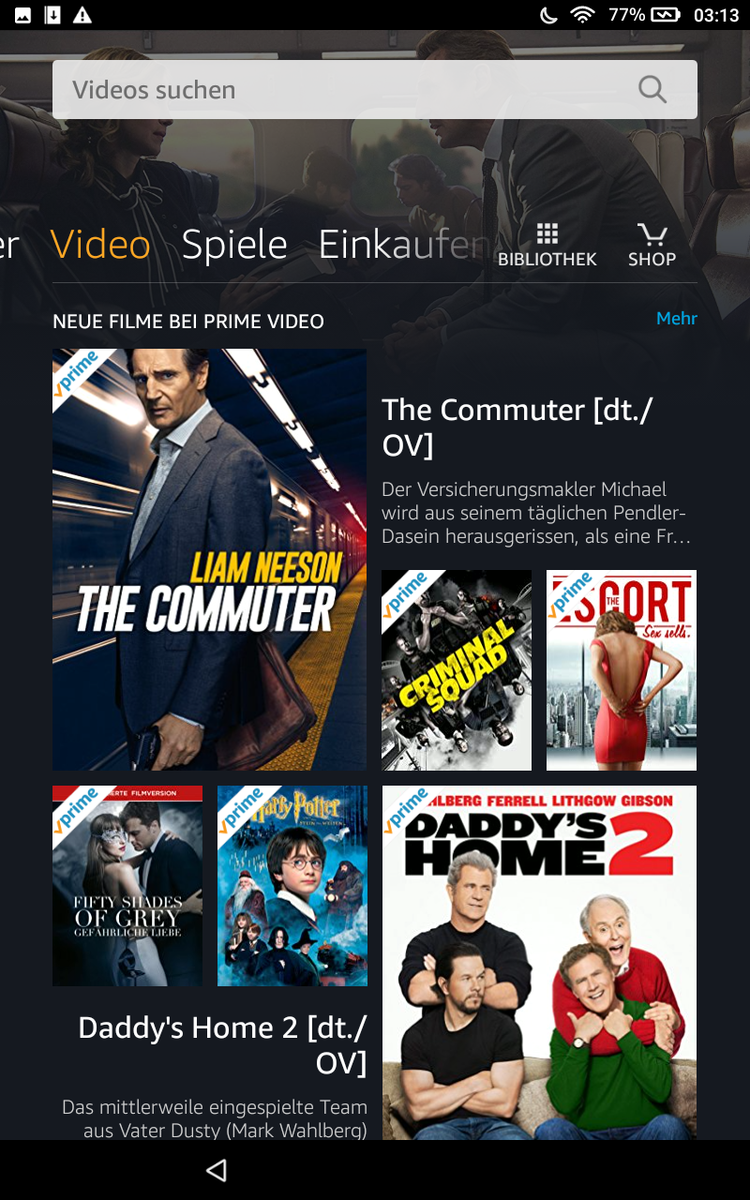
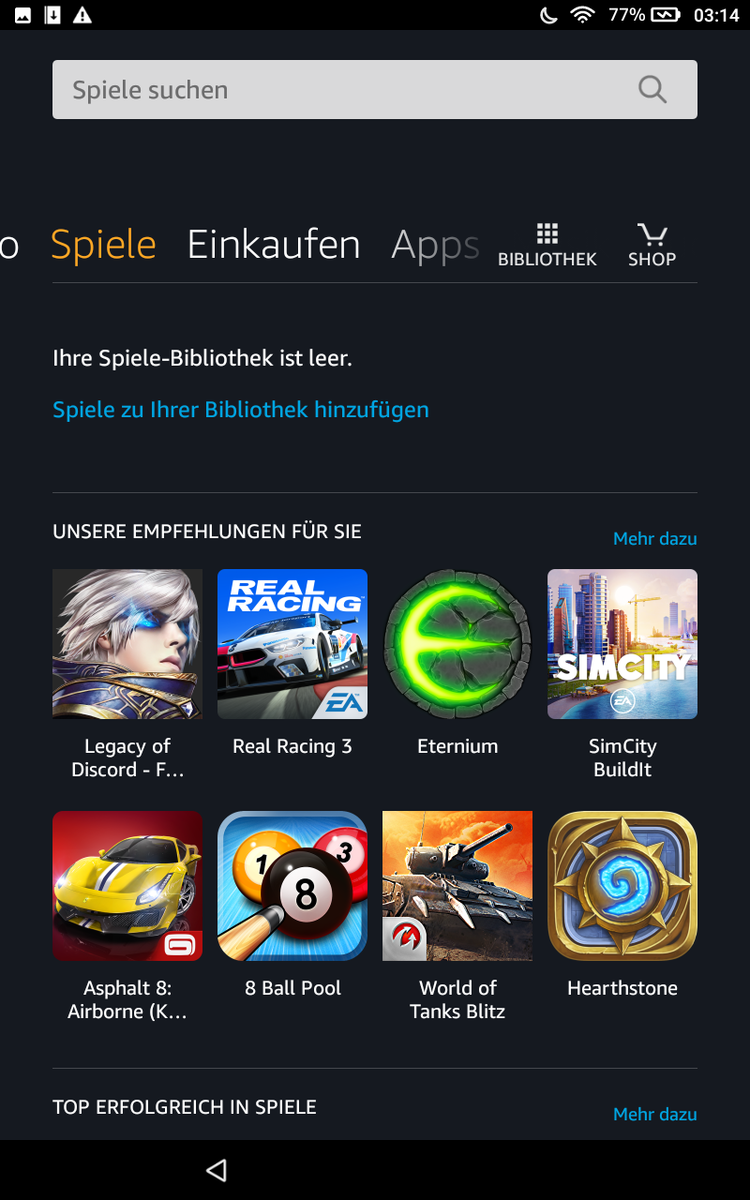
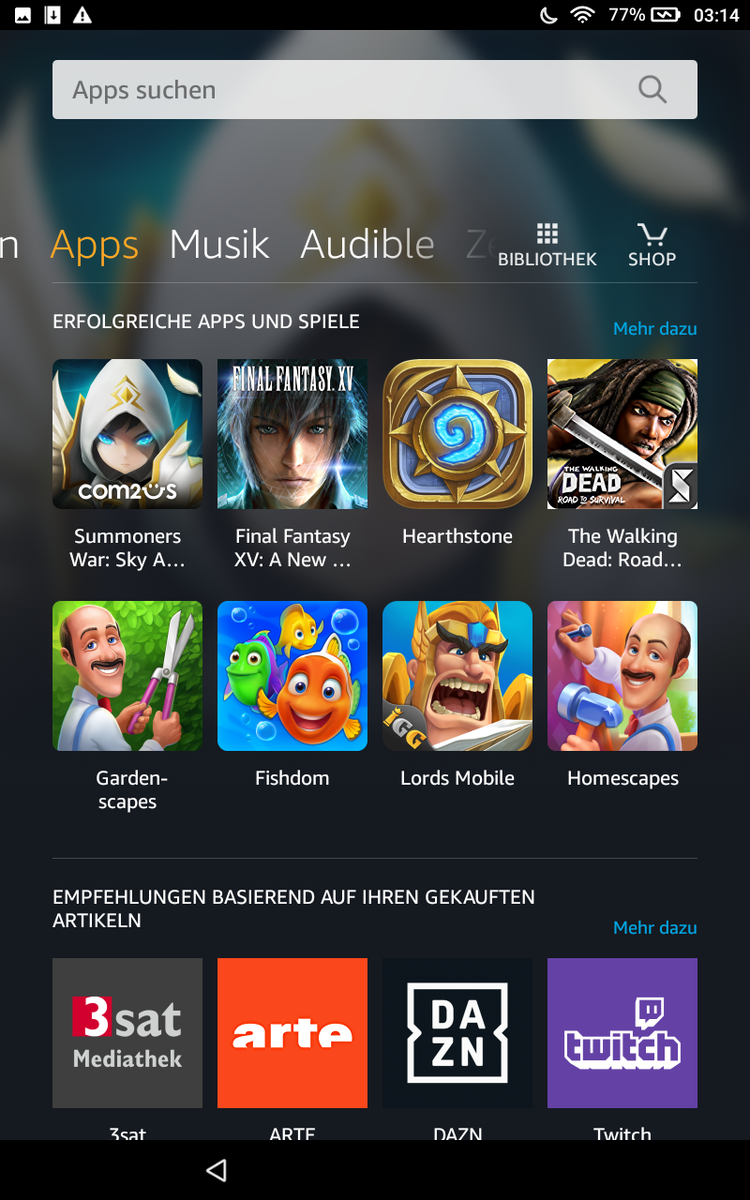
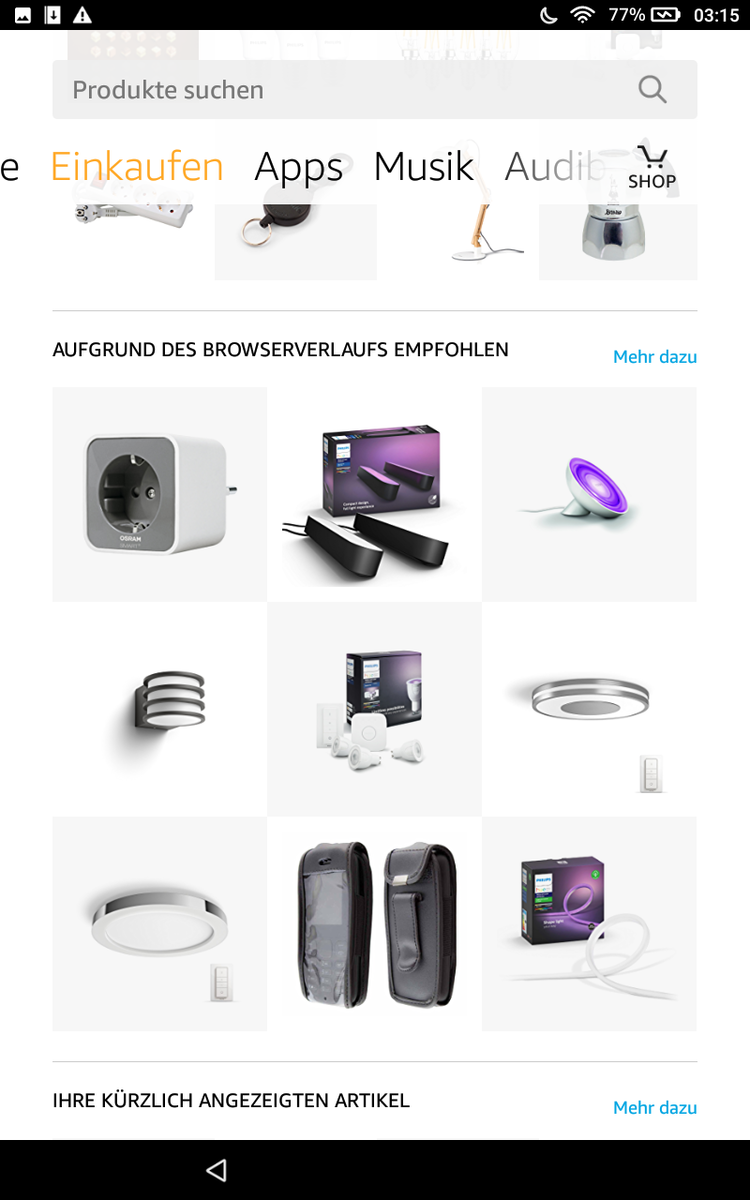
While the underlying operating system is Android 7 Nougat, Amazon’s Fire OS is a heavily skinned and modified version thereof. The bottom line is that the entire user interface has been optimized for a pleasant and enjoyable Amazon shopping experience. Accordingly, the home screen is just one tab among many. The other tabs represent Amazon’s various shopping categories - books, video, games, apps, and music. An Amazon account is not just optional but mandatory - when first booting up the Fire HD 8 (2018) you need to either login with an existing account or create a new one.
The shopping experience is now enhanced by Amazon’s Alexa voice assistant. It supports a hands-free activation phrase, such as “Alexa” or “Amazon”, in order to start up and listen.
By default, the tablet does not come with Google’s Play Store and is limited to Amazon’s own app store. However, the former can be retroactively installed. That being said, we have to add that installing Google’s Play Store voids your warranty because according to Amazon installing the Play Store constitutes improper use.
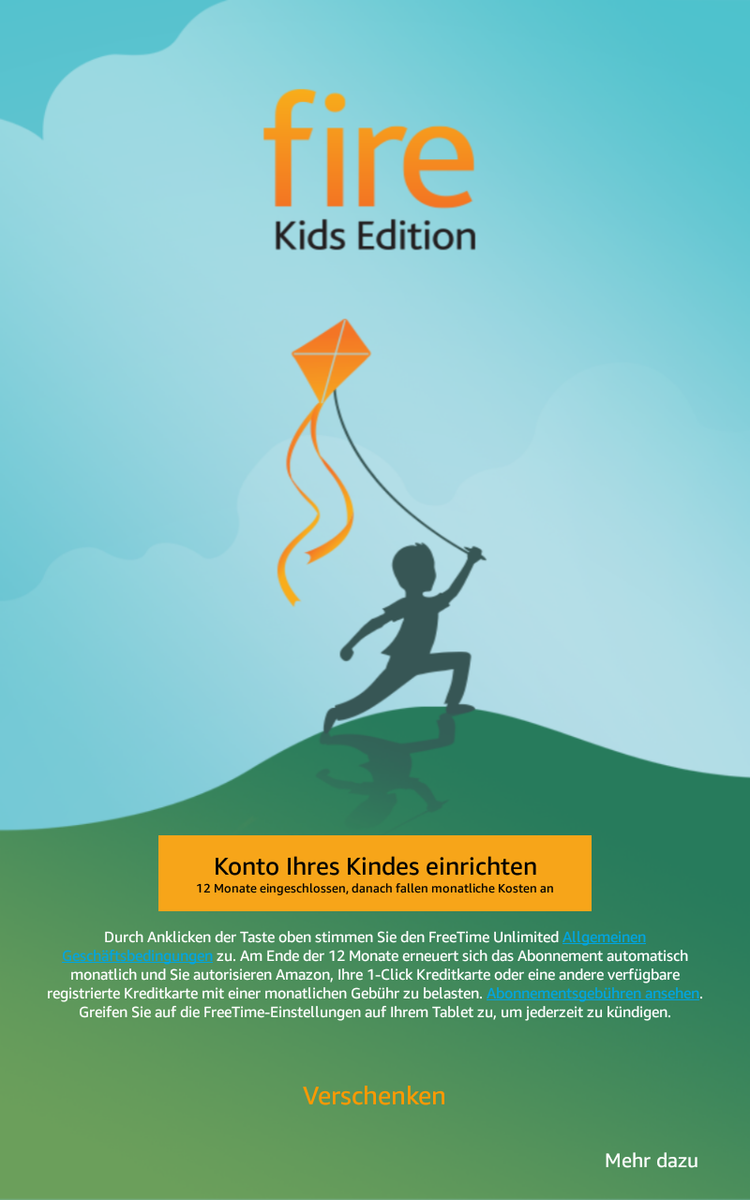
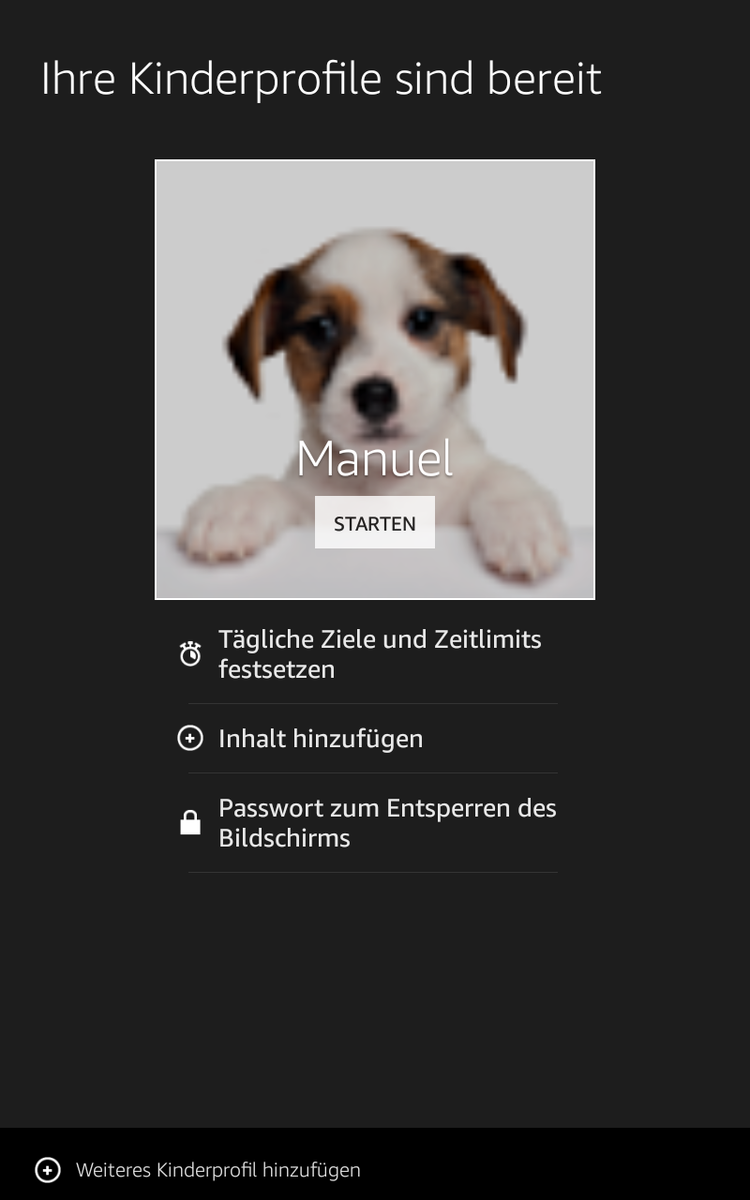
The Kids Edition differs from the regular model in that it is not an Amazon shopping front-end but is a gaming and learning platform instead. Included with every Fire HD 8 Kids Edition is a free one-year Amazon FreeTime Unlimited subscription with access to more than 5,000 child-friendly books, videos, apps, and games.
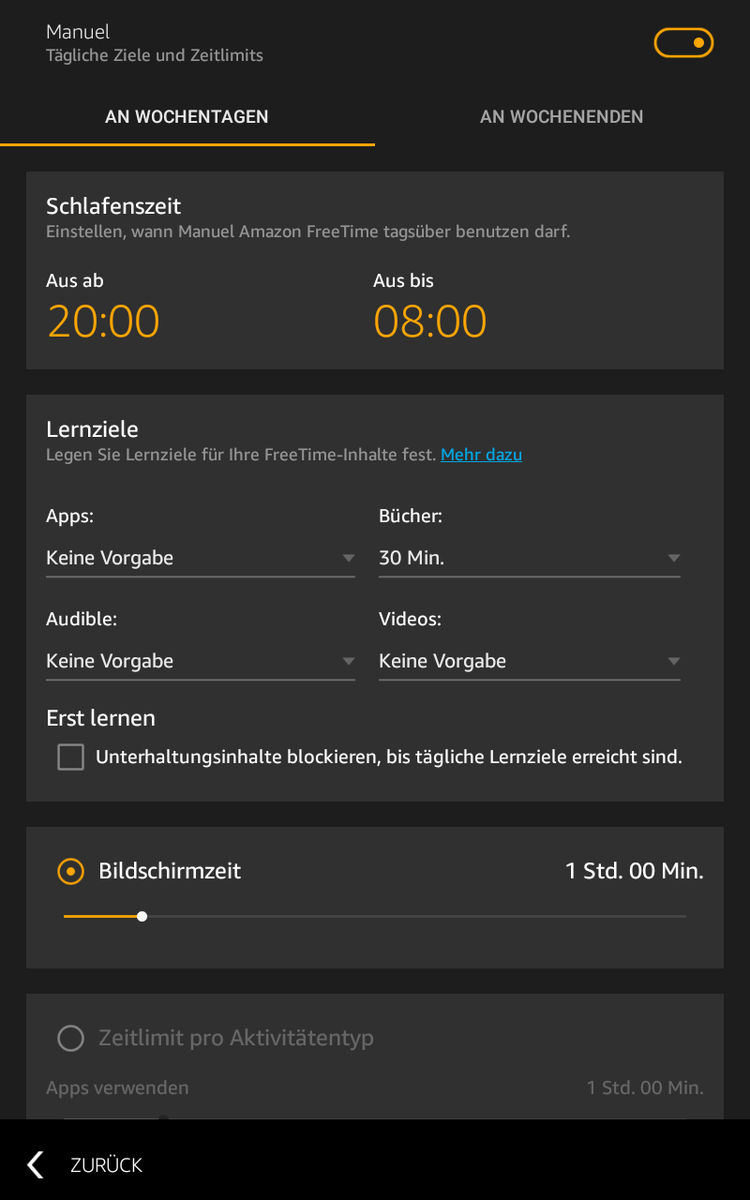
Parents have the ability to child-proof the software and limit usage to certain hours of the day as well as certain types of content. The presets can be individually adjusted to your liking and support user profiles for up to four different children, each with its individual contents and usage patterns. Without a Wi-Fi connection the tablet is limited to whatever content has been downloaded for each specific profile.
Communication and GPS
Wireless communication support includes 802.11 a/b/g/n in 2.4 and 5 GHz networks.
Connected to our Linksys EA8500 reference router the Fire HD 8 (2018) achieved RX and TX data rates of around 100 Mb/s. A respectable result for an 802.11 n device; however, it pales in comparison with its competitors. For example, the Xiaomi Mi Pad 4 was up to 4x faster and the Huawei MediaPad M5 8.4 was around twice as fast.
Due to the lack of a GPS module the Fire HD 8 (2018) does not support any location services at all.
| Networking | |
| iperf3 transmit AX12 | |
| Xiaomi Mi Pad 4 | |
| Huawei MediaPad M5 8.4 | |
| Amazon Fire HD 8 2018 | |
| Amazon Fire HD 8 2017 | |
| iperf3 receive AX12 | |
| Xiaomi Mi Pad 4 | |
| Huawei MediaPad M5 8.4 | |
| Amazon Fire HD 8 2018 | |
| Amazon Fire HD 8 2017 | |
Cameras

Both cameras on Amazon’s Fire HD 8 (2018) feature a 2 MP sensor with a resolution of 1600x1200. Videos are captured in 720p at 30 FPS. Overall configurability is pretty limited. For videos, you can configure resolution, geo-tagging, and manual exposure. For photos, you can also set an autotimer and configure HDR.
The cameras turned out to be somewhat usable with popping colors in bright daylight (see scenes 1 and 2). However, the photos lacked detail even on the brightest of bright days, and far away objects quickly faded into pixel mush due to the sensor’s low resolution. Poor lighting conditions are too much to ask for, as can clearly be seen in scene 3.


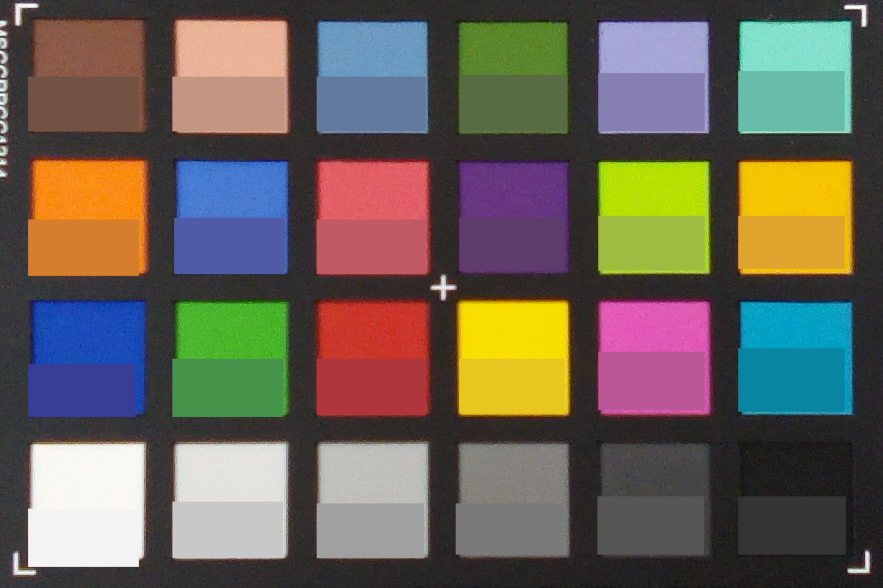
Like all cameras, we also tested the Fire HD 8 (2018)’s cameras under normalized lighting conditions in our lab. The photos have not been edited retroactively.
As can be seen on the ColorChecker reference card colors and grays are slightly overexposed rendering photos somewhat unnatural but also livelier. Considering the camera’s small sensor, focus was also more than decent albeit with plenty of added noise.

Accessories and Warranty

The Fire HD 8 (2018) comes with a modular power supply (5.25 V, 1 A), a USB cable (Type-A to Micro-B), and a quick-start guide. By default, warranty is limited to 12 months. Please see our Guarantees, Return policies and Warranties FAQ for country-specific information.
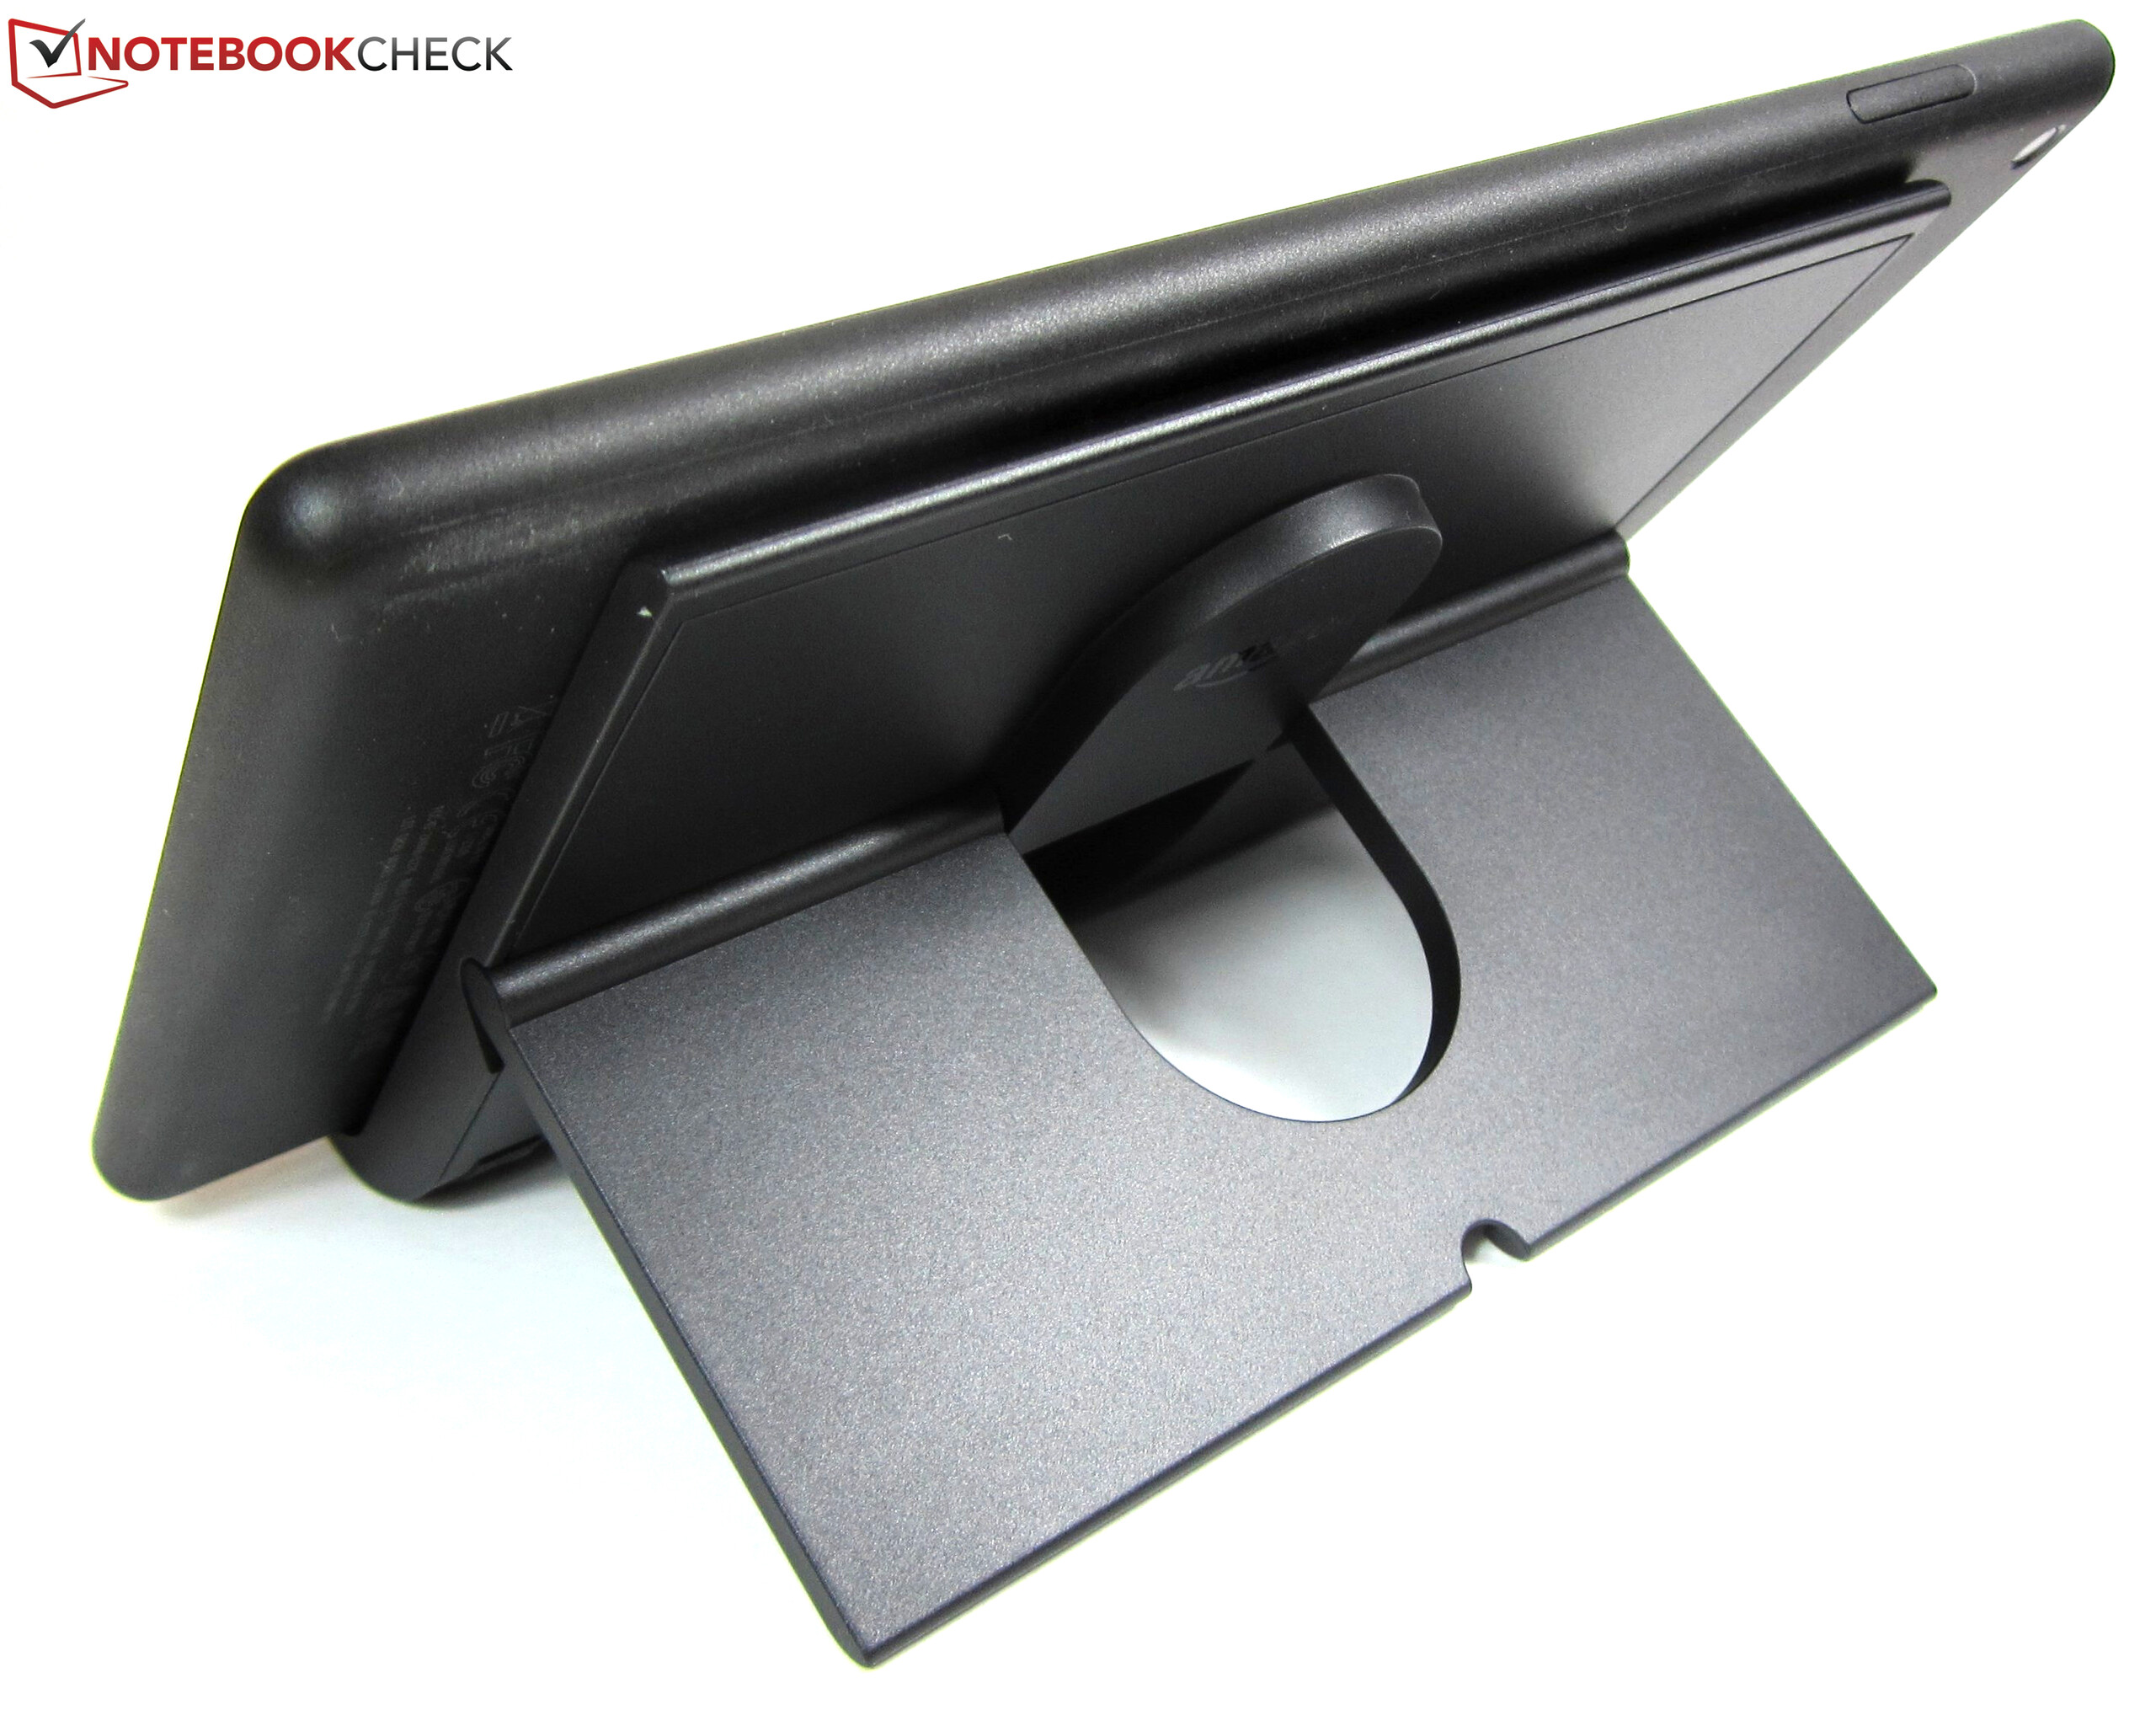
Accessories for the Fire HD 8 are plentiful. Particularly noteworthy is Amazon’s own Show Mode charging dock for $40 (or $30 when purchased as part of a tablet + charging dock bundle). It not only charges the tablet wirelessly but also makes Alexa truly shine.
The charging dock consists of two separate parts: A wireless charging docking station with an adjustable stand and a cover for the tablet itself. The latter is plugged into the tablet’s MicroUSB port and equipped with pins on the back that are used for wireless charging when placed in the dock.
As soon as the tablet detects the dock it automatically switches to the so-called show mode, which looks exactly like the user interface on Amazon’s Echo Show that depicts current time and outside temperature. In this mode Alexa can present additional information and answer questions. This particular mode of operation does not require the docking station - it can also be activated via an Alexa command.
Input Devices & Handling
The tablet’s display supports 10-point multitouch and turned out to be just as smooth and precise as much pricier tablets. Speed, on the other hand, was somewhat lacking. For example, launching apps can be slower than expected due to the sluggish internal storage, and content sometimes loaded one frame at a time. The SoC is also not the fastest, and accordingly the tablet stuttered and slowed down occasionally during everyday use.
A fingerprint reader is not available on the tablet, and the only physical buttons available are the volume rocker and the power button. Both worked as reliable and seamless as expected. The default keyboard application is Amazon’s own Fire keyboard, and it supports the most common features such as word suggestions, auto correct, swipe input, and automatic capitalization.
Display
The IPS display remained unchanged, and its resolution is still 1280x800, resulting in a pixel density of 189 dpi.
Unfortunately, at just 358.1 nits the display is not as bright as its Fire HD 8 (2017) predecessor’s, and it turned out to be the darkest of the entire test group. Brightness and brightness distribution were similar to the Huawei MediaPad M5 8.4; however, the latter offered a much higher resolution.
Contrast ratio and black level were even worse, and at just 422:1 and 0.85 nits display content was very pale. Once again, the Fire HD 8 (2018) can be found in last place.
| |||||||||||||||||||||||||
Brightness Distribution: 89 %
Center on Battery: 359 cd/m²
Contrast: 422:1 (Black: 0.85 cd/m²)
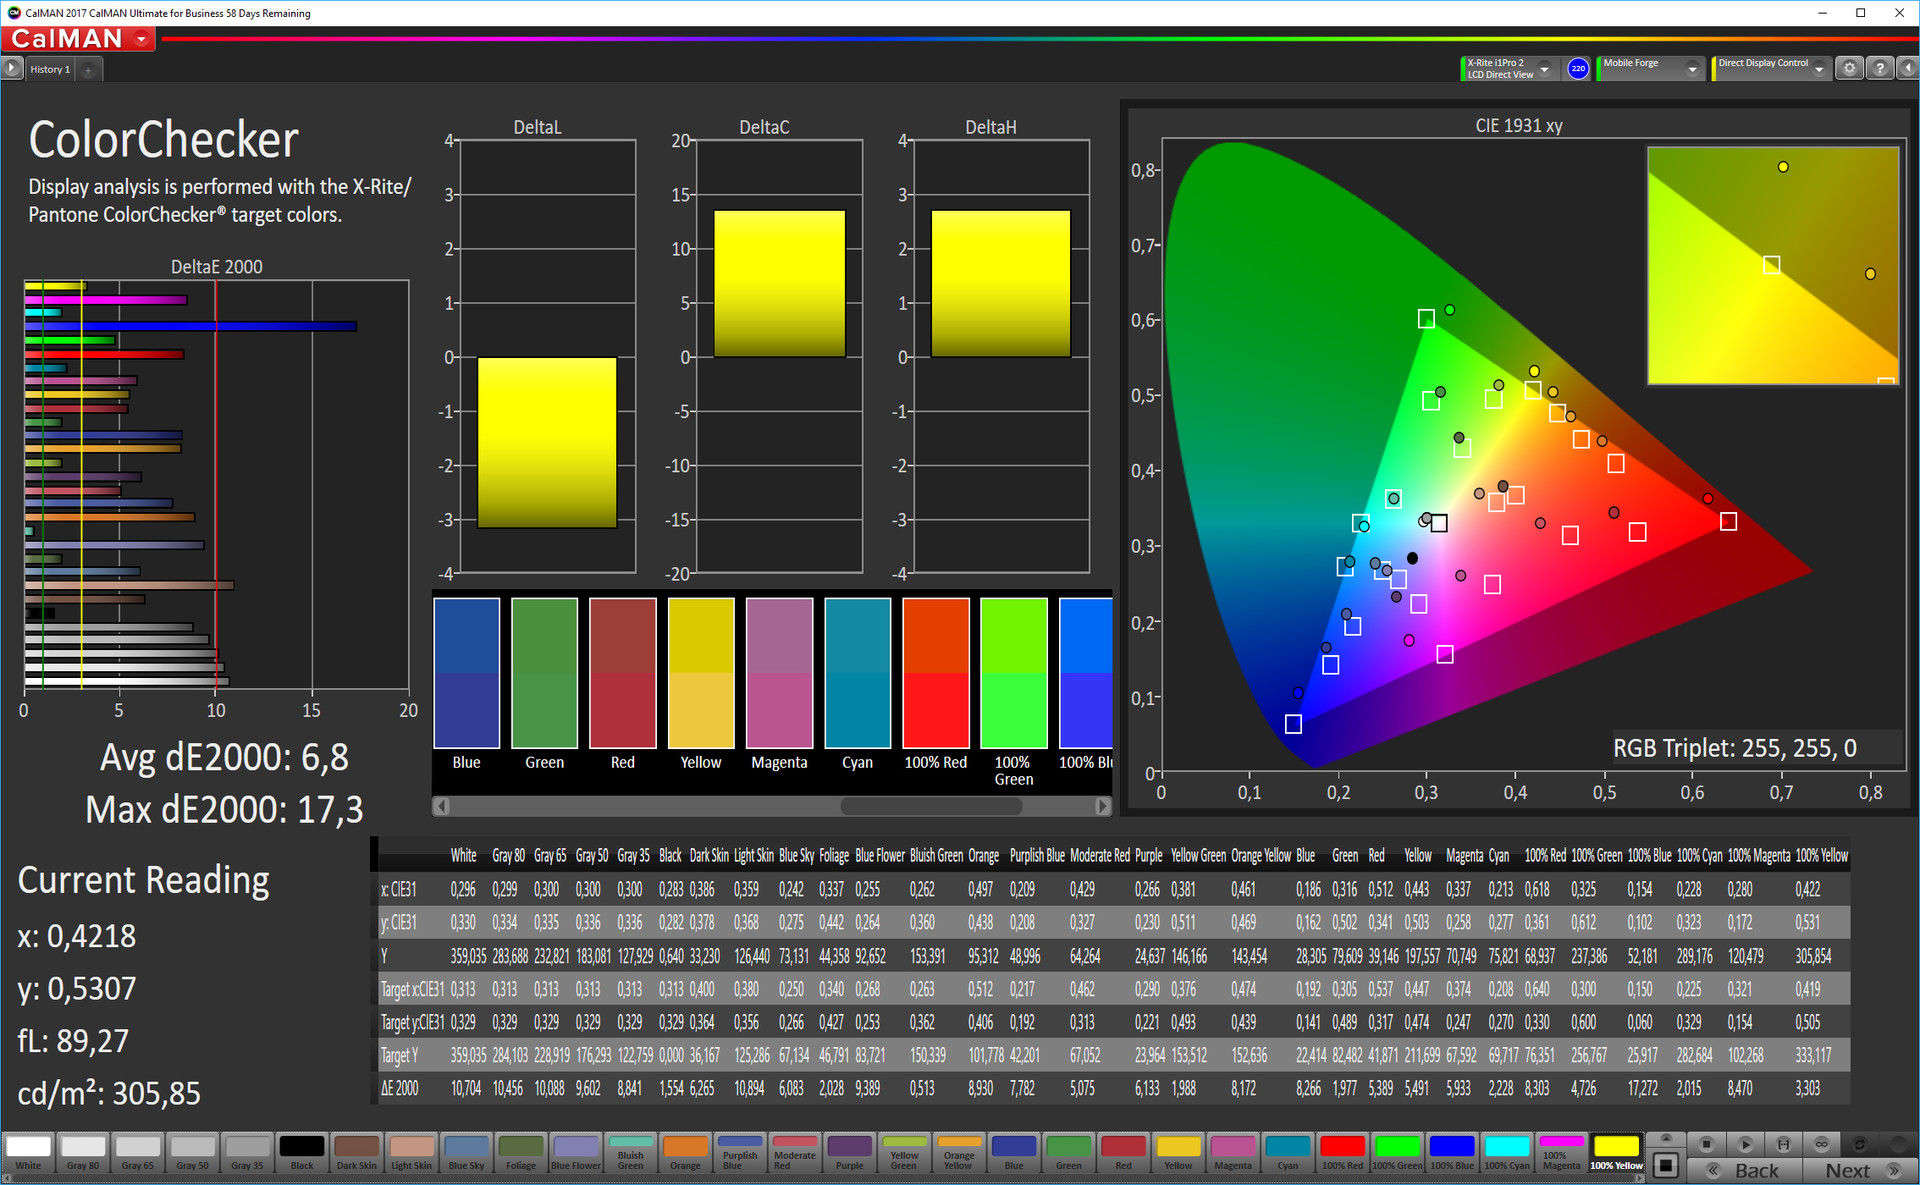
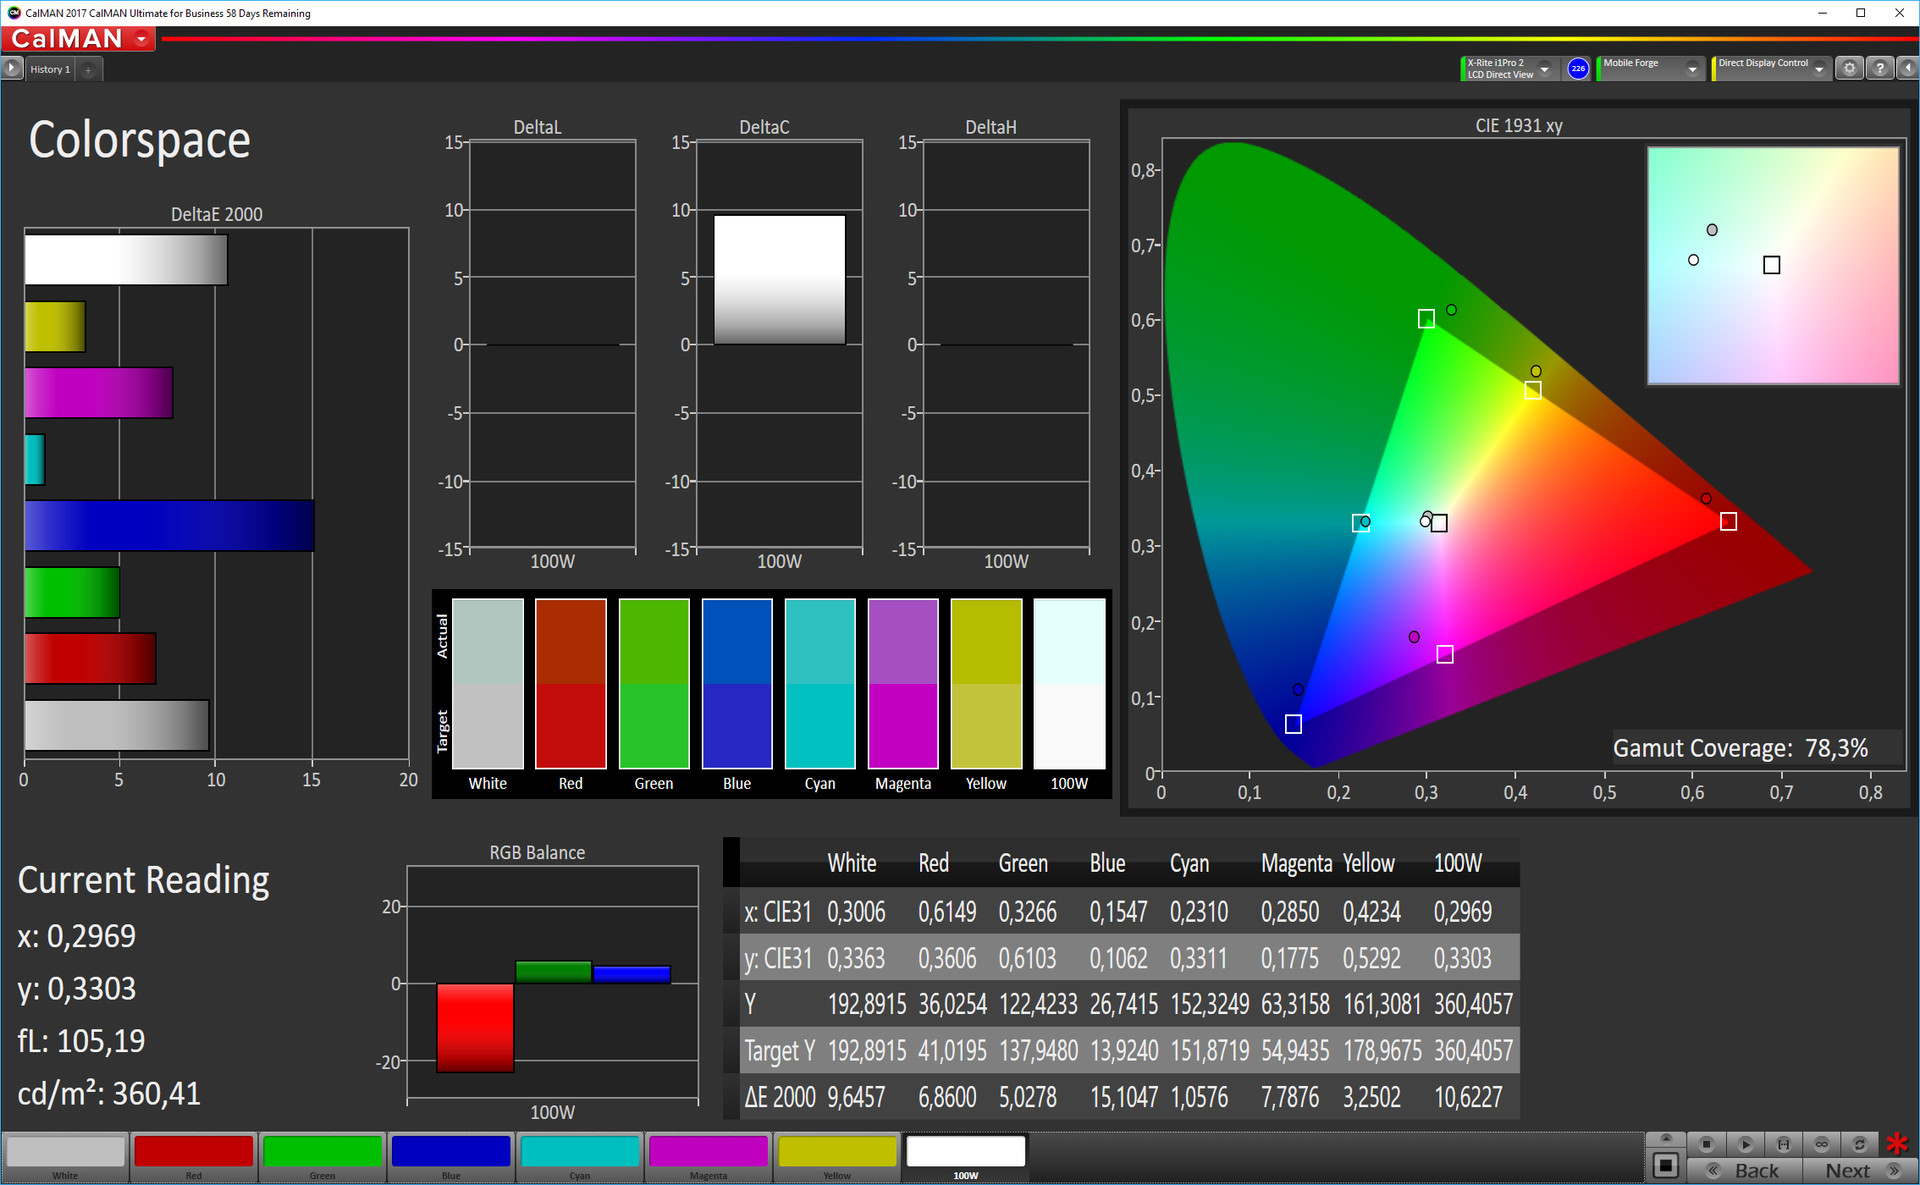
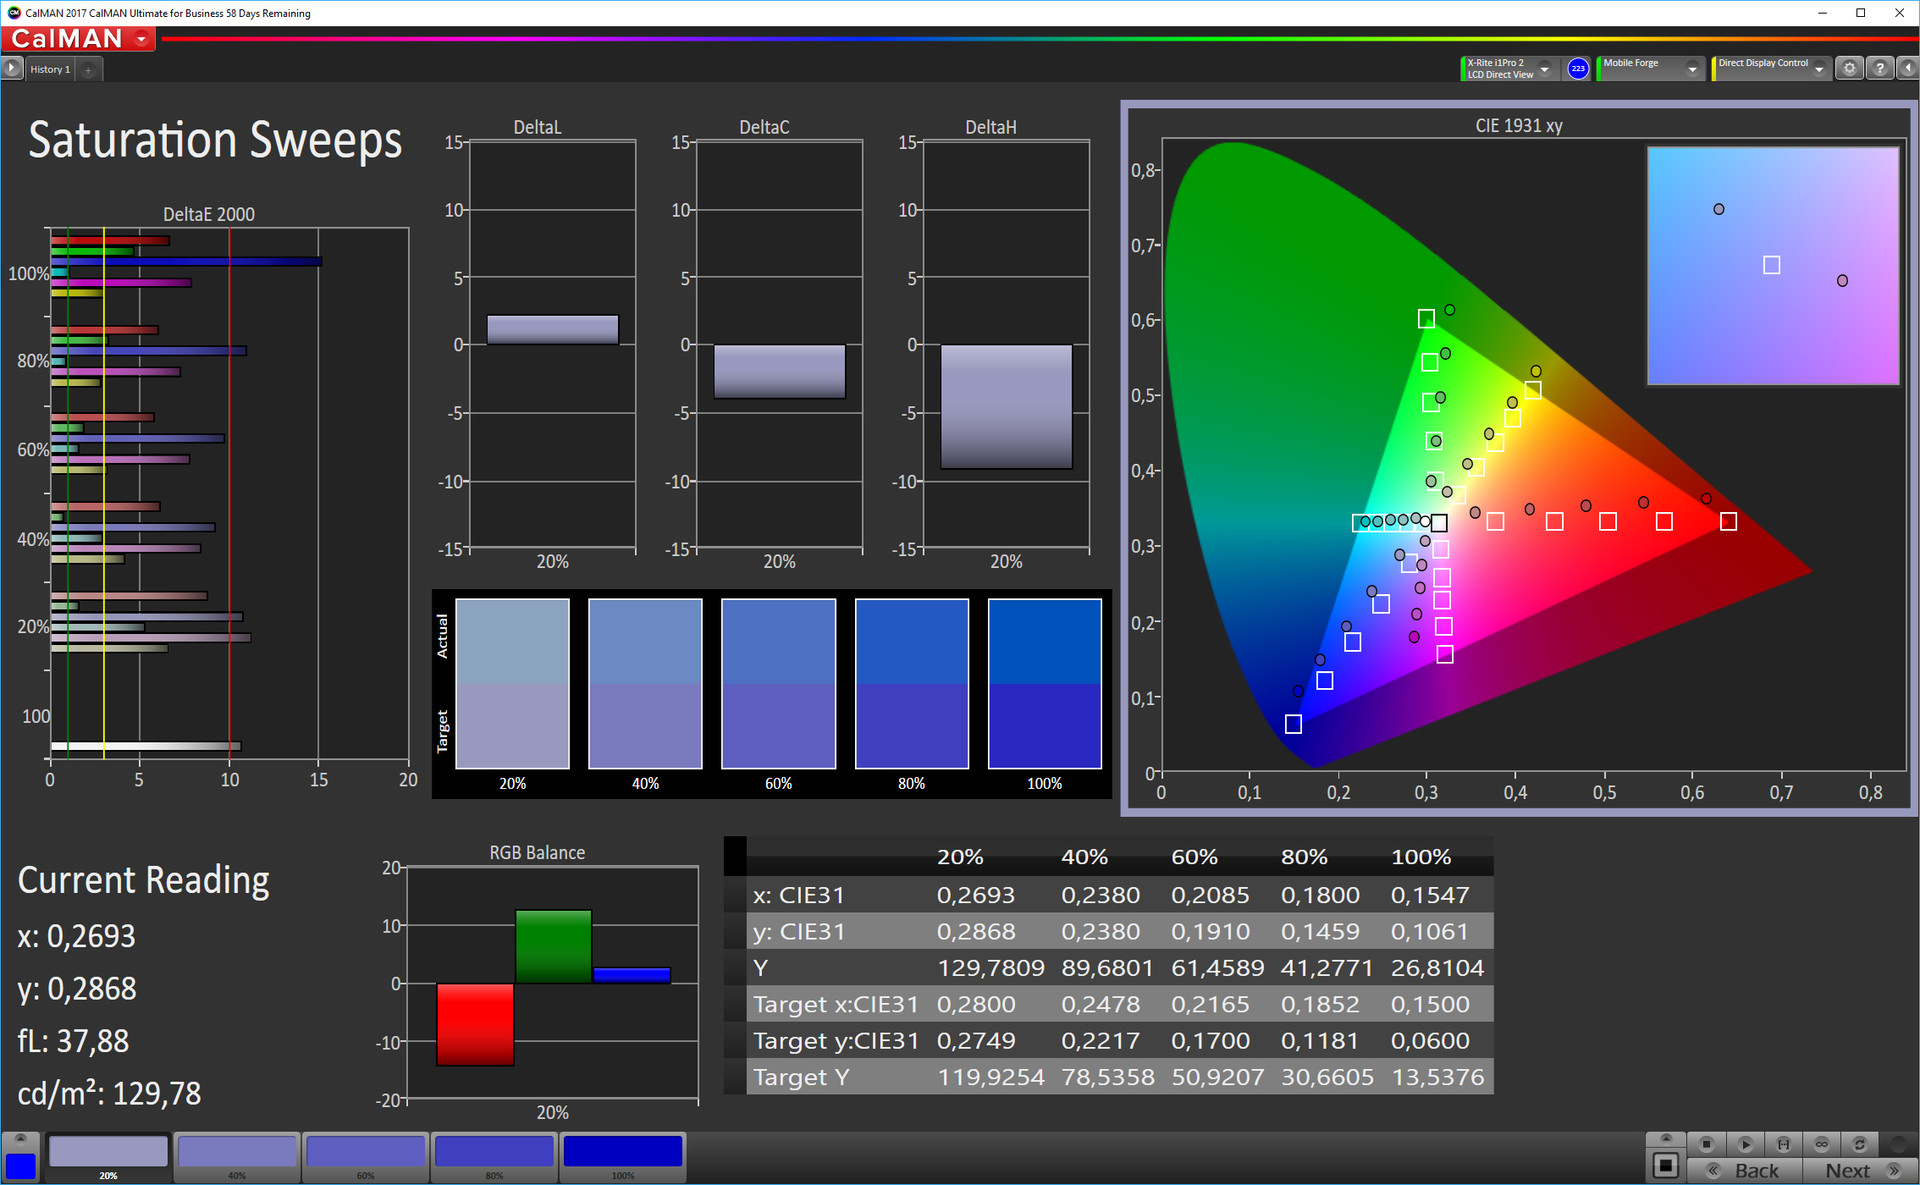
ΔE ColorChecker Calman: 6.8 | ∀{0.5-29.43 Ø4.73}
ΔE Greyscale Calman: 7.6 | ∀{0.09-98 Ø4.97}
78.3% sRGB (Calman 2D)
Gamma: 2.19
CCT: 7160 K
| Amazon Fire HD 8 2018 IPS, 1280x800, 8" | Amazon Fire HD 8 2017 IPS, 1280x800, 8" | Huawei MediaPad M5 8.4 IPS, 2560x1600, 8.4" | Lenovo Tab 4 8 IPS, 1280x800, 8" | Samsung Galaxy Tab Active 2 TFT LCD, 1280x800, 8" | Xiaomi Mi Pad 4 IPS LCD, 1920x1200, 8" | |
|---|---|---|---|---|---|---|
| Screen | 25% | 19% | 33% | 54% | 26% | |
| Brightness middle (cd/m²) | 359 | 419 17% | 405 13% | 455 27% | 509 42% | 454 26% |
| Brightness (cd/m²) | 358 | 412 15% | 392 9% | 446 25% | 477 33% | 411 15% |
| Brightness Distribution (%) | 89 | 91 2% | 92 3% | 91 2% | 91 2% | 83 -7% |
| Black Level * (cd/m²) | 0.85 | 0.39 54% | 0.67 21% | 0.51 40% | 0.48 44% | 0.73 14% |
| Contrast (:1) | 422 | 1074 155% | 604 43% | 892 111% | 1060 151% | 622 47% |
| Colorchecker dE 2000 * | 6.8 | 8.5 -25% | 5.78 15% | 5.5 19% | 3.45 49% | 5.2 24% |
| Colorchecker dE 2000 max. * | 17.3 | 13.8 20% | 9.82 43% | 14.8 14% | 5.17 70% | 8.36 52% |
| Greyscale dE 2000 * | 7.6 | 10.3 -36% | 7.2 5% | 5.5 28% | 4.5 41% | 4.7 38% |
| Gamma | 2.19 100% | 2.6 85% | 2.278 97% | 2.23 99% | 2.11 104% | 2.271 97% |
| CCT | 7160 91% | 6216 105% | 8405 77% | 7852 83% | 7171 91% | 7361 88% |
* ... smaller is better
Screen Flickering / PWM (Pulse-Width Modulation)
| Screen flickering / PWM not detected |  | ||
In comparison: 52 % of all tested devices do not use PWM to dim the display. If PWM was detected, an average of 7794 (minimum: 5 - maximum: 343500) Hz was measured. | |||
Using the X-Rite i1pro 2 spectrophotometer in combination with the CalMAN software we took a look at the display in our lab. As it turns out, the tablet was fairly inaccurate out of the box and presented us with DeltaE deviations of 6.8 for colors and 7.8 for grayscale. Ideally, you want these to be less than 3. In addition, color temperature was shifted towards the cooler spectrum and measured at a fairly high 7,160 K. That said, we should note that all of its competitors did similarly poor in our lab, and none of them proved to be significantly more accurate.

Display Response Times
| ↔ Response Time Black to White | ||
|---|---|---|
| 38 ms ... rise ↗ and fall ↘ combined | ↗ 20.8 ms rise | 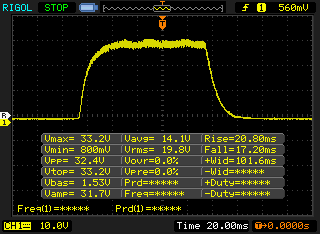 |
| ↘ 17.2 ms fall | ||
| The screen shows slow response rates in our tests and will be unsatisfactory for gamers. In comparison, all tested devices range from 0.1 (minimum) to 240 (maximum) ms. » 96 % of all devices are better. This means that the measured response time is worse than the average of all tested devices (19.9 ms). | ||
| ↔ Response Time 50% Grey to 80% Grey | ||
| 48 ms ... rise ↗ and fall ↘ combined | ↗ 26.8 ms rise |  |
| ↘ 21.2 ms fall | ||
| The screen shows slow response rates in our tests and will be unsatisfactory for gamers. In comparison, all tested devices range from 0.165 (minimum) to 636 (maximum) ms. » 82 % of all devices are better. This means that the measured response time is worse than the average of all tested devices (31.1 ms). | ||
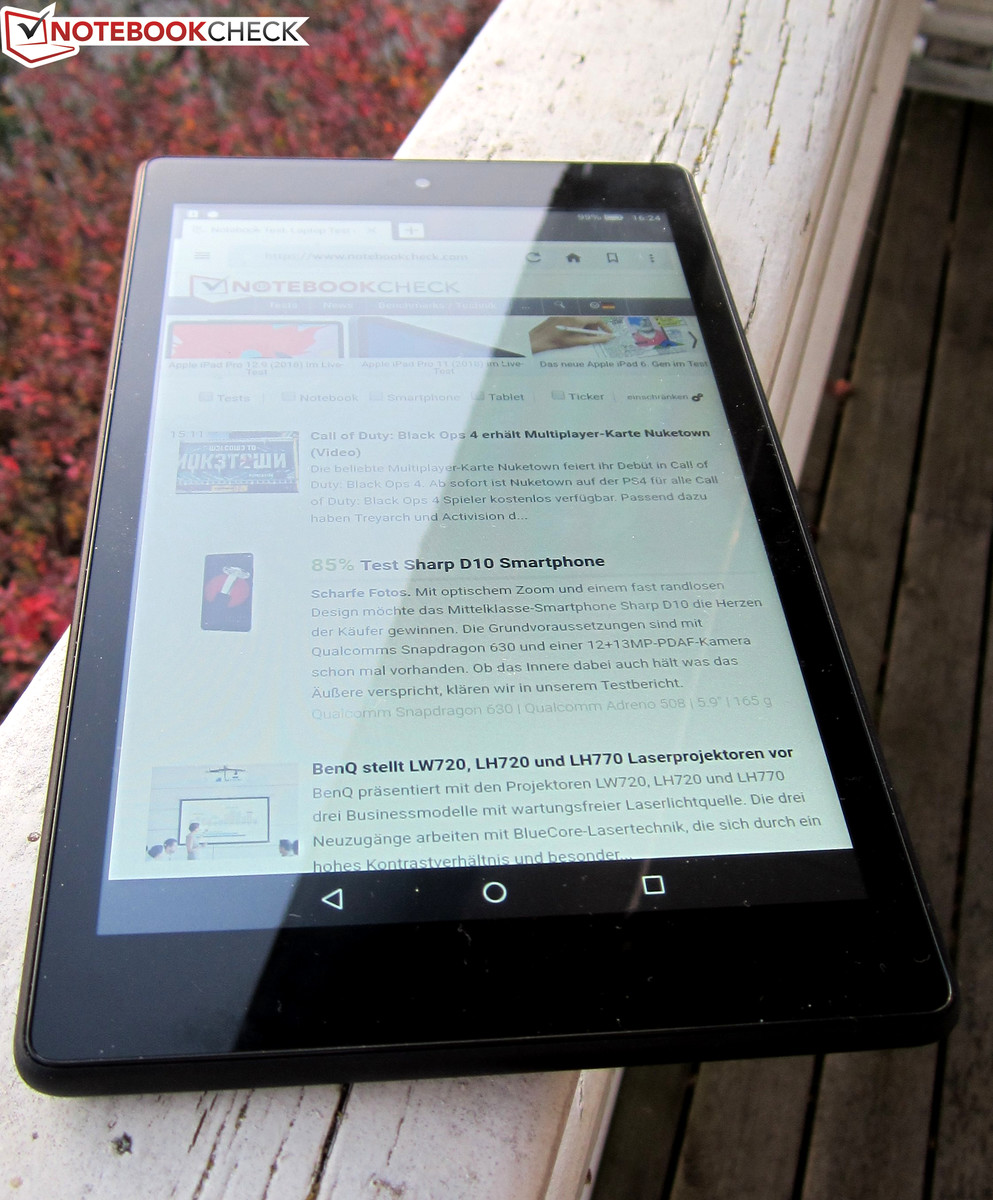
As expected of an IPS display, viewing angles were decent. Unfortunately, the display was simply too dim to be used outdoors. It was usable on overcast days but as soon as the sun came out it became increasingly difficult to decipher anything on the screen, even when sitting in the shade.

Performance
An entry-level MediaTek MT8163 SoC, an ARM Mali-T720 GPU, and 1.5 GB of RAM make for a solid but certainly not speedy contender. However, we have to admit that Fire OS and the included apps ran mostly smoothly. The tablet was certainly powerful enough for shopping, surfing, and occasional gaming.
In our synthetic benchmarks, the Fire HD 8 (2018) performed identically to its Fire HD 8 (2017) predecessor due to identical internal hardware. By and large, the Lenovo Tab 4 8 and Samsung Galaxy Tab Active 2 were in the same boat albeit the latter was slightly faster here and there. The Huawei MediaPad M5 8.4 and Xiaomi Mi Pad 4 played in a different league.
| GFXBench | |
| on screen Car Chase Onscreen | |
| Average of class Tablet (3.8 - 110, n=57, last 2 years) | |
| Huawei MediaPad M5 8.4 | |
| Xiaomi Mi Pad 4 | |
| Samsung Galaxy Tab Active 2 | |
| Amazon Fire HD 8 2018 | |
| 1920x1080 Car Chase Offscreen | |
| Average of class Tablet (4 - 256, n=57, last 2 years) | |
| Huawei MediaPad M5 8.4 | |
| Xiaomi Mi Pad 4 | |
| Samsung Galaxy Tab Active 2 | |
| Amazon Fire HD 8 2018 | |
| AnTuTu v7 - Total Score | |
| Huawei MediaPad M5 8.4 | |
| Xiaomi Mi Pad 4 | |
| Amazon Fire HD 8 2018 | |
| Average MediaTek MT8163 V/B 1.3 GHz (n=1) | |
We saw identical results when running our browser benchmarks. The Huawei MediaPad M5 8.4 and Xiaomi Mi Pad 4 were in first and second place with the Samsung Galaxy Tab Active 2, Lenovo Tab 4 8, and both Amazon tablets trailing far behind. Subjectively, web pages loaded fast in general but hit a brick wall once complex HTML5 content was involved. For example, the Fire HD 8 (2018) failed to load the online pinball game Ouigo Let's Play - the sound was playing, but the screen froze almost immediately.
| JetStream 1.1 - 1.1 Total | |
| Huawei MediaPad M5 8.4 (Chrome 66) | |
| Xiaomi Mi Pad 4 (Chrome 68) | |
| Samsung Galaxy Tab Active 2 | |
| Amazon Fire HD 8 2017 (Amazon Silk 58.2.3029.83.10) | |
| Lenovo Tab 4 8 (Chrome 61) | |
| Average MediaTek MT8163 V/B 1.3 GHz (13.3 - 21.2, n=6) | |
| Amazon Fire HD 8 2018 (Silk Browser 66.2.10.3359.126.10) | |
| Octane V2 - Total Score | |
| Average of class Tablet (763 - 138481, n=73, last 2 years) | |
| Huawei MediaPad M5 8.4 (Chrome 66) | |
| Xiaomi Mi Pad 4 (Chrome 68) | |
| Samsung Galaxy Tab Active 2 | |
| Average MediaTek MT8163 V/B 1.3 GHz (2821 - 3320, n=6) | |
| Lenovo Tab 4 8 (Chrome 61) | |
| Amazon Fire HD 8 2018 (Silk Browser 66.2.10.3359.126.10) | |
| Amazon Fire HD 8 2017 (Amazon Silk 58.2.3029.83.10) | |
| Mozilla Kraken 1.1 - Total | |
| Amazon Fire HD 8 2018 (Silk Browser 66.2.10.3359.126.10) | |
| Average MediaTek MT8163 V/B 1.3 GHz (11818 - 14321, n=6) | |
| Lenovo Tab 4 8 (Chrome 61) | |
| Amazon Fire HD 8 2017 (Amazon Silk 58.2.3029.83.10) | |
| Samsung Galaxy Tab Active 2 | |
| Xiaomi Mi Pad 4 (Chrome 68) | |
| Huawei MediaPad M5 8.4 (Chrome 66) | |
| Average of class Tablet (243 - 27101, n=67, last 2 years) | |
| WebXPRT 3 - Overall | |
| Average of class Tablet (108 - 480, n=10, last 2 years) | |
| Huawei MediaPad M5 8.4 (Chrome 66) | |
| Amazon Fire HD 8 2018 (Silk Browser 66.2.10.3359.126.10) | |
| Average MediaTek MT8163 V/B 1.3 GHz (23 - 25, n=3) | |
| WebXPRT 2015 - Overall | |
| Huawei MediaPad M5 8.4 (Chrome 66) | |
| Xiaomi Mi Pad 4 (Chrome 68) | |
| Amazon Fire HD 8 2018 (Silk Browser 66.2.10.3359.126.10) | |
| Lenovo Tab 4 8 (Chrome 61) | |
| Samsung Galaxy Tab Active 2 | |
| Average MediaTek MT8163 V/B 1.3 GHz (57 - 71, n=4) | |
| Amazon Fire HD 8 2017 (Amazon Silk 58.2.3029.83.10) | |
* ... smaller is better
The Fire HD 8 (2018)’s eMMC storage was pretty lethargic by and large, resulting in slow application launch times and a noticeable lag when switching between tabs.
At just 158.5 MB/s in sequential and 26.7 MB/s in 4K data transfers the Fire HD 8 once again occupied the very bottom within our test group. When benchmarked with our Toshiba Exceria M501 reference card (max. performance: 270 MB/s read, 150 MB/s write) the Fire HD 8 (2018) was just as slow as its predecessor, and it scored a meager 51.4 MB/s, which was worthy of nothing better than last place once more.
| Amazon Fire HD 8 2018 | Amazon Fire HD 8 2017 | Huawei MediaPad M5 8.4 | Lenovo Tab 4 8 | Samsung Galaxy Tab Active 2 | Xiaomi Mi Pad 4 | Average 16 GB eMMC Flash | Average of class Tablet | |
|---|---|---|---|---|---|---|---|---|
| AndroBench 3-5 | -2% | 170% | 51% | 33% | 233% | -3% | 2042% | |
| Sequential Read 256KB (MB/s) | 158.5 | 159.1 0% | 268.6 69% | 265.1 67% | 218.1 38% | 277.6 75% | 164.5 ? 4% | 1987 ? 1154% |
| Sequential Write 256KB (MB/s) | 41.89 | 47.23 13% | 132.2 216% | 72.3 73% | 54 29% | 207.9 396% | 43 ? 3% | 1580 ? 3672% |
| Random Read 4KB (MB/s) | 26.98 | 21.55 -20% | 62.8 133% | 44 63% | 25.96 -4% | 94.2 249% | 21.7 ? -20% | 268 ? 893% |
| Random Write 4KB (MB/s) | 12.25 | 11.51 -6% | 65.1 431% | 7.1 -42% | 10.98 -10% | 77.9 536% | 8.08 ? -34% | 312 ? 2447% |
| Sequential Read 256KB SDCard (MB/s) | 51.4 ? | 51.1 -1% | 84.9 ? 65% | 84.8 65% | 78.6 53% | 84.2 ? 64% | 59.1 ? 15% | |
| Sequential Write 256KB SDCard (MB/s) | 34.03 ? | 34.15 0% | 70.7 ? 108% | 61.1 80% | 64.3 89% | 61.2 ? 80% | 39.8 ? 17% |
Gaming
All things graphics are handled by the aging ARM Mali-T720 GPU. Its performance was good enough to run current games. The sensors worked flawlessly, and sound was decent.
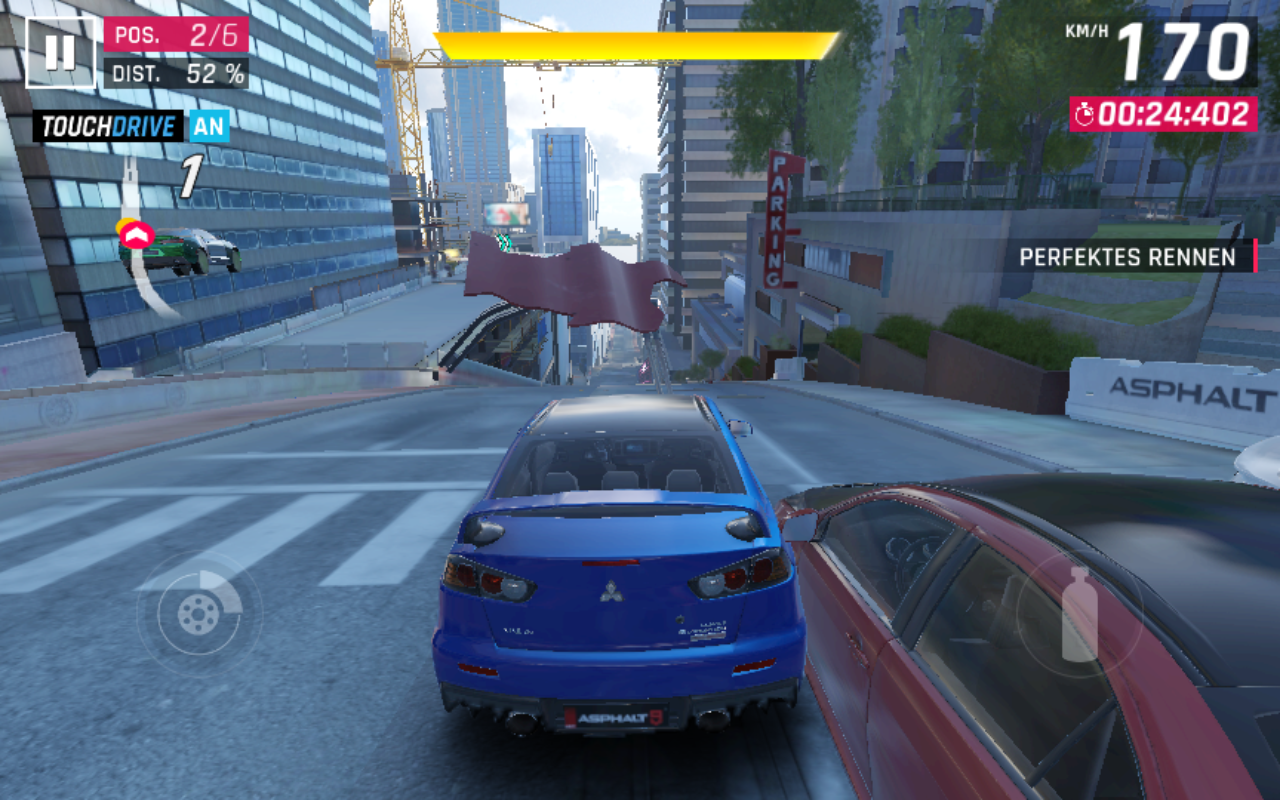
Smooth gameplay, however, did require reduced details. Sometimes even that wasn't enough, as can be seen in GameBench. On minimum details, the brand-new racing game Asphalt 9 ran with no more than 18 FPS. Other games, such as Dead Trigger 2, ran with up to 30 FPS on medium settings and were much smoother. High details could have been possible but were not available on the Fire HD 8.
Dead Trigger 2
Asphalt 9
Emissions
Temperature
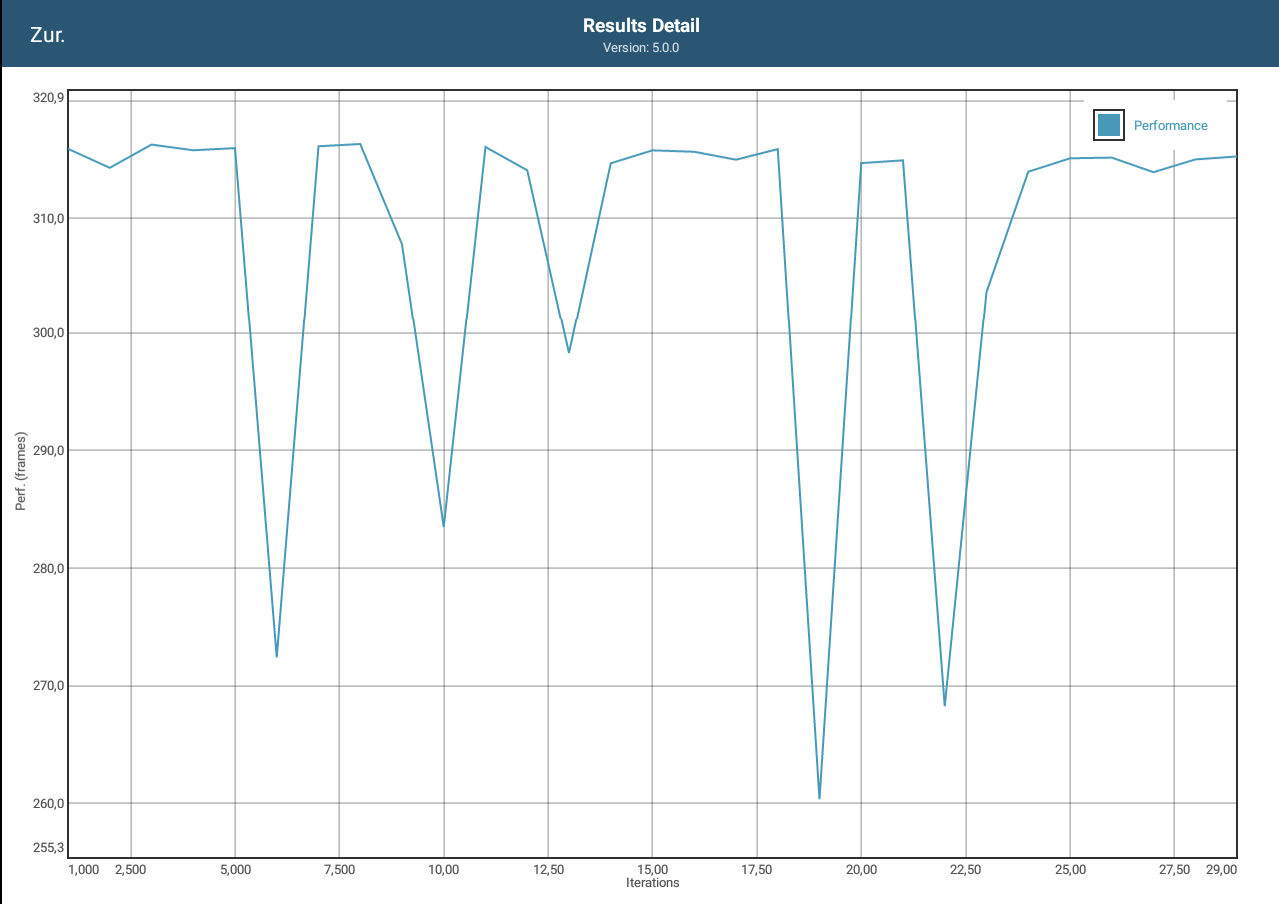
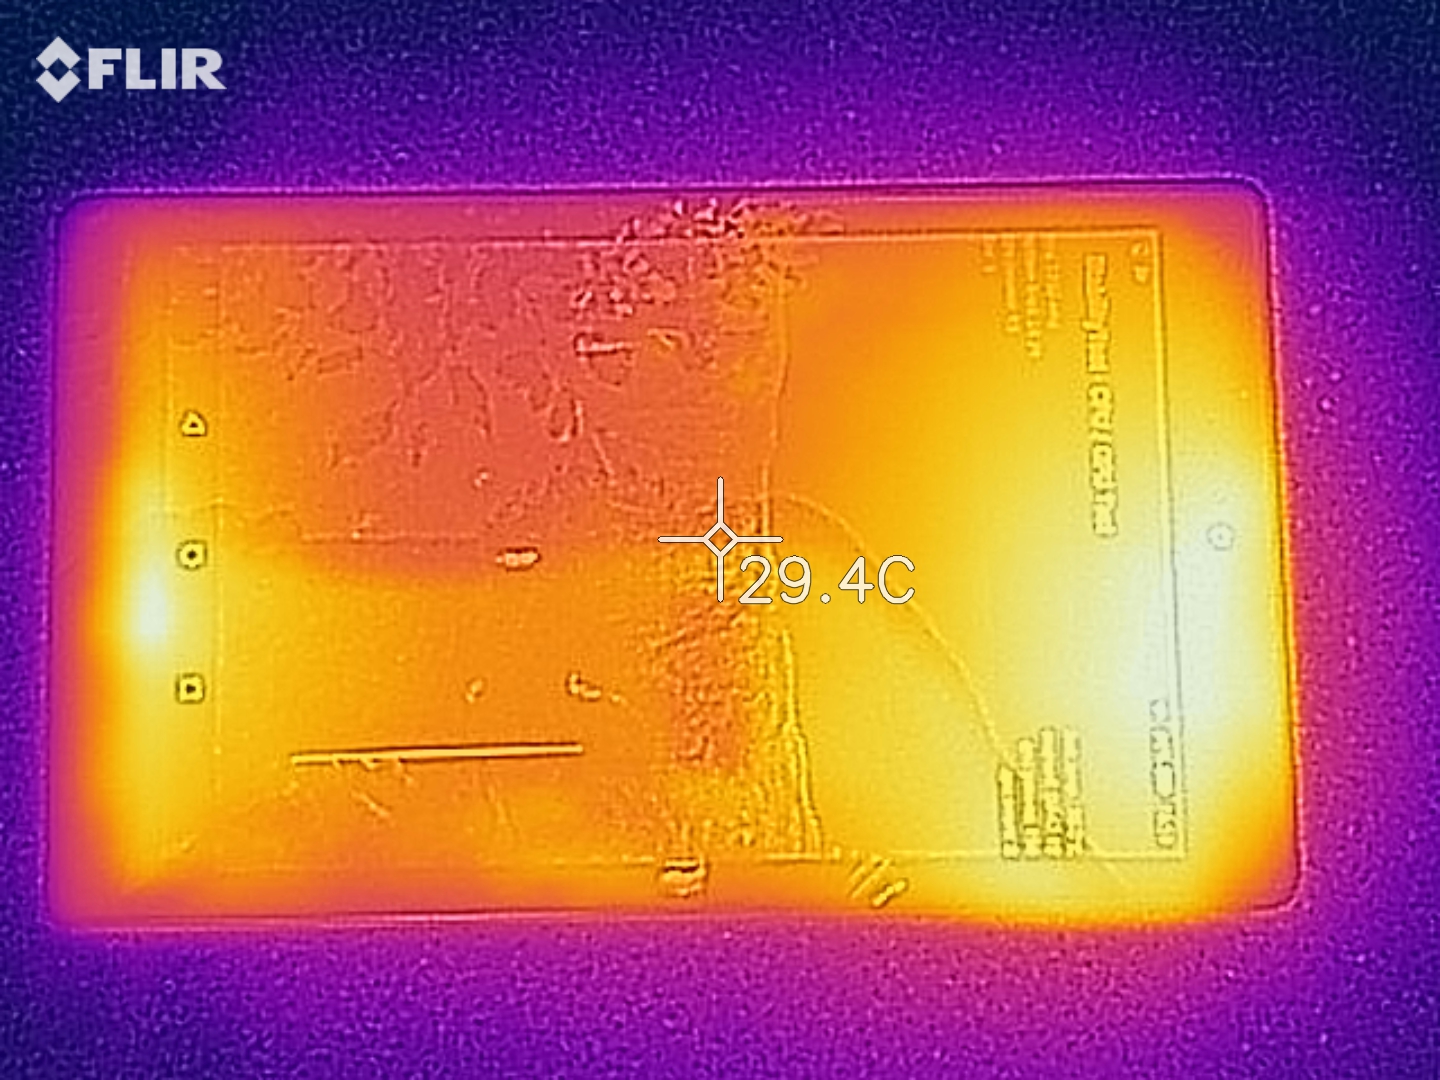
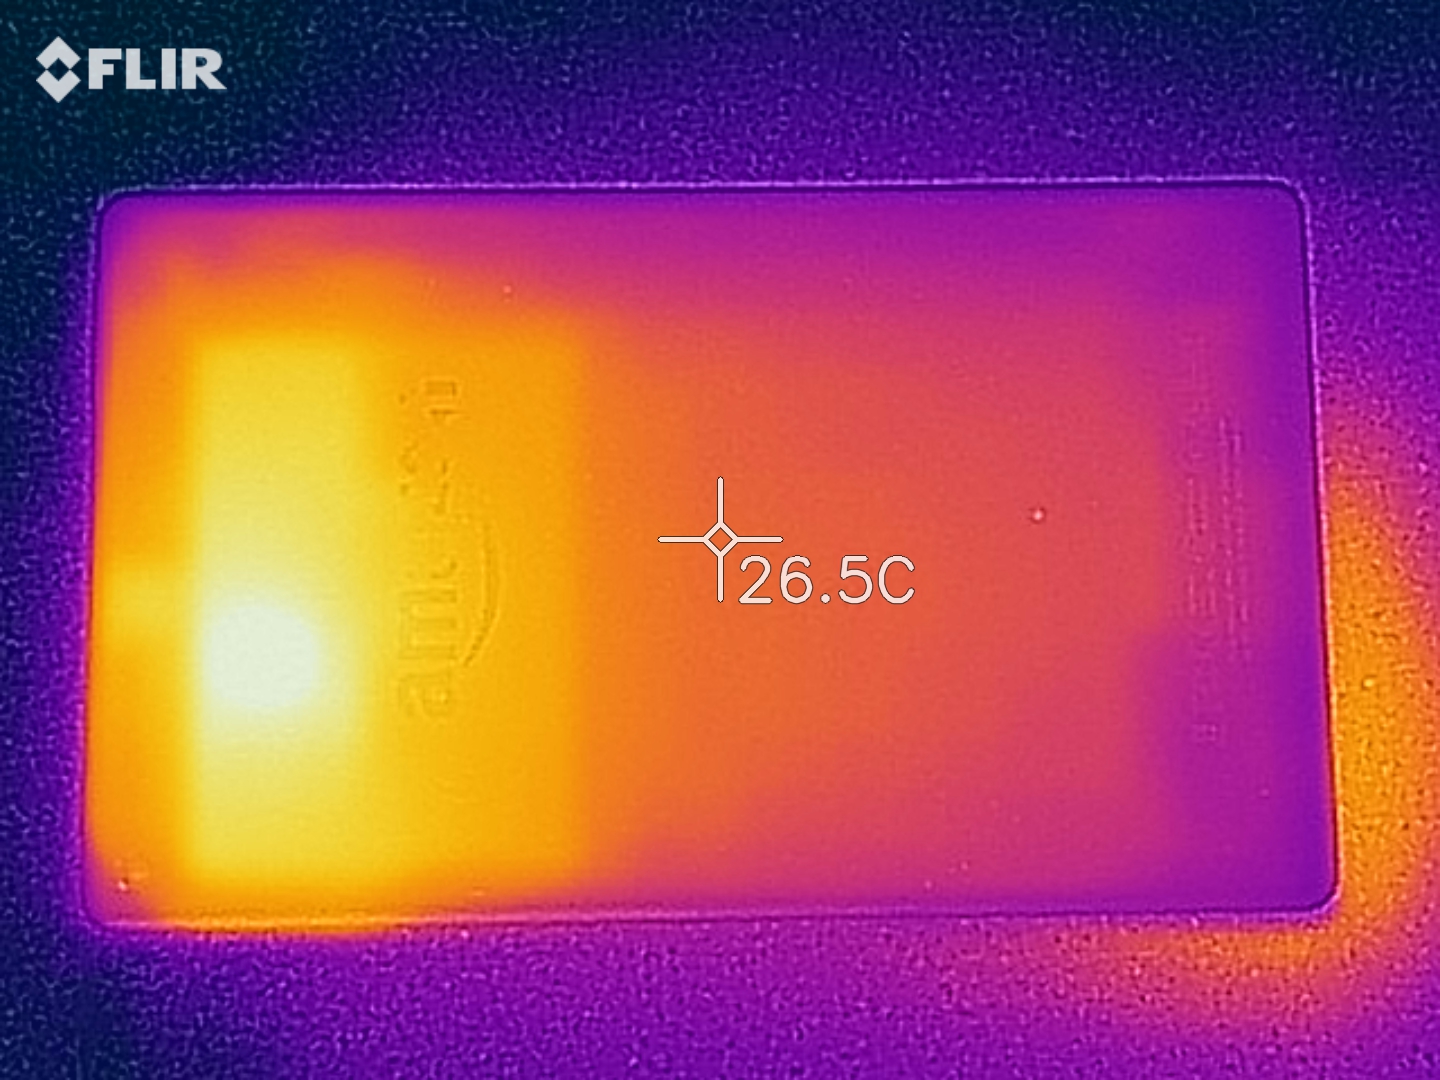
With a maximum of 34.2 °C we can safely say that the Amazon Fire HD 8 (2018) remained pleasantly cool during our tests. We also noticed no apparent throttling while running our GTXBench battery test. Frame rates dropped occasionally when running the demanding GFXBench Manhattan test in a loop 30x in a row but managed to remain at a very high level nevertheless.
(+) The maximum temperature on the upper side is 31.4 °C / 89 F, compared to the average of 33.6 °C / 92 F, ranging from 20.7 to 53.2 °C for the class Tablet.
(+) The bottom heats up to a maximum of 34.2 °C / 94 F, compared to the average of 33.2 °C / 92 F
(+) In idle usage, the average temperature for the upper side is 21.9 °C / 71 F, compared to the device average of 30 °C / 86 F.
Speakers
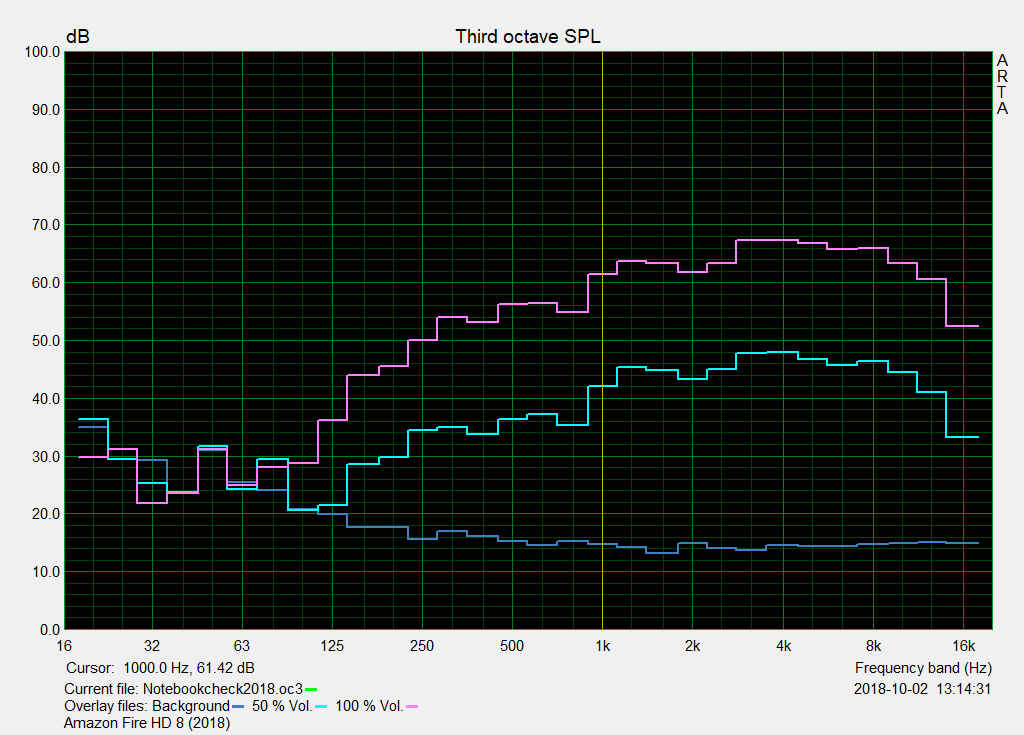
The stereo speakers are located at the long side of the tablet and peaked at a maximum volume of 76.3 dB(A). They tend to get covered by your hands when the tablet is held in portrait mode, resulting in unbalanced sound output. In order to ensure that both speakers are free the tablet should be held in landscape mode.
Thanks to Dolby Atmos the sound system turned out to be surprisingly decent with well-balanced mids and highs. Bass, on the other hand, was missing completely. As always, external speakers or headphones will be vastly superior to the tablet’s internal speakers.
Amazon Fire HD 8 2018 audio analysis
(±) | speaker loudness is average but good (76.3 dB)
Bass 100 - 315 Hz
(-) | nearly no bass - on average 17.4% lower than median
(±) | linearity of bass is average (9.5% delta to prev. frequency)
Mids 400 - 2000 Hz
(+) | balanced mids - only 3.7% away from median
(+) | mids are linear (4.4% delta to prev. frequency)
Highs 2 - 16 kHz
(±) | higher highs - on average 5.2% higher than median
(+) | highs are linear (3.1% delta to prev. frequency)
Overall 100 - 16.000 Hz
(±) | linearity of overall sound is average (19.1% difference to median)
Compared to same class
» 53% of all tested devices in this class were better, 5% similar, 42% worse
» The best had a delta of 7%, average was 20%, worst was 129%
Compared to all devices tested
» 46% of all tested devices were better, 7% similar, 47% worse
» The best had a delta of 4%, average was 24%, worst was 134%
Huawei MediaPad M5 8.4 audio analysis
(+) | speakers can play relatively loud (85 dB)
Bass 100 - 315 Hz
(-) | nearly no bass - on average 19.2% lower than median
(±) | linearity of bass is average (12.5% delta to prev. frequency)
Mids 400 - 2000 Hz
(+) | balanced mids - only 3.6% away from median
(+) | mids are linear (2.7% delta to prev. frequency)
Highs 2 - 16 kHz
(+) | balanced highs - only 4.2% away from median
(+) | highs are linear (3.5% delta to prev. frequency)
Overall 100 - 16.000 Hz
(±) | linearity of overall sound is average (15.9% difference to median)
Compared to same class
» 35% of all tested devices in this class were better, 6% similar, 59% worse
» The best had a delta of 7%, average was 20%, worst was 129%
Compared to all devices tested
» 25% of all tested devices were better, 5% similar, 70% worse
» The best had a delta of 4%, average was 24%, worst was 134%
Energy Management
Power Consumption
Besides the short list of upgrades and updates, power consumption is one of the few categories where the Fire HD 8 (2018) differs quite significantly from its Fire HD 8 (2017) predecessor, and not in a good way. Despite absolutely identical internal hardware its idle power consumption of 3.3 W was significantly higher than the 2017’s 2.7 W. Our only guess is that the newer version of Android was more demanding. Power consumption under load was higher as well albeit inconspicuous by and large. The Lenovo Tab 4 8, Xiaomi Mi Pad 4, and Huawei MediaPad M5 8.4 had much higher power requirements.
| Off / Standby | |
| Idle | |
| Load |
|
Key:
min: | |
| Amazon Fire HD 8 2018 4750 mAh | Amazon Fire HD 8 2017 mAh | Huawei MediaPad M5 8.4 5100 mAh | Lenovo Tab 4 8 4850 mAh | Samsung Galaxy Tab Active 2 4450 mAh | Xiaomi Mi Pad 4 6000 mAh | |
|---|---|---|---|---|---|---|
| Power Consumption | 12% | -43% | -6% | 11% | -31% | |
| Idle Minimum * (Watt) | 0.97 | 0.99 -2% | 2.1 -116% | 1.1 -13% | 0.89 8% | 1.2 -24% |
| Idle Average * (Watt) | 3.26 | 2.74 16% | 3.74 -15% | 3.51 -8% | 3.13 4% | 2.2 33% |
| Idle Maximum * (Watt) | 3.37 | 2.83 16% | 4.33 -28% | 4.14 -23% | 3.36 -0% | 4.1 -22% |
| Load Average * (Watt) | 5.68 | 4.51 21% | 6.32 -11% | 4.86 14% | 3.93 31% | 8.2 -44% |
| Load Maximum * (Watt) | 6.21 | 5.69 8% | 9.13 -47% | 6.13 1% | 5.45 12% | 12.2 -96% |
* ... smaller is better
Battery Life
Given its higher power consumption we expected battery life to decrease compared to the Fire HD 8 (2017). While it remained acceptable at around 8 hours in our Wi-Fi test and our H.264 test, its competitors outlasted the Fire HD 8 (2018) by significant margins. Its own predecessor ran much longer in particular. Charging the tablet from near empty to full with the included power supply (5.25 V, 1 A) took around 6 hours.
| Amazon Fire HD 8 2018 4750 mAh | Amazon Fire HD 8 2017 mAh | Huawei MediaPad M5 8.4 5100 mAh | Lenovo Tab 4 8 4850 mAh | Samsung Galaxy Tab Active 2 4450 mAh | Xiaomi Mi Pad 4 6000 mAh | |
|---|---|---|---|---|---|---|
| Battery runtime | 51% | 15% | 1% | 31% | 34% | |
| Reader / Idle (h) | 19.5 | 33.9 74% | 19.2 -2% | 20.1 3% | 22.6 16% | 22.7 16% |
| H.264 (h) | 8.3 | 12.4 49% | 11.7 41% | 10.1 22% | 8.2 -1% | 15.2 83% |
| WiFi v1.3 (h) | 8.2 | 12.8 56% | 10.5 28% | 7.5 -9% | 14.9 82% | 13.8 68% |
| Load (h) | 5.3 | 6.6 25% | 5 -6% | 4.6 -13% | 6.6 25% | 3.7 -30% |
Pros
Cons
Verdict
Amazon’s Fire HD 8 (2018) is an 8-inch tablet that is practically unrivaled in its price-performance ratio bracket. If you are looking for an affordable tablet to browse the web, the Fire HD 8 (2018) is definitely worth considering. Its stereo sound was very decent, and so were its battery life, its overall build quality, and its dual-band Wi-Fi. The Kids Edition features a very sturdy and robust protective shell in either blue or pink as well as content appropriate for children.
The differences between the Fire HD 8 (2018) and its predecessor, such as the inclusion of Alexa, are almost negligible. Nevertheless, they are very welcome and make the newer model even more enticing than the Fire HD 8 (2017) considering its identical price of just $80.
When paired with the optional Show Mode docking station the tablet offered the same features as Amazon’s Echo Show at a significantly lower price. At the time of writing, the second-generation Echo Show sells for more than $200 while the 32 GB model of the Fire HD 8 (2018) plus Show Mode Dock bundle can be had for as little as $140.
That said, there are some limitations you are going to encounter sooner or later, for example the somewhat lethargic MediaTek MT8163 quad-core SoC or the fairly dark low-resolution (1280x800) display. The tablet also lacks a GPS chip, the camera is usable for quick snaps at best, and the Android 7-based Fire OS operating system is clearly geared towards Amazon’s services. Google’s Play Store can be retroactively installed but is going to void your warranty, so beware.
Amazon Fire HD 8 2018
- 11/05/2019 v7 (old)
Manuel Masiero
Price comparison

