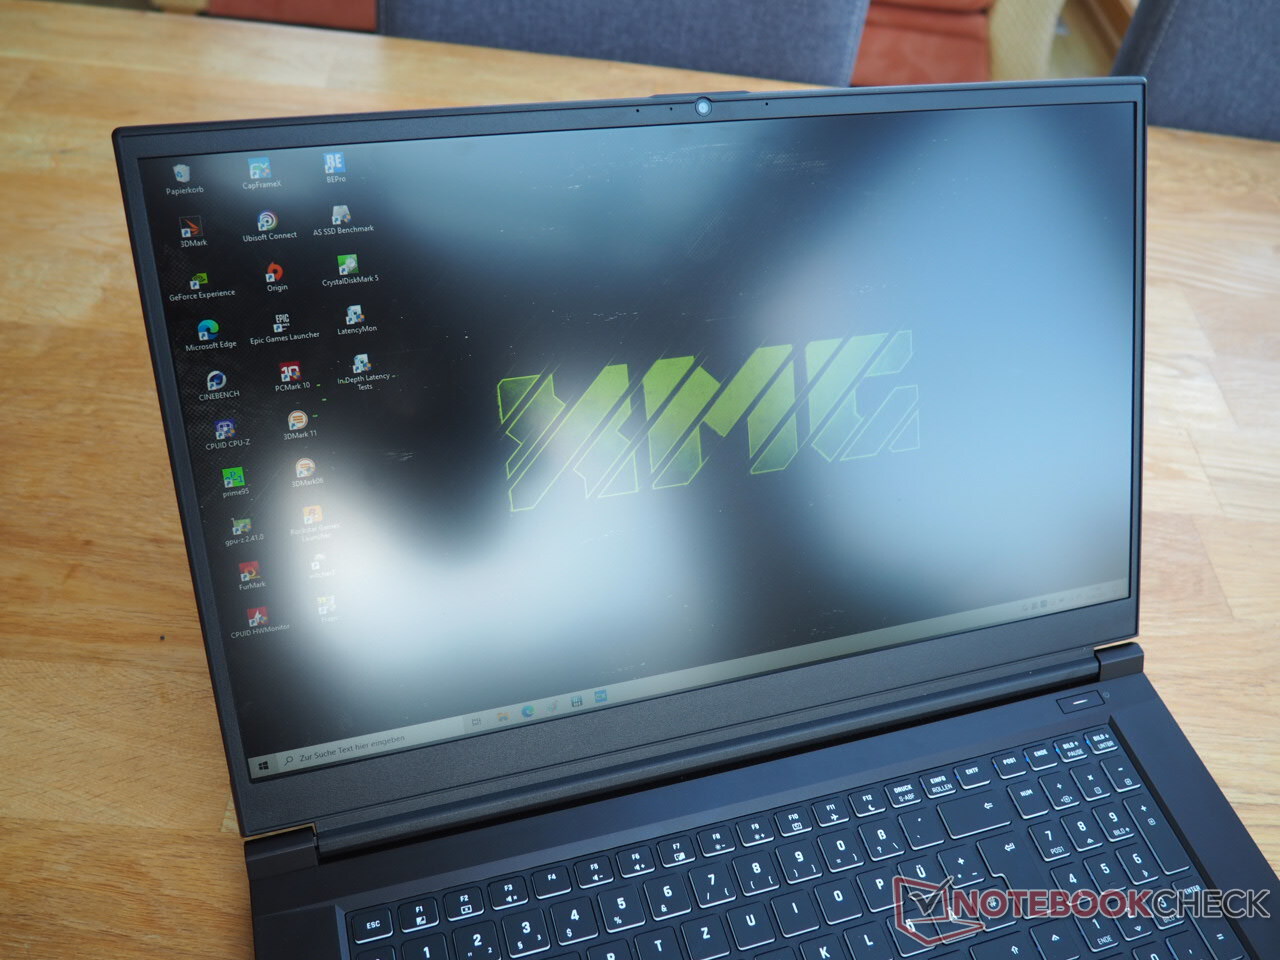
XMG Focus 17 (Clevo NP70HK) laptop review: Mid-range gaming laptop equipped with the RTX 3050 Ti
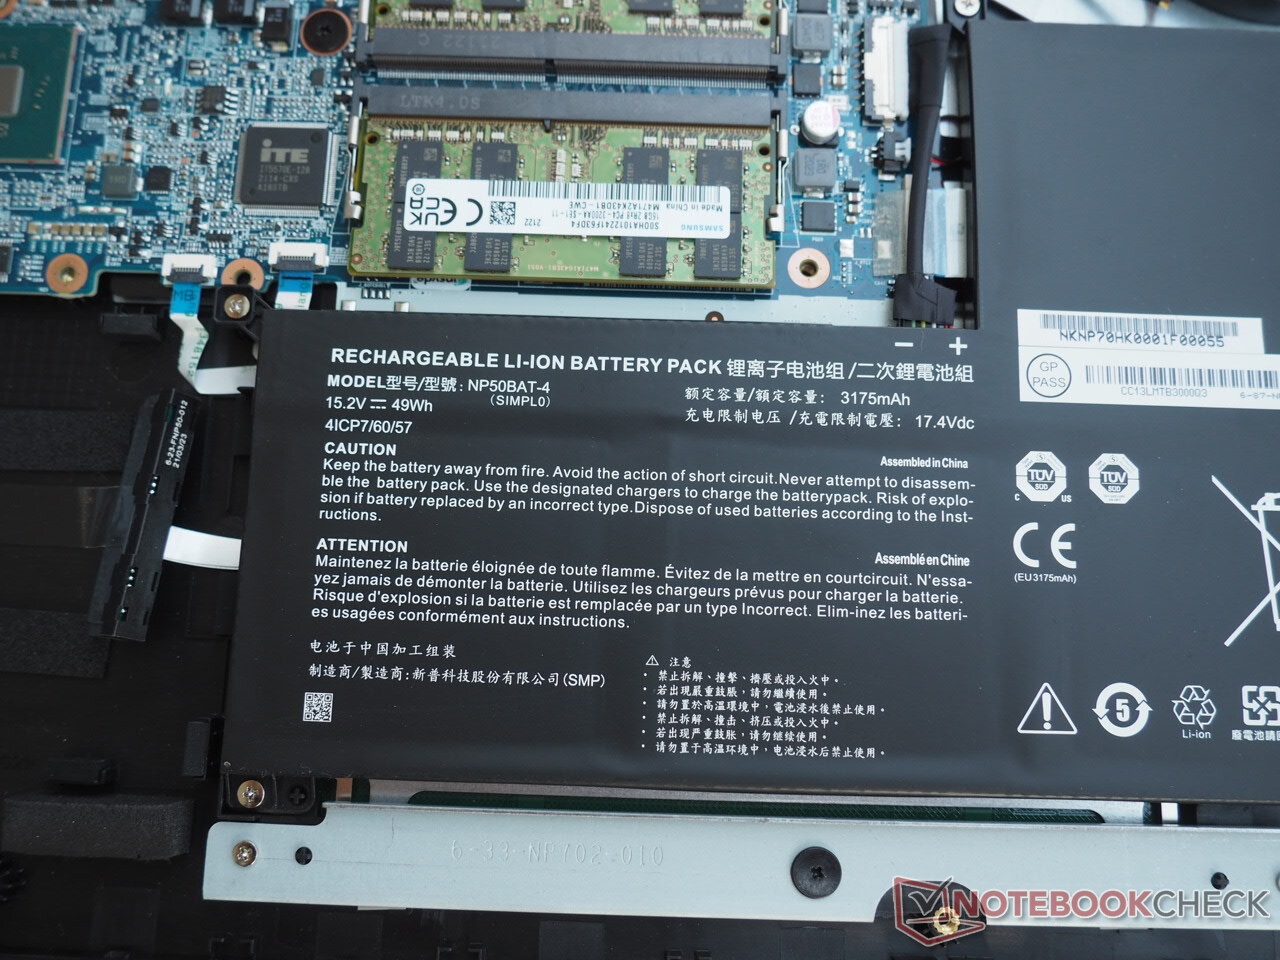
The XMG Focus 17 can be customized on the manufacturer's website bestware.com. In contrast to many other laptops from Schenker Technologies, the configuration options are quite limited. For example, there's currently only one option for the display (Full HD IPS with 144 Hz), the graphics card (GeForce RTX 3050 Ti), and the processor (Core i7-11800H). More options are available when it comes to RAM and storage. While the former ranges from 8 to a maximum of 64 GB, the latter consists of an M.2 SSD and/or a 2.5-inch drive. Mainly due to the 2.5-inch slot, the battery capacity is only 49 Wh. We would've preferred two M.2 slots here for the sake of battery life. Customers also have a choice when it comes to the wireless module, the keyboard language, and the operating system.
In terms of price, the XMG Focus 17 starts at 1,239 Euros (~$1,439). However, our test configuration with 32 GB of dual-channel RAM and a 1 TB SSD comes in at over 1,500 Euros (~$1,743), which is quite a lot for a device with an RTX 3050 Ti.
Competitors include other 17-inchers with an upper mid-range or lower high-end graphics card, such as the Asus ROG Strix G17 G713QE, the Acer Nitro 5 AN517-53, the MSI Katana GF76 11UE, and the Asus TUF F17 FX706HM. All of these laptops appear in the tables as comparison devices.
Note: Since the case and connectivity are mostly identical to the 15-inch version, some text passages have been adapted from the review of the XMG Focus 15 and only modified slightly.
Possible contenders in comparison
Rating | Date | Model | Weight | Height | Size | Resolution | Price |
|---|---|---|---|---|---|---|---|
| 81.3 % v7 (old) | 10 / 2021 | Schenker XMG Focus 17 i7-11800H, GeForce RTX 3050 Ti Laptop GPU | 2.5 kg | 23.5 mm | 17.30" | 1920x1080 | |
| 83.4 % v7 (old) | 08 / 2021 | Asus ROG Strix G17 G713QE-RB74 R7 5800H, GeForce RTX 3050 Ti Laptop GPU | 2.5 kg | 24.6 mm | 17.30" | 1920x1080 | |
| 81.1 % v7 (old) | 08 / 2021 | Acer Nitro 5 AN517-53-54DQ i5-11300H, GeForce RTX 3050 4GB Laptop GPU | 2.6 kg | 25 mm | 17.30" | 1920x1080 | |
| 80.4 % v7 (old) | 06 / 2021 | MSI Katana GF76 11UE i7-11800H, GeForce RTX 3060 Laptop GPU | 2.7 kg | 25.2 mm | 17.30" | 1920x1080 | |
| 82.8 % v7 (old) | 06 / 2021 | Asus TUF Gaming F17 FX706HM i9-11900H, GeForce RTX 3060 Laptop GPU | 2.7 kg | 26 mm | 17.30" | 1920x1080 |
Case
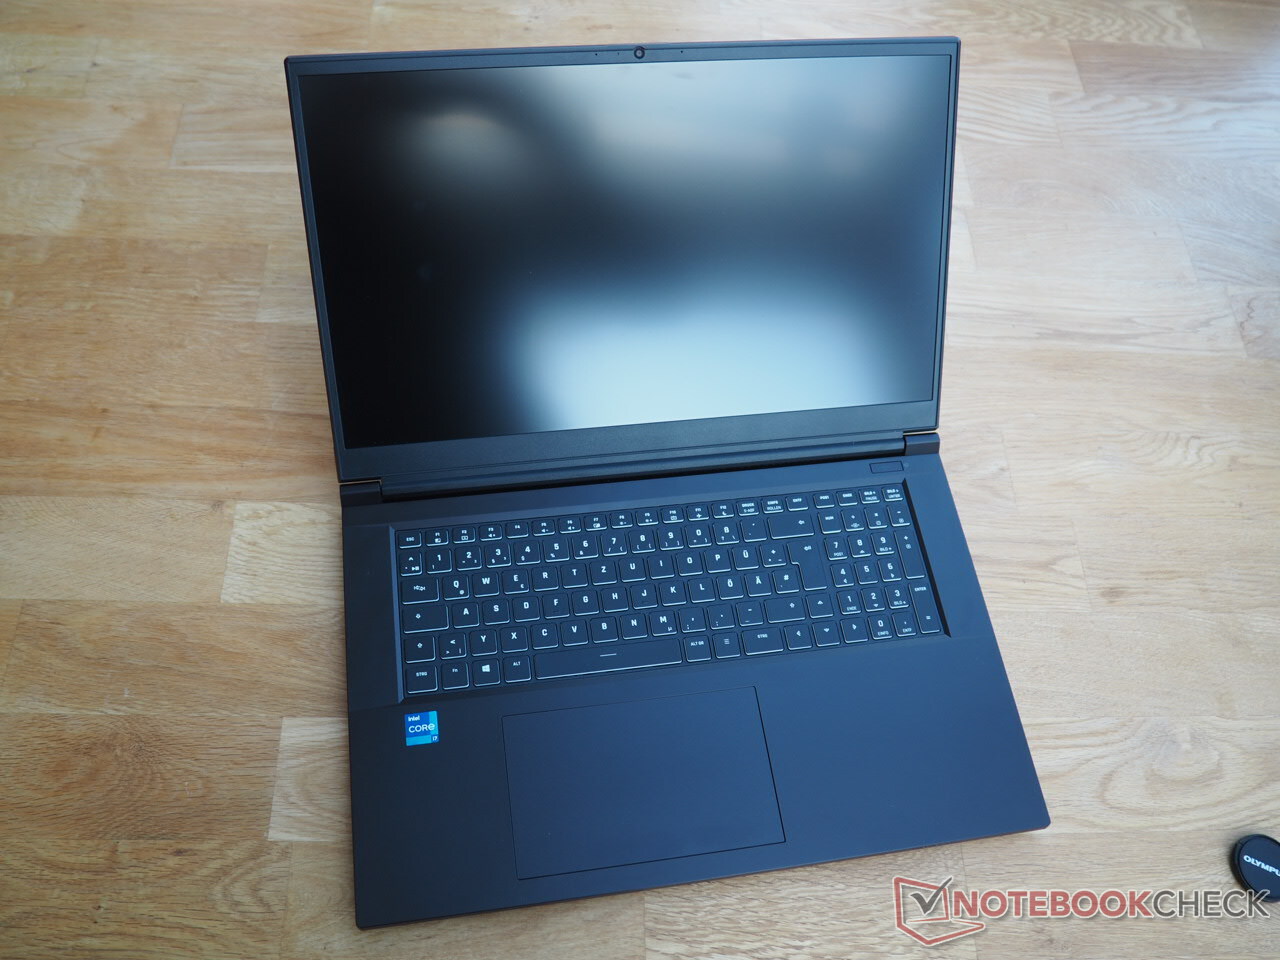
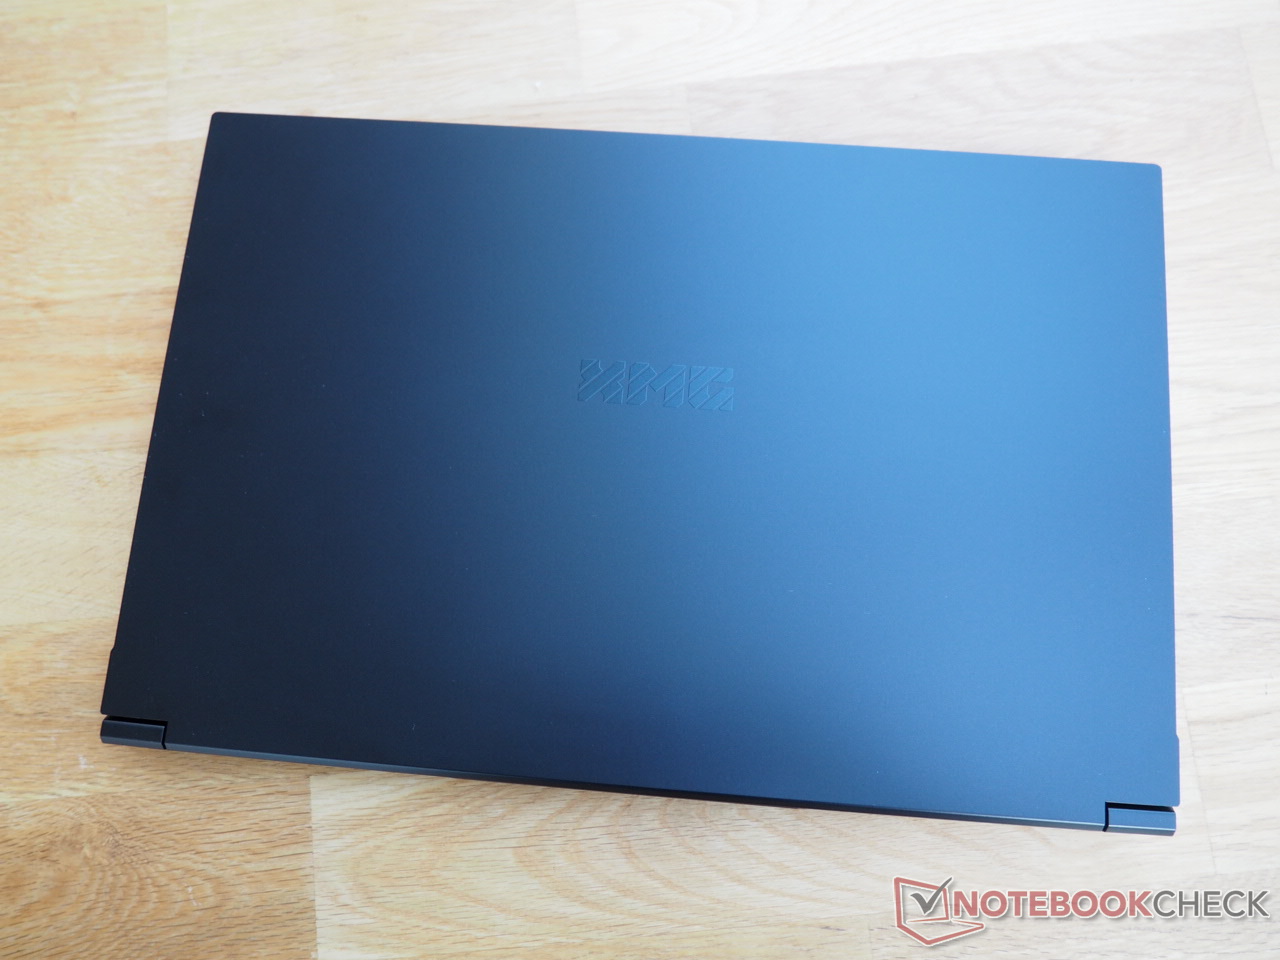
The chassis, which is based on a barebone from Clevo (NP70HK), looks very discreet in almost every respect. Besides the subtle design, the rest of the aspects are also rather unspectacular. The 17-incher has a clean finish and good stability for the most part, but the plastic surfaces flex a bit here and there when stronger pressure is applied, without this becoming bothersome in practice. The hinges also make a solid impression. Although the base unit wobbles a bit when the device is opened, the display can still be opened with one hand.
The weight of around 2.5 kg is average. The competition weighs between 2.5 and 2.7 kg. The Focus 17 has the lowest build height with 23.5 mm.
Connectivity
Ports
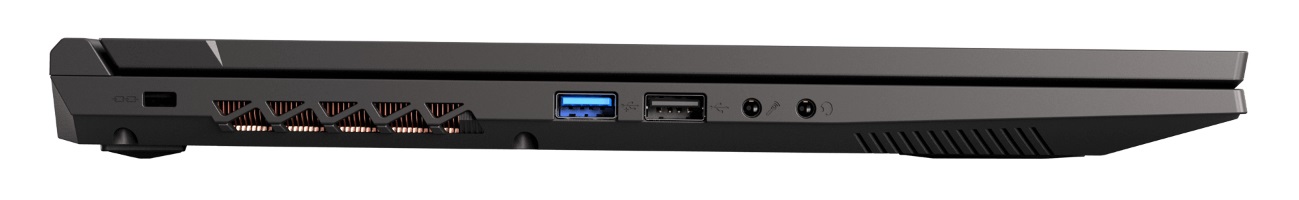
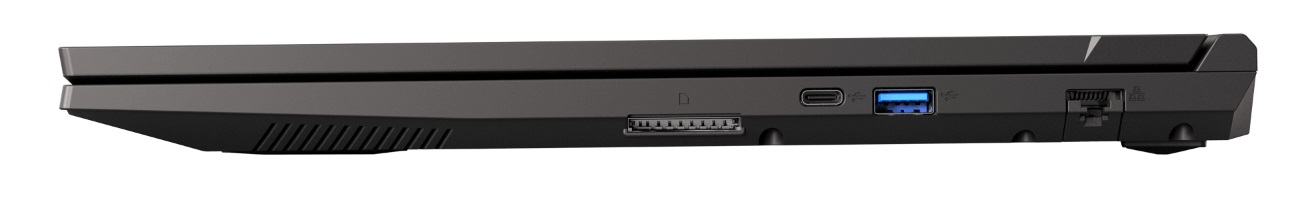
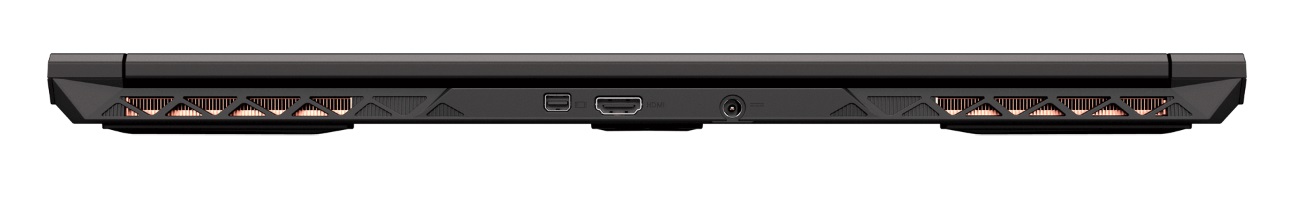
Users who can do without Thunderbolt should be satisfied with the Focus 17's connectivity. While a Kensington lock, two USB-A ports (1x 2.0, 1x 3.0), and two audio jacks for microphones and headsets are found on the left side, a full-fledged card reader, a USB-C port (3.2 Gen 2), another USB-A port (3.0), and an RJ45 port with a retractable mechanism are found on the right side. Finally, the power supply and image outputs (HDMI 2.0, Mini DisplayPort 1.4) are located on the back.
Since some interfaces are placed towards the rear, and the USB ports are nicely distributed, there should be enough elbowroom to use an external mouse.
SD card reader
The built-in card reader, which supports the SD, SDHC, and SDXC formats, provides a moderate performance. You can expect around 80 to 90 MB/s for sequential reading and photo transfers. Theoretically, our 128 GB AV Pro V60 reference card can reach over 200 MB/s. All other competitors have to make do without a card reader.
| SD Card Reader | |
| average JPG Copy Test (av. of 3 runs) | |
| Average of class Gaming (20 - 210, n=63, last 2 years) | |
| Schenker XMG Focus 17 (AV PRO microSD 128 GB V60) | |
| maximum AS SSD Seq Read Test (1GB) | |
| Average of class Gaming (25.5 - 261, n=60, last 2 years) | |
| Schenker XMG Focus 17 (AV PRO microSD 128 GB V60) | |
Communication
Our test device had an Intel Wi-Fi 6 AX201 on board as wireless module, which supports Bluetooth 5.1 in addition to the WLAN 802.11a/b/g/n/ac/ax standard. When tested at a distance of 1 m from the Netgear Nighthawk AX12 reference router, the Focus 17 only performed moderately with just under 900 Mb/s when sending data. On the other hand, around 1,300 Mb/s is a good rate for receiving data.
Webcam
As usual, you shouldn't expect too much from the webcam. The image sharpness and color reproduction are rather modest.


Accessories
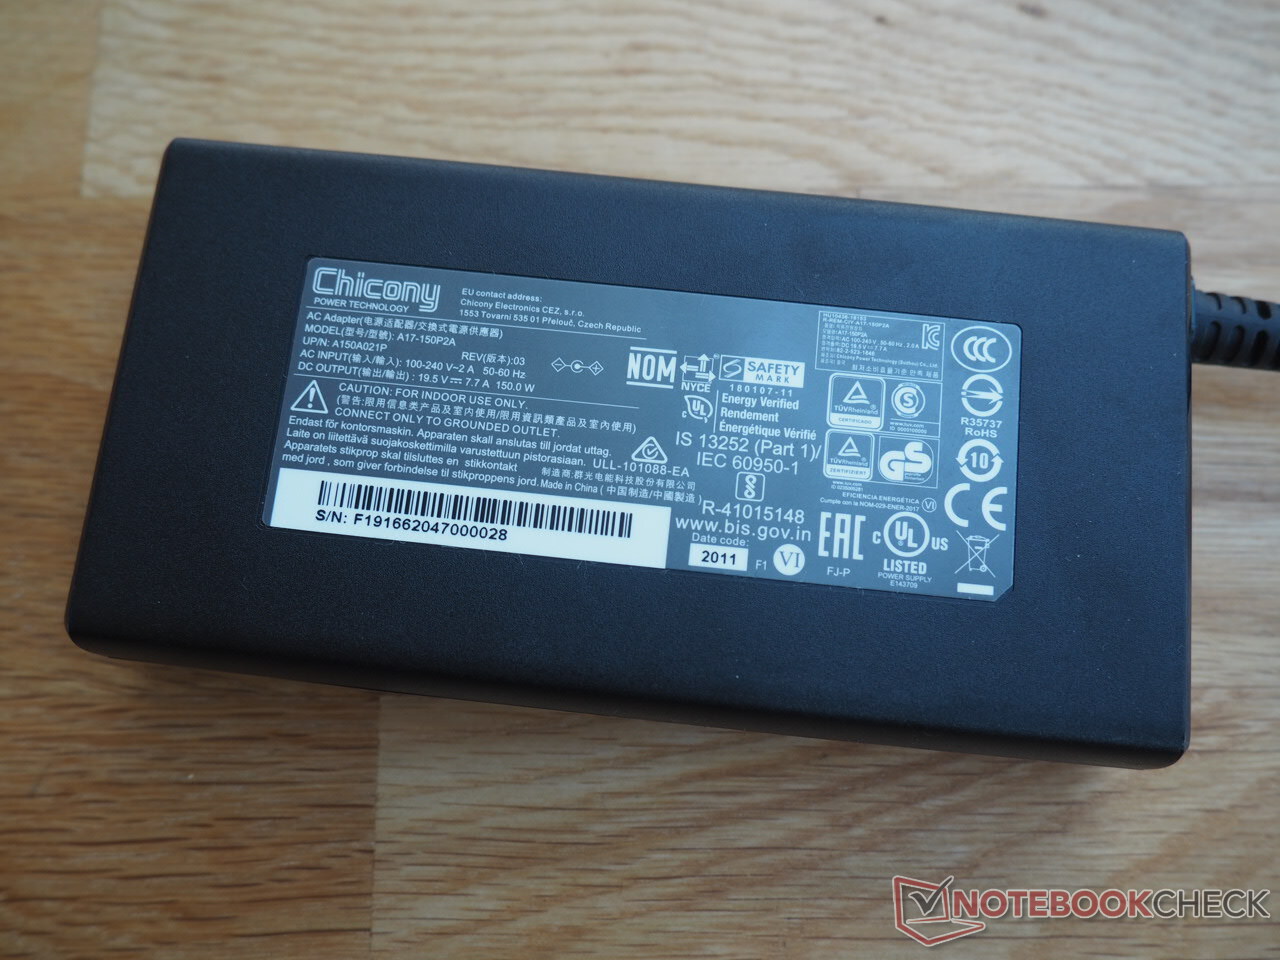
The contents included in the box are a quick-start guide, a DVD with drivers, a USB stick with software, and screws for the 2.5-inch slot. A pleasingly light and compact 150-watt model serves as the Focus 17's power adapter.
Maintenance
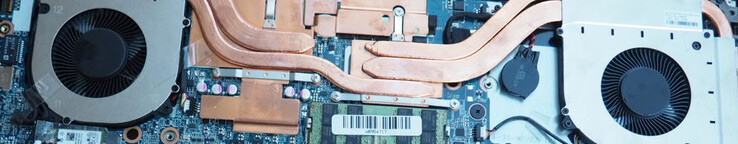
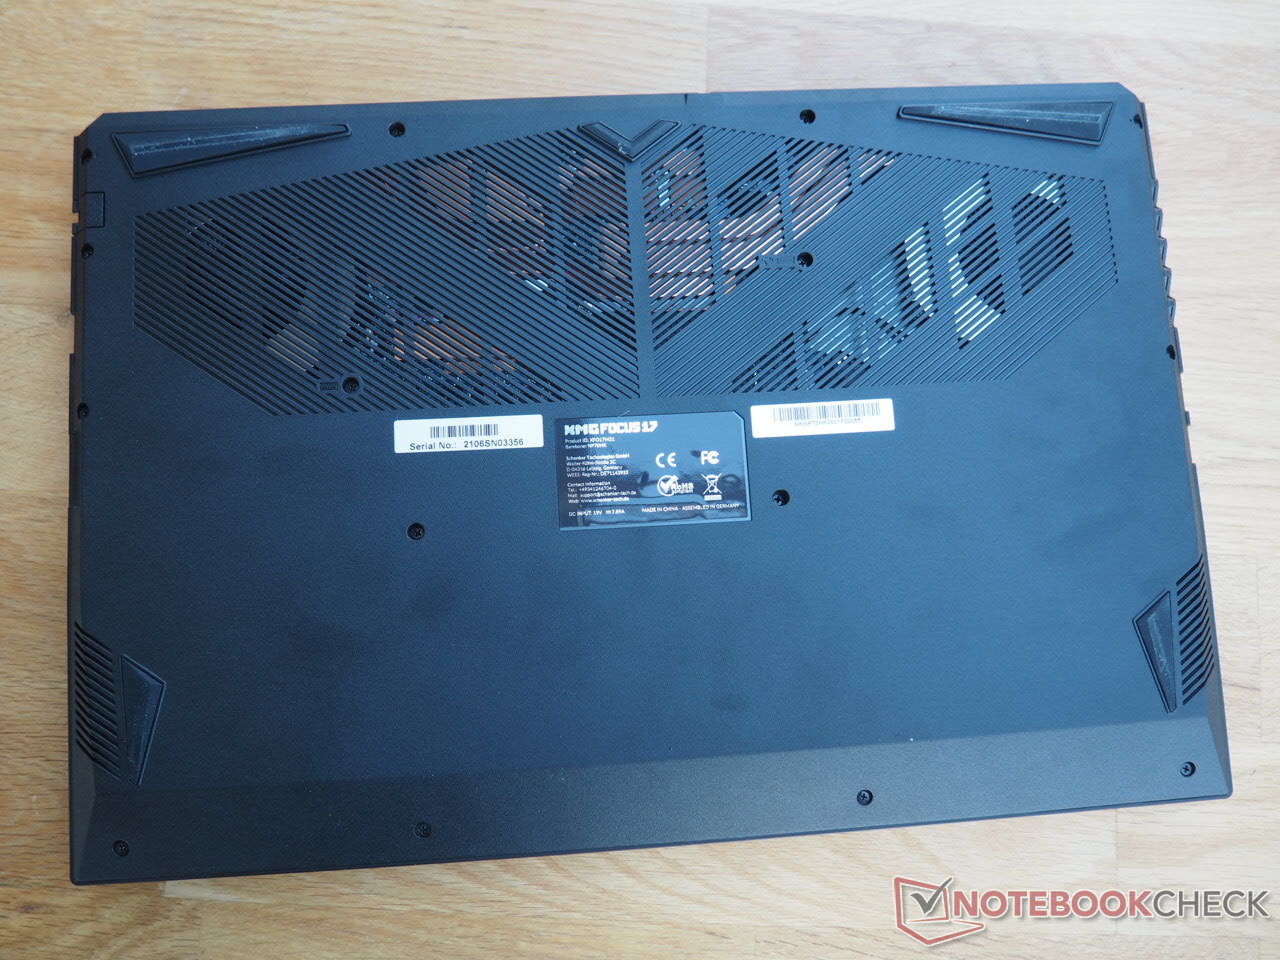
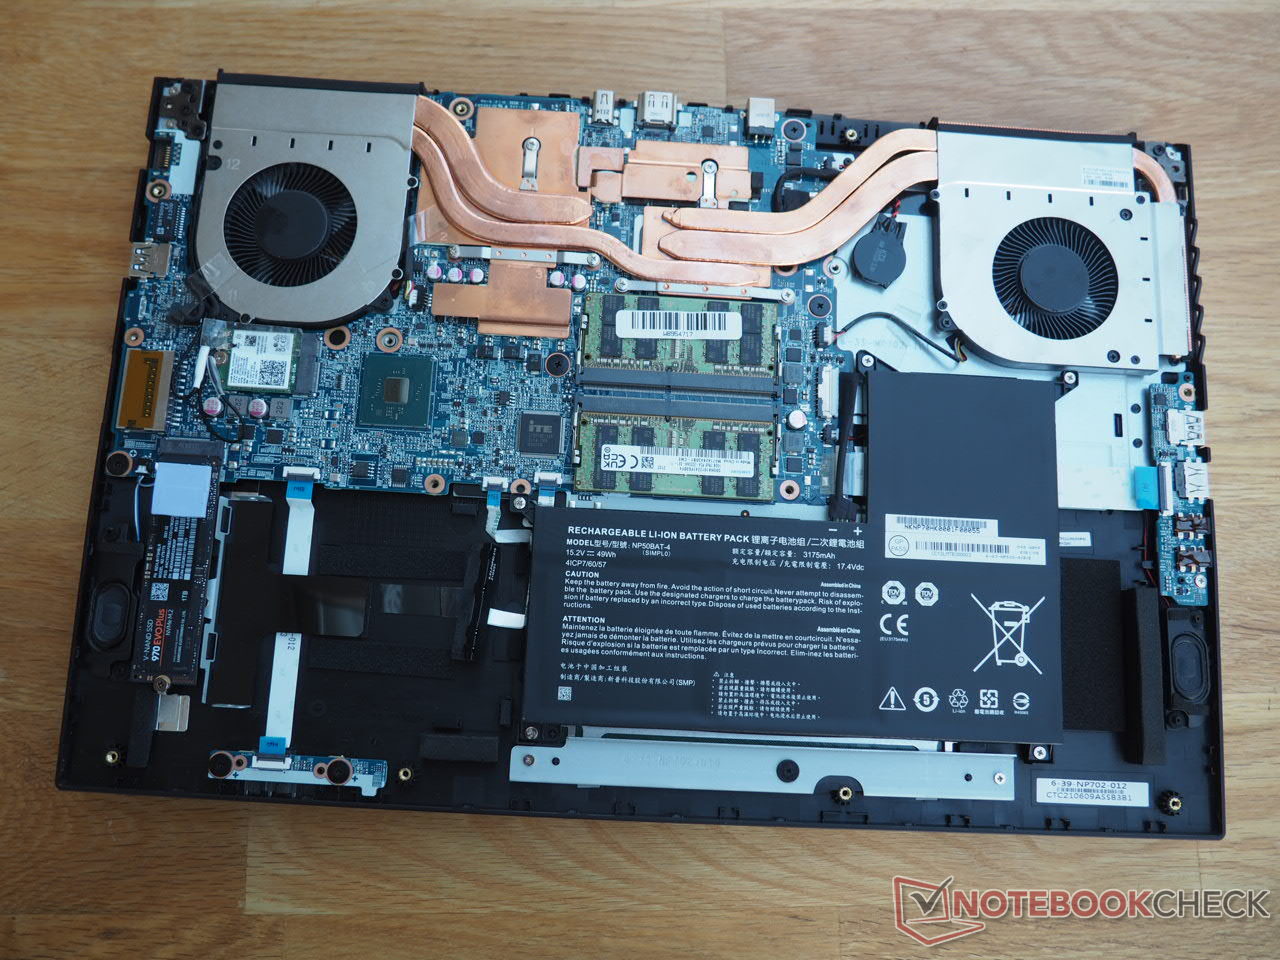
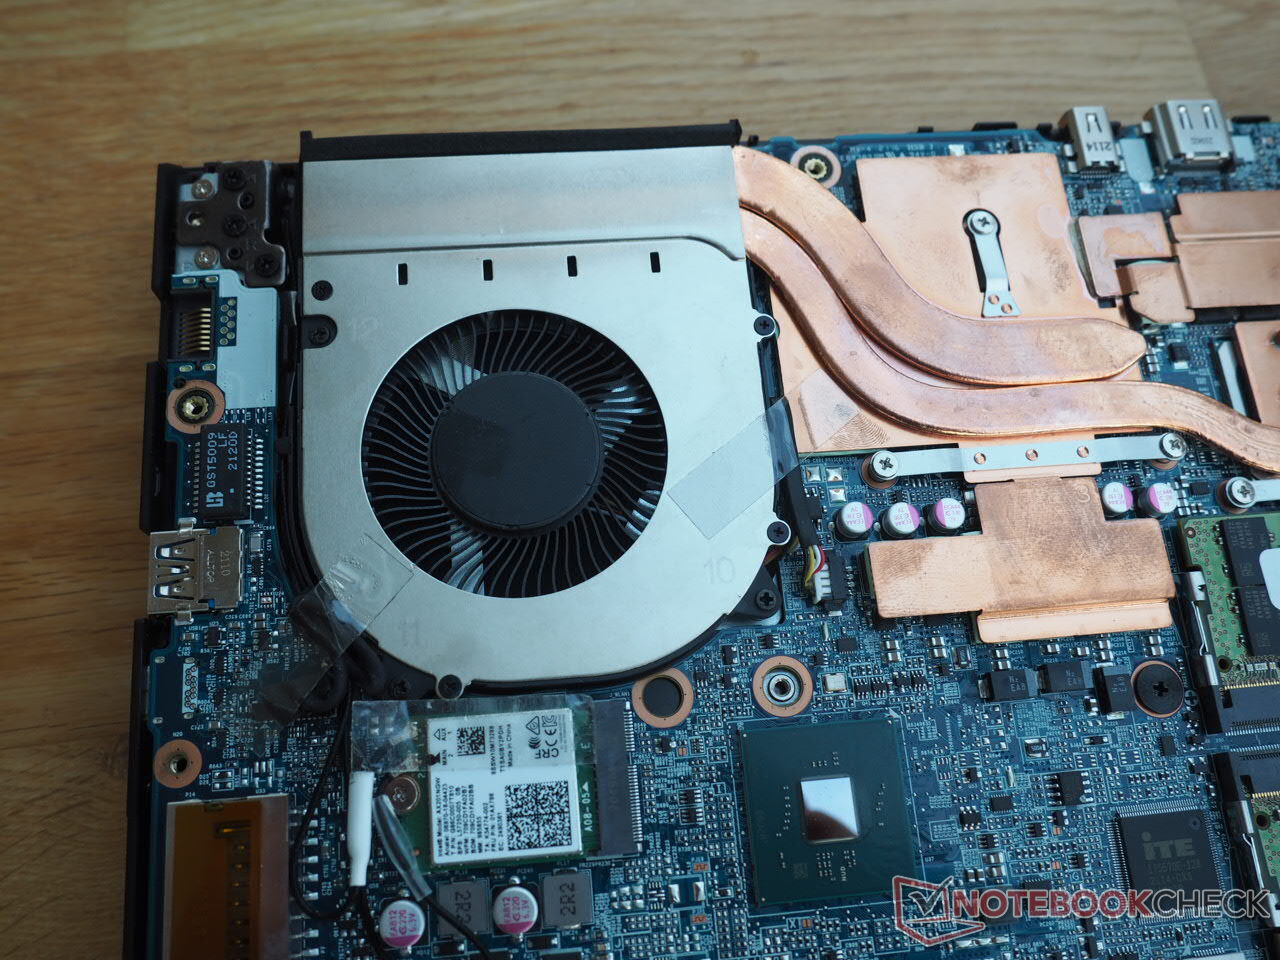
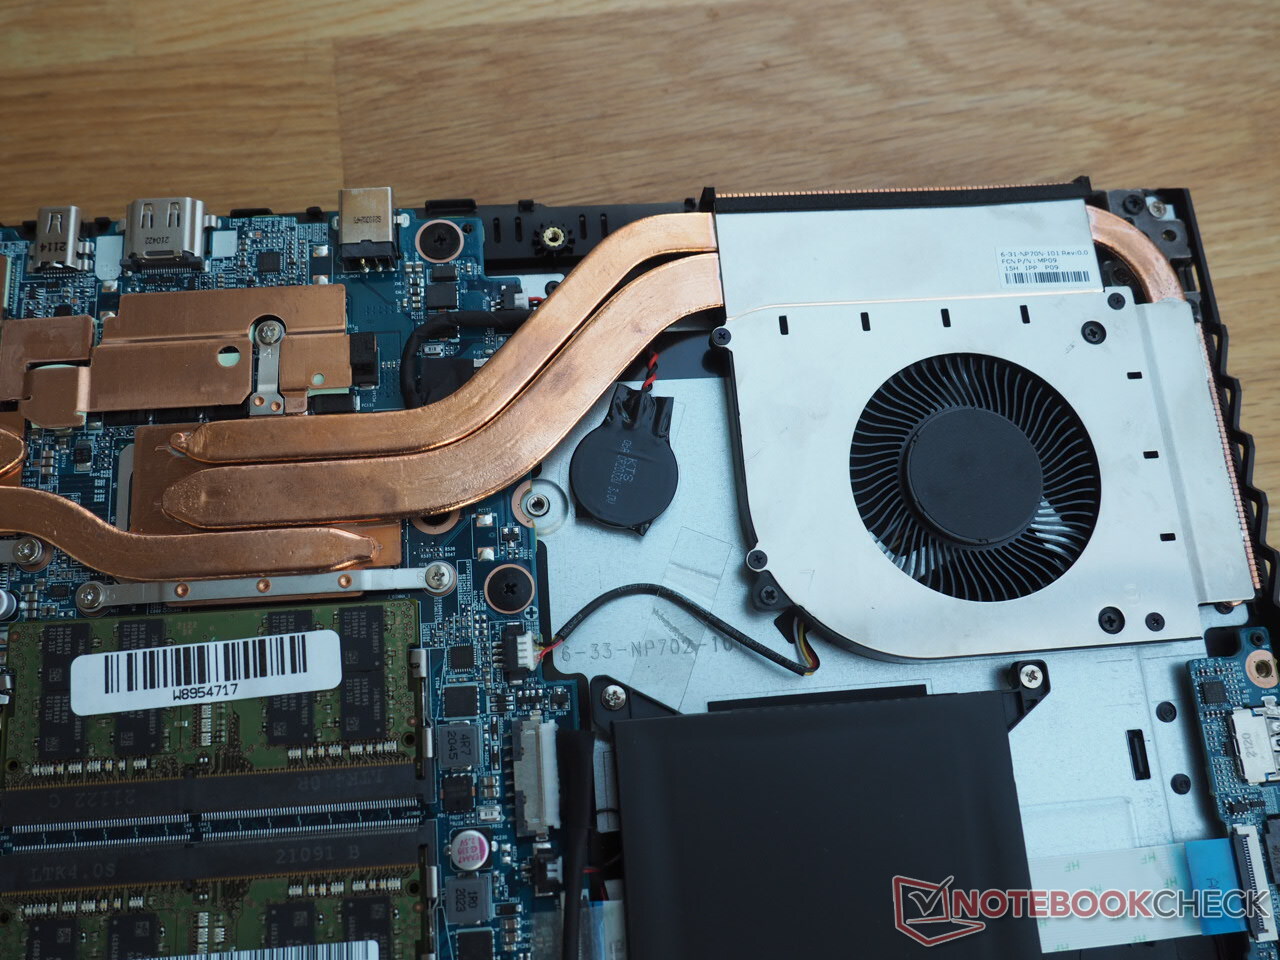
To access the interior, you have to remove a total of 15 screws from the bottom of the base unit. The bottom cover can then be taken off with very little effort. As is typical for Clevo, the maintenance options are impressive. Besides the battery, the WLAN module, and the RAM, the M.2 slot and the 2.5-inch slot can also be accessed. The cooling system consists of two fans, with several heat pipes running towards the CPU and GPU (both soldered and therefore not replaceable).
Warranty
The base warranty covers a two-year period (six months of quick repair). Up to three years with quick repair included over the entire period is available for an additional charge.
Input devices
Keyboard
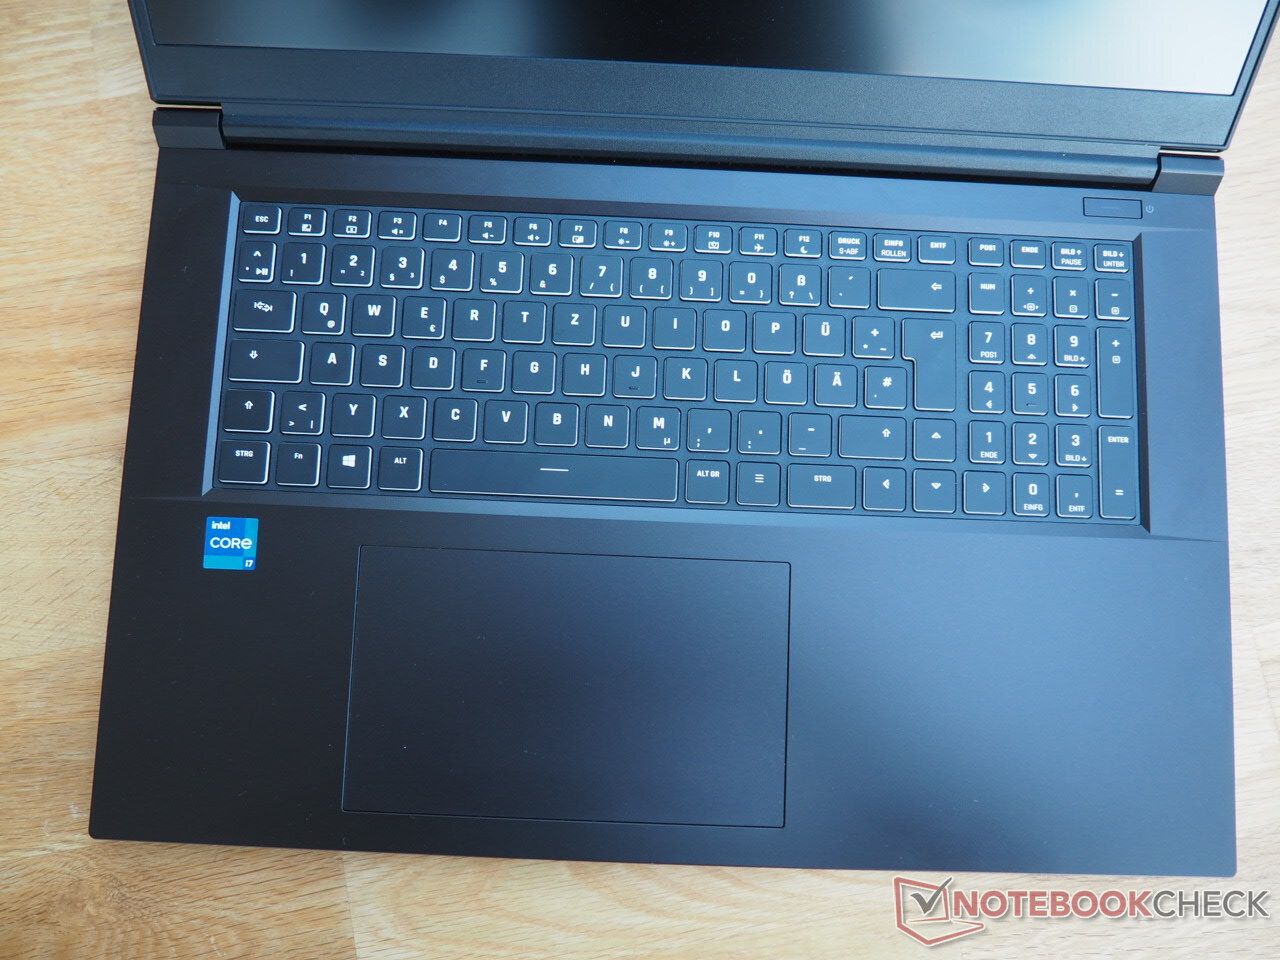
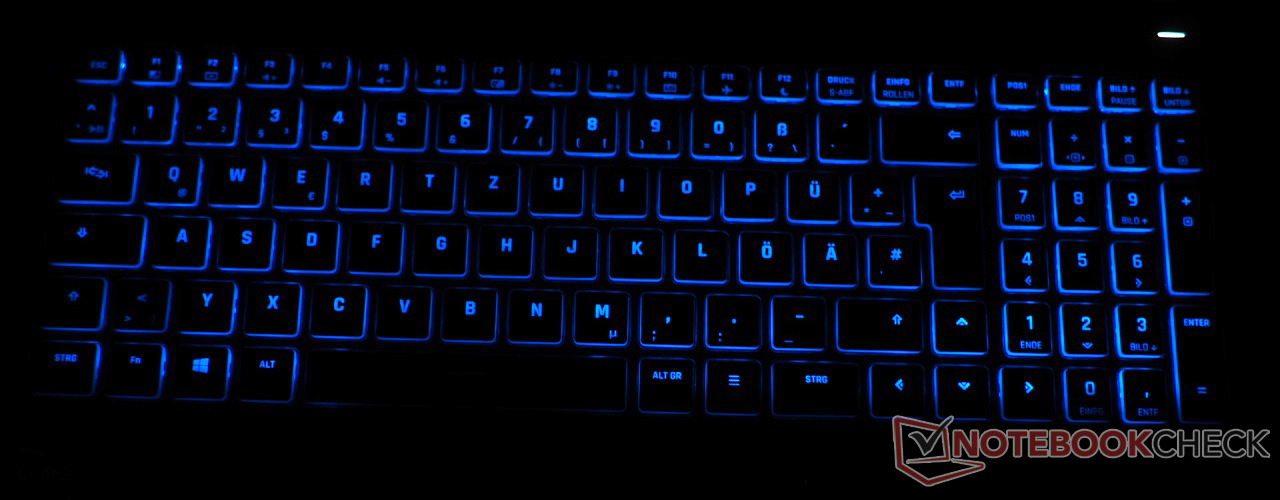
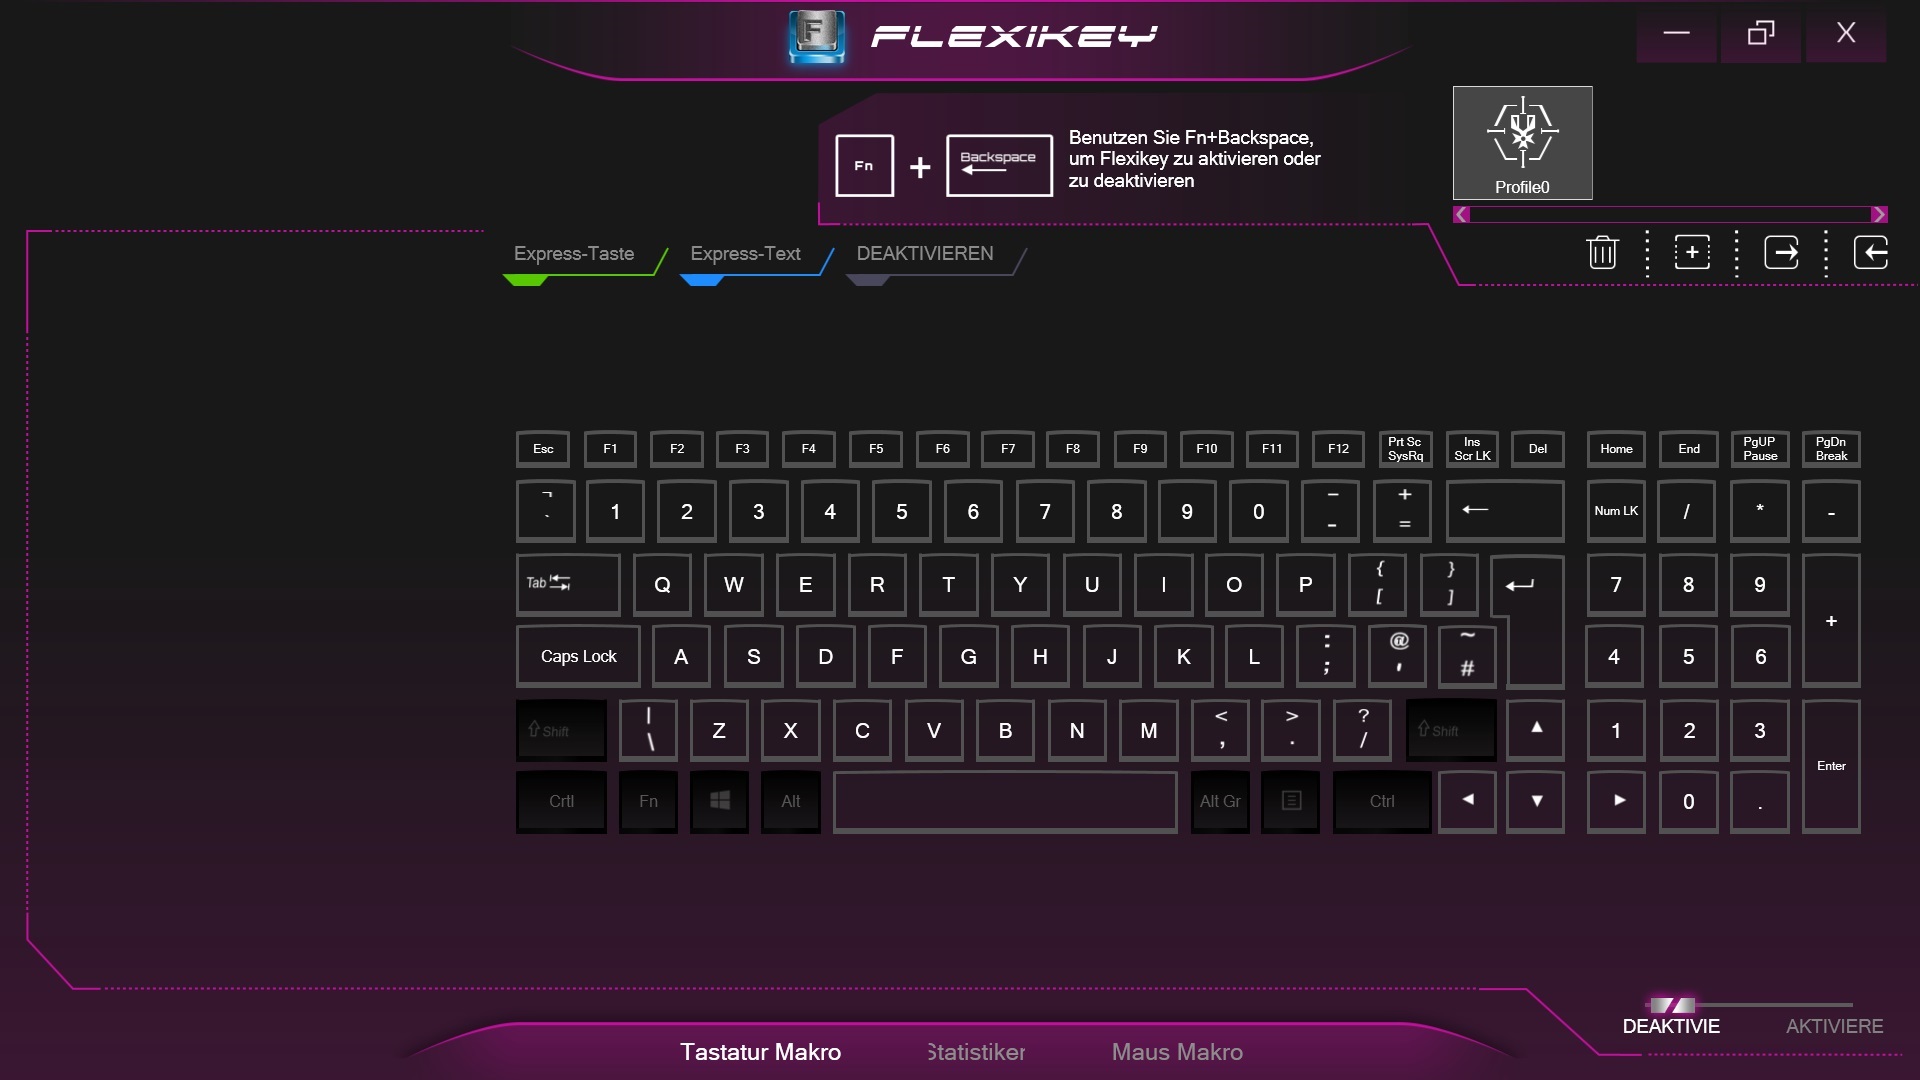
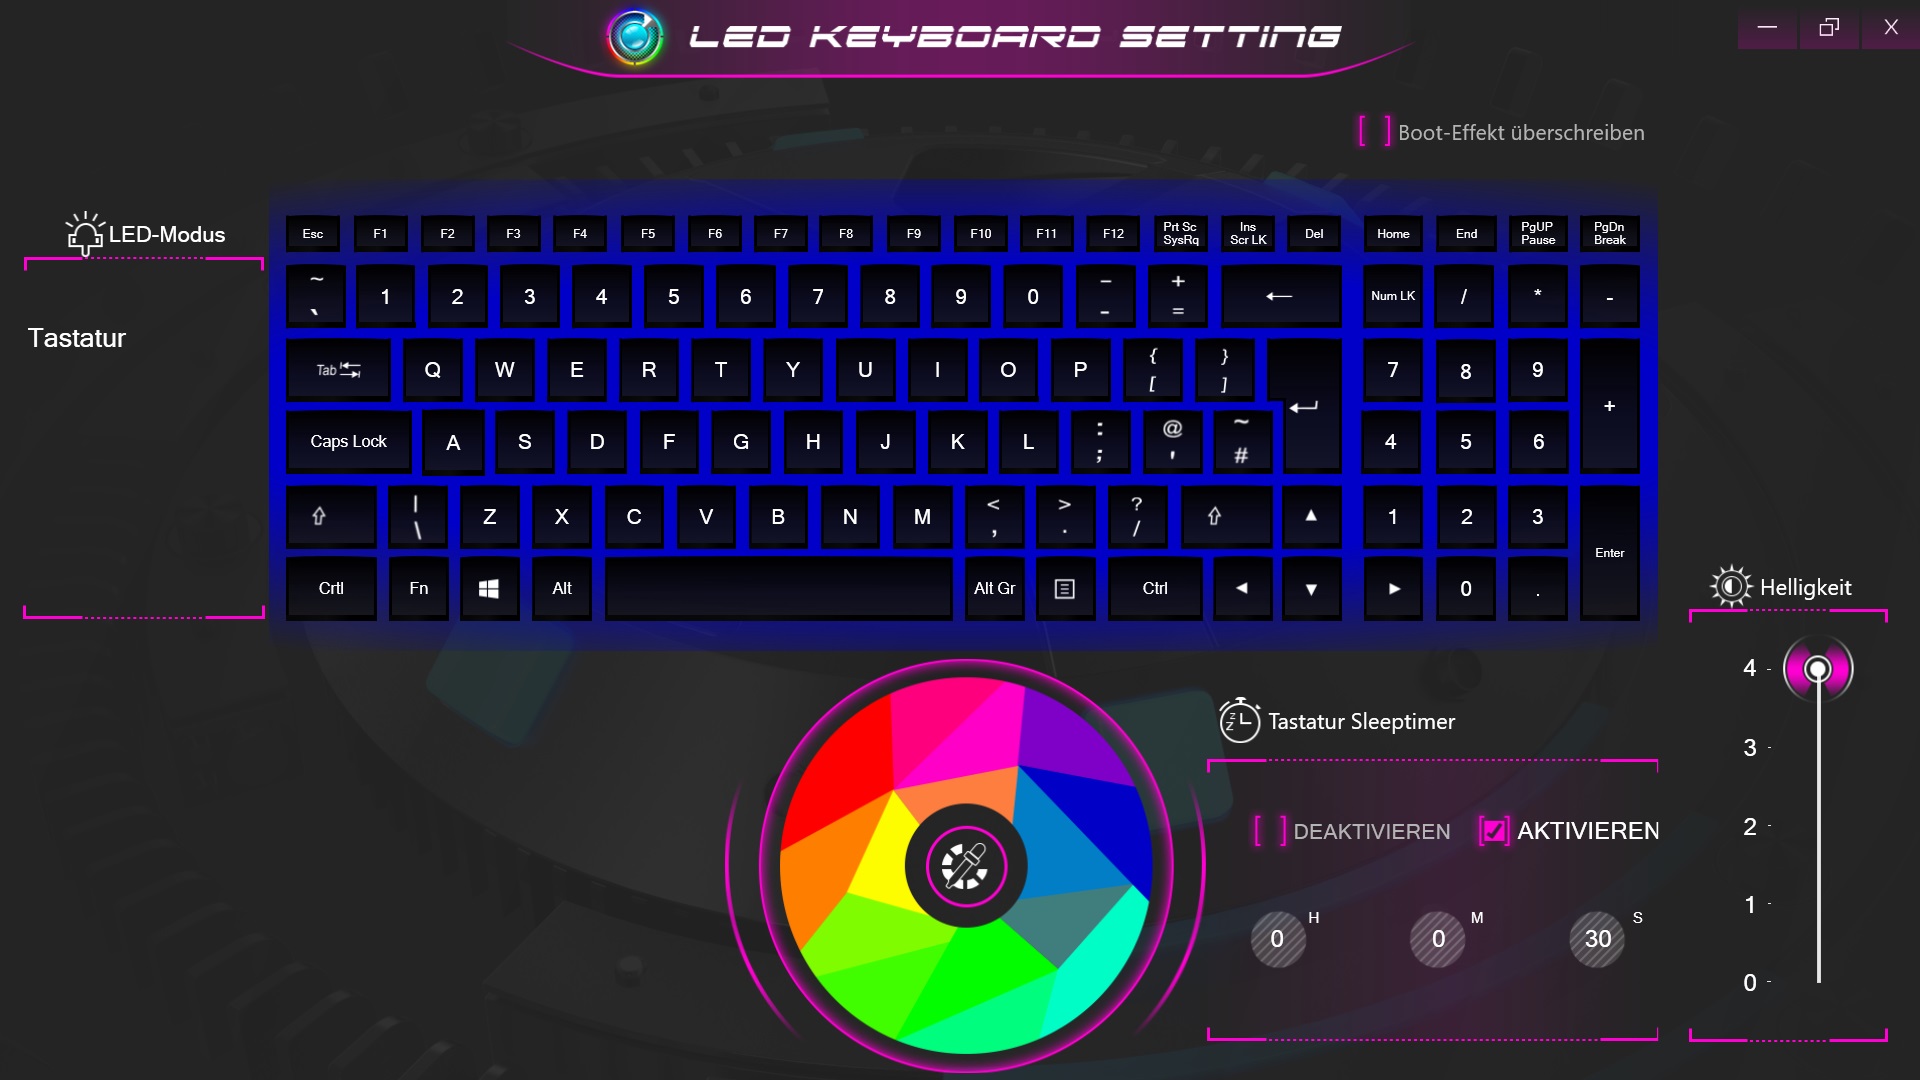
We're already familiar with this keyboard from other Clevo barebones. The chiclet model, which can be illuminated in several colors and levels, provides a dedicated number pad as well as a quite good typing experience. Customers will also be pleased with the comfortable key size. In addition to the WASD keys, the direction arrows are also decently sized. The typing noise is average, so it's neither quiet nor particularly loud. A nice feature: The palm rest is very ample thanks to the keyboard's high position.
Touchpad
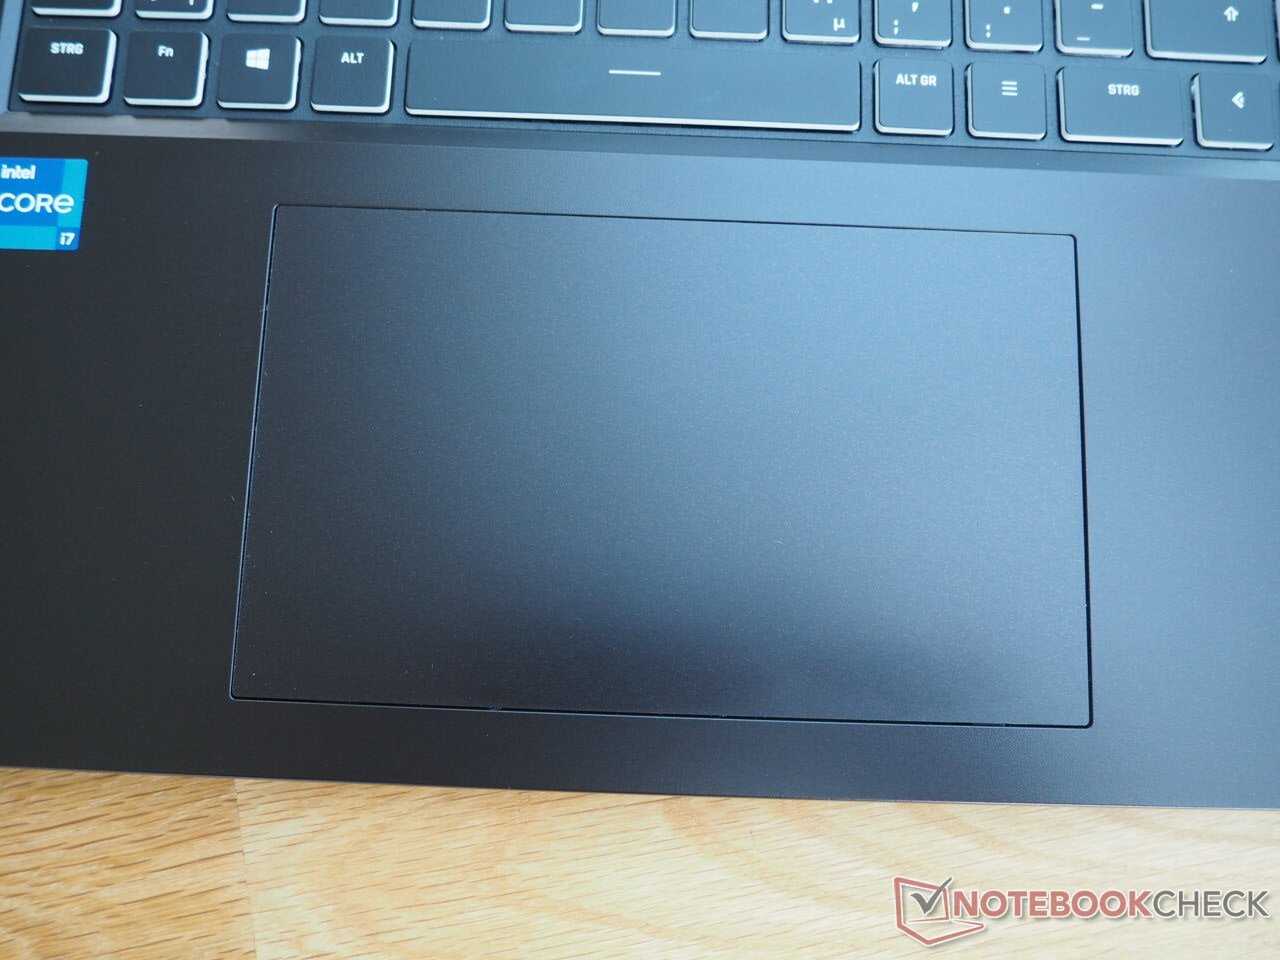
The touchpad is also impressive. 15 x 9 cm is a huge surface for a 17-inch laptop. Following the latest trend, this is a ClickPad without dedicated buttons. The sleek surface and good precision provide for a very smooth experience with the mouse. On the other hand, the manufacturer needs to improve in terms of stability. The mouse replacement can be pressed in excessively at the left and right edges in particular. The same problem affects the 15-inch counterpart too.
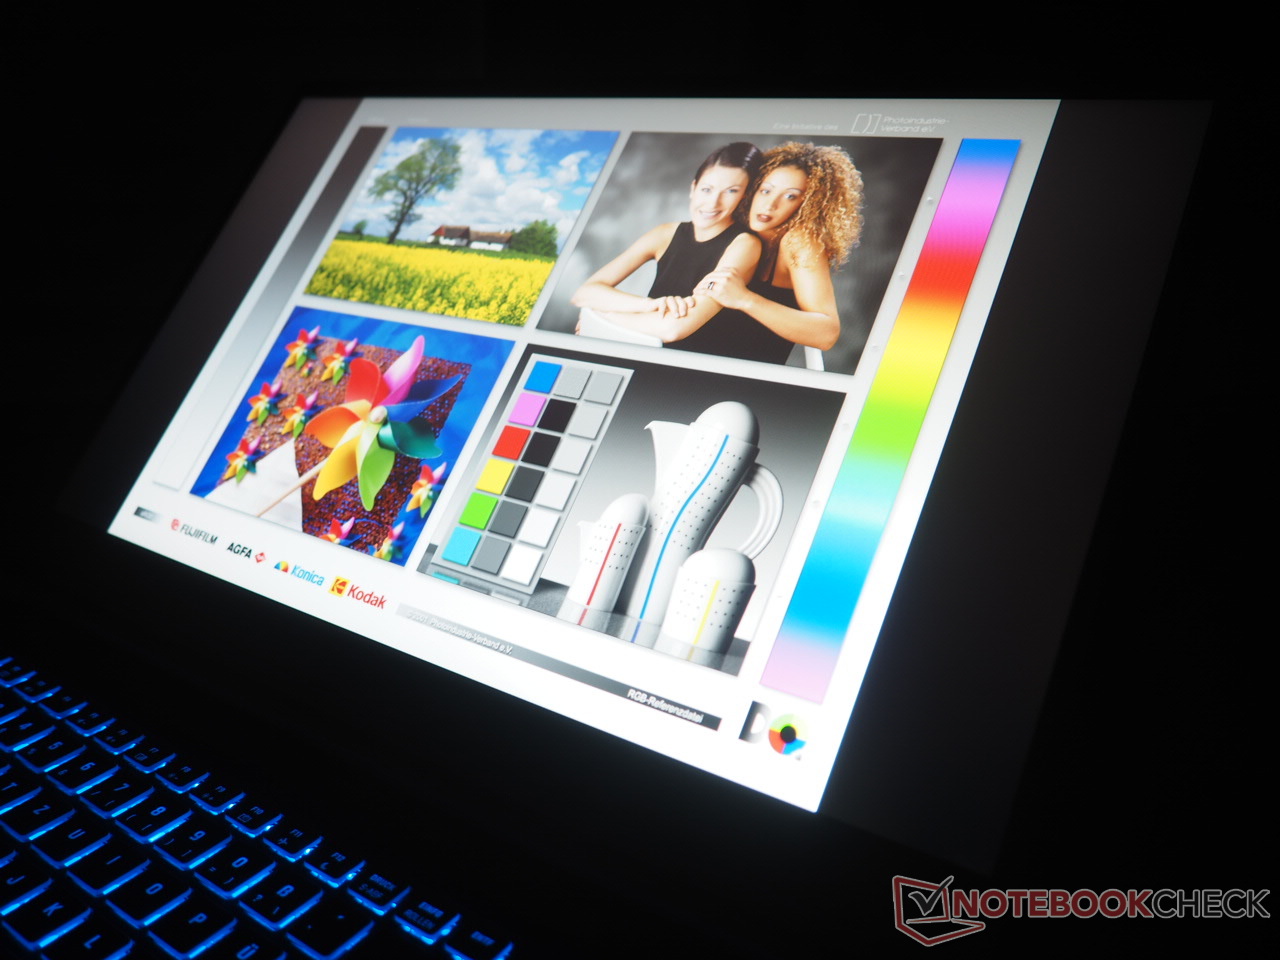
Display
A traditional IPS panel with a resolution of 1920x1080 pixels and a frequency of 144 Hz takes care of image reproduction.
| |||||||||||||||||||||||||
Brightness Distribution: 89 %
Center on Battery: 309 cd/m²
Contrast: 1545:1 (Black: 0.2 cd/m²)
ΔE ColorChecker Calman: 3.04 | ∀{0.5-29.43 Ø4.76}
calibrated: 0.94
ΔE Greyscale Calman: 4.5 | ∀{0.09-98 Ø5}
66.1% AdobeRGB 1998 (Argyll 3D)
96.4% sRGB (Argyll 3D)
64.9% Display P3 (Argyll 3D)
Gamma: 2.159
CCT: 7786 K
| Schenker XMG Focus 17 LG Philips LP173WFG-SPB3, IPS, 1920x1080, 17.3" | Asus ROG Strix G17 G713QE-RB74 AU Optronics B173HAN04.9, IPS, 1920x1080, 17.3" | Acer Nitro 5 AN517-53-54DQ BOE NV173FHM-NX4 (BOE09B4), IPS, 1920x1080, 17.3" | MSI Katana GF76 11UE AU Optronics B173HAN04.9, IPS, 1920x1080, 17.3" | Asus TUF Gaming F17 FX706HM AU Optronics AUI8294 (B173HAN04.9), IPS, 1920x1080, 17.3" | |
|---|---|---|---|---|---|
| Display | -37% | -43% | -38% | -38% | |
| Display P3 Coverage (%) | 64.9 | 40.2 -38% | 36.7 -43% | 39.8 -39% | 40.1 -38% |
| sRGB Coverage (%) | 96.4 | 60.3 -37% | 55 -43% | 59.5 -38% | 60 -38% |
| AdobeRGB 1998 Coverage (%) | 66.1 | 41.6 -37% | 37.9 -43% | 41.12 -38% | 41.4 -37% |
| Response Times | -74% | -66% | -137% | -107% | |
| Response Time Grey 50% / Grey 80% * (ms) | 15.2 ? | 26.8 ? -76% | 24.8 ? -63% | 36.8 ? -142% | 32.4 -113% |
| Response Time Black / White * (ms) | 11.2 ? | 19.2 ? -71% | 18.8 ? -68% | 26 ? -132% | 22.4 -100% |
| PWM Frequency (Hz) | |||||
| Screen | -26% | -65% | -54% | -43% | |
| Brightness middle (cd/m²) | 309 | 270.5 -12% | 286 -7% | 260 -16% | 266 -14% |
| Brightness (cd/m²) | 301 | 269 -11% | 261 -13% | 251 -17% | 264 -12% |
| Brightness Distribution (%) | 89 | 92 3% | 83 -7% | 85 -4% | 79 -11% |
| Black Level * (cd/m²) | 0.2 | 0.19 5% | 0.23 -15% | 0.26 -30% | 0.32 -60% |
| Contrast (:1) | 1545 | 1424 -8% | 1243 -20% | 1000 -35% | 831 -46% |
| Colorchecker dE 2000 * | 3.04 | 4.39 -44% | 4.92 -62% | 3.9 -28% | 3.97 -31% |
| Colorchecker dE 2000 max. * | 9.05 | 20.8 -130% | 19.29 -113% | 20.64 -128% | 8.93 1% |
| Colorchecker dE 2000 calibrated * | 0.94 | 1.56 -66% | 4.73 -403% | 3.71 -295% | 3.5 -272% |
| Greyscale dE 2000 * | 4.5 | 3.1 31% | 1.9 58% | 1.6 64% | 1.8 60% |
| Gamma | 2.159 102% | 2.14 103% | 2.175 101% | 2.068 106% | 2.31 95% |
| CCT | 7786 83% | 6927 94% | 6782 96% | 6511 100% | 6754 96% |
| Color Space (Percent of AdobeRGB 1998) (%) | 41.4 | ||||
| Color Space (Percent of sRGB) (%) | 60 | ||||
| Total Average (Program / Settings) | -46% /
-35% | -58% /
-60% | -76% /
-63% | -63% /
-51% |
* ... smaller is better
Looking at the positive aspects, we have to mention the good contrast ratio. 1,545:1 is the best rate in the test field, closely followed by the Asus Strix G17 with 1,424:1. The black level of 0.2 cd/m² doesn't need to shy away from the competition, either.
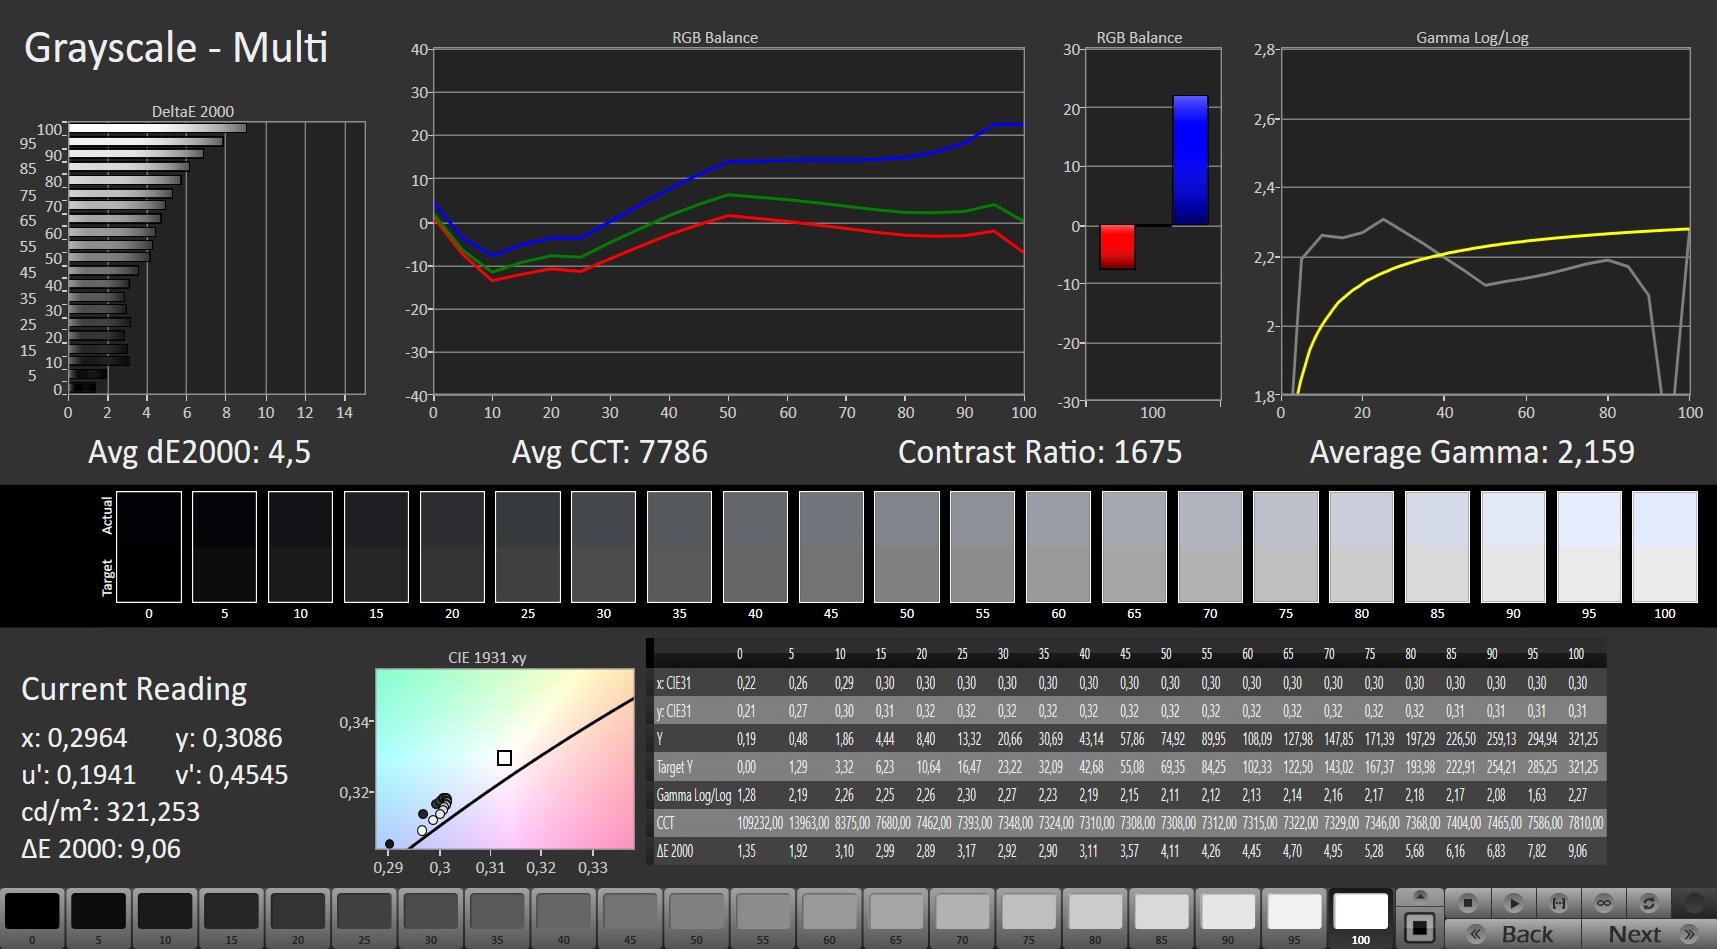
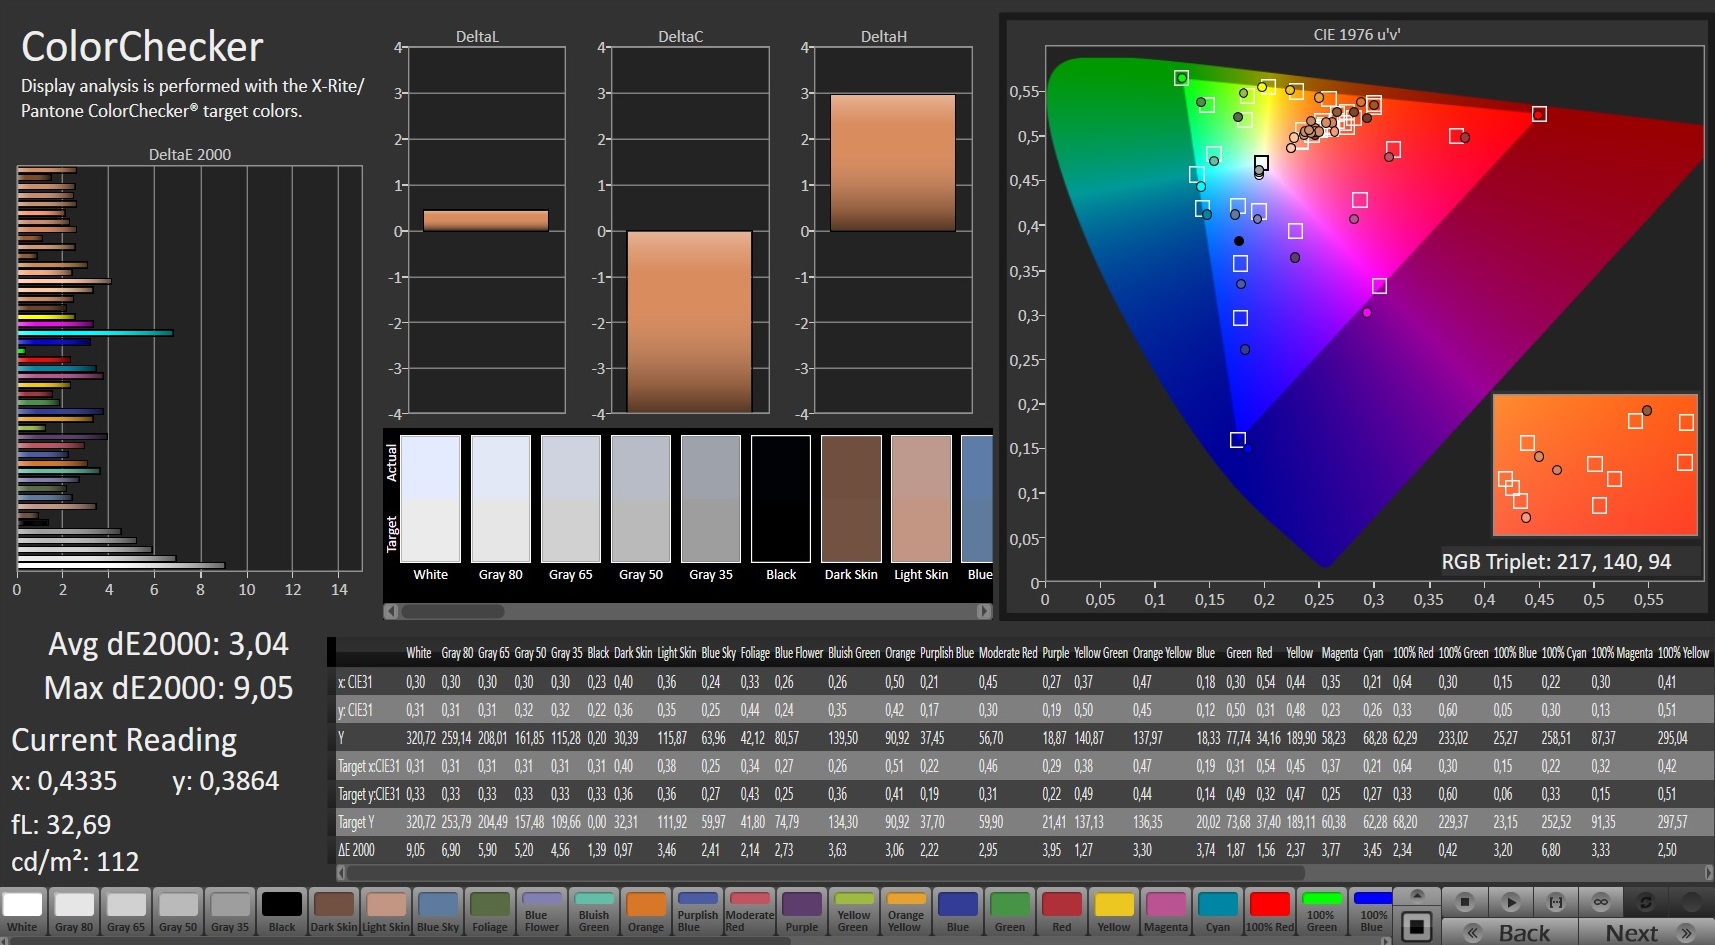
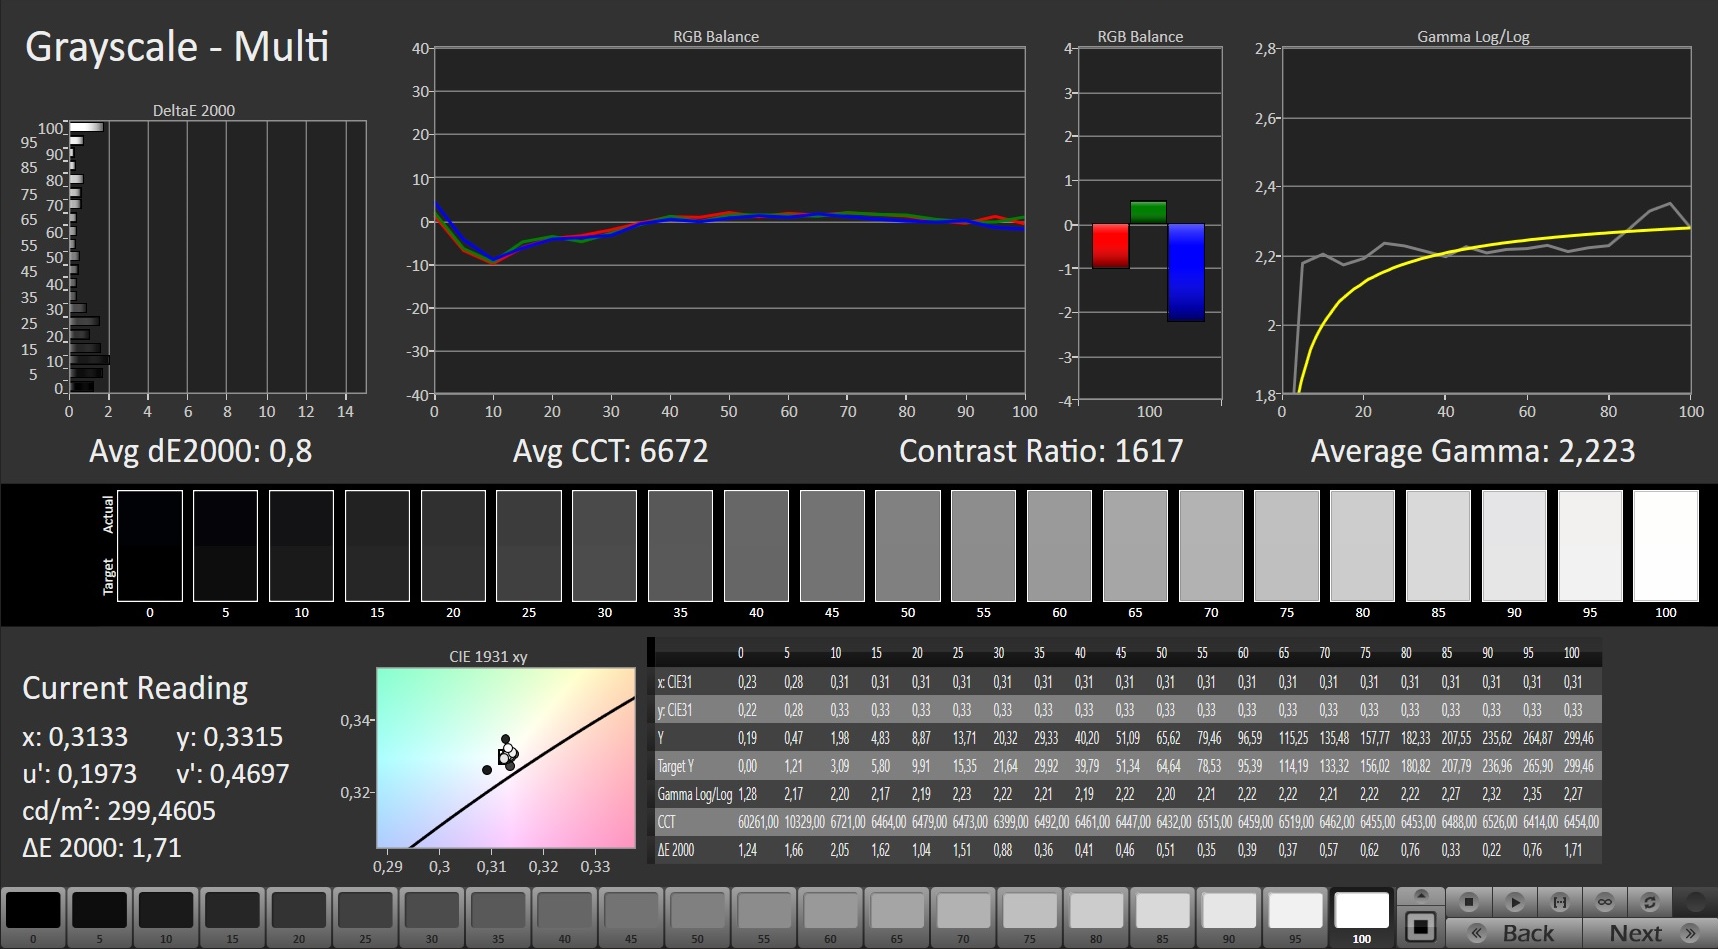
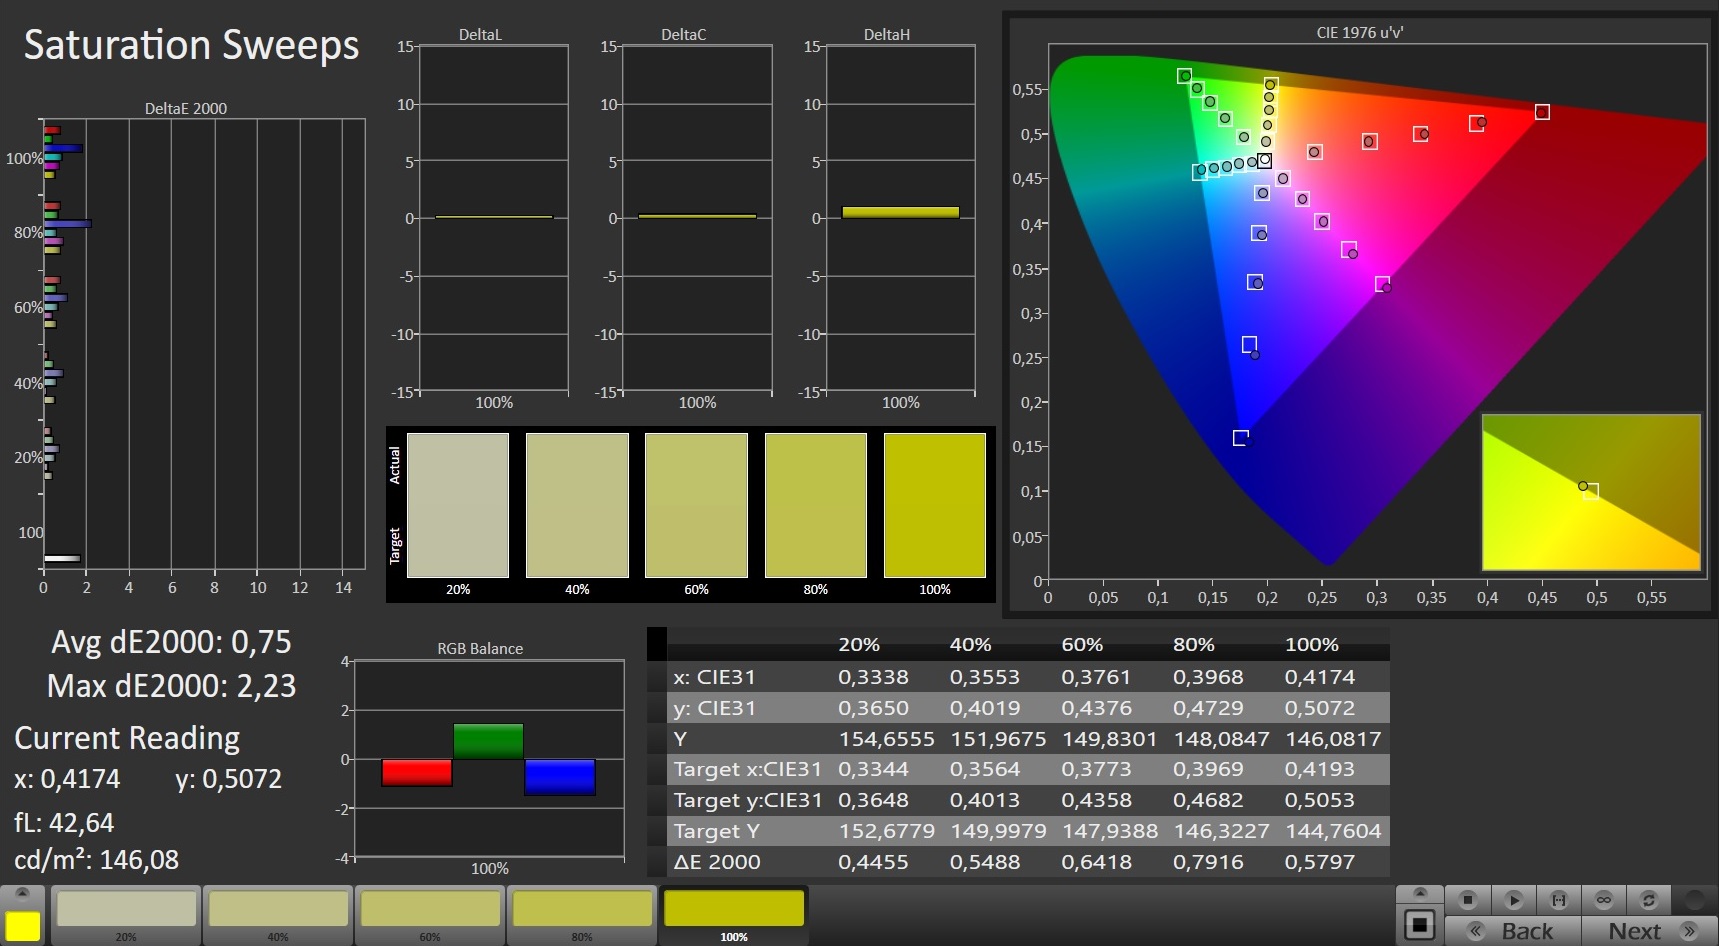
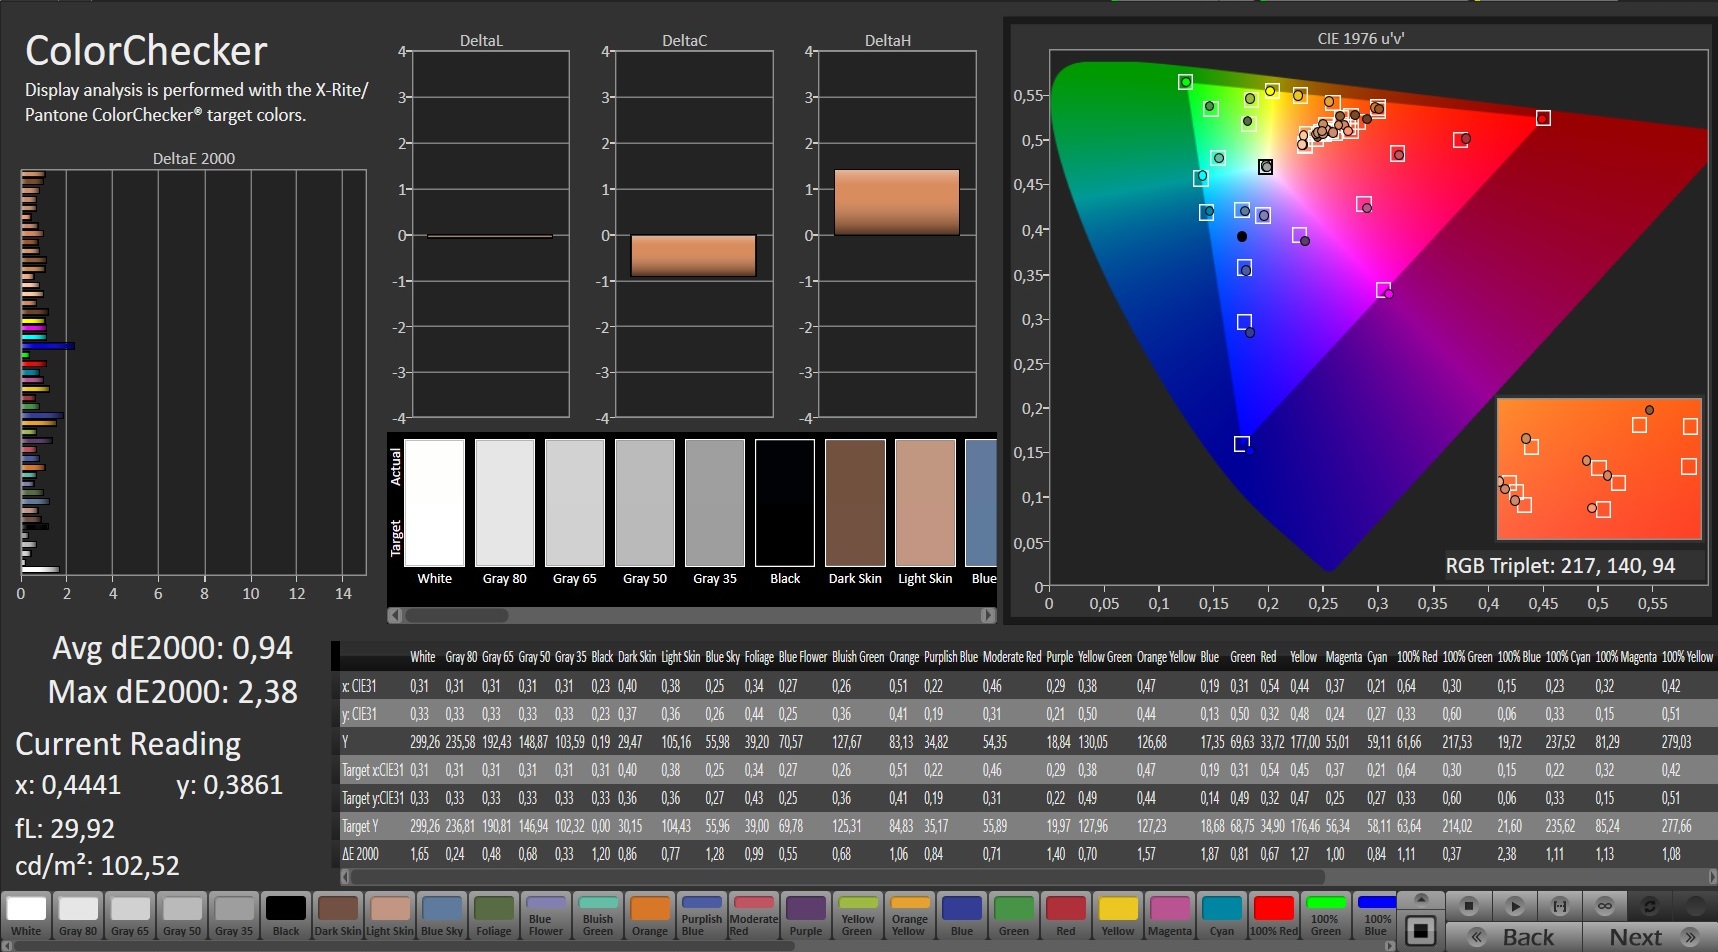
The panel doesn't do as well in terms of brightness. An average of 301 cd/m² is enough for the first place, but you'll find yourself quickly wishing for a higher display brightness in sunnier environments (keywords: "outdoor use"). The color accuracy is also worse than that of the Focus 15. The panel has a blue tint before being calibrated.
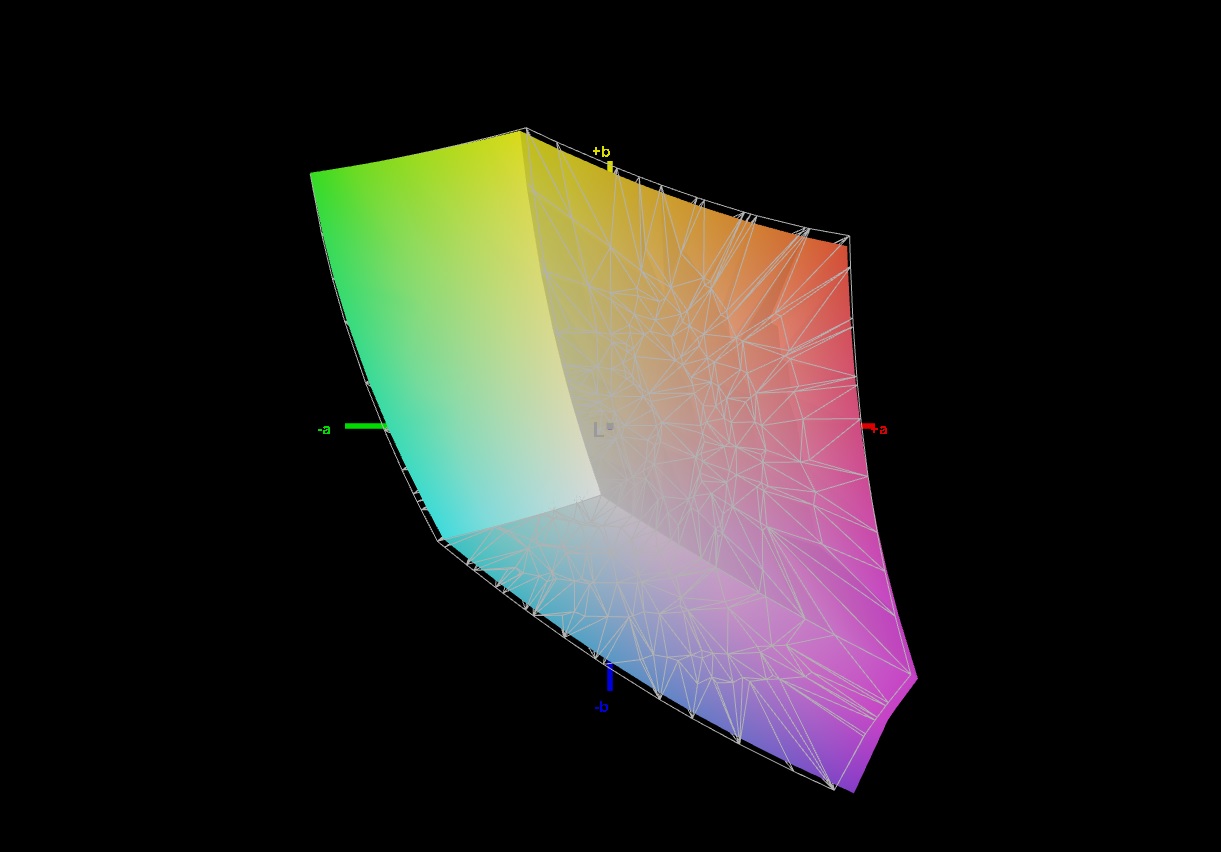
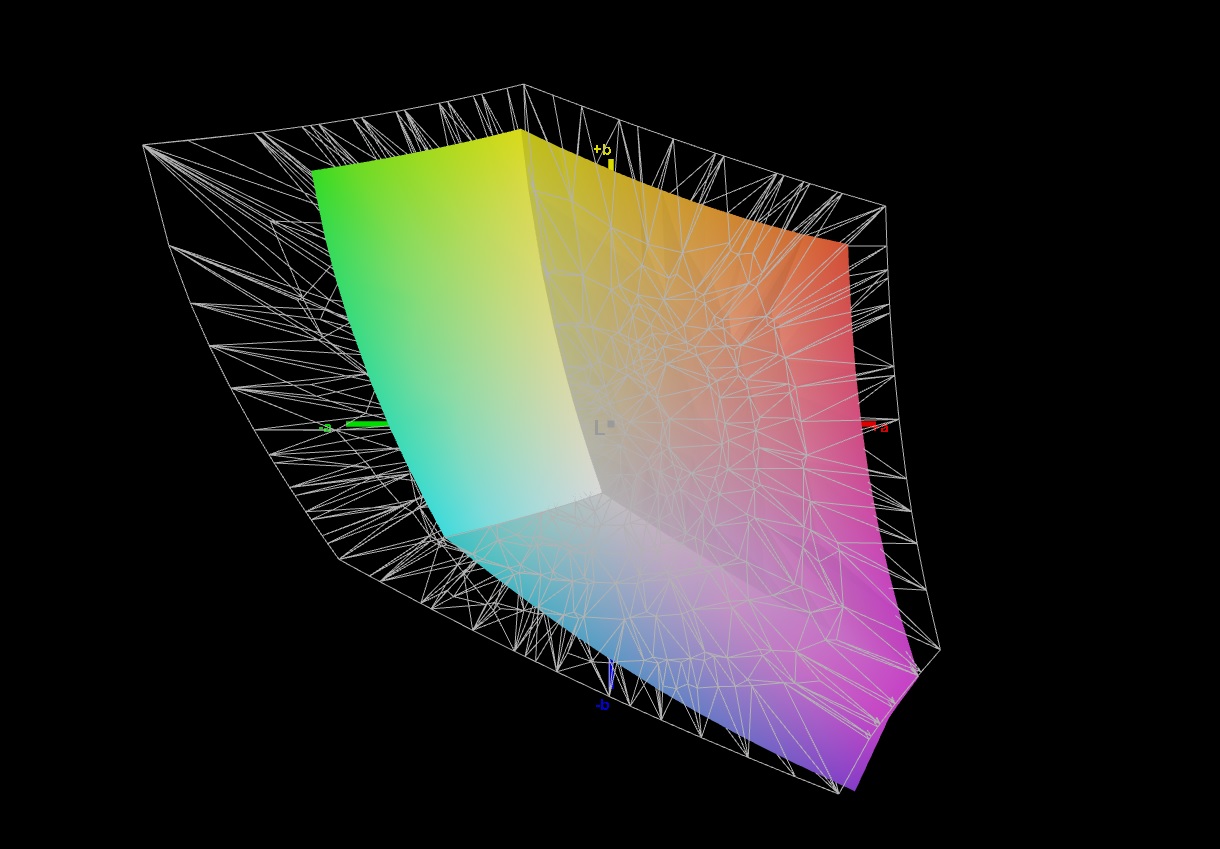
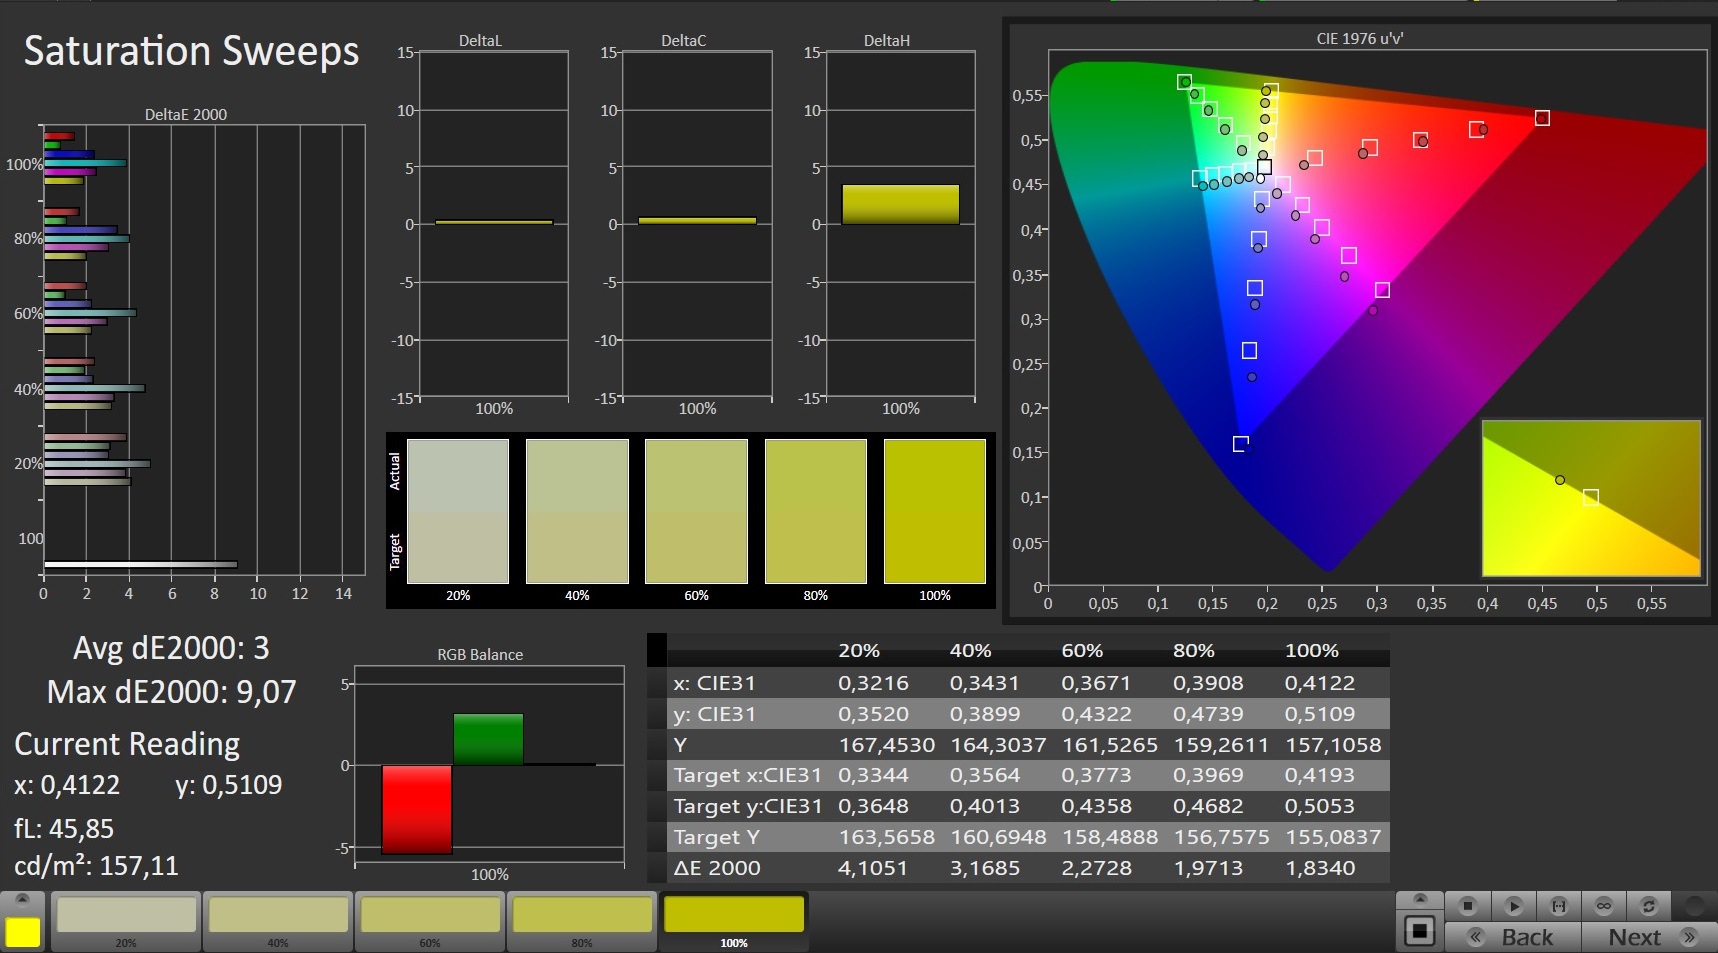
We were able to measure a color-space coverage of 96% (sRGB) and 66% (AdobeRGB), respectively - relatively good values for a gaming laptop. The response times of 11.2 ms for black-to-white and 15.2 ms for gray-to-gray are better than those of the competition.
Display Response Times
| ↔ Response Time Black to White | ||
|---|---|---|
| 11.2 ms ... rise ↗ and fall ↘ combined | ↗ 6 ms rise | 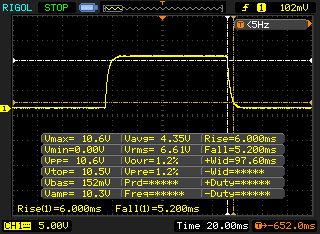 |
| ↘ 5.2 ms fall | ||
| The screen shows good response rates in our tests, but may be too slow for competitive gamers. In comparison, all tested devices range from 0.1 (minimum) to 240 (maximum) ms. » 29 % of all devices are better. This means that the measured response time is better than the average of all tested devices (20.1 ms). | ||
| ↔ Response Time 50% Grey to 80% Grey | ||
| 15.2 ms ... rise ↗ and fall ↘ combined | ↗ 7.6 ms rise | |
| ↘ 7.6 ms fall | ||
| The screen shows good response rates in our tests, but may be too slow for competitive gamers. In comparison, all tested devices range from 0.165 (minimum) to 636 (maximum) ms. » 29 % of all devices are better. This means that the measured response time is better than the average of all tested devices (31.4 ms). | ||
Screen Flickering / PWM (Pulse-Width Modulation)
| Screen flickering / PWM not detected | 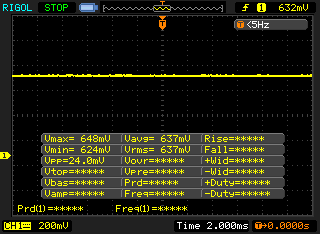 | ||
In comparison: 53 % of all tested devices do not use PWM to dim the display. If PWM was detected, an average of 7996 (minimum: 5 - maximum: 343500) Hz was measured. | |||
Test conditions
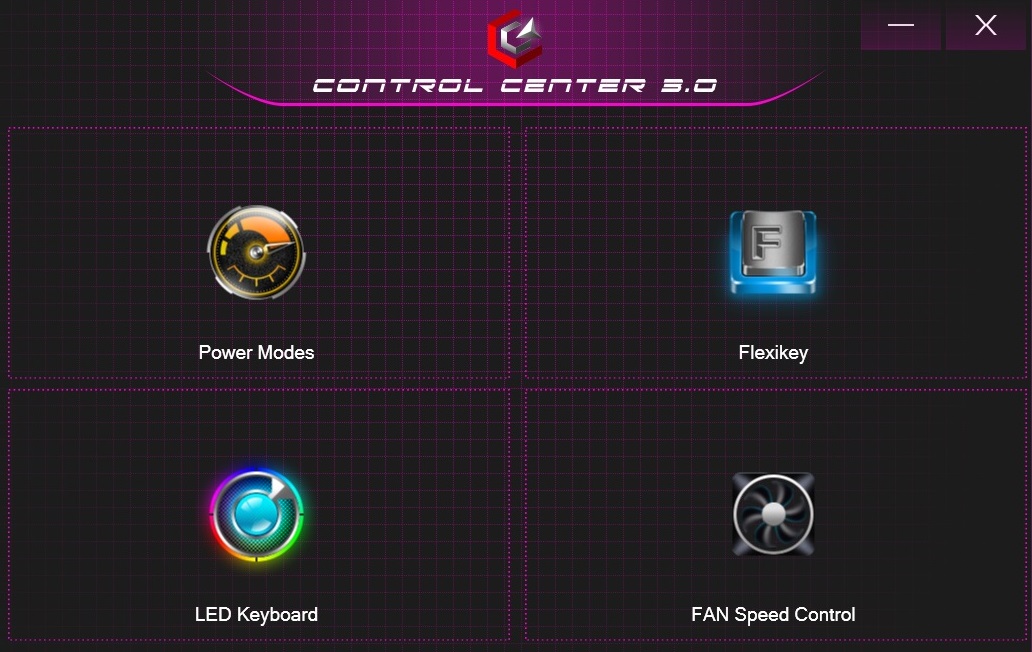
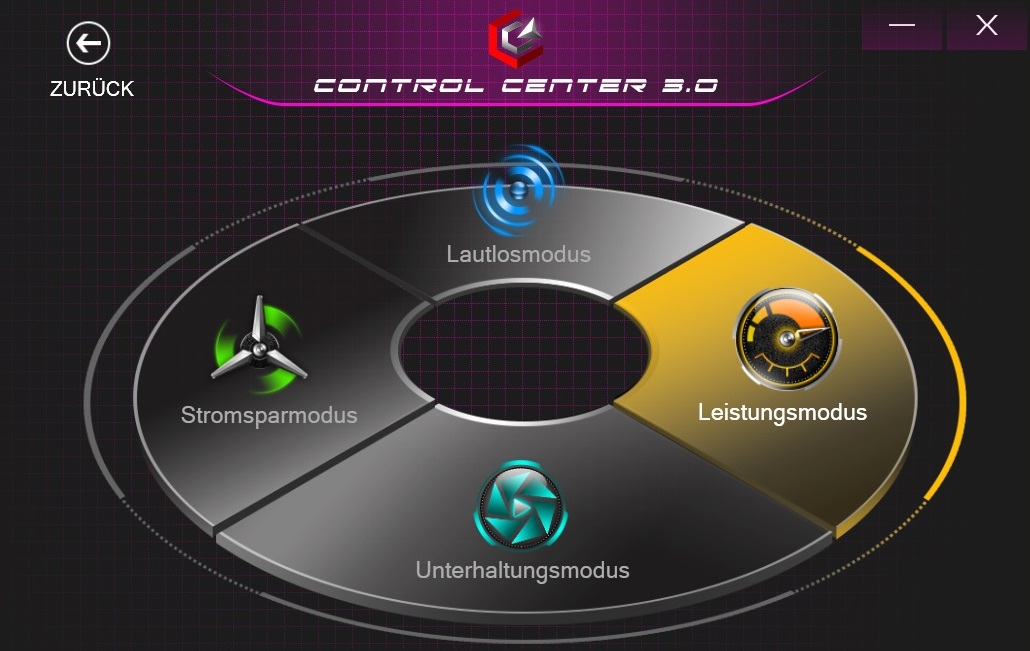
Several system settings can be adjusted using the preinstalled Control Center software. Our tests were carried out in "Performance Mode", using the automatic fan speed.
Performance
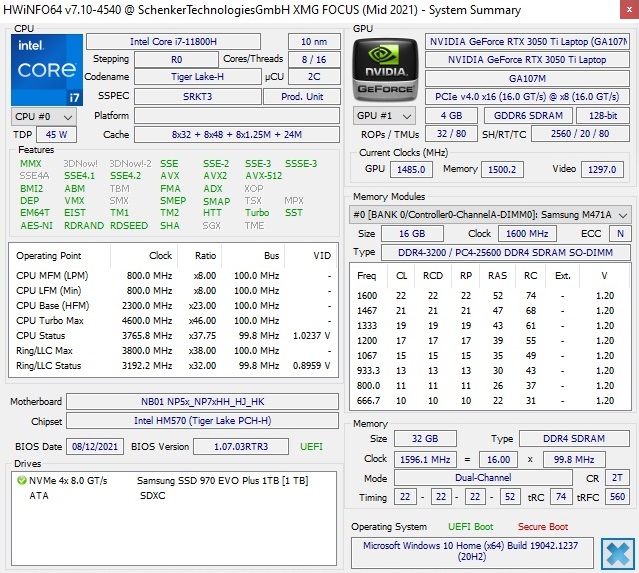
Despite the octa-core CPU, 32 GB of RAM, and 1 TB SSD that our review sample comes with, the XMG Focus 17 "only" falls into the mid-range. The GeForce RTX 3050 Ti is rather intended for casual gamers who don't need to play every new title at maximum details, and who don't expect the system to be particularly future-proof.
Processor
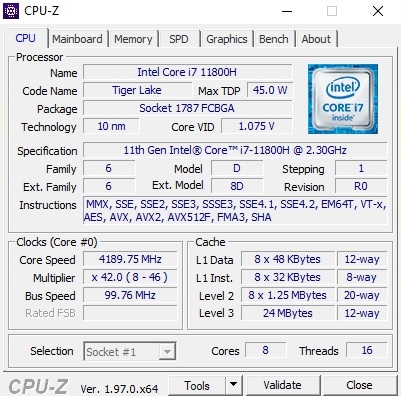
The Intel Core i7-11800H is currently one of the most competitive processors in the mobile gaming sector. The 10 nm model has 24 MB of L3 cache and can process up to 16 threads in parallel using Hyper-Threading. The clock rates under load range from 2.3 GHz to a maximum of 4.6 GHz.
The Focus 17 positioned itself comfortably between the MSI Katana GF76 (11800H as well) and the Asus TUF F17 (11900H) in our Cinebench loop. Here, the CPU performance remained quite stable over a prolonged period of time. Nevertheless, the Focus 17 has a hard time against laptops based on the Ryzen 7 5800H. Since most 3D applications depend on the GPU, users don't need to worry about any problems when gaming.
Cinebench R15 Multi endurance test
* ... smaller is better
System performance
Thanks in no small part to the fast SSD, the 17-incher comes out on top in the system tests. 6,556 points in PCMark 10 put it in second place, just behind the Asus TUF F17.
| PCMark 10 / Score | |
| Average of class Gaming (5828 - 10060, n=109, last 2 years) | |
| Asus TUF Gaming F17 FX706HM | |
| Schenker XMG Focus 17 | |
| MSI Katana GF76 11UE | |
| Asus ROG Strix G17 G713QE-RB74 | |
| Average Intel Core i7-11800H, NVIDIA GeForce RTX 3050 Ti Laptop GPU (6019 - 6556, n=5) | |
| Acer Nitro 5 AN517-53-54DQ | |
| PCMark 10 / Essentials | |
| Average of class Gaming (8810 - 12600, n=113, last 2 years) | |
| Asus TUF Gaming F17 FX706HM | |
| Schenker XMG Focus 17 | |
| Asus ROG Strix G17 G713QE-RB74 | |
| Average Intel Core i7-11800H, NVIDIA GeForce RTX 3050 Ti Laptop GPU (9490 - 10846, n=5) | |
| MSI Katana GF76 11UE | |
| Acer Nitro 5 AN517-53-54DQ | |
| PCMark 10 / Productivity | |
| Average of class Gaming (6662 - 16716, n=111, last 2 years) | |
| Asus ROG Strix G17 G713QE-RB74 | |
| Asus TUF Gaming F17 FX706HM | |
| MSI Katana GF76 11UE | |
| Schenker XMG Focus 17 | |
| Acer Nitro 5 AN517-53-54DQ | |
| Average Intel Core i7-11800H, NVIDIA GeForce RTX 3050 Ti Laptop GPU (8176 - 8723, n=5) | |
| PCMark 10 / Digital Content Creation | |
| Average of class Gaming (7505 - 19351, n=111, last 2 years) | |
| Asus TUF Gaming F17 FX706HM | |
| MSI Katana GF76 11UE | |
| Schenker XMG Focus 17 | |
| Average Intel Core i7-11800H, NVIDIA GeForce RTX 3050 Ti Laptop GPU (7475 - 8577, n=5) | |
| Asus ROG Strix G17 G713QE-RB74 | |
| Acer Nitro 5 AN517-53-54DQ | |
| PCMark 10 Score | 6556 points | |
Help | ||
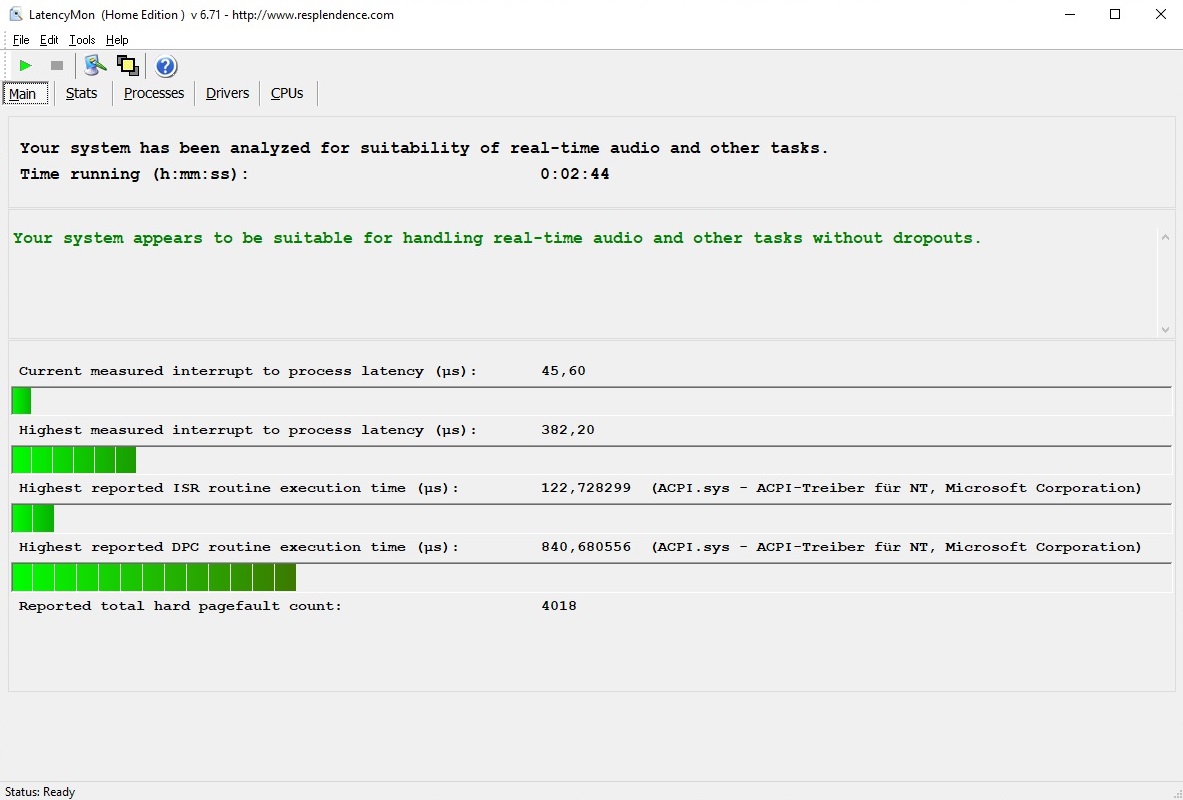
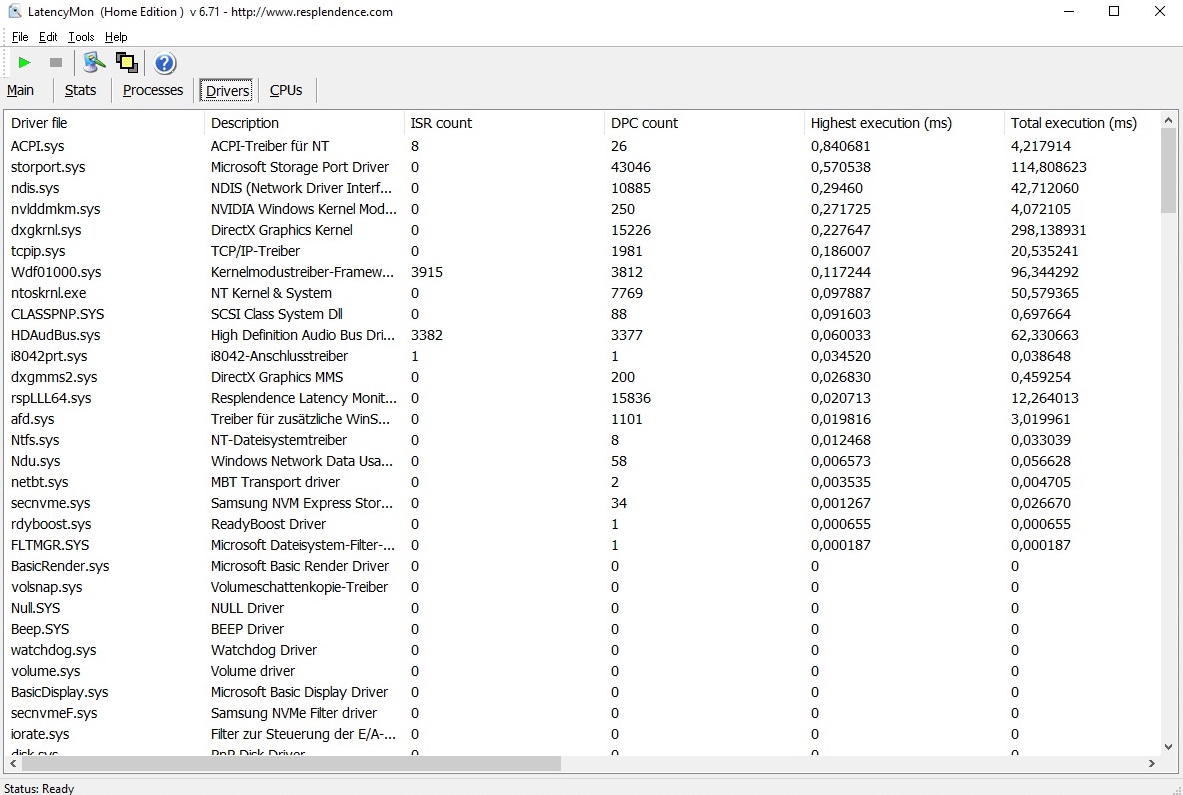
DPC latencies
Bonus points are also awarded for the low latencies. According to the LatencyMon tool, the Focus 17 is suitable for real-time audio and video editing.
| DPC Latencies / LatencyMon - interrupt to process latency (max), Web, Youtube, Prime95 | |
| MSI Katana GF76 11UE | |
| Asus TUF Gaming F17 FX706HM | |
| Acer Nitro 5 AN517-53-54DQ | |
| Asus ROG Strix G17 G713QE-RB74 | |
| Schenker XMG Focus 17 | |
* ... smaller is better
Storage
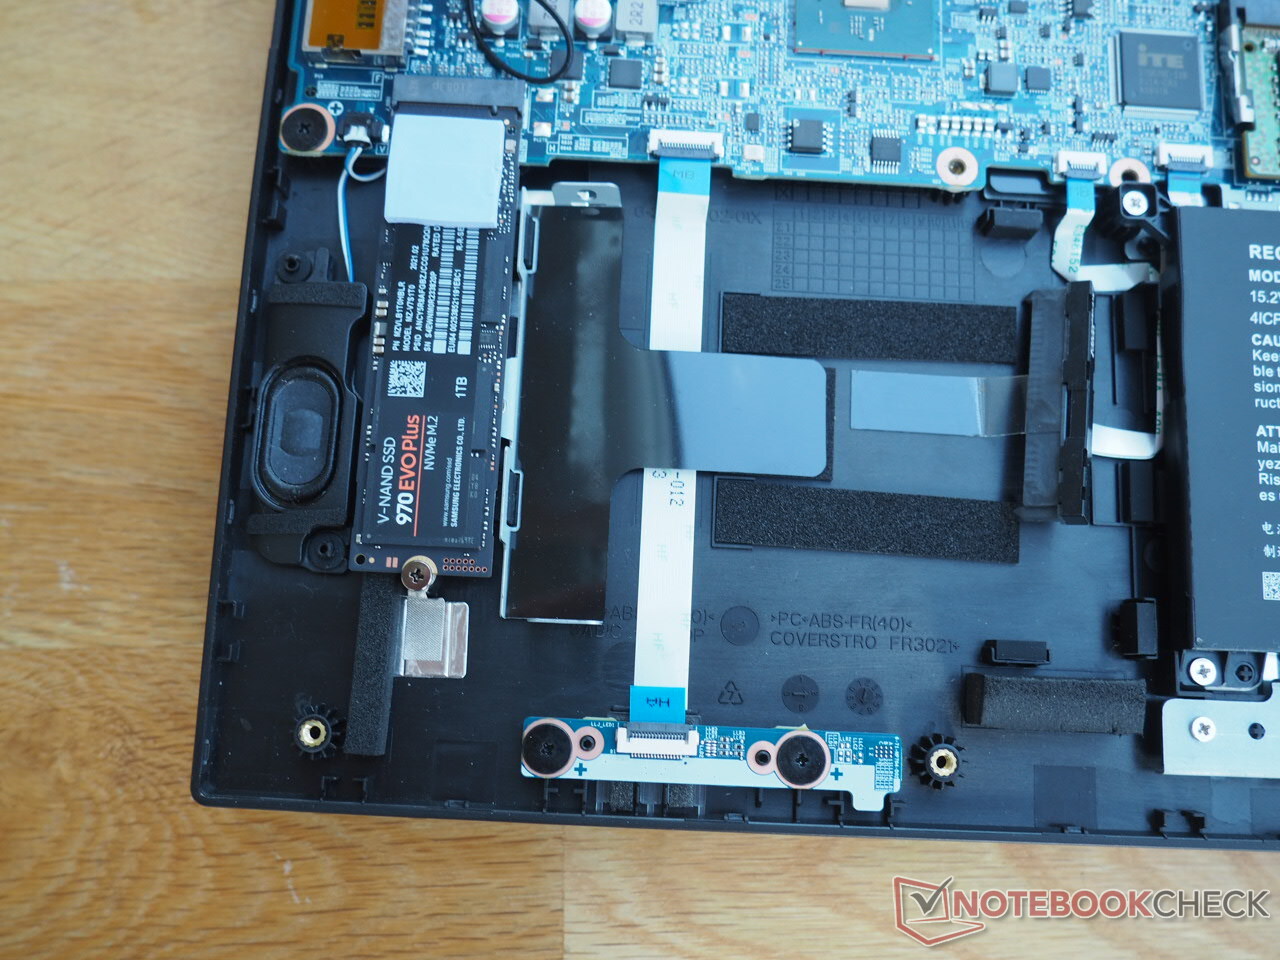
Our test device was powered by a high-performance Samsung SSD. The 1 TB version of the 970 Evo Plus overtakes most competing SSDs. The M.2 drive provides a first-class performance for both reading and writing.
| Schenker XMG Focus 17 Samsung SSD 970 EVO Plus 1TB | Asus ROG Strix G17 G713QE-RB74 Samsung PM991 MZVLQ512HBLU | Acer Nitro 5 AN517-53-54DQ SK Hynix BC711 HFM512GD3HX015N | MSI Katana GF76 11UE Kingston OM8PCP3512F-AB | Asus TUF Gaming F17 FX706HM SK Hynix HFM001TD3JX013N | |
|---|---|---|---|---|---|
| CrystalDiskMark 5.2 / 6 | -35% | -0% | -46% | -10% | |
| Write 4K (MB/s) | 237.6 | 120.8 -49% | 206.1 -13% | 107.3 -55% | 168.8 -29% |
| Read 4K (MB/s) | 55.9 | 44.19 -21% | 77.8 39% | 45.46 -19% | 72 29% |
| Write Seq (MB/s) | 3012 | 1518 -50% | 2842 -6% | 978 -68% | |
| Read Seq (MB/s) | 2830 | 1828 -35% | 2552 -10% | 1255 -56% | |
| Write 4K Q32T1 (MB/s) | 566 | 492.5 -13% | 583 3% | 579 2% | 459.5 -19% |
| Read 4K Q32T1 (MB/s) | 712 | 390.7 -45% | 663 -7% | 299.6 -58% | 473.1 -34% |
| Write Seq Q32T1 (MB/s) | 3287 | 1602 -51% | 3014 -8% | 978 -70% | 3129 -5% |
| Read Seq Q32T1 (MB/s) | 3566 | 3086 -13% | 3556 0% | 1977 -45% | 3529 -1% |
| AS SSD | -42% | 10% | -68% | -0% | |
| Seq Read (MB/s) | 2995 | 2602 -13% | 2859 -5% | 1704 -43% | 2837 -5% |
| Seq Write (MB/s) | 2498 | 1218 -51% | 2693 8% | 716 -71% | 1565 -37% |
| 4K Read (MB/s) | 48.67 | 42.31 -13% | 68.8 41% | 37.77 -22% | 55.4 14% |
| 4K Write (MB/s) | 86.3 | 122 41% | 154.5 79% | 66 -24% | 152.9 77% |
| 4K-64 Read (MB/s) | 2043 | 1182 -42% | 1860 -9% | 441.2 -78% | 1327 -35% |
| 4K-64 Write (MB/s) | 2422 | 972 -60% | 1680 -31% | 735 -70% | 1922 -21% |
| Access Time Read * (ms) | 0.063 | 0.101 -60% | 0.043 32% | 0.191 -203% | 0.035 44% |
| Access Time Write * (ms) | 0.043 | 0.096 -123% | 0.028 35% | 0.053 -23% | 0.028 35% |
| Score Read (Points) | 2392 | 1484 -38% | 2214 -7% | 649 -73% | 1666 -30% |
| Score Write (Points) | 2758 | 1216 -56% | 2104 -24% | 872 -68% | 2232 -19% |
| Score Total (Points) | 6345 | 3394 -47% | 5451 -14% | 1816 -71% | 4695 -26% |
| Total Average (Program / Settings) | -39% /
-39% | 5% /
5% | -57% /
-59% | -5% /
-4% |
* ... smaller is better

Continuous load read: DiskSpd Read Loop, Queue Depth 8
Graphics card
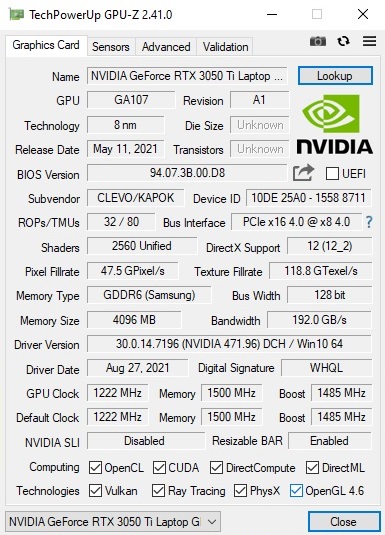
To get as much graphics performance out of the GeForce RTX 3050 Ti as possible, the manufacturer provides the Focus 17 with a TGP of 75 watts (incl. Dynamic Boost).
However, the poor amount of video memory proves to be problematic. 4 GB is no longer up to date for a mid-range GPU. In 2021, at least 6 GB of VRAM should be included. New games, such as Deathloop, already require more than 4 GB when running in Full HD - even at minimum settings. Nvidia is being too frugal here, unnecessarily limiting the GPU's future-proofing. You shouldn't expect a high ray-tracing performance from the RTX 3050 Ti, either. The result in 3DMark's Port Royal test, for example, is terrible compared to the RTX 3060, which is often found in similarly priced laptops.
| 3DMark Cloud Gate Standard Score | 43575 points | |
| 3DMark Fire Strike Score | 13247 points | |
| 3DMark Time Spy Score | 5991 points | |
Help | ||
Gaming performance
Despite the limited memory, the RTX 3050 Ti is fast enough to run most games smoothly in the native Full HD resolution with high to maximum details. Only poorly optimized and/or extremely demanding games, such as Crysis Remastered, make the DirectX 12 chip struggle. The Focus 17 is clearly behind laptops with the RTX 3060 here as well. The latter performs about 30% to 40% faster.
| The Witcher 3 | |
| 1920x1080 High Graphics & Postprocessing (Nvidia HairWorks Off) | |
| Average of class Gaming (138 - 413, n=20, last 2 years) | |
| Asus TUF Gaming F17 FX706HM | |
| MSI Katana GF76 11UE | |
| Asus ROG Strix G17 G713QE-RB74 | |
| Schenker XMG Focus 17 | |
| Average NVIDIA GeForce RTX 3050 Ti Laptop GPU (30 - 110, n=26) | |
| Acer Nitro 5 AN517-53-54DQ | |
| 1920x1080 Ultra Graphics & Postprocessing (HBAO+) | |
| Average of class Gaming (83.7 - 240, n=31, last 2 years) | |
| Asus TUF Gaming F17 FX706HM | |
| MSI Katana GF76 11UE | |
| Asus ROG Strix G17 G713QE-RB74 | |
| Schenker XMG Focus 17 | |
| Acer Nitro 5 AN517-53-54DQ | |
| Average NVIDIA GeForce RTX 3050 Ti Laptop GPU (19 - 58.5, n=29) | |
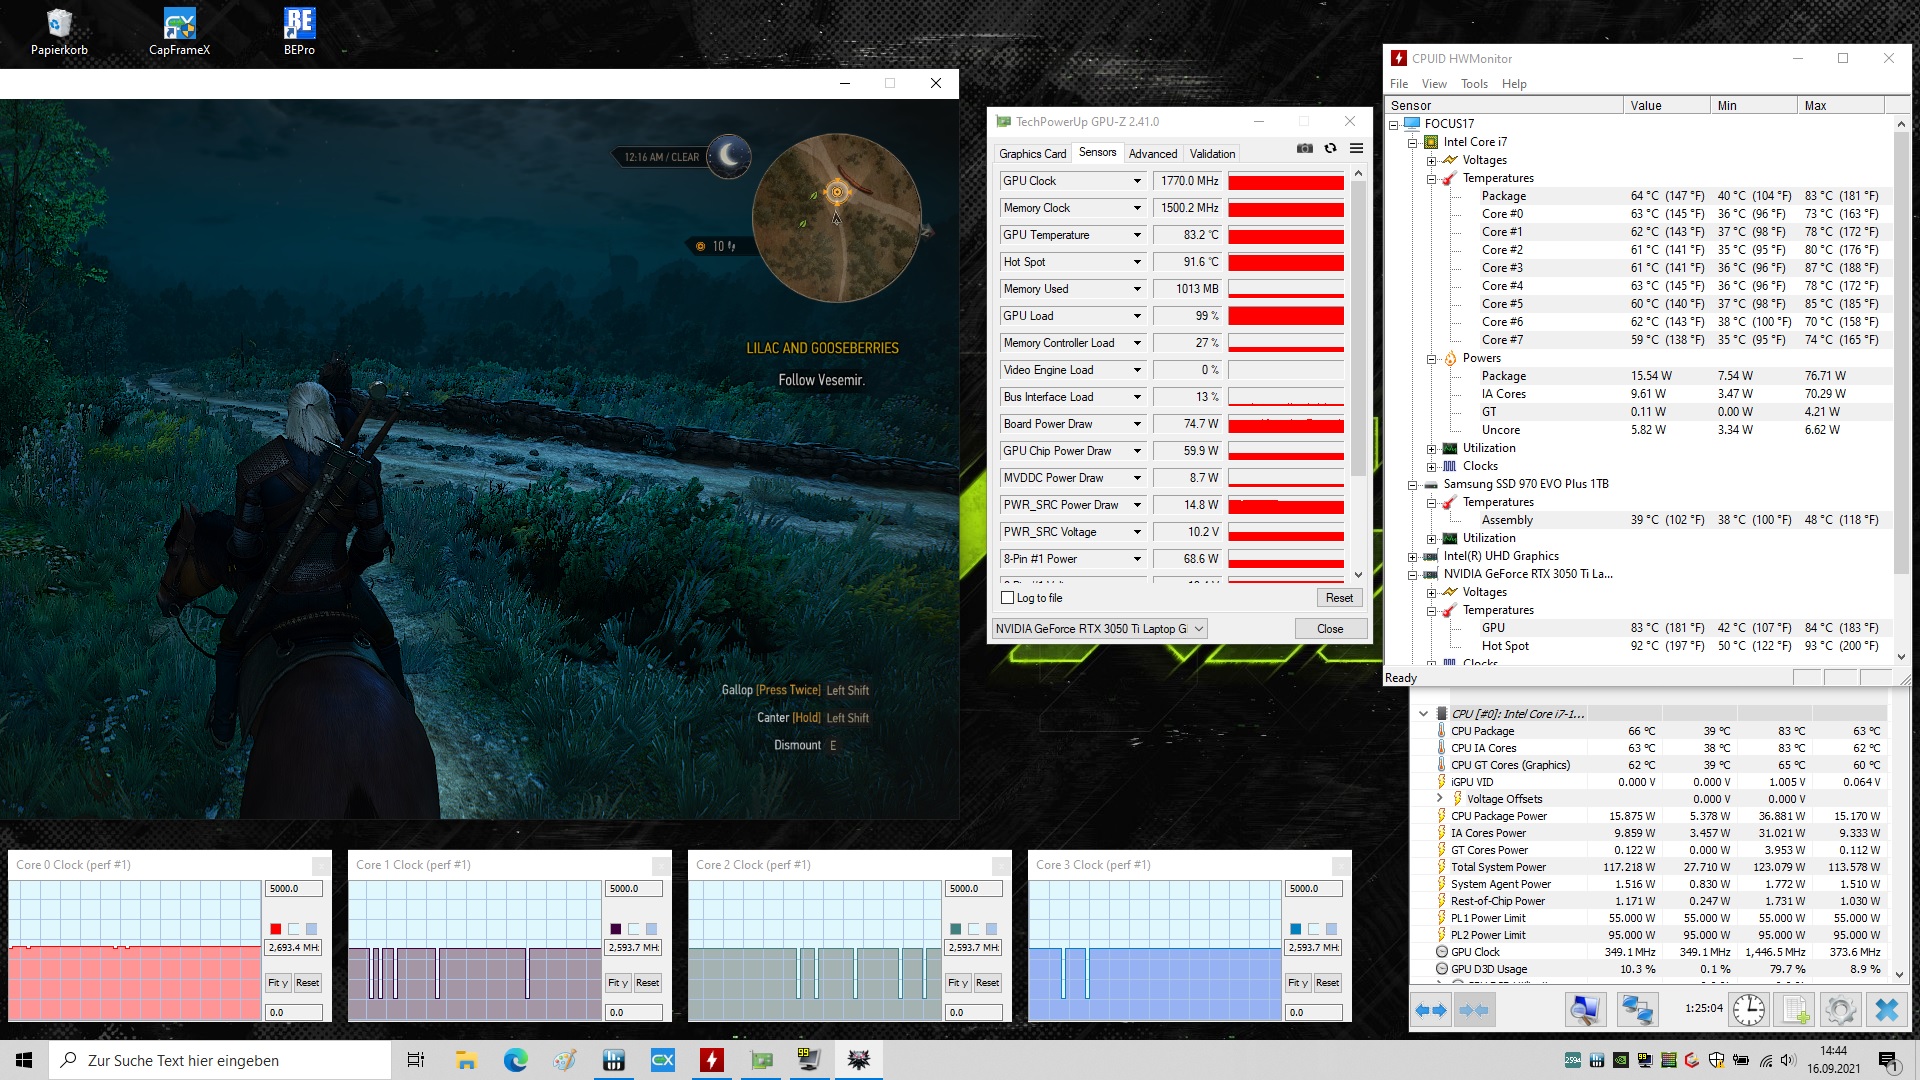
We examined how the graphics card behaves under prolonged 3D load for a good 60 minutes with the role-playing game The Witcher 3 (Full HD/Ultra). Result: Similar to the CPU performance, the GPU performance also remained quite constant.
The Witcher 3 FPS diagram
| low | med. | high | ultra | |
|---|---|---|---|---|
| GTA V (2015) | 180 | 149 | 75.6 | |
| The Witcher 3 (2015) | 180 | 100 | 56.3 | |
| Dota 2 Reborn (2015) | 174 | 162 | 154 | 145 |
| Final Fantasy XV Benchmark (2018) | 79.9 | 56.9 | ||
| X-Plane 11.11 (2018) | 134 | 116 | 91.6 | |
| Far Cry 5 (2018) | 101 | 92 | 86 | |
| Strange Brigade (2018) | 139 | 111 | 96.3 | |
| Hunt Showdown (2020) | 86.7 | 79 | ||
| Death Stranding (2020) | 100 | 93.1 | 90.8 | |
| Crysis Remastered (2020) | 89 | 46.5 | 31.1 | |
| Serious Sam 4 (2020) | 77.9 | 67.9 | 50 | |
| Mafia Definitive Edition (2020) | 74.3 | 68.7 | ||
| Star Wars Squadrons (2020) | 168 | 153 | 141 | |
| FIFA 21 (2020) | 231 | 203 | 194 | |
| Yakuza Like a Dragon (2020) | 79.5 | 76.5 | 67.4 | |
| Outriders (2021) | 77.6 | 67.6 | 63 | |
| Resident Evil Village (2021) | 103 | 102 | 76.4 | |
| Mass Effect Legendary Edition (2021) | 111 | |||
| Days Gone (2021) | 91.3 | 80 | 58.8 | |
| Monster Hunter Stories 2 (2021) | 144 | 143 | ||
| Deathloop (2021) | 70.2 | 49.3 | 42.2 |
Emissions
Noise emissions
As we're used to from Clevo barebones, the fan control turned out to be very poor - at least in Performance Mode. Instead of letting the 17-inch device run constantly at a decent level in idle and non-demanding scenarios, the fans are often either as quiet as a mouse, or they immediately rev up and become clearly audible. The Focus 17 gets really annoying under load. Even some RTX 3070 and RTX 3080 laptops are able to stay below 54 to 58 dB(A). This makes gaming unenjoyable without headphones. The contenders were often noticeably quieter in the test.
Noise level
| Idle |
| 25 / 31 / 43 dB(A) |
| Load |
| 54 / 58 dB(A) |
 | ||
30 dB silent 40 dB(A) audible 50 dB(A) loud |
||
min: | ||
| Schenker XMG Focus 17 i7-11800H, GeForce RTX 3050 Ti Laptop GPU | Asus ROG Strix G17 G713QE-RB74 R7 5800H, GeForce RTX 3050 Ti Laptop GPU | Acer Nitro 5 AN517-53-54DQ i5-11300H, GeForce RTX 3050 4GB Laptop GPU | MSI Katana GF76 11UE i7-11800H, GeForce RTX 3060 Laptop GPU | Asus TUF Gaming F17 FX706HM i9-11900H, GeForce RTX 3060 Laptop GPU | Average of class Gaming | |
|---|---|---|---|---|---|---|
| Noise | 16% | 11% | -2% | 8% | 11% | |
| off / environment * (dB) | 24 | 24.9 -4% | 25 -4% | 25 -4% | 25 -4% | 24.1 ? -0% |
| Idle Minimum * (dB) | 25 | 25.1 -0% | 25 -0% | 33 -32% | 26 -4% | 25.9 ? -4% |
| Idle Average * (dB) | 31 | 25.1 19% | 31 -0% | 34 -10% | 31 -0% | 27.5 ? 11% |
| Idle Maximum * (dB) | 43 | 25.1 42% | 33 23% | 35 19% | 33 23% | 30.1 ? 30% |
| Load Average * (dB) | 54 | 36.3 33% | 43 20% | 53 2% | 48 11% | 43.5 ? 19% |
| Witcher 3 ultra * (dB) | 56 | 49.9 11% | 44 21% | 49 12% | 47 16% | |
| Load Maximum * (dB) | 58 | 49.9 14% | 47 19% | 57 2% | 49 16% | 53.8 ? 7% |
* ... smaller is better
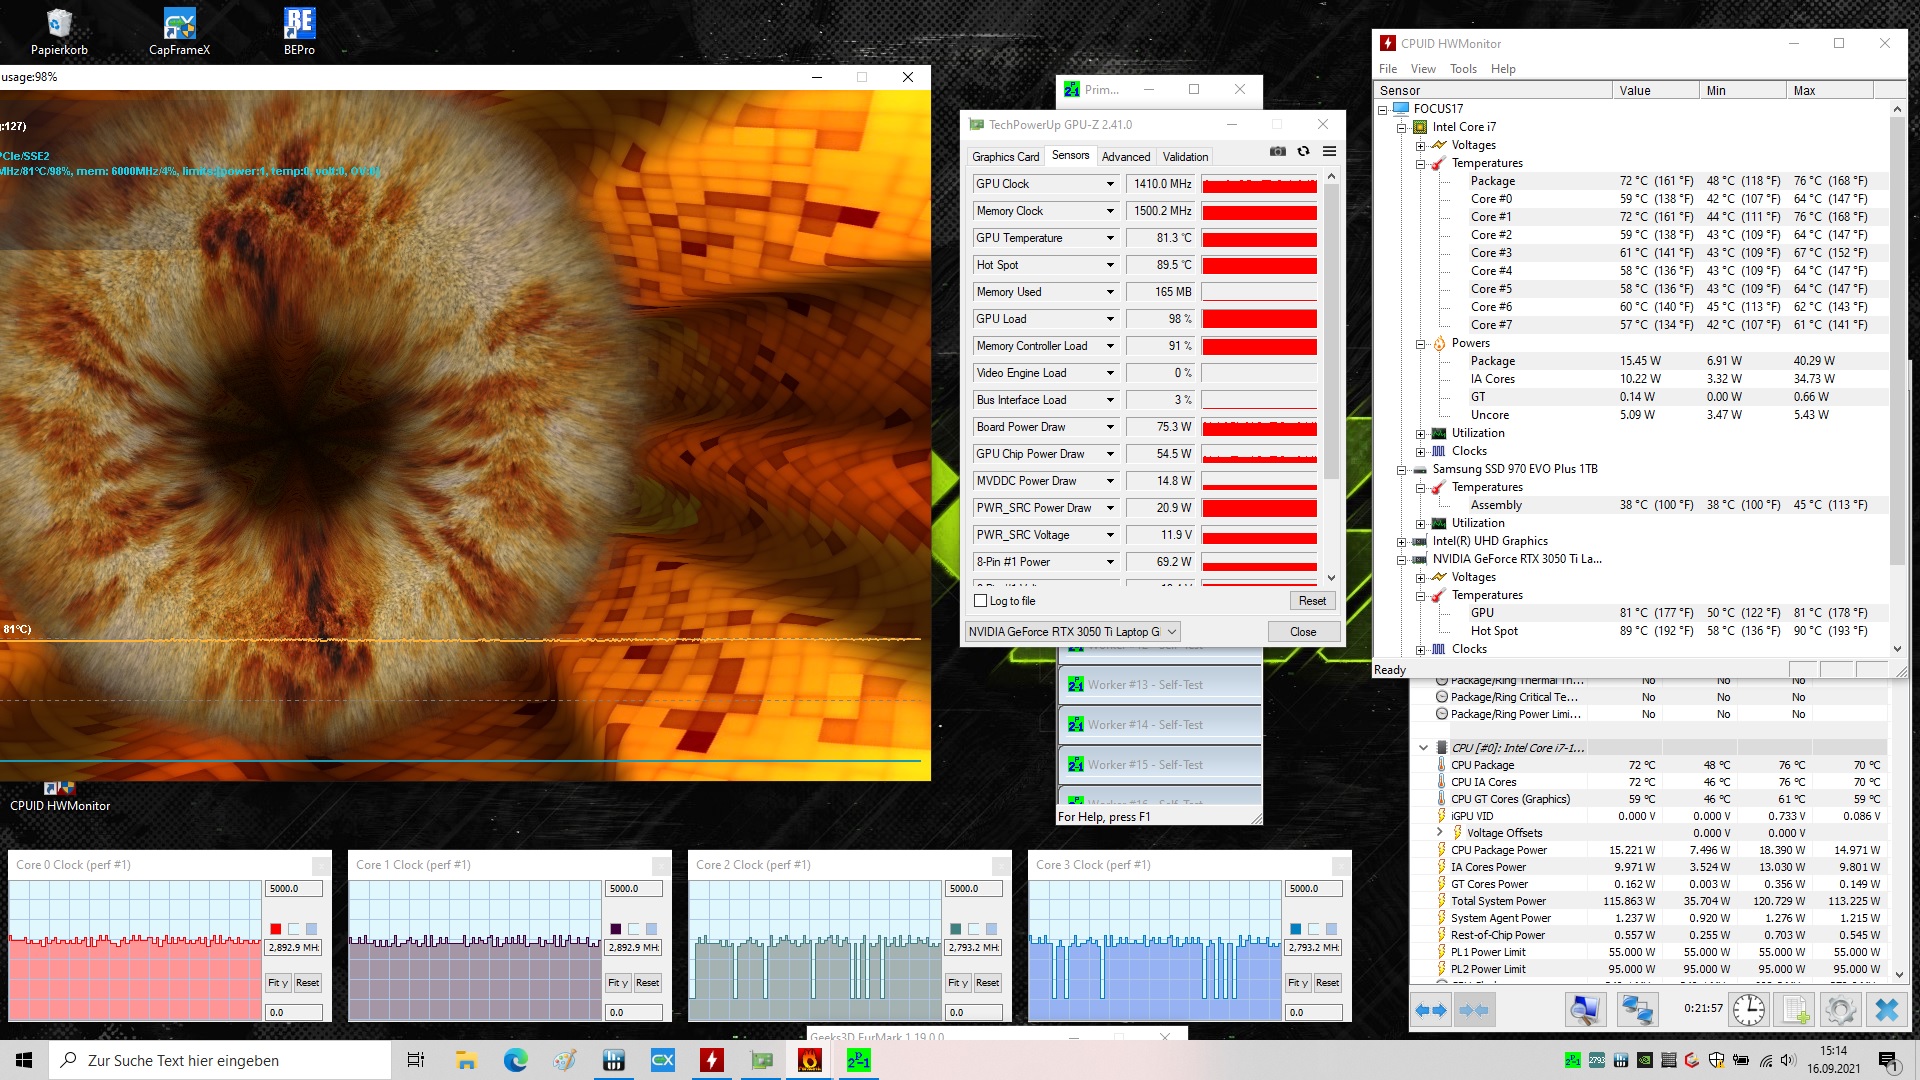
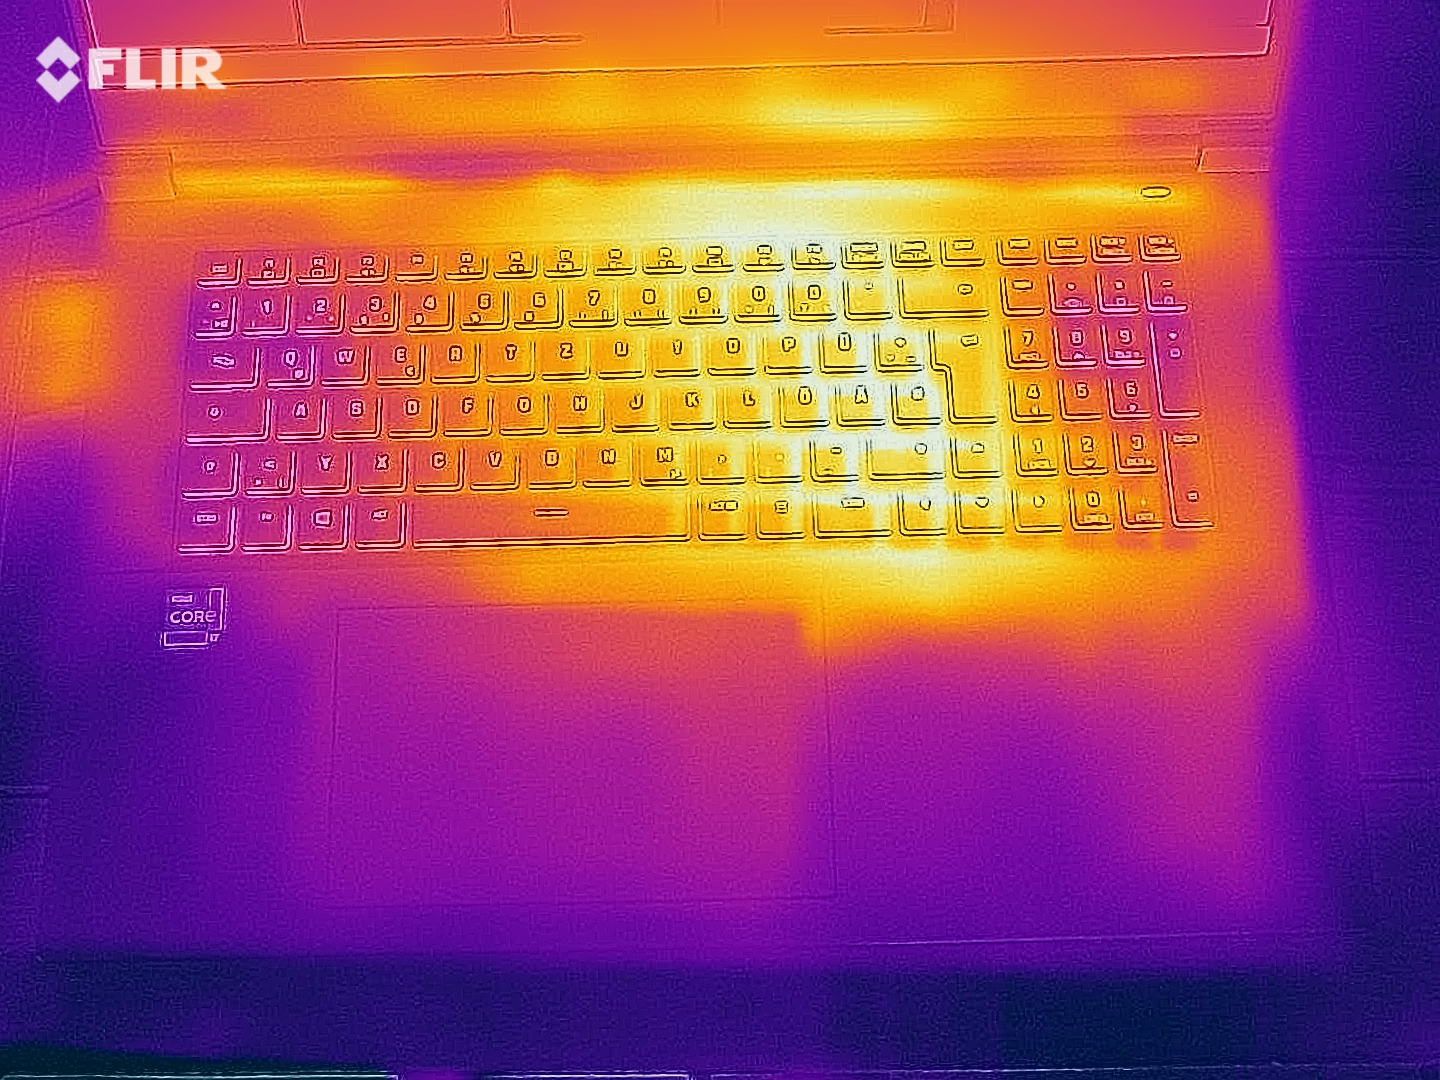
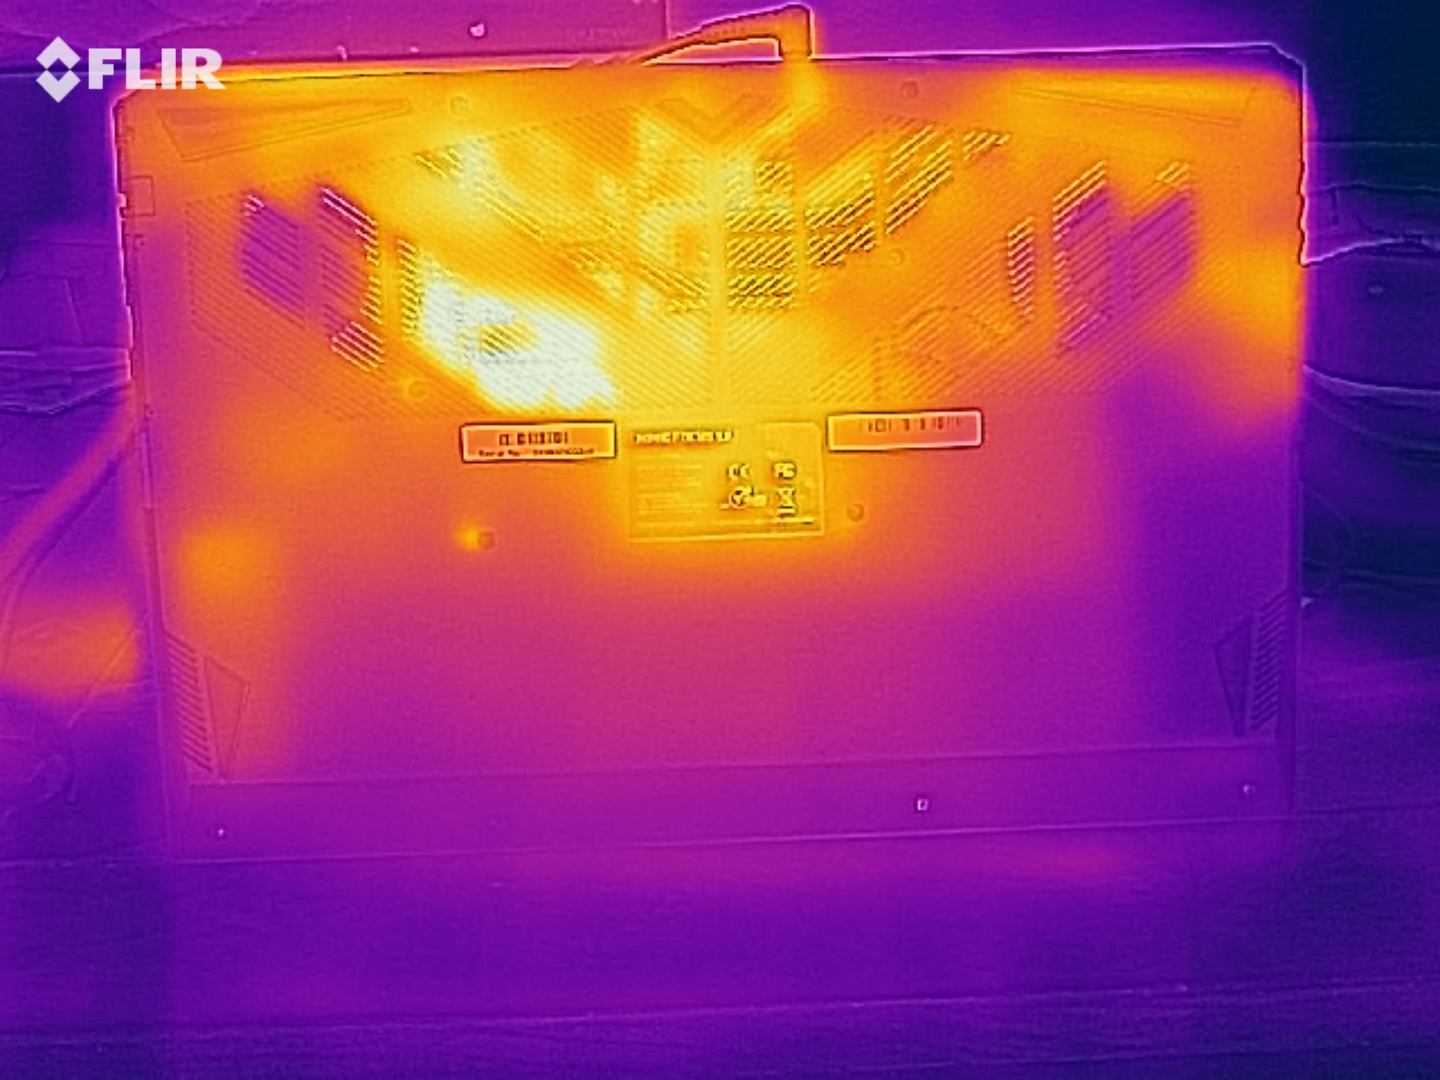
Temperature
Besides the noise, heat development is also quite high for an RTX 3050 Ti device. In the 60-minute stress test with FurMark and Prime95, the case reached up to 50 °C (~122 °F) on the top and up to 60 °C (~140 °F) on the bottom. It appears that the cooling system of the Focus 17 isn't that great. Even in idle mode, the case surfaces reach above-average temperatures of around 30°C (~86 °F) to 40°C (~104 °F).
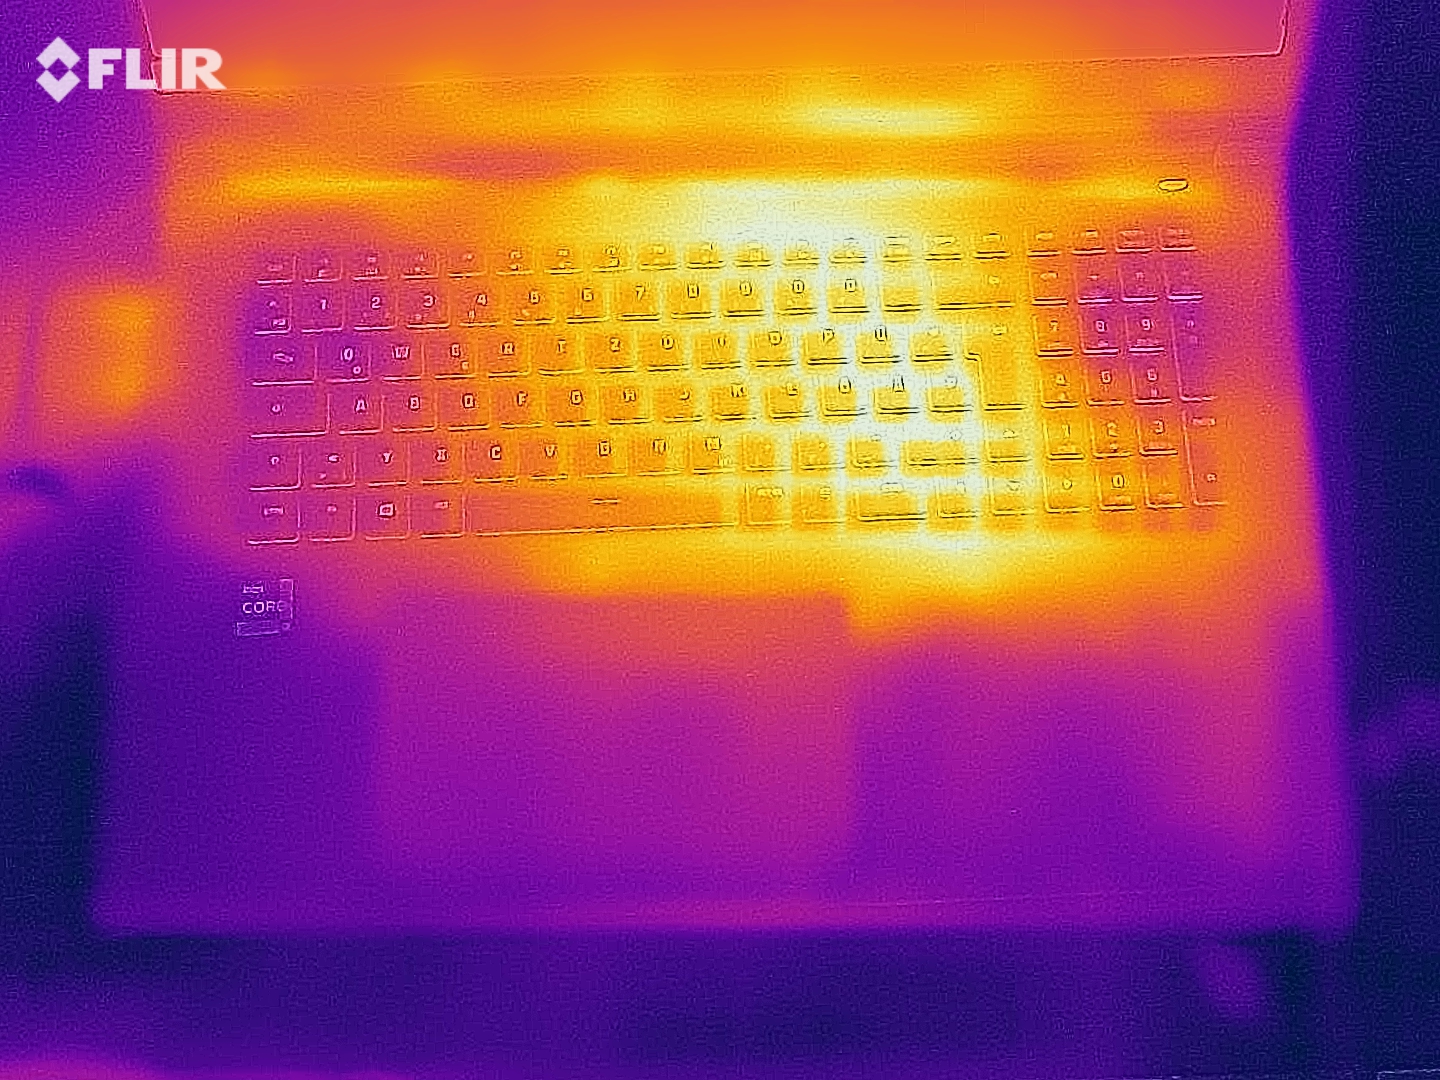
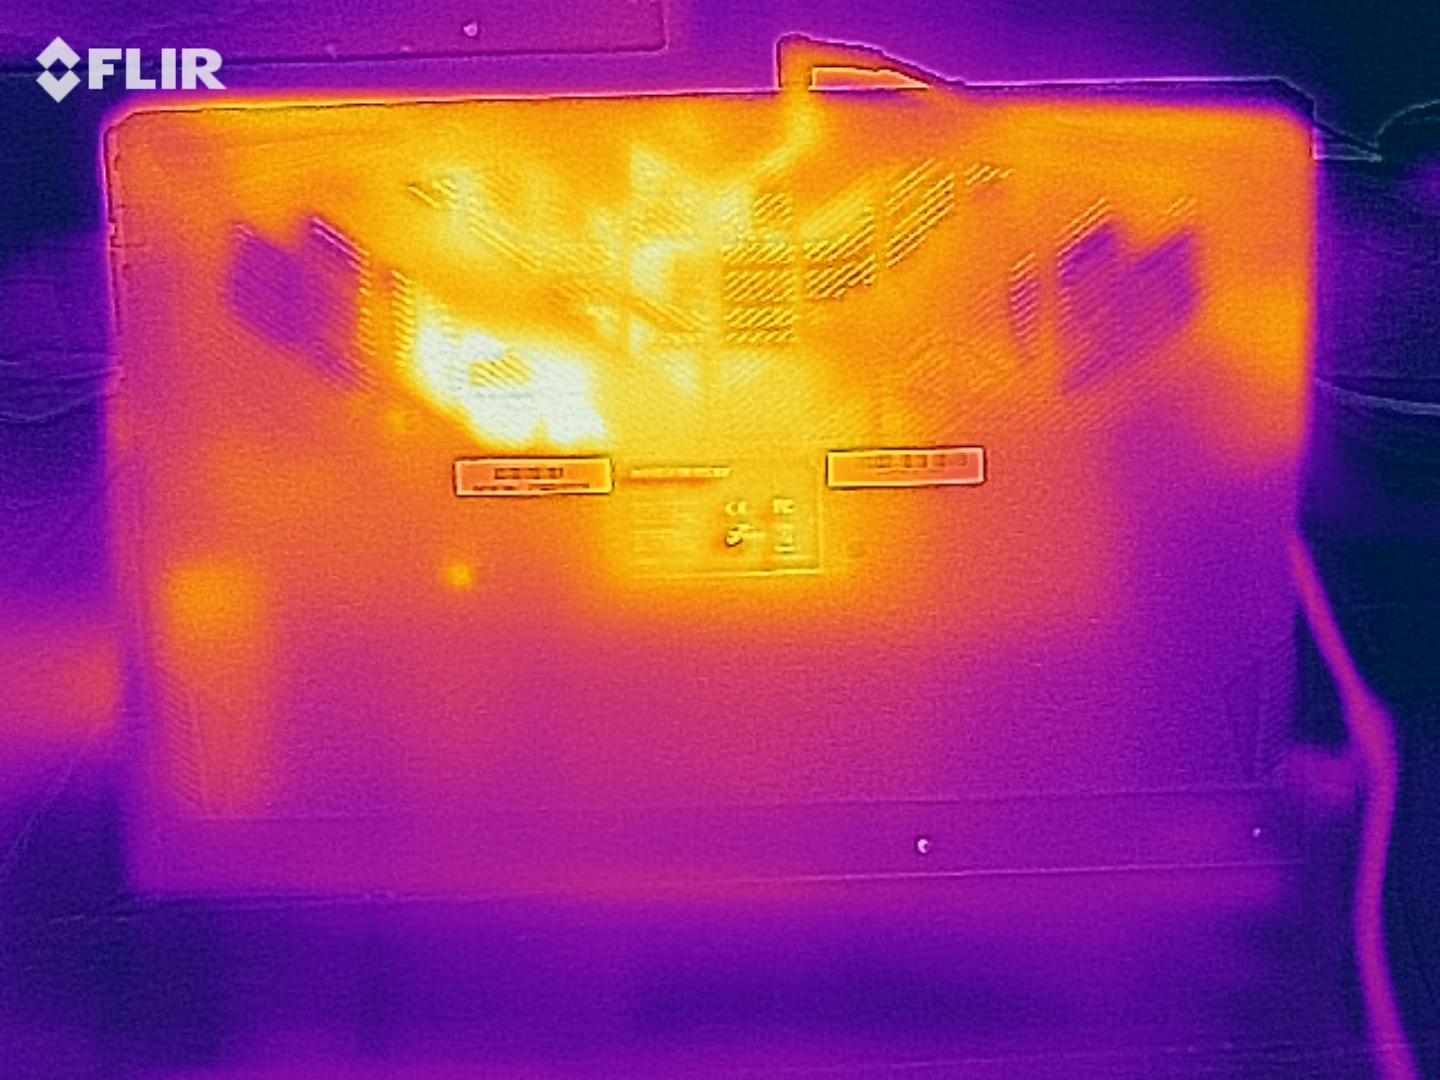
(-) The maximum temperature on the upper side is 50 °C / 122 F, compared to the average of 40.4 °C / 105 F, ranging from 21.2 to 68.8 °C for the class Gaming.
(-) The bottom heats up to a maximum of 60 °C / 140 F, compared to the average of 43.3 °C / 110 F
(±) In idle usage, the average temperature for the upper side is 32.9 °C / 91 F, compared to the device average of 33.9 °C / 93 F.
(-) Playing The Witcher 3, the average temperature for the upper side is 43.3 °C / 110 F, compared to the device average of 33.9 °C / 93 F.
(±) The palmrests and touchpad can get very hot to the touch with a maximum of 38 °C / 100.4 F.
(-) The average temperature of the palmrest area of similar devices was 28.8 °C / 83.8 F (-9.2 °C / -16.6 F).
| Schenker XMG Focus 17 i7-11800H, GeForce RTX 3050 Ti Laptop GPU | Asus ROG Strix G17 G713QE-RB74 R7 5800H, GeForce RTX 3050 Ti Laptop GPU | Acer Nitro 5 AN517-53-54DQ i5-11300H, GeForce RTX 3050 4GB Laptop GPU | MSI Katana GF76 11UE i7-11800H, GeForce RTX 3060 Laptop GPU | Asus TUF Gaming F17 FX706HM i9-11900H, GeForce RTX 3060 Laptop GPU | Average of class Gaming | |
|---|---|---|---|---|---|---|
| Heat | 11% | 21% | 13% | -5% | 14% | |
| Maximum Upper Side * (°C) | 50 | 43.8 12% | 47 6% | 51 -2% | 58.5 -17% | 45.7 ? 9% |
| Maximum Bottom * (°C) | 60 | 47.2 21% | 54 10% | 52 13% | 58.5 2% | 48.7 ? 19% |
| Idle Upper Side * (°C) | 37 | 33.4 10% | 25 32% | 32 14% | 38 -3% | 31.4 ? 15% |
| Idle Bottom * (°C) | 39 | 39.4 -1% | 25 36% | 29 26% | 39 -0% | 34.5 ? 12% |
* ... smaller is better
Speakers
Based on our audio analysis, the device's sound quality leaves a lot to be desired - even more than with the Focus 15. There's room for improvement in all ranges. The Asus ROG Strix G17 is in a league of its own in terms of sound quality.
Schenker XMG Focus 17 audio analysis
(±) | speaker loudness is average but good (81 dB)
Bass 100 - 315 Hz
(-) | nearly no bass - on average 23.3% lower than median
(±) | linearity of bass is average (11.8% delta to prev. frequency)
Mids 400 - 2000 Hz
(±) | higher mids - on average 12.9% higher than median
(±) | linearity of mids is average (12.8% delta to prev. frequency)
Highs 2 - 16 kHz
(+) | balanced highs - only 4.6% away from median
(±) | linearity of highs is average (8.3% delta to prev. frequency)
Overall 100 - 16.000 Hz
(-) | overall sound is not linear (32.1% difference to median)
Compared to same class
» 97% of all tested devices in this class were better, 1% similar, 2% worse
» The best had a delta of 6%, average was 18%, worst was 132%
Compared to all devices tested
» 91% of all tested devices were better, 2% similar, 7% worse
» The best had a delta of 4%, average was 24%, worst was 134%
Asus ROG Strix G17 G713QE-RB74 audio analysis
(±) | speaker loudness is average but good (73.5 dB)
Bass 100 - 315 Hz
(±) | reduced bass - on average 13% lower than median
(±) | linearity of bass is average (9.8% delta to prev. frequency)
Mids 400 - 2000 Hz
(±) | higher mids - on average 5.6% higher than median
(+) | mids are linear (6.5% delta to prev. frequency)
Highs 2 - 16 kHz
(+) | balanced highs - only 3.4% away from median
(±) | linearity of highs is average (12% delta to prev. frequency)
Overall 100 - 16.000 Hz
(±) | linearity of overall sound is average (16.9% difference to median)
Compared to same class
» 44% of all tested devices in this class were better, 11% similar, 45% worse
» The best had a delta of 6%, average was 18%, worst was 132%
Compared to all devices tested
» 29% of all tested devices were better, 8% similar, 63% worse
» The best had a delta of 4%, average was 24%, worst was 134%
Energy management
Energy consumption
Although the Focus 17 offers graphics switching (Nvidia Optimus), the idle consumption rates are pretty high at 23 to 30 watts. Most of the competition uses less than 20 watts. In 3D mode, however, energy consumption correlates quite well with the TGP and graphics performance as the following table shows.
| Off / Standby | |
| Idle | |
| Load |
|
Key:
min: | |
| Schenker XMG Focus 17 i7-11800H, GeForce RTX 3050 Ti Laptop GPU | Asus ROG Strix G17 G713QE-RB74 R7 5800H, GeForce RTX 3050 Ti Laptop GPU | Acer Nitro 5 AN517-53-54DQ i5-11300H, GeForce RTX 3050 4GB Laptop GPU | MSI Katana GF76 11UE i7-11800H, GeForce RTX 3060 Laptop GPU | Asus TUF Gaming F17 FX706HM i9-11900H, GeForce RTX 3060 Laptop GPU | Average of class Gaming | |
|---|---|---|---|---|---|---|
| Power Consumption | 24% | 42% | 19% | 21% | 4% | |
| Idle Minimum * (Watt) | 23 | 9.2 60% | 4 83% | 9 61% | 10.3 55% | 13.6 ? 41% |
| Idle Average * (Watt) | 25 | 12.6 50% | 9 64% | 13 48% | 13.1 48% | 19.3 ? 23% |
| Idle Maximum * (Watt) | 30 | 23.3 22% | 15 50% | 20 33% | 14.1 53% | 25 ? 17% |
| Load Average * (Watt) | 103 | 89.3 13% | 85 17% | 102 1% | 110 -7% | 110.2 ? -7% |
| Witcher 3 ultra * (Watt) | 129 | 136 -5% | 104 19% | 149 -16% | 138 -7% | |
| Load Maximum * (Watt) | 166 | 162.7 2% | 135 19% | 187 -13% | 190 -14% | 257 ? -55% |
* ... smaller is better
Energy consumption during The Witcher 3
Battery life
For the battery tests, we used the Entertainment Mode instead of the Performance Mode as an exception. The built-in 49 Wh battery doesn't provide long runtimes, unfortunately. The Focus 17 only lasted 3:46 hours in the Wi-Fi test with medium brightness. The Acer Nitro 5 and the Asus TUF 17 managed over 7 hours here.
| Schenker XMG Focus 17 i7-11800H, GeForce RTX 3050 Ti Laptop GPU, 49 Wh | Asus ROG Strix G17 G713QE-RB74 R7 5800H, GeForce RTX 3050 Ti Laptop GPU, 56 Wh | Acer Nitro 5 AN517-53-54DQ i5-11300H, GeForce RTX 3050 4GB Laptop GPU, 57 Wh | MSI Katana GF76 11UE i7-11800H, GeForce RTX 3060 Laptop GPU, 53 Wh | Asus TUF Gaming F17 FX706HM i9-11900H, GeForce RTX 3060 Laptop GPU, 90 Wh | Average of class Gaming | |
|---|---|---|---|---|---|---|
| Battery runtime | 45% | 96% | 3% | 139% | 56% | |
| Reader / Idle (h) | 7.2 | 11.1 54% | 17.4 142% | 4.8 -33% | 8.99 ? 25% | |
| WiFi v1.3 (h) | 3.8 | 6 58% | 7.2 89% | 3.7 -3% | 7.6 100% | 6.73 ? 77% |
| Load (h) | 0.9 | 1.1 22% | 1.4 56% | 1.3 44% | 2.5 178% | 1.502 ? 67% |
| H.264 (h) | 3.9 | 8.5 | 7.93 ? | |||
| Witcher 3 ultra (h) | 0.8 | 0.958 ? |
Pros
Cons
Verdict
The XMG Focus 17 is only partially compelling for the advertised price. While the case, the input devices, and the 144 Hz display are quite appealing except for minor details, the 17-incher has a hard time against the competition in most other categories - be it battery life, the cooling system, the fan control, or sound. You can at least compensate for some of the aforementioned weaknesses by selecting other performance modes in the preinstalled Control Center (e.g. Silent Mode).
The relatively high TGP of the GeForce RTX 3050 Ti is not sufficient to match the RTX 3060.
Even though the RTX 3050 Ti can currently run almost every game at high to maximum settings, we recommend gamers to go straight for an RTX 3060 laptop. The latter's larger amount of video memory alone (6 vs. 4 GB GDDR6) clearly makes it the better choice.
In short: For a slightly lower price and with a more discreet noise level, the Focus 17 would be an interesting option. However, in its current form, we advise choosing a similarly priced but faster competitor laptop like the Asus TUF F17 FX706HM, although the availability of some of the alternatives is rather poor.
Price and availability
The XMG Focus 17 is available in the manufacturer's online store bestware.com starting at 1,239 Euros (~$1,436).
Schenker XMG Focus 17
- 09/23/2021 v7 (old)
Florian Glaser
Price comparison

