 Deutsch
 English
 Español
 Français
 Italiano
 Nederlands
 Polski
 Português
 Русский
 Türkçe
 Svenska
 Chinese
 Magyar
Sapphire Nitro+ Radeon RX 580 Desktop Graphics Card Review
For the original German, see here.
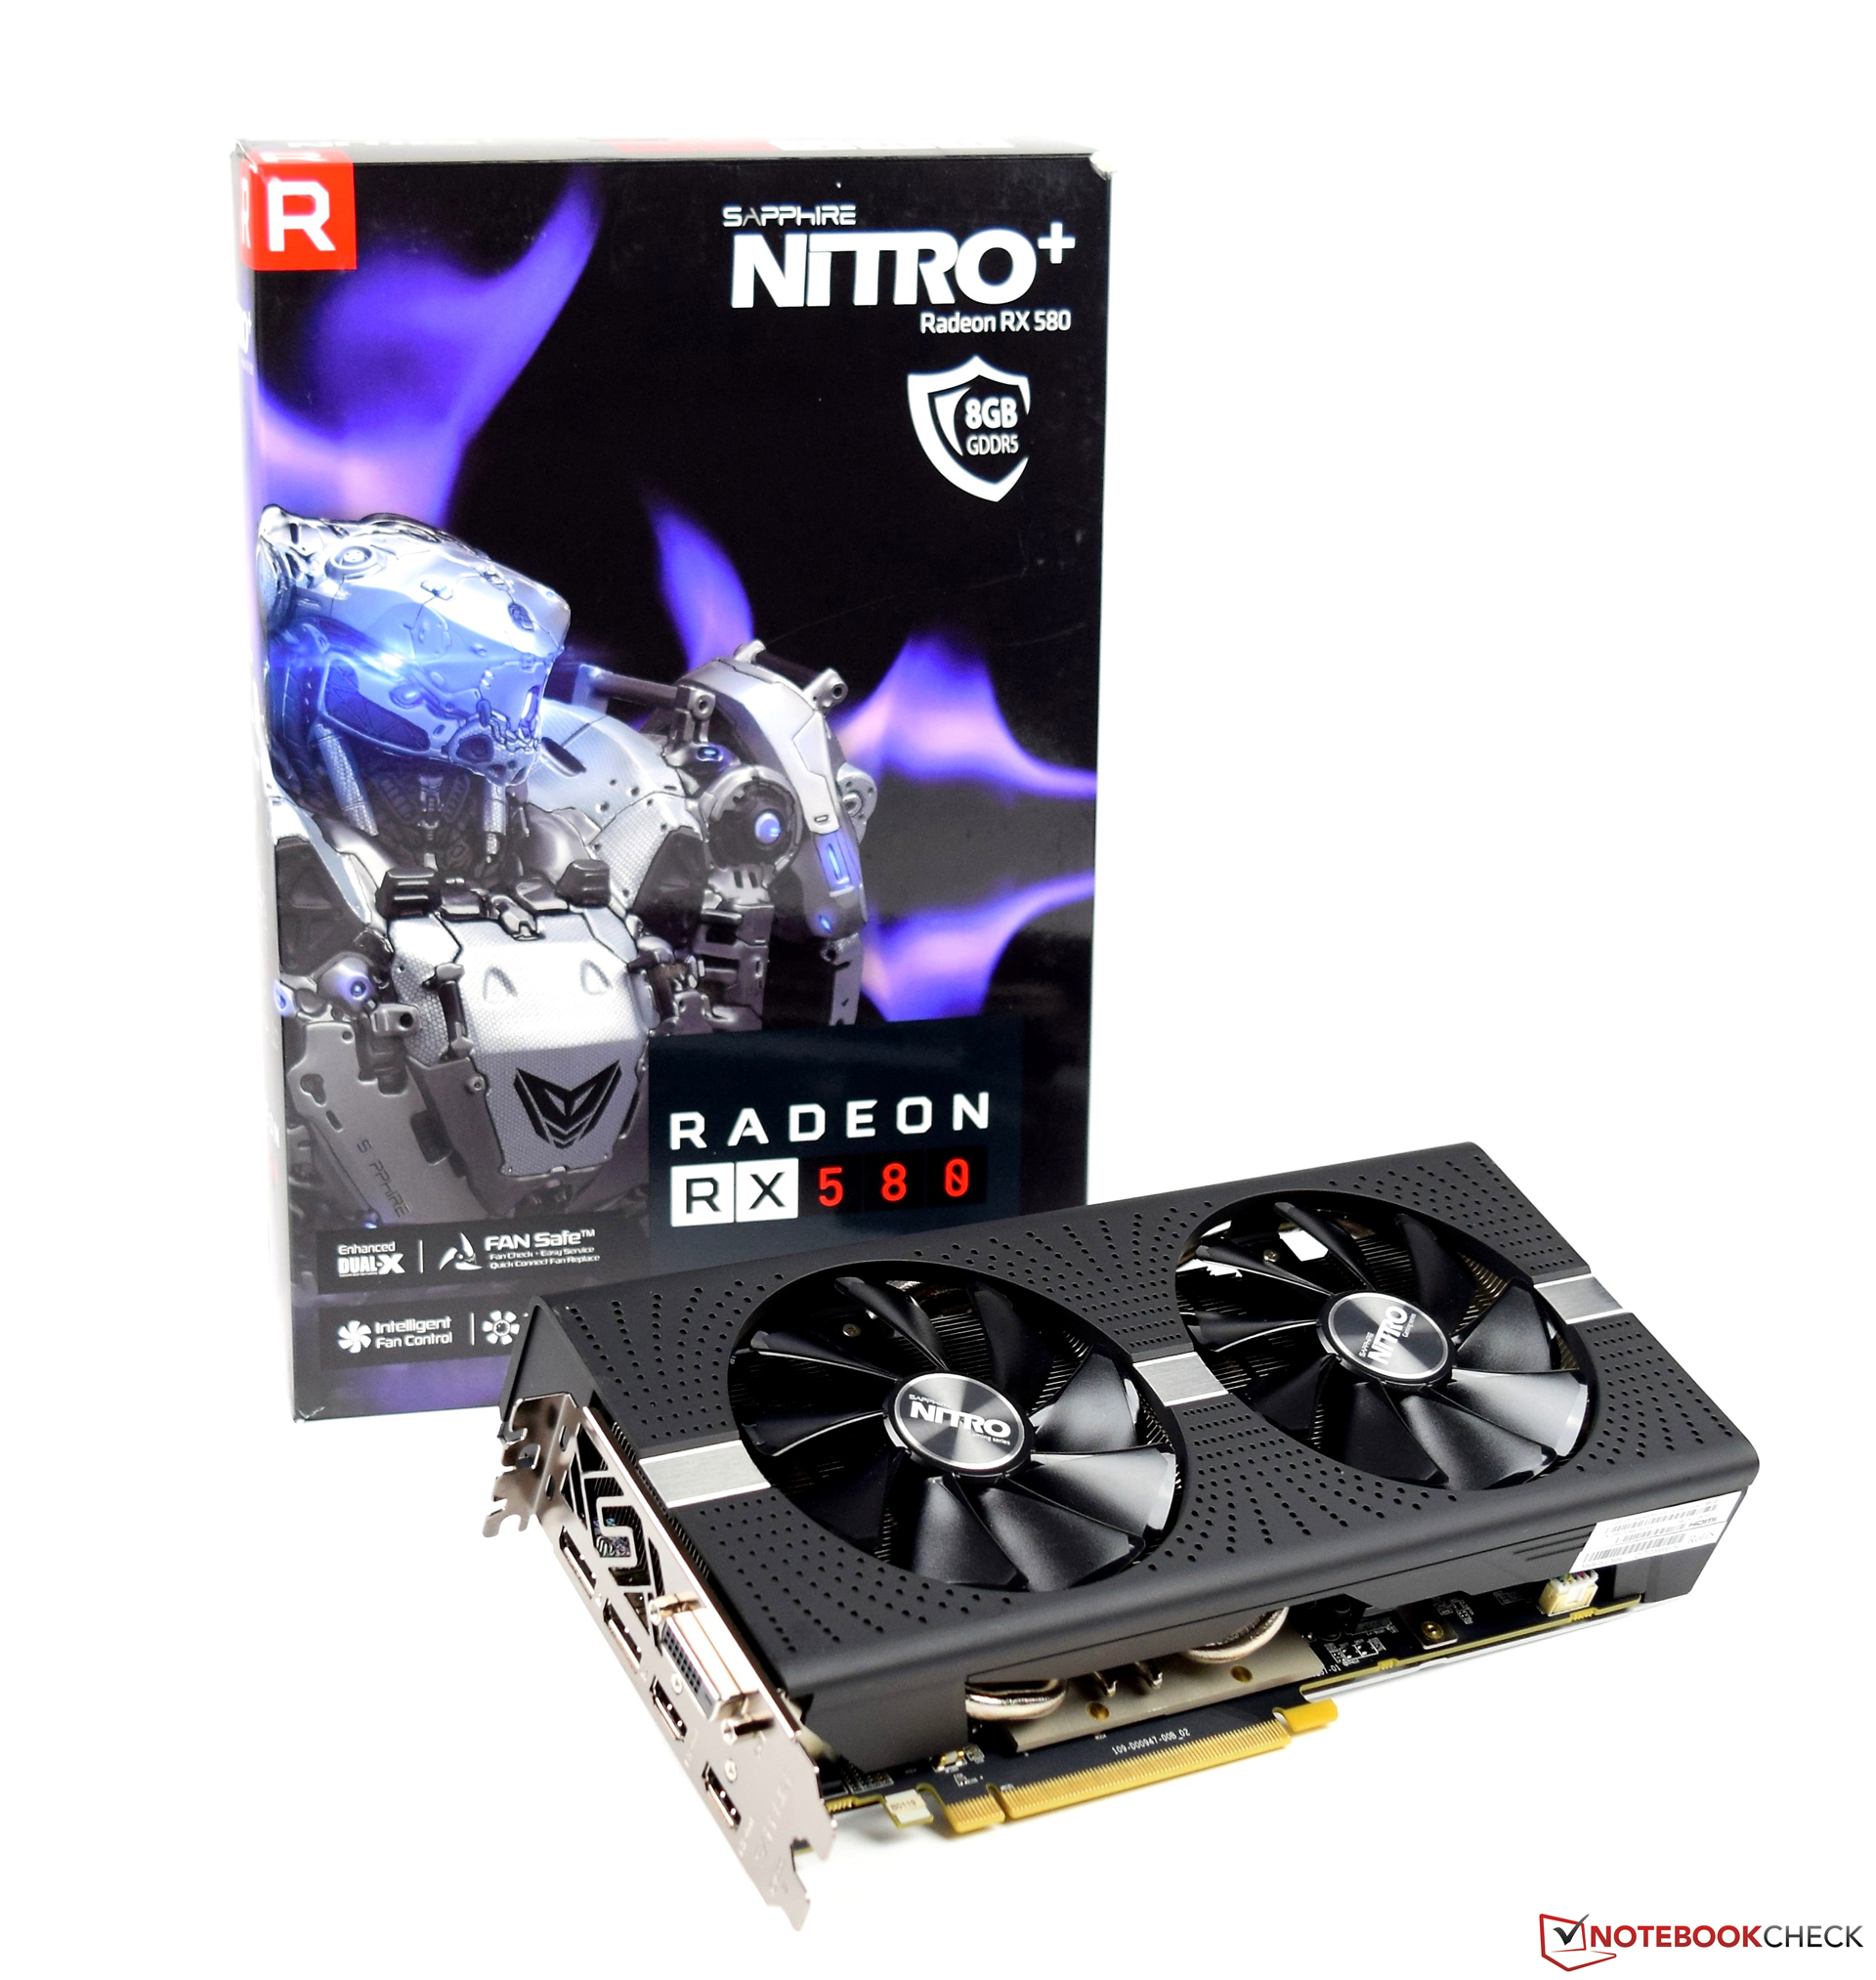
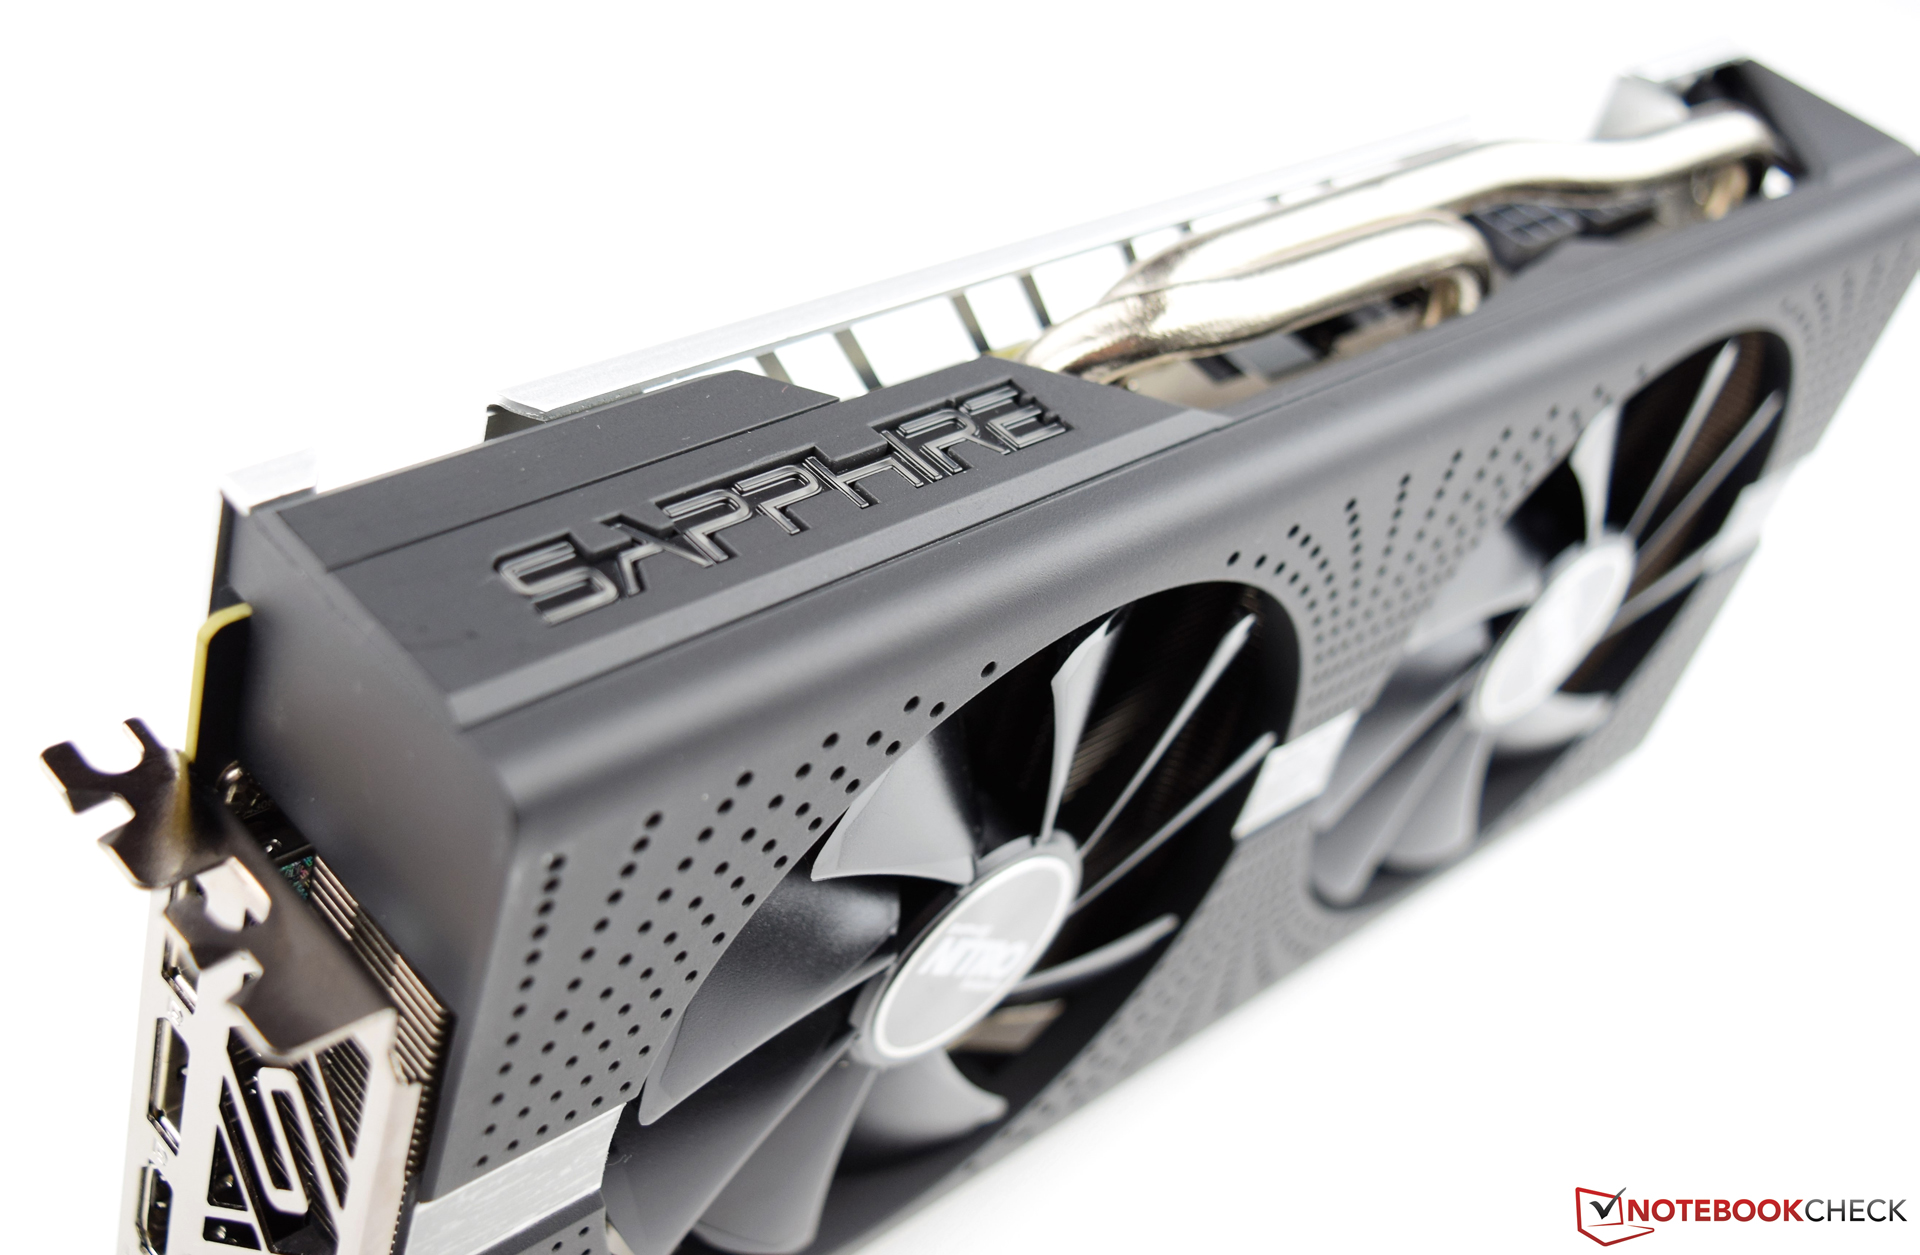
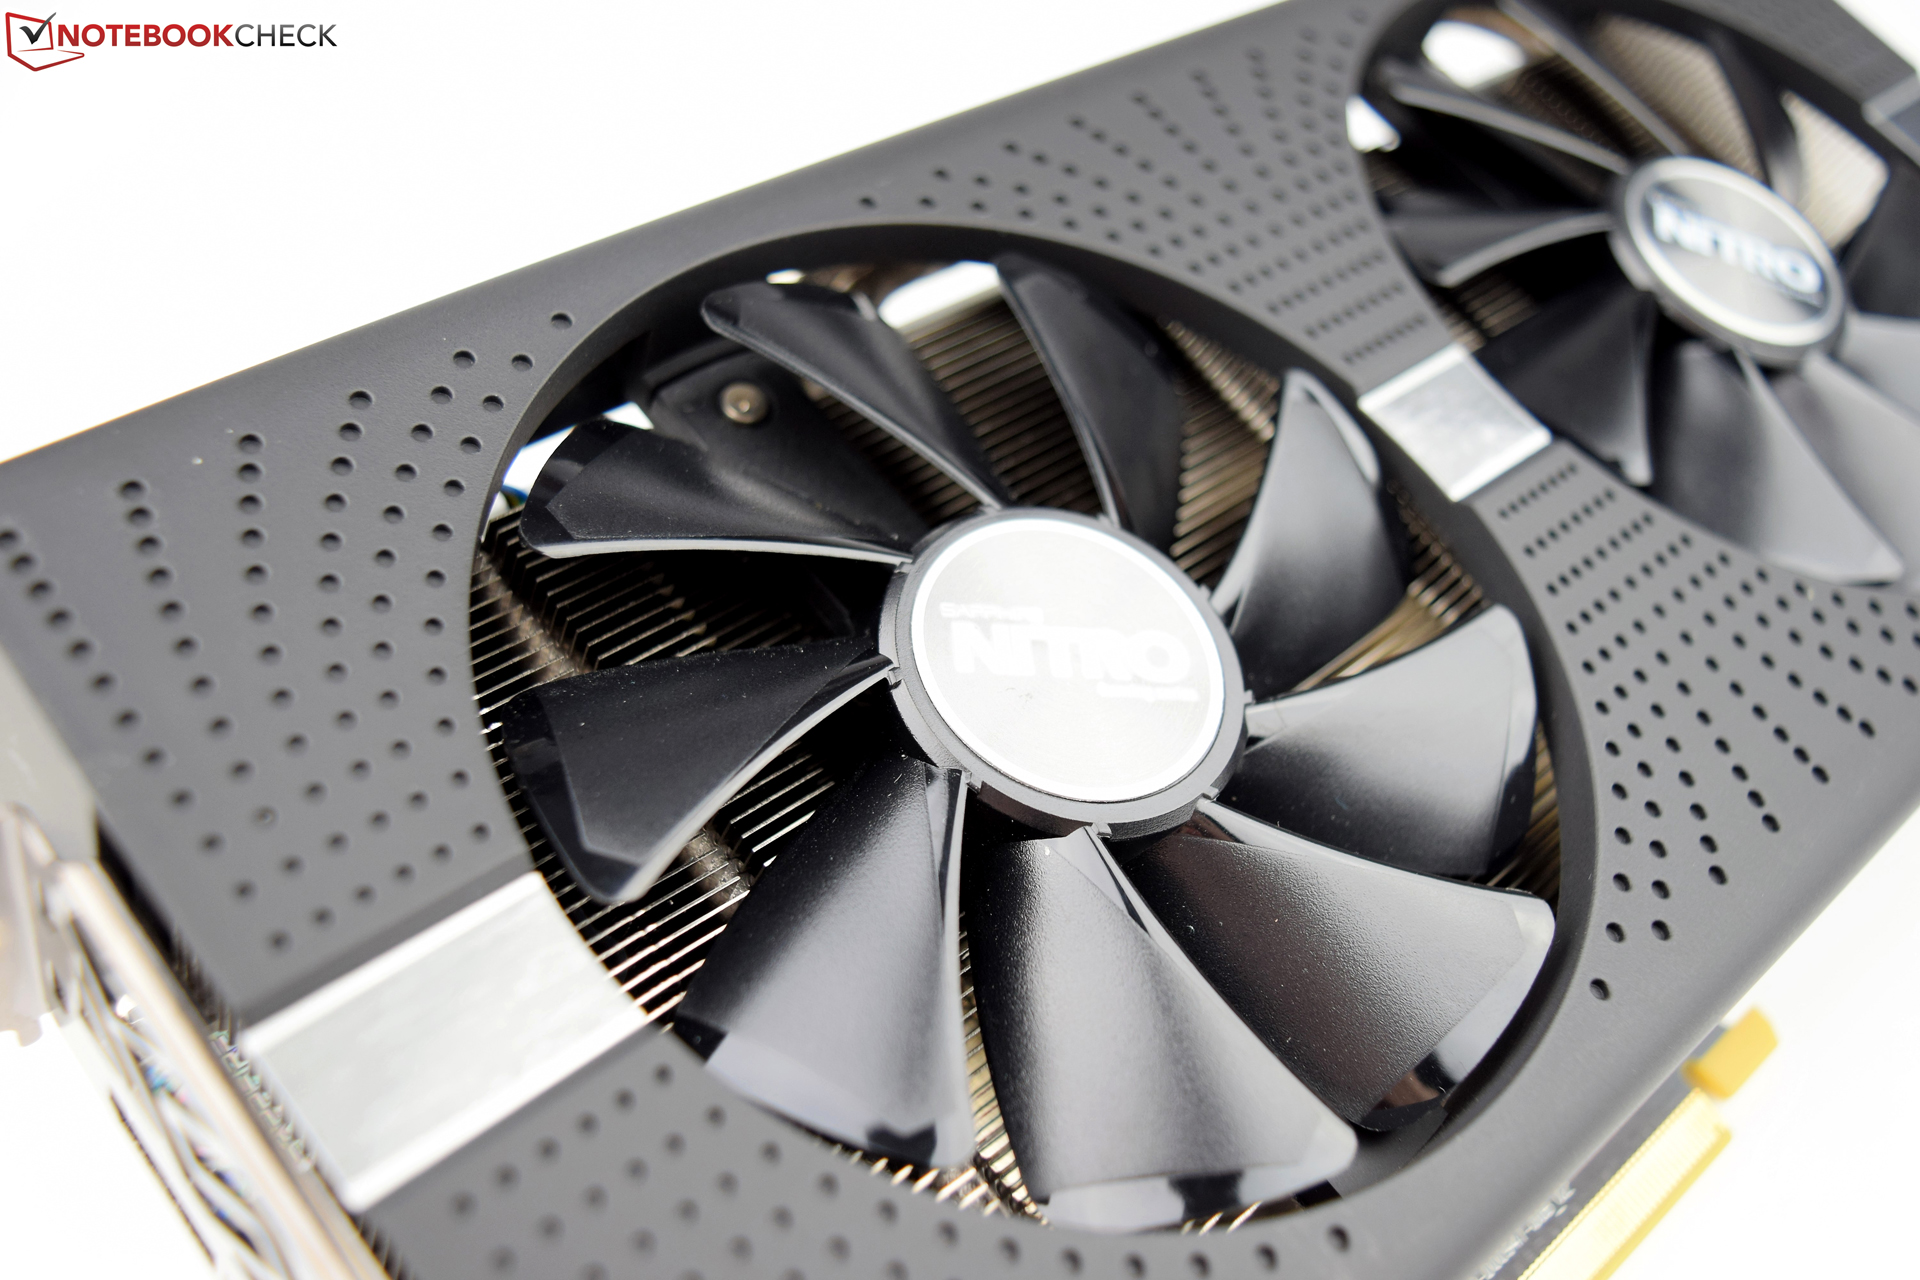
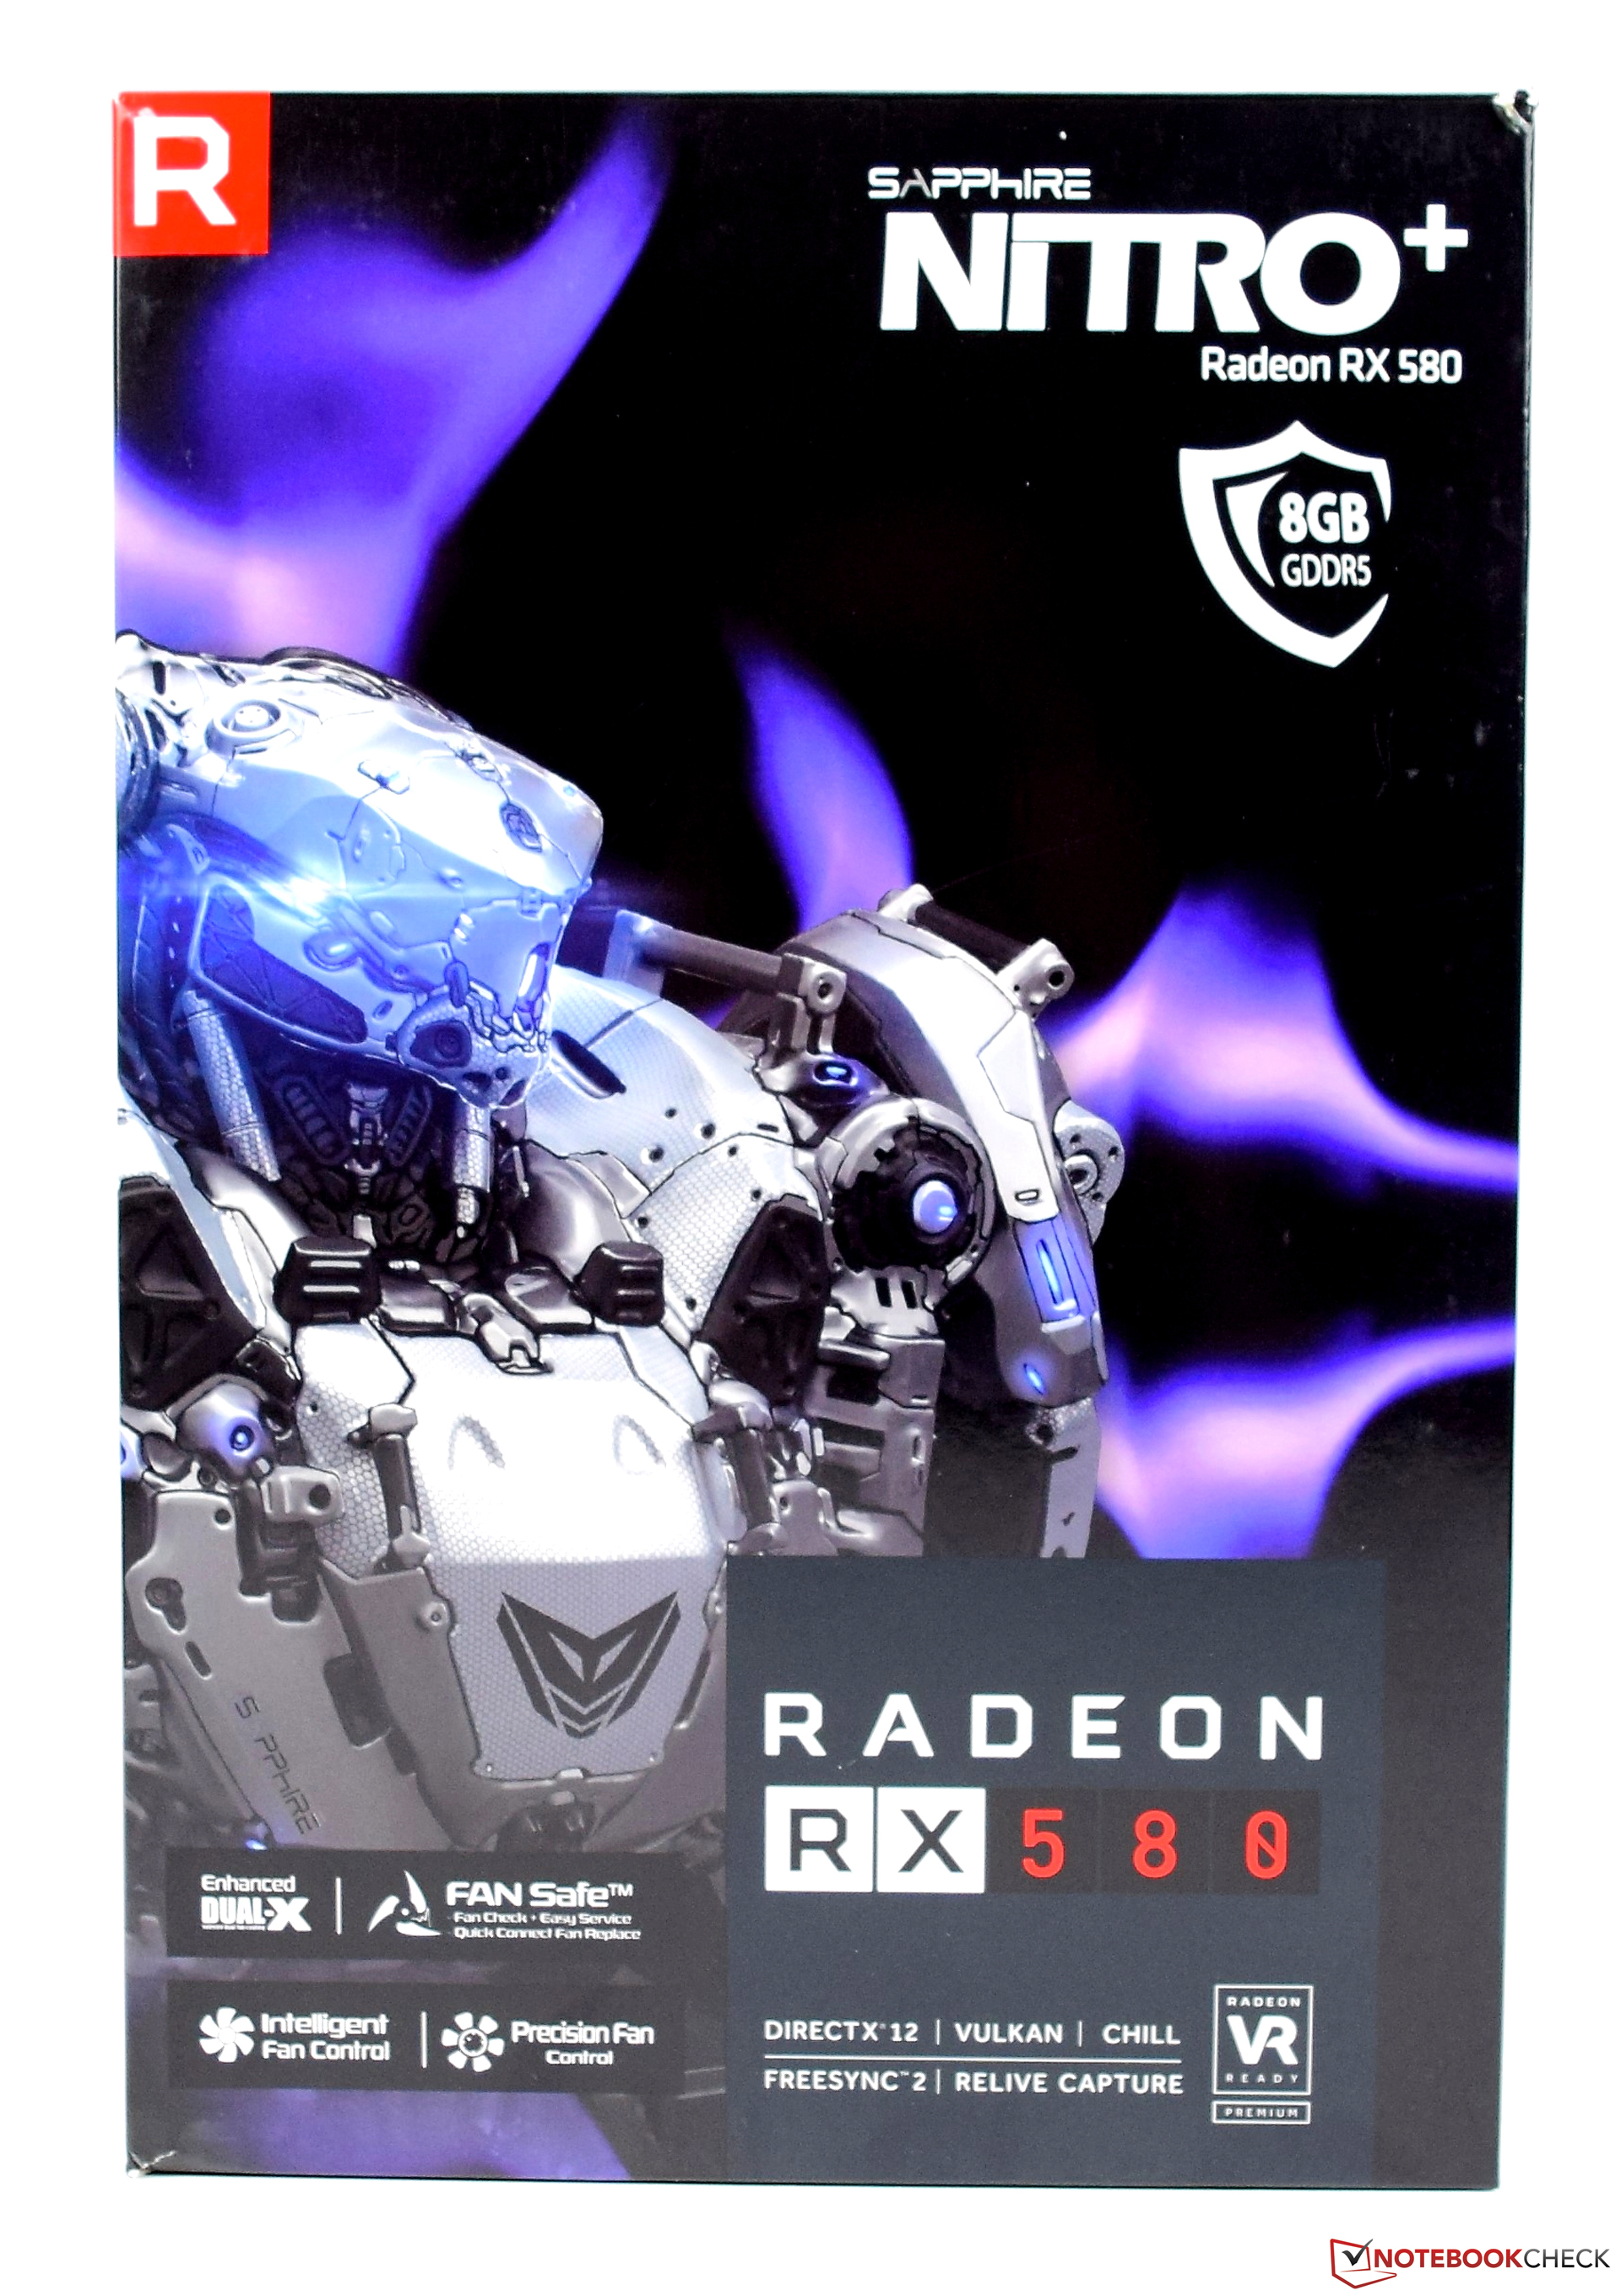
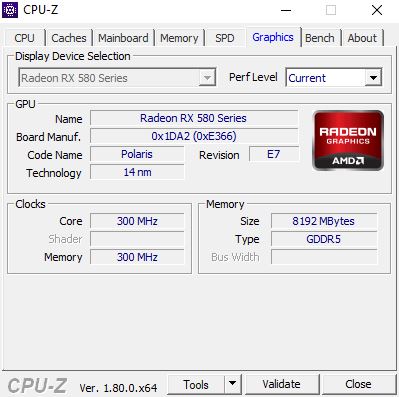
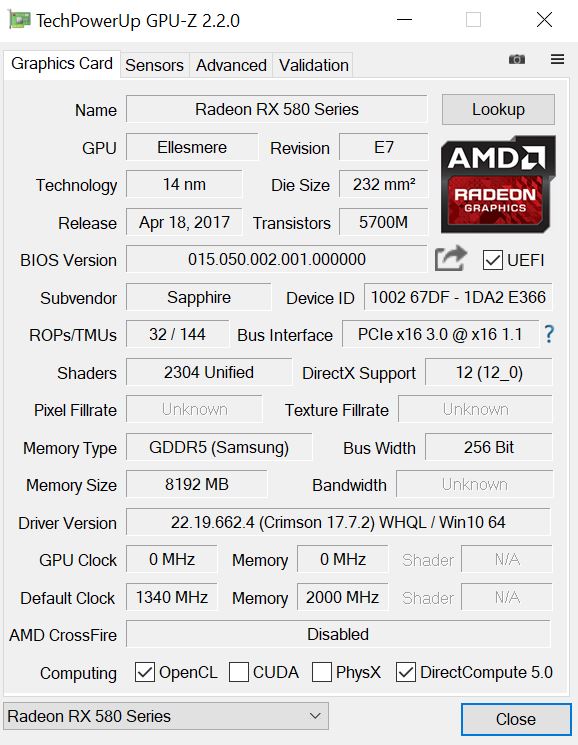
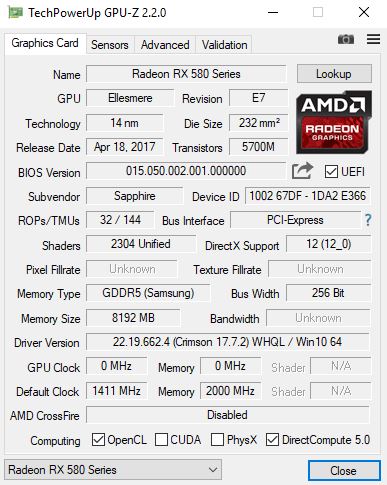
Due to the mining boom, the search for an AMD Radeon RX 580 turned out to be harder than we thought. But finally we received a test sample from AMD. However, the Sapphire model is based on a PCB that was specially designed with considerably better cooling than the reference model from AMD. Furthermore, Sapphire improves the visuals with lit-up lettering (RGB capable). It is now based on the Polaris 20 chip, which replaces the Polaris 10 of the AMD Radeon RX 480/470. It is also produced in the 14-nm process and combines about 5.7 billion transistors on the 232 mm² die. The clock speed was slightly increased and is now 1,257 MHz, which can automatically be raised to 1,340 MHz via boost. The AMD Radeon RX 580 can be equipped with 4 GB or 8 GB VRAM. In order to be prepared for the future, we would always prefer the 8-GB variant. Our test unit, the Sapphire Nitro+ Radeon RX 580 8GD5, is equipped with 8 GB GDDR5 VRAM, which communicates via the 256-Bit storage interface. In connection with the storage speed of 8 GHz, this results in a maximum storage bandwidth of 256 GB/s. From the get-go, the manufacturer slightly overclocks the graphics card, so that the Sapphire Nitro+ Radeon RX 580 possesses a standard clock speed of 1,340 MHz. With the second BIOS, which can be activated with a slider, the graphics card can then even be operated with a speed of 1,411 MHz.
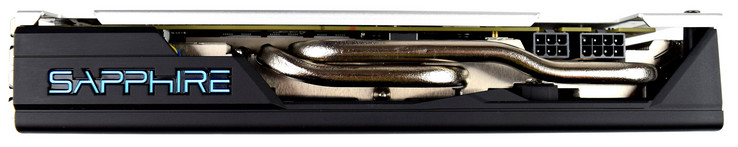
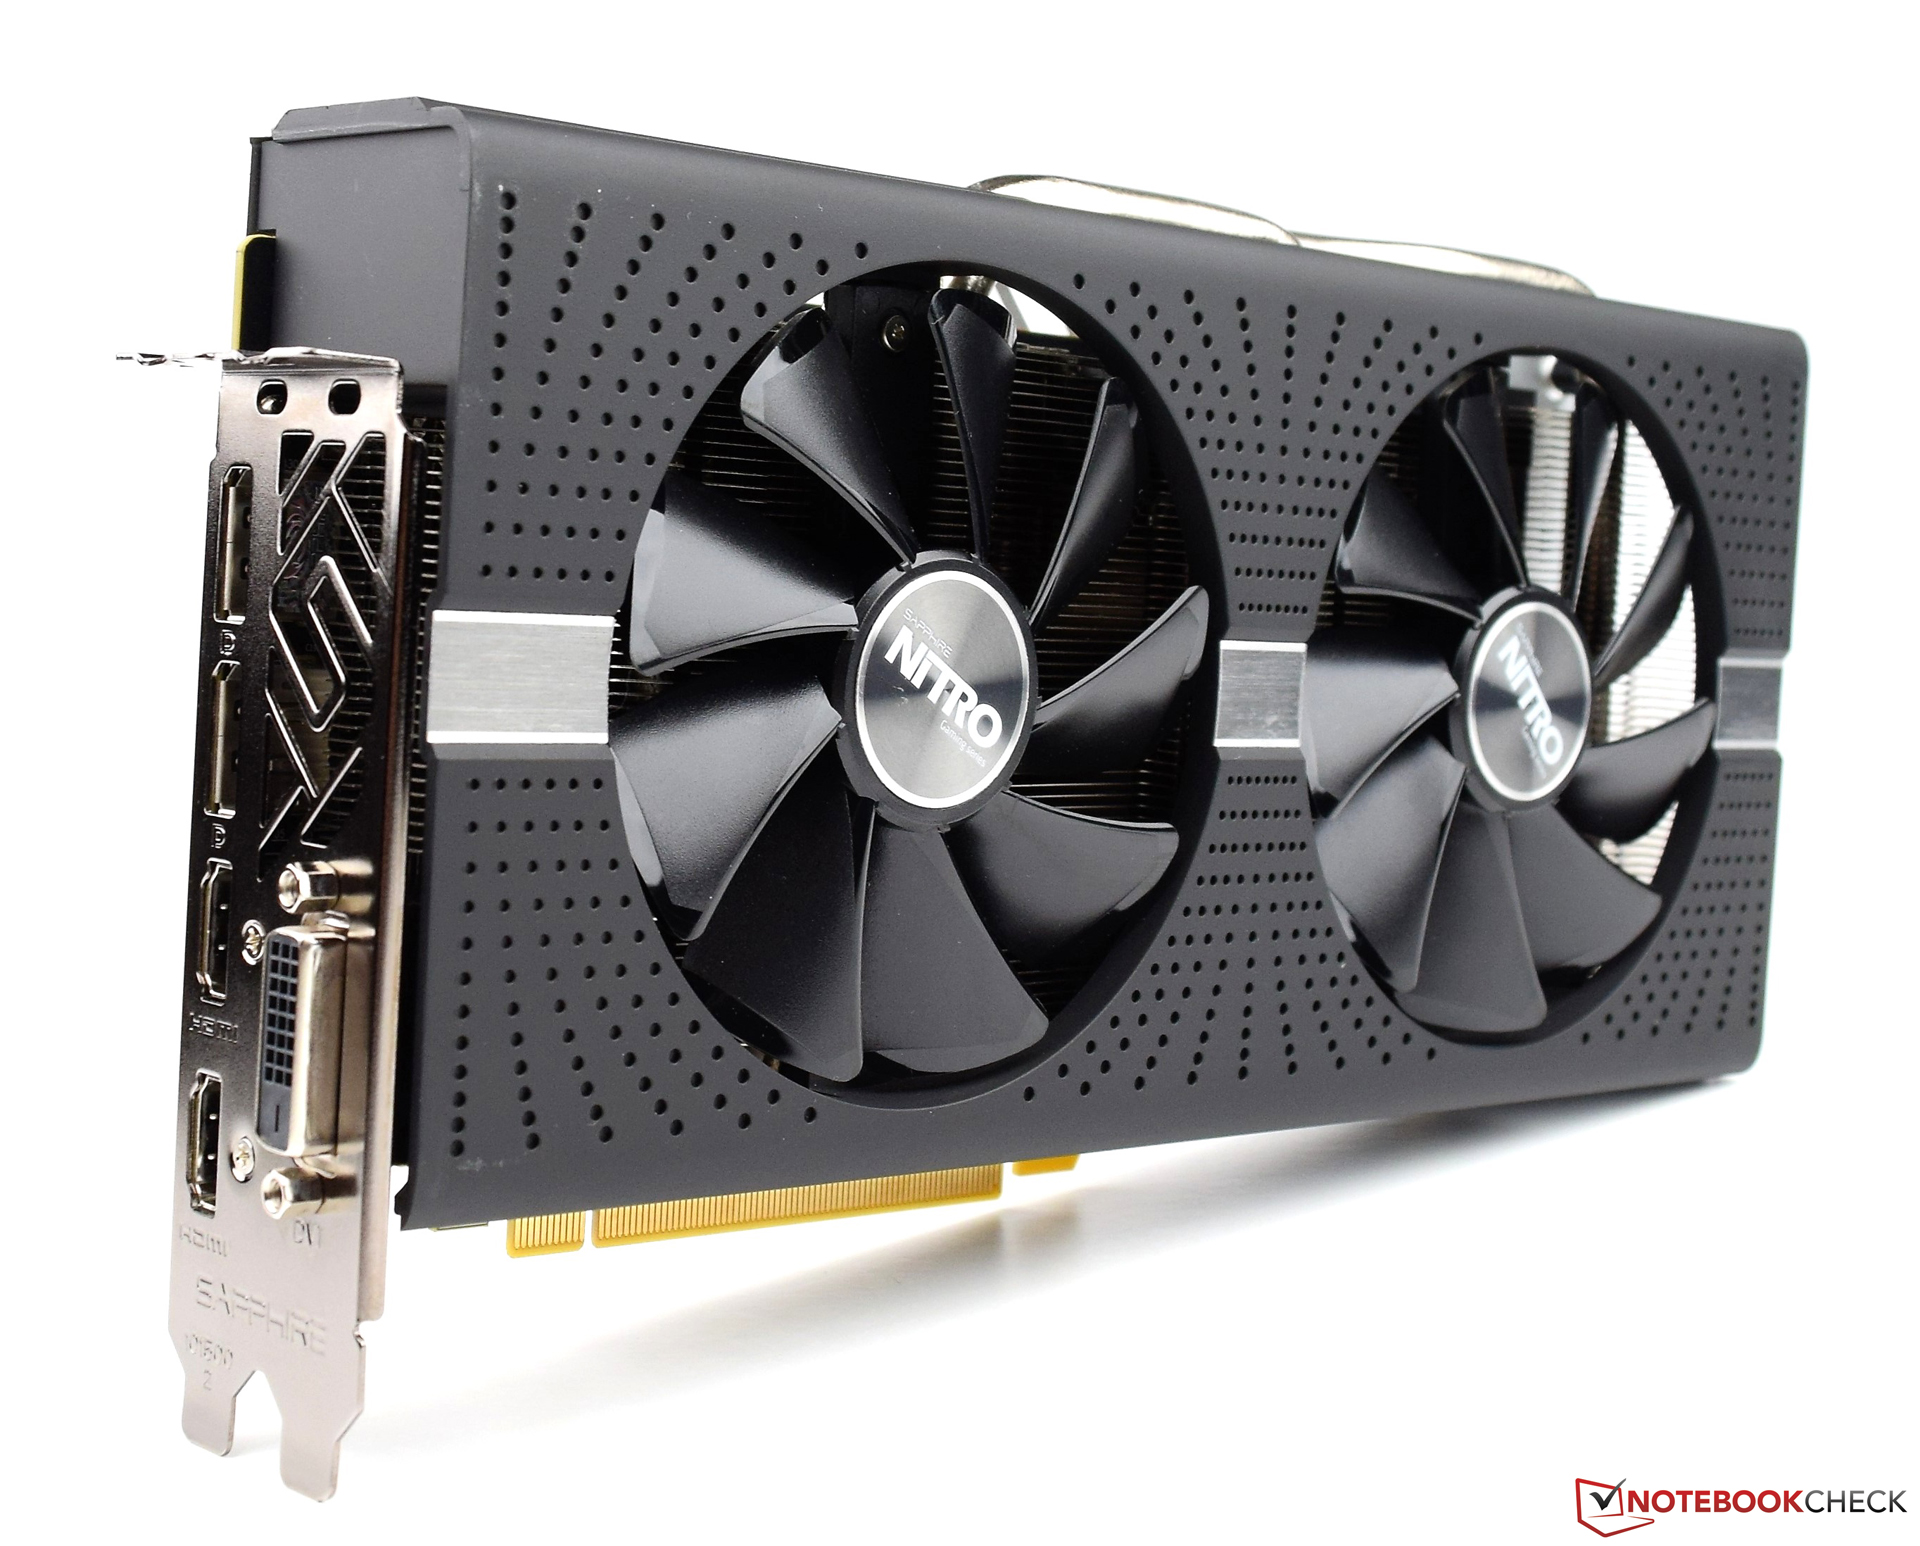
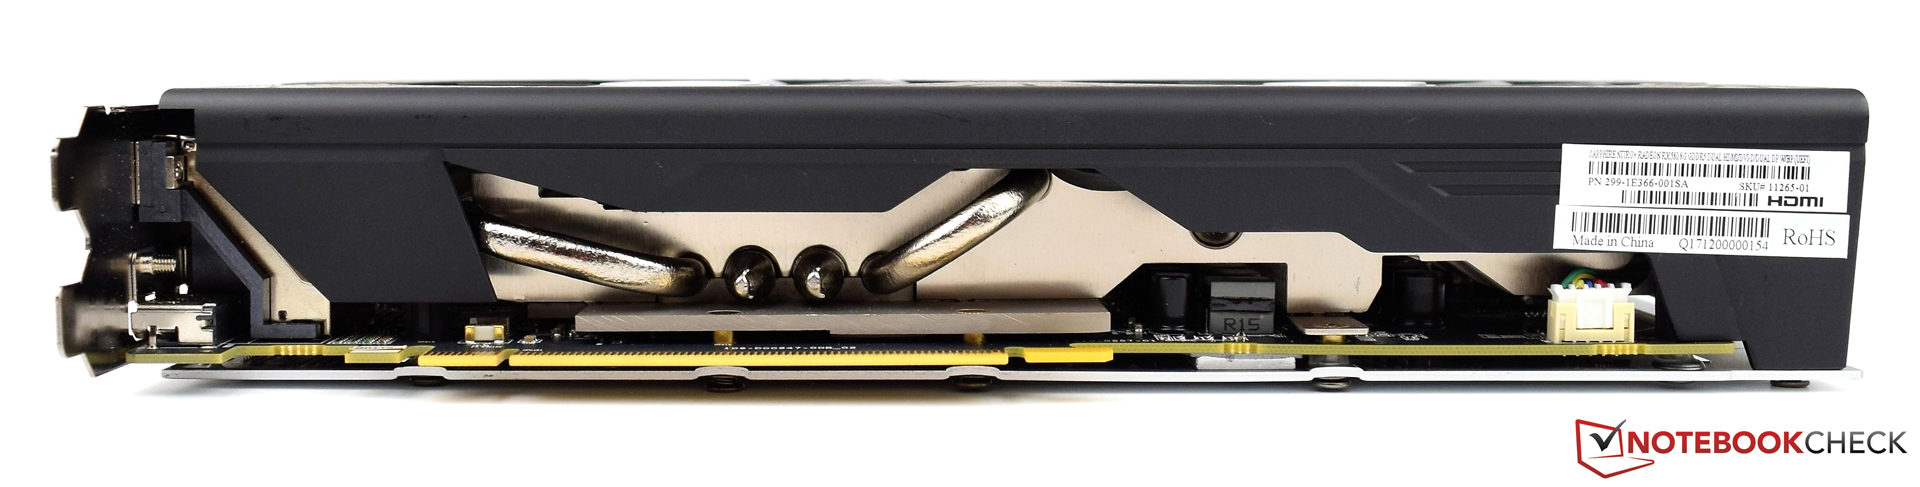
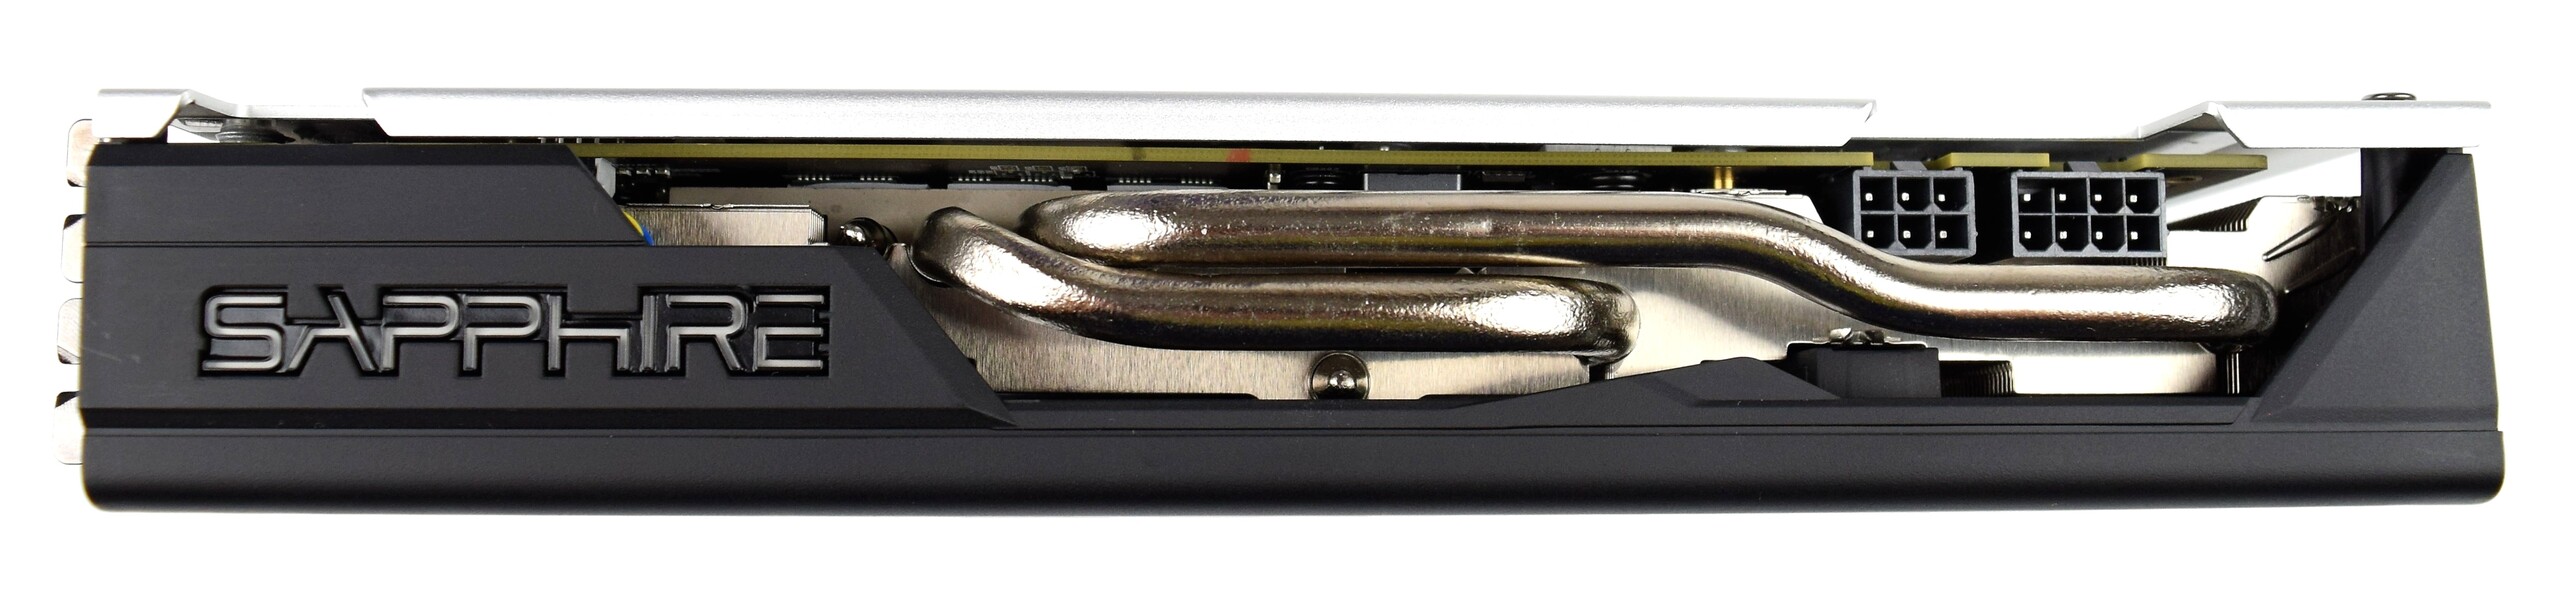
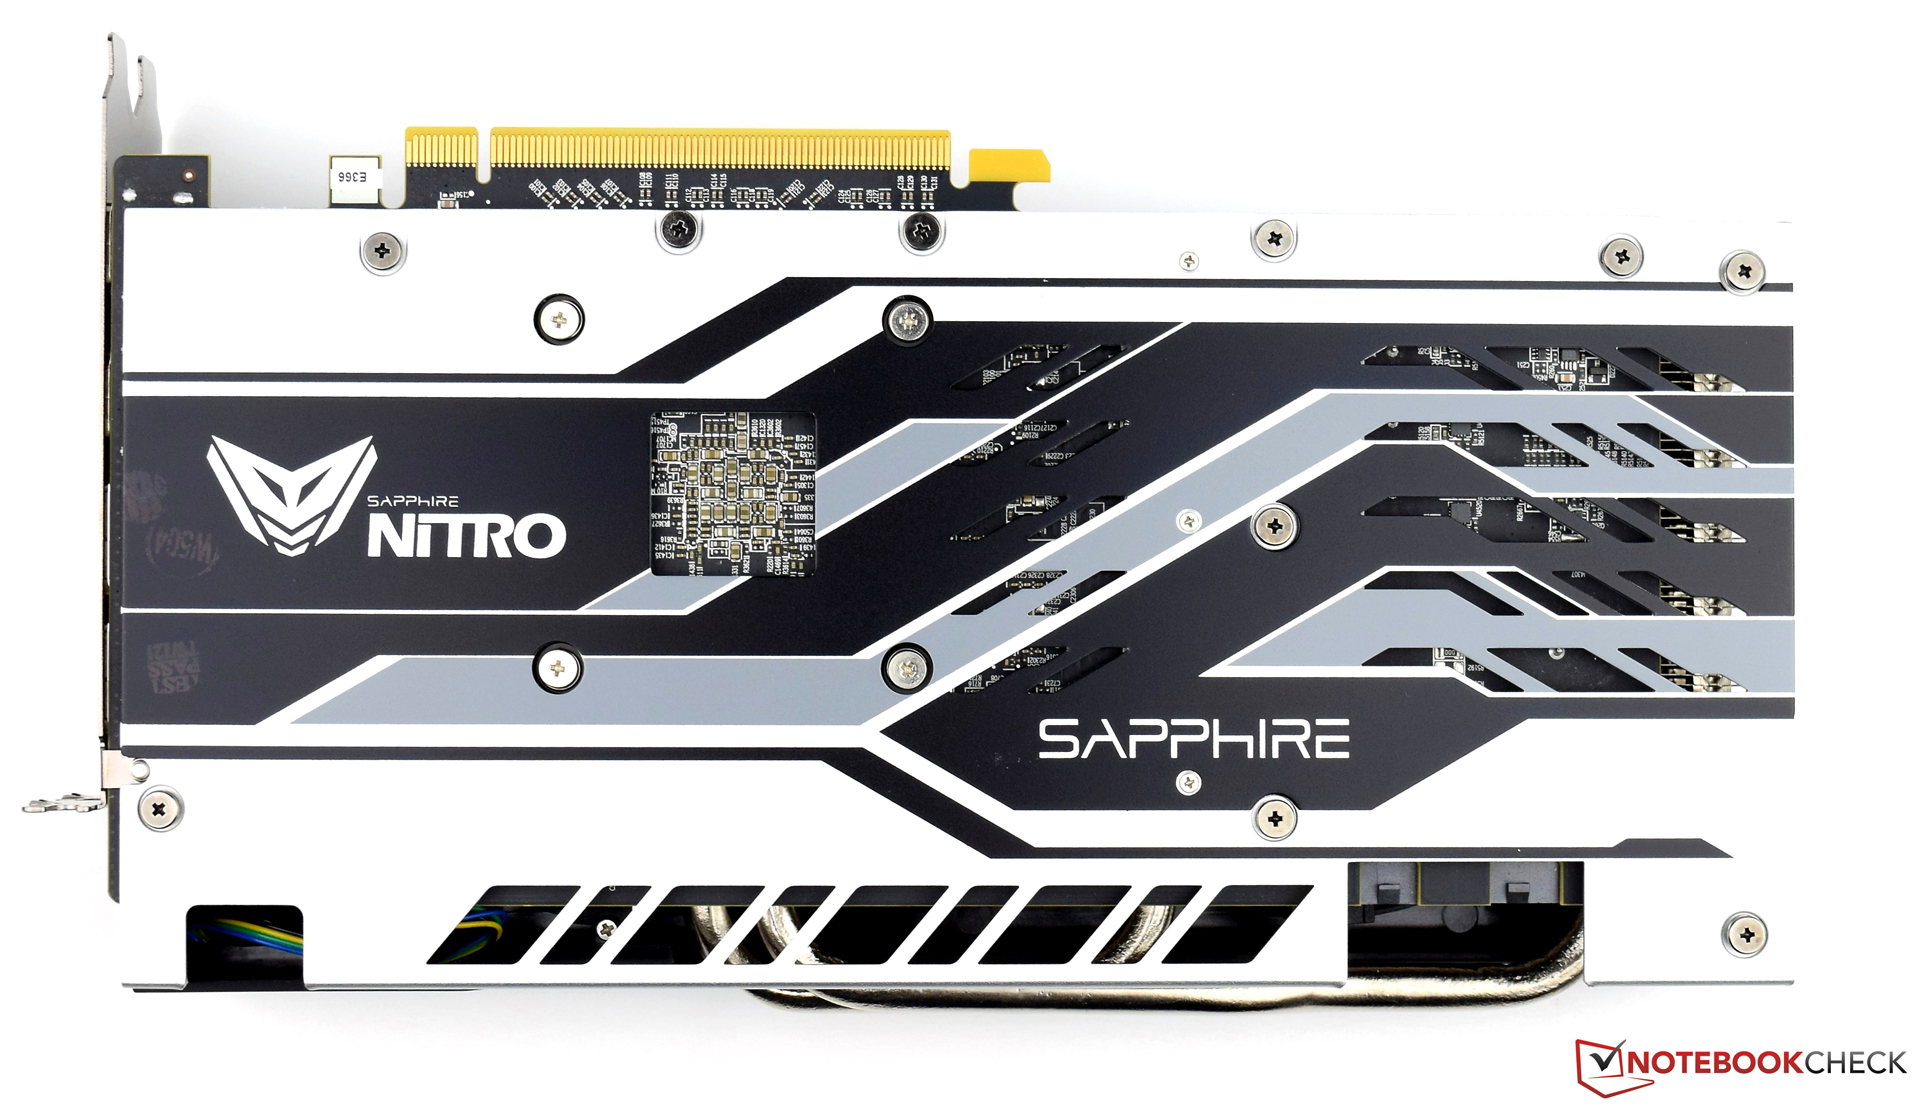
Visually, our test unit clearly differs from the reference design, which also shows in the dimensions. With a length of about 26 cm (~10.2 in) and a height of about 13.5 cm (~5.3 in), you should check before the purchase whether the case offers enough space for this. Even though the graphics card takes two slots, in order to avoid impeding the cooling unit, we advise against inserting another component into the adjacent PCIe slot.
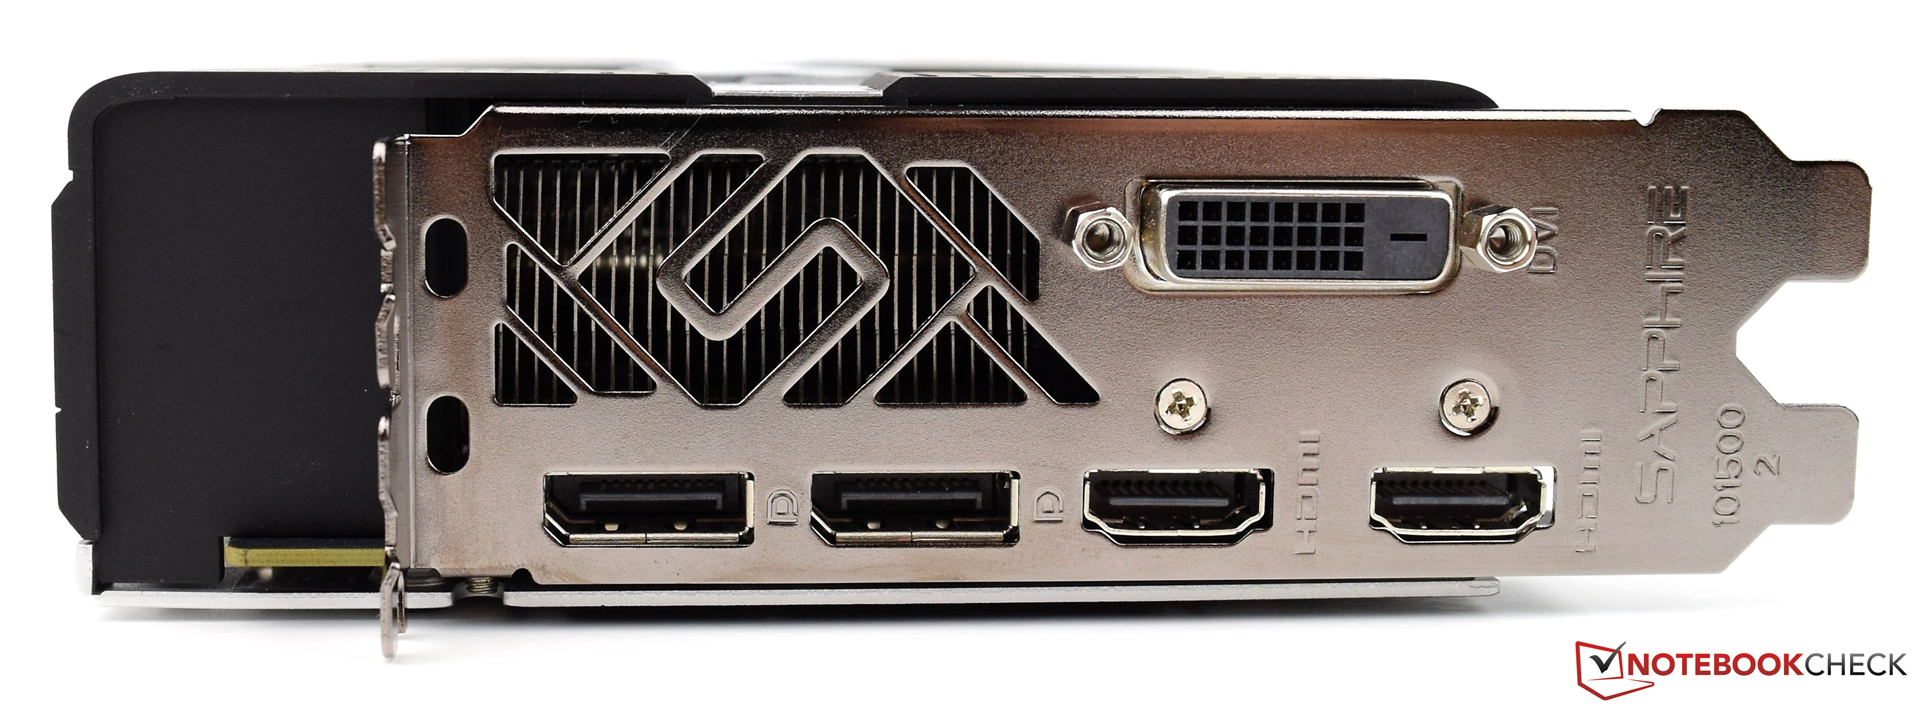
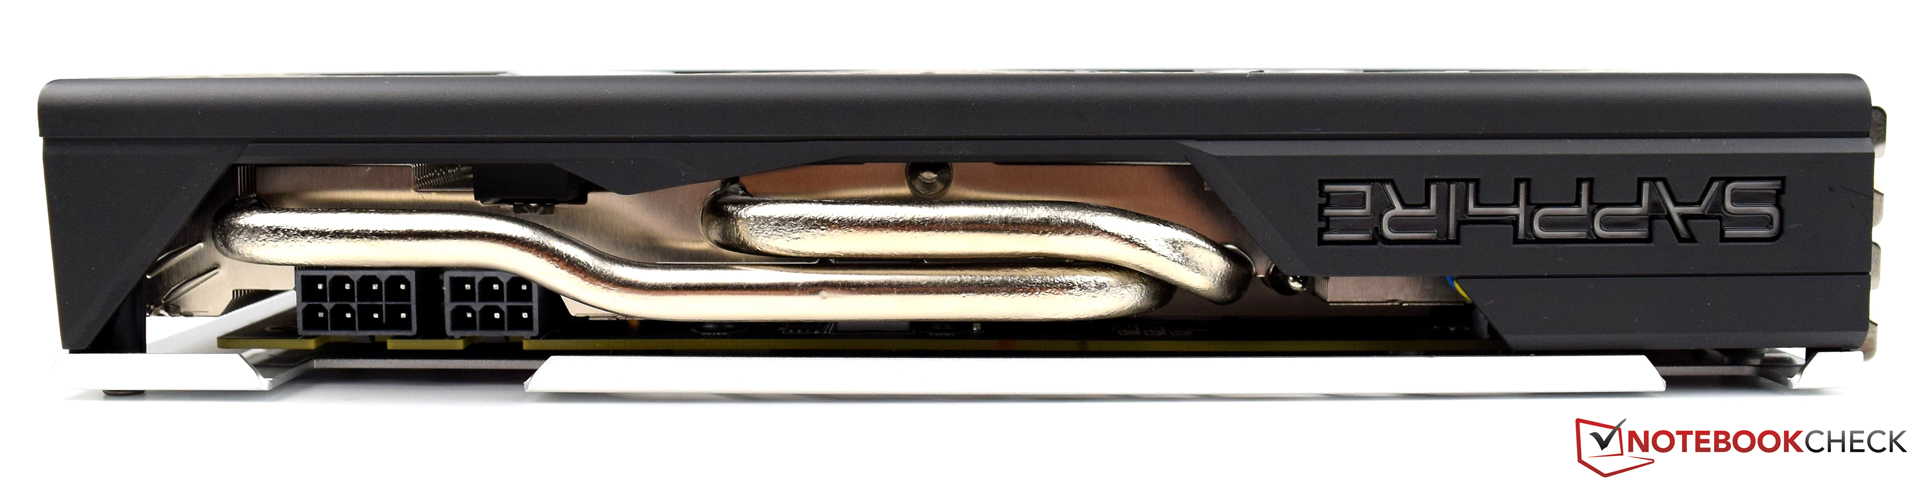
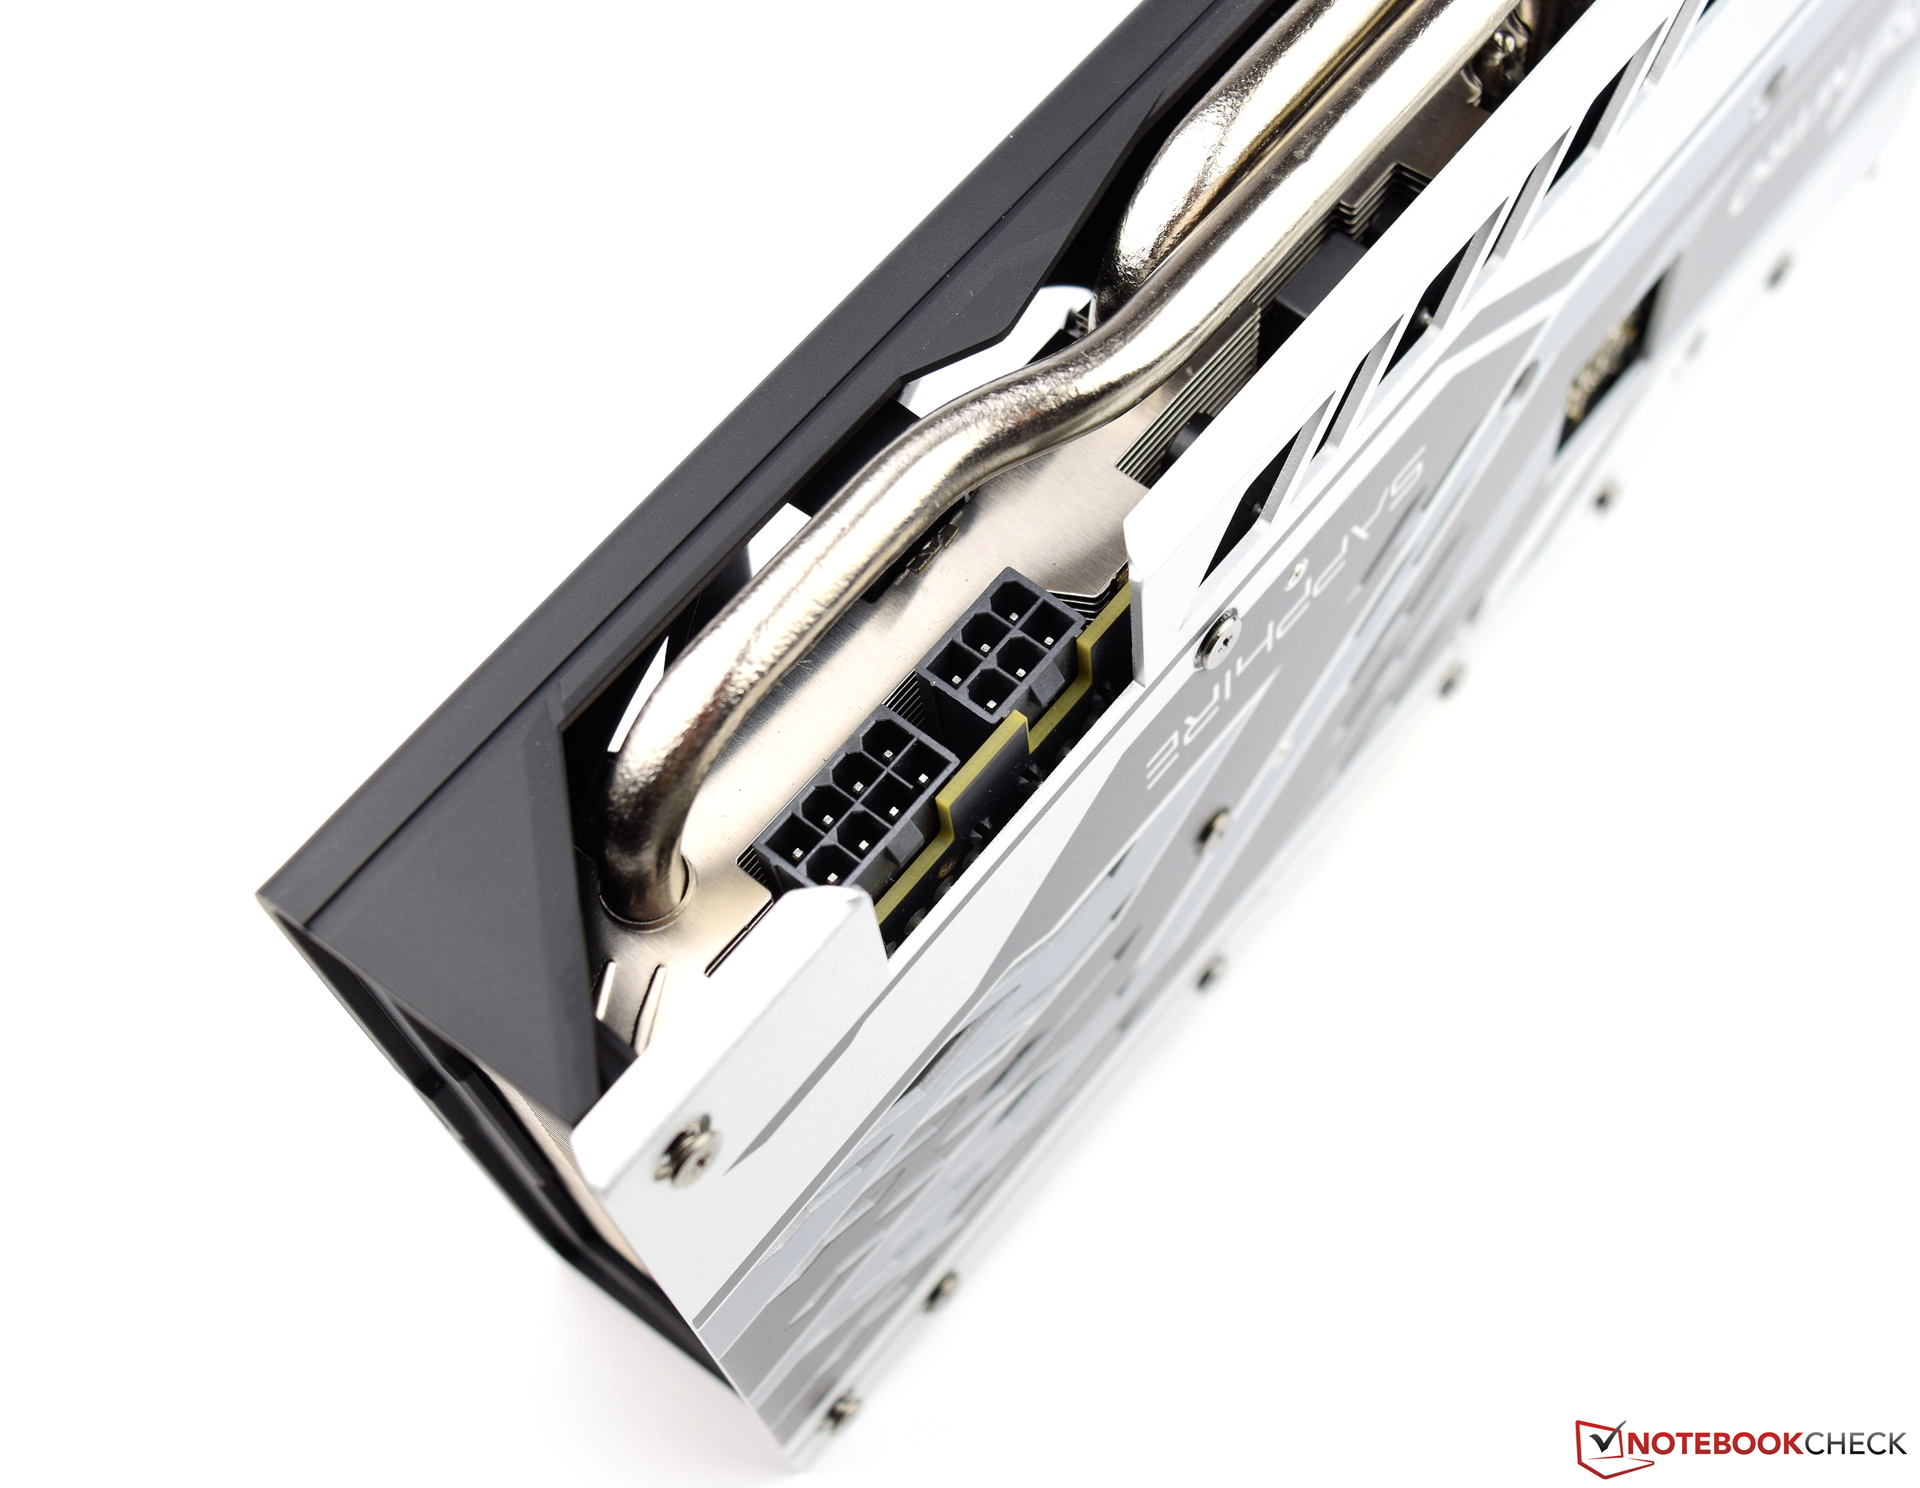
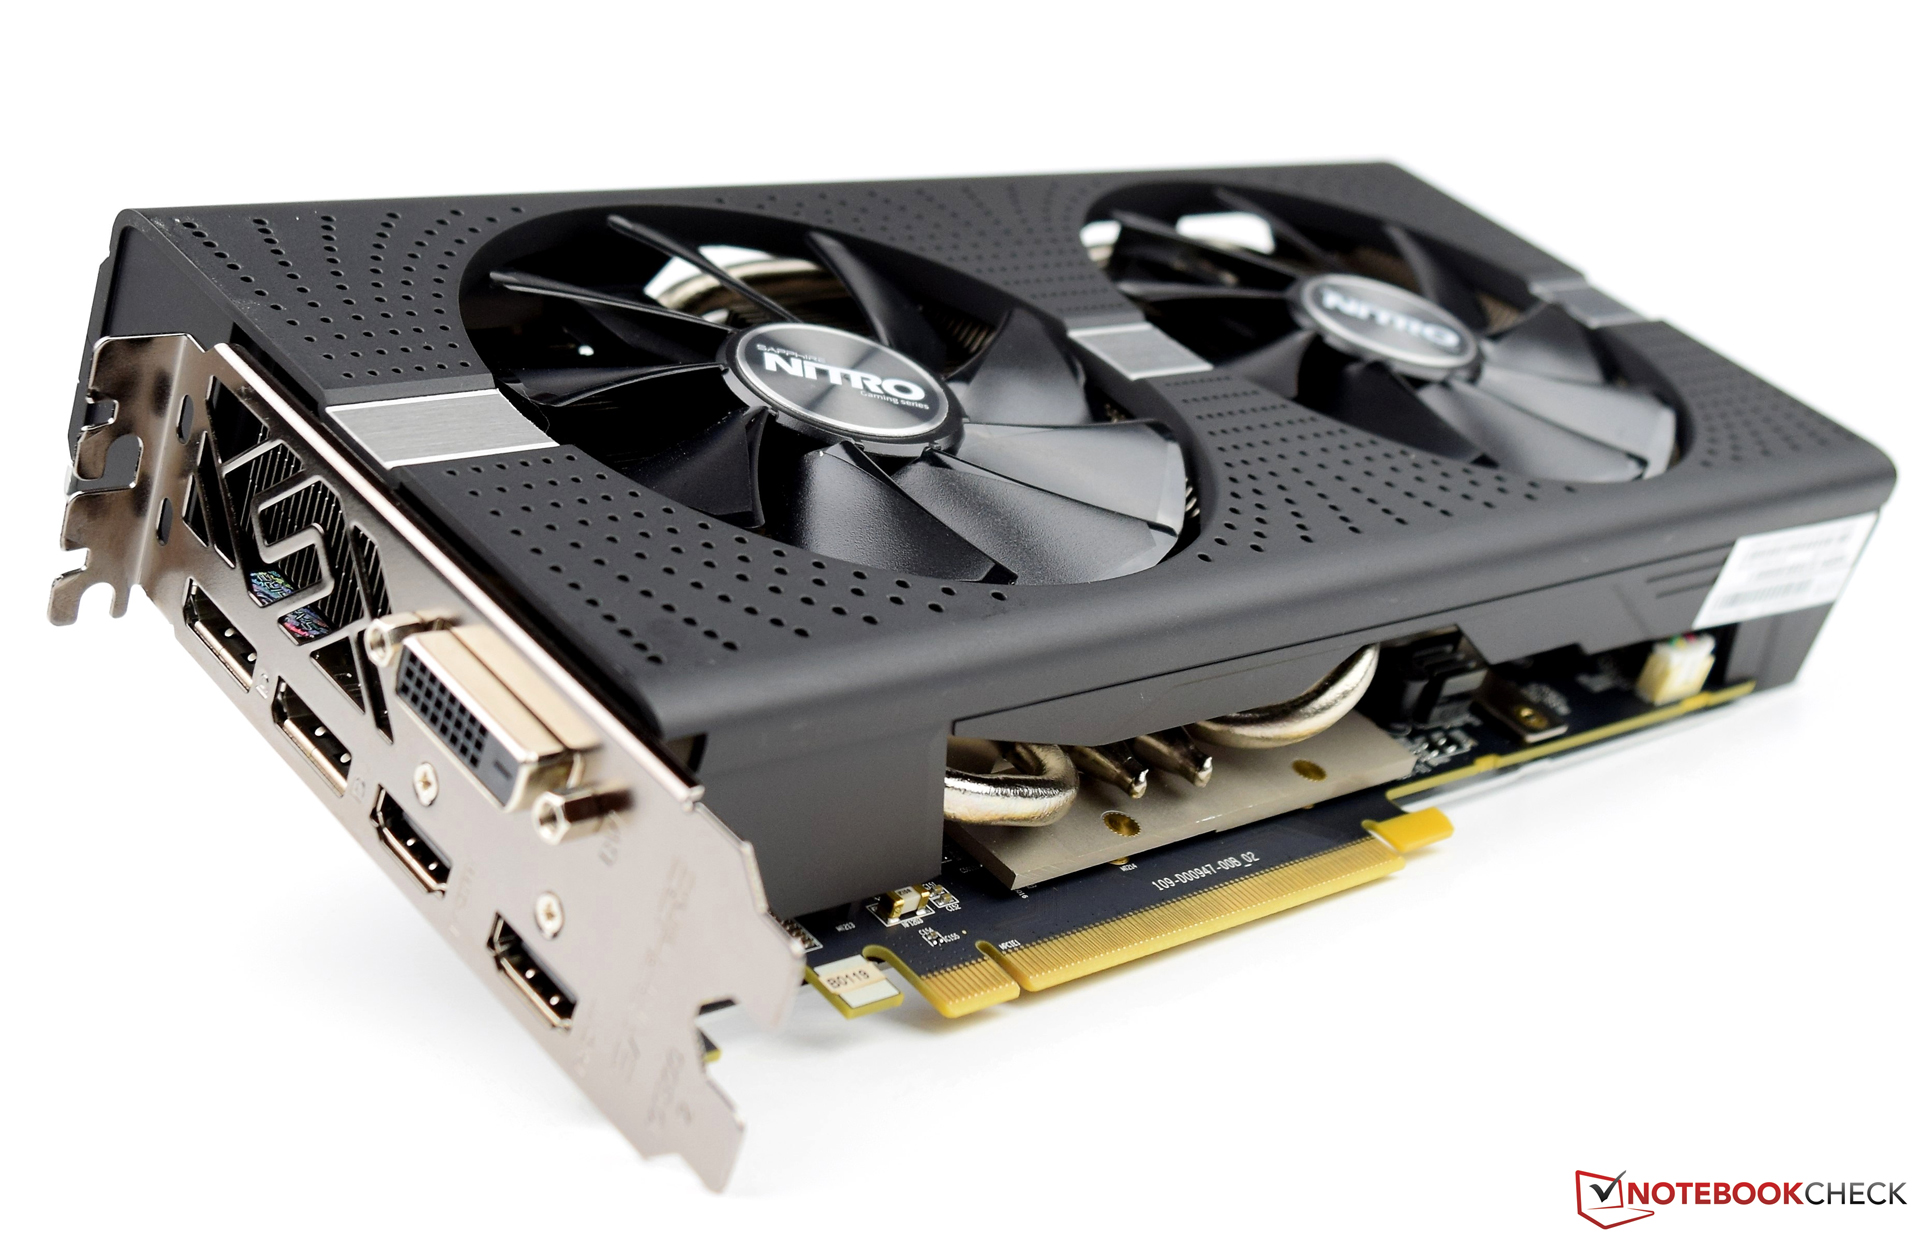
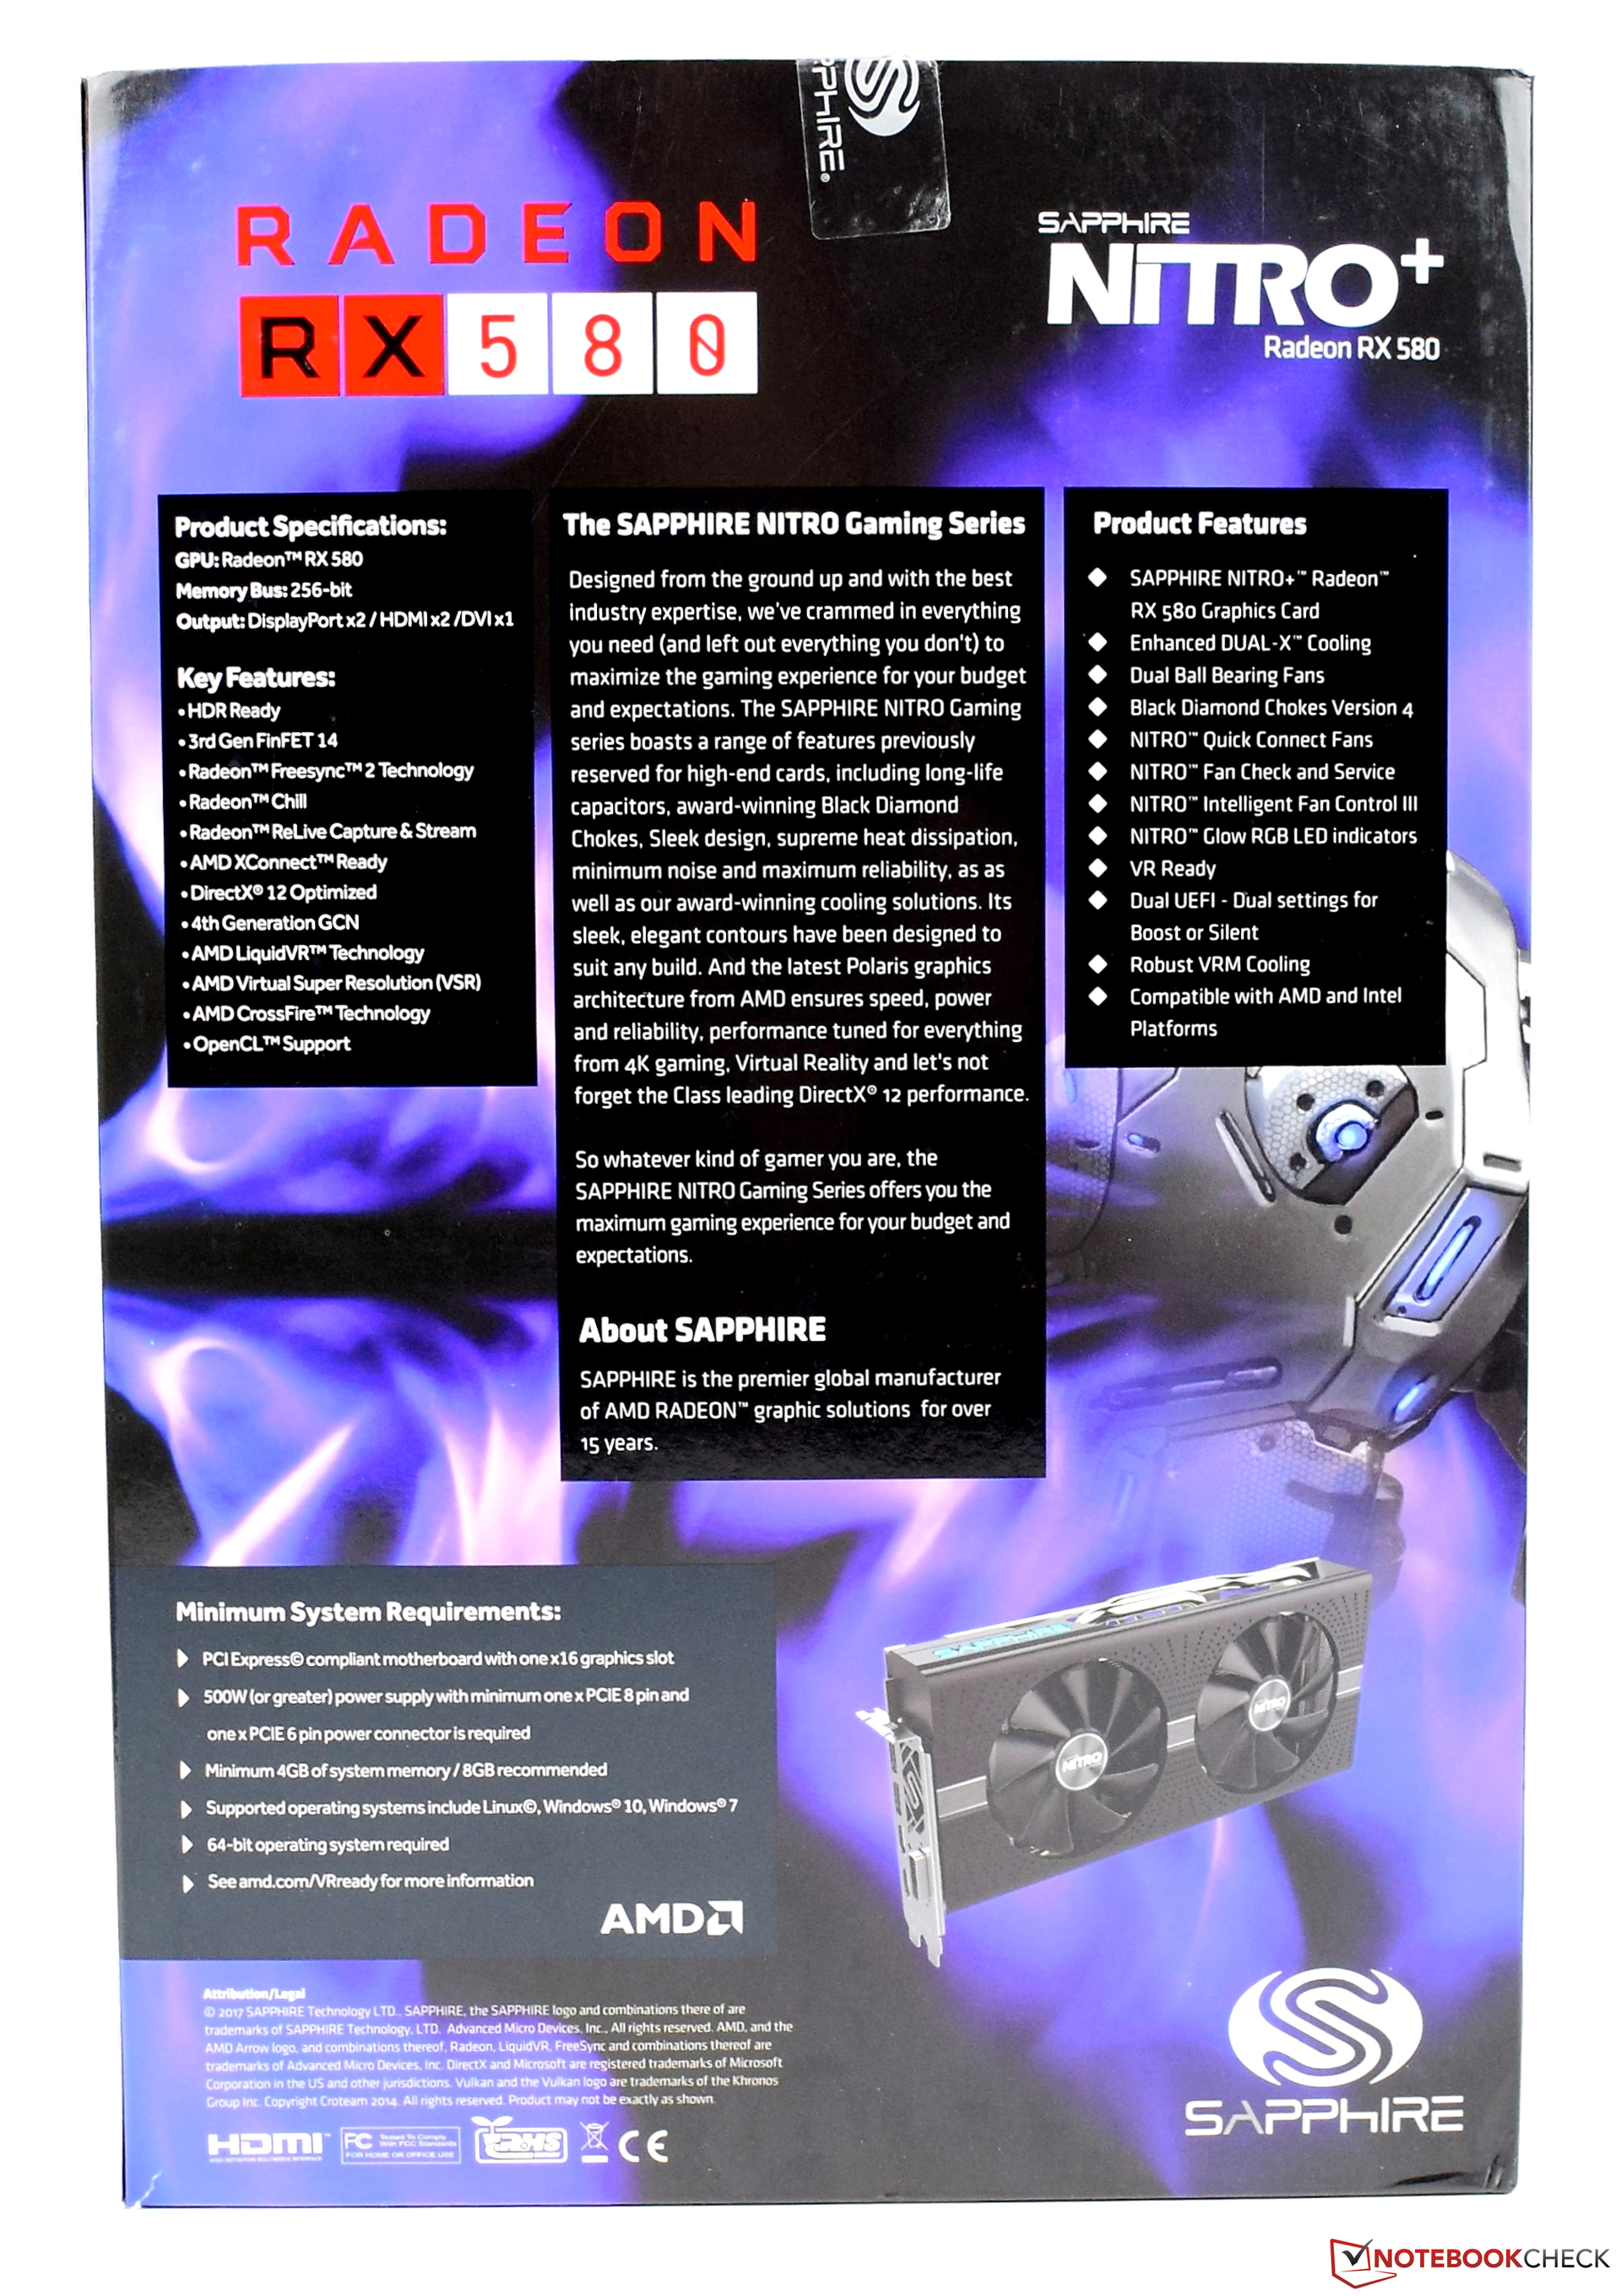
For external devices, the Sapphire Nitro+ Radeon RX 580 8GD5 offers one DL-DVI-D connection, two HDMI 2.0b connections, and two DisplayPort 1.4 connections. Internally, the graphics card requires two power adapters (1 x 6-pin + 1 x 8-pin).
| Specifications | Radeon RX 580 | Radeon RX 480 | Radeon RX 570 | Radeon RX 470 | GTX 1060 FE | GTX 1070 FE | GTX 1080 FE |
| Chip | Polaris P20 | Polaris P10 | Polaris P20 | Polaris P10 | GP106 | GP104 | GP104 |
| Manufactured | 14 nm | 14 nm | 14 nm | 14 nm | 16 nm | 16 nm | 16 nm |
| Shader | 2,304 | 2,304 | 2,048 | 2,048 | 1,280 | 1,920 | 2,560 |
| Texture Units | 144 | 144 | 128 | 128 | 80 | 120 | 160 |
| GPU Base Clock | 1,257 MHz | 1,120 MHz | 1,168 MHz | 926 MHz | 1,506 MHz | 1,518 MHz | 1,607 MHz |
| GPU Boost Clock | 1,340 MHz | 1,266 MHz | 1,244 MHz | 1,206 MHz | 1,709 MHz | 1,708 MHz | 1,733 MHz |
| Memory Bus | 256 Bit | 256 Bit | 256 Bit | 256 Bit | 256 Bit | 256 Bit | |
| Memory Bandwidth | 256 GB/s | 256 GB/s | 224 GB/s | 211.2 GB/s | 192 GB/s | 256 GB/s | 320 GB/s |
| Memory Size | 4 GB / 8 GB | 8 GB | 4 GB / 8 GB | 4 GB / 8 GB | 6 GB | 8 GB | 8 GB |
| Power (Watt) | 185 W | 150 W | 150 W | 120 W | 120 W | 150 W | 180 W |
Test System
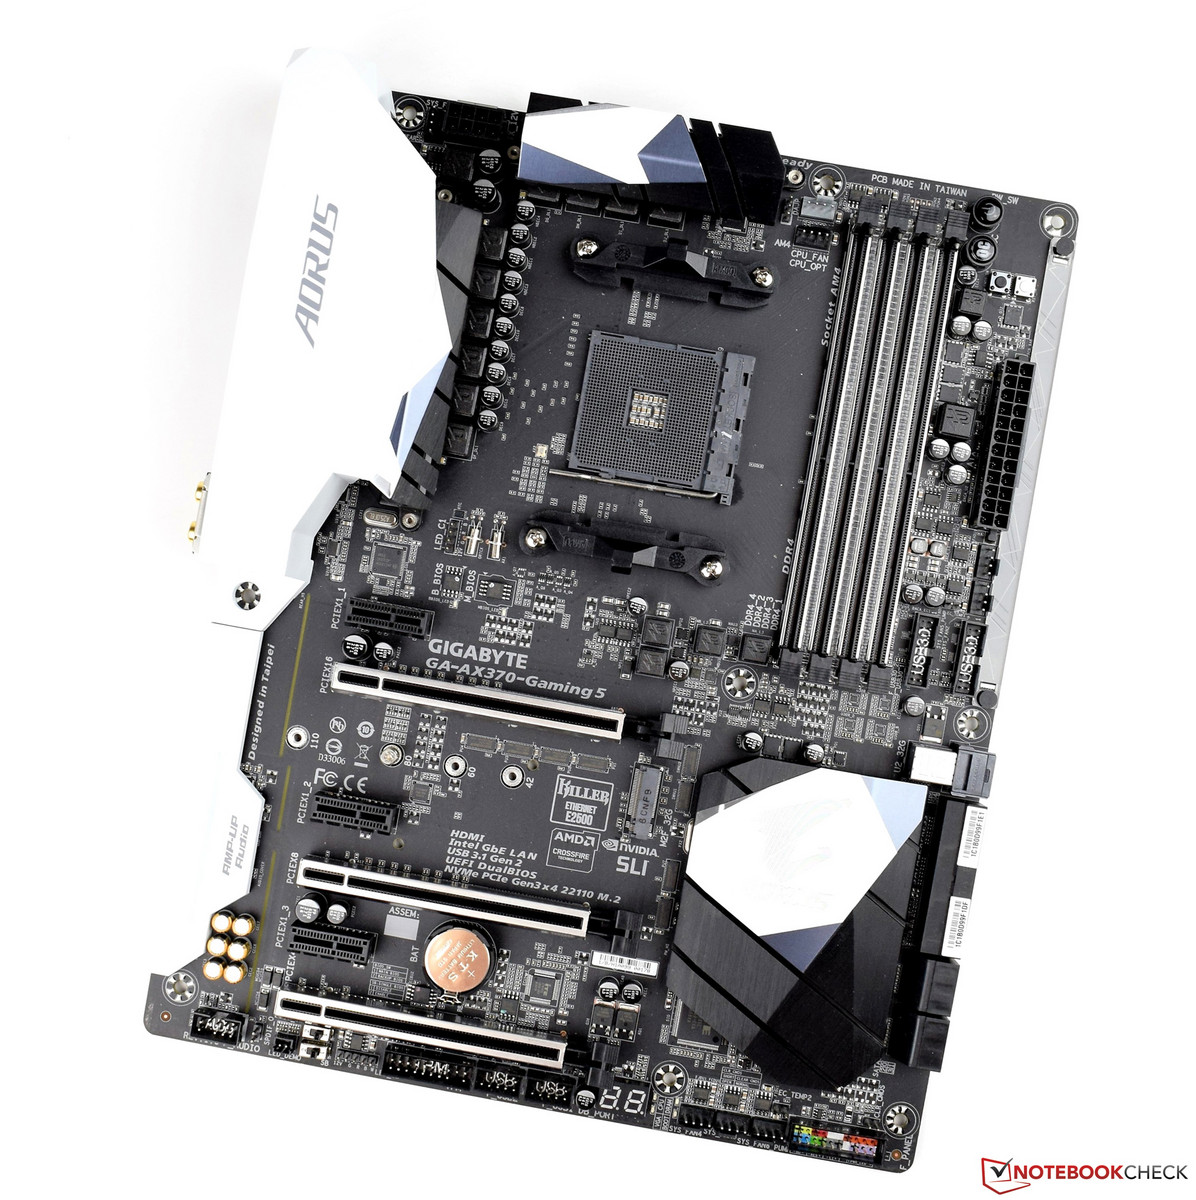
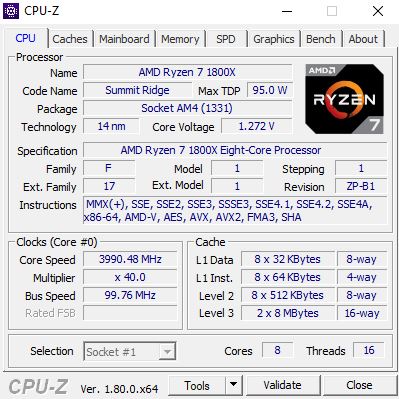
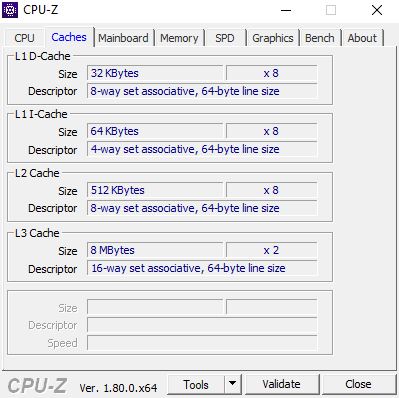
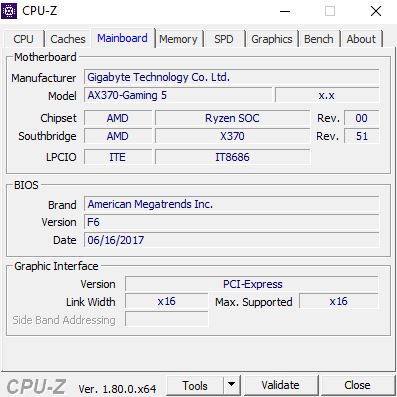
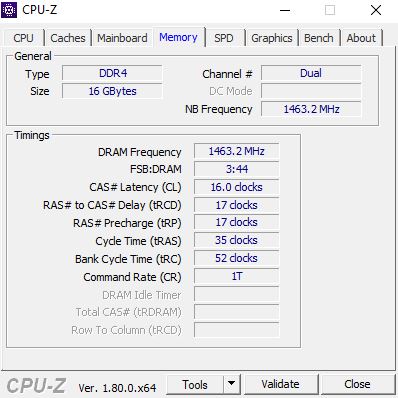
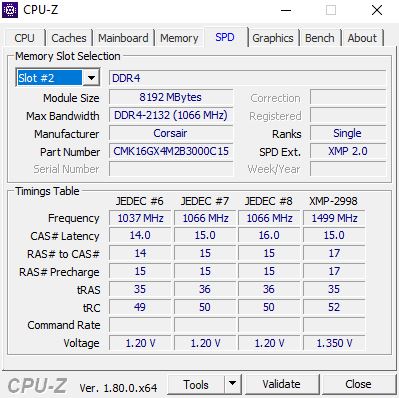
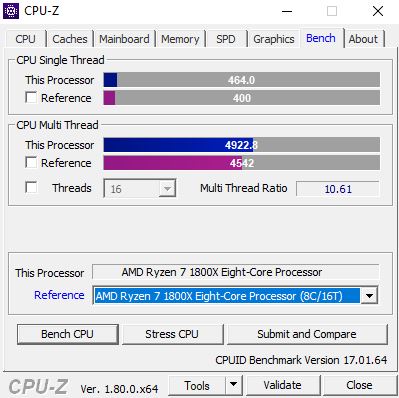
An AMD platform based on the Gigabyte Aorus GA-AX370 Gaming 5 serves as our test system. The CPU, an AMD RYZEN 7 1800X, provides sufficient CPU performance and is cooled by a Be Quiet Silent Loop (280 mm, ~11 in). However, this was manually overclocked to 4 GHz. The 16 GB of working memory comes from Corsair, and the Acer Predator XB321HK does not limit us even in high resolutions due to the UHD suitability. At this point, we would like to sincerely thank AMD who provided us with the test platform as well as the graphics card.
| Case | Corsair Carbide Air 540 ATX Cube |
| CPU | AMD RYZEN 7 1800X @ 4 GHz |
| CPU Cooling | Be Quiet Silent Loop 280 mm |
| RAM | Corsair Vengeance 16 GB DDR4 3.000 MHz |
| Mainboard | Gigabyte Aorus GA-AX370 Gaming 5 |
| Monitor | Acer Predator XB321HK 4K |
| SSD | ADATA SP900 M.2 SSD |
| HDD | 2 TB Western Digital |
| Operating System | Microsoft Windows 10 Professional 64-Bit |
| Driver | Crimson ReLive Edition 17.7.2 |
Clock Speeds
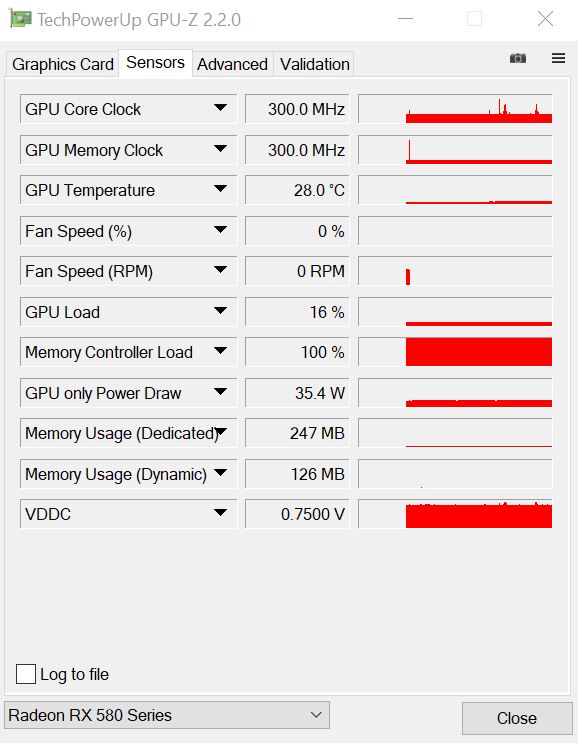
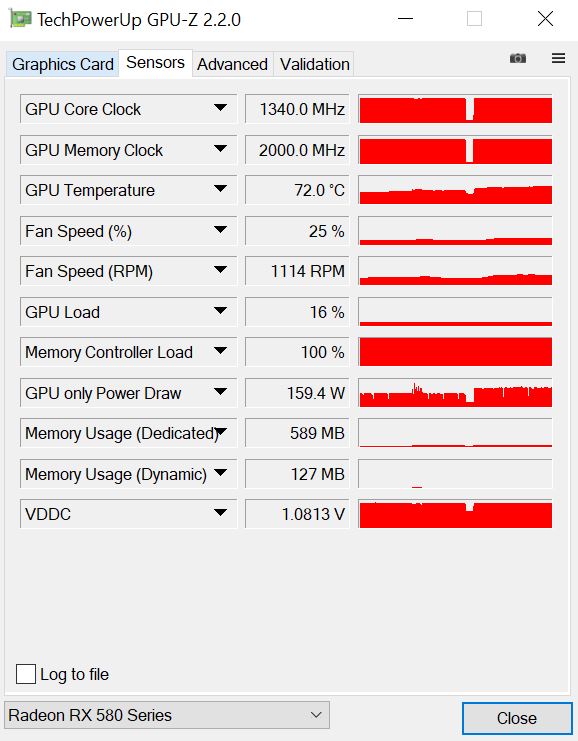
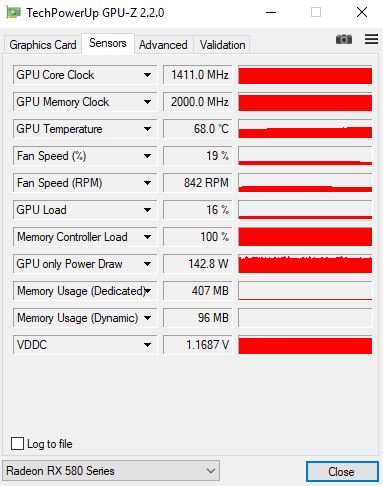
Under load, the Sapphire Nitro+ Radeon RX 580 reaches a stable clock speed of 1,340 MHz without any trouble, and the VRAM operates continuously at 8,000 MHz. In order to prevent the graphics card from reaching the temperature target (76 °C, 167 °F), good case ventilation should be obligatory despite the generous cooling. The Sapphire Nitro+ Radeon RX 580 offers one special feature. With a slider, you can select another BIOS that raises the chip's clock speed to 1,411 MHz. This can also be stably maintained.
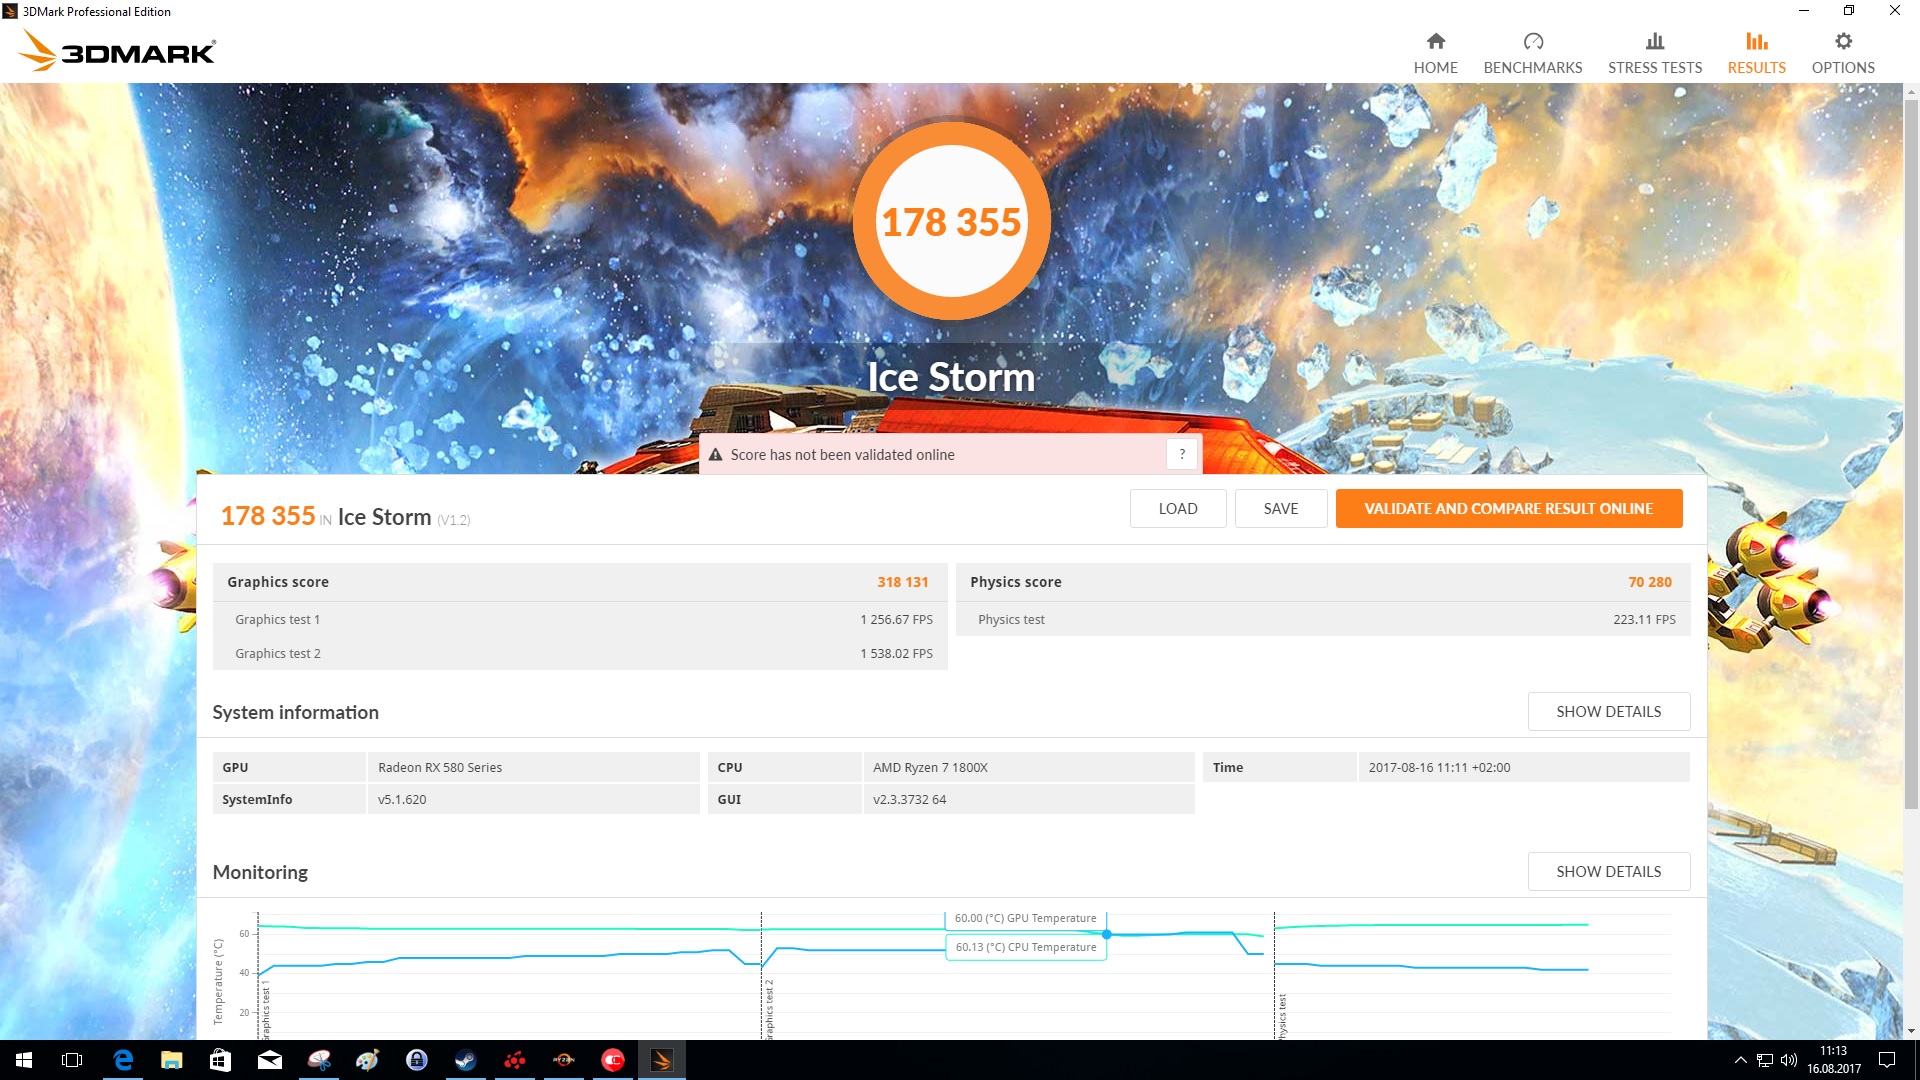
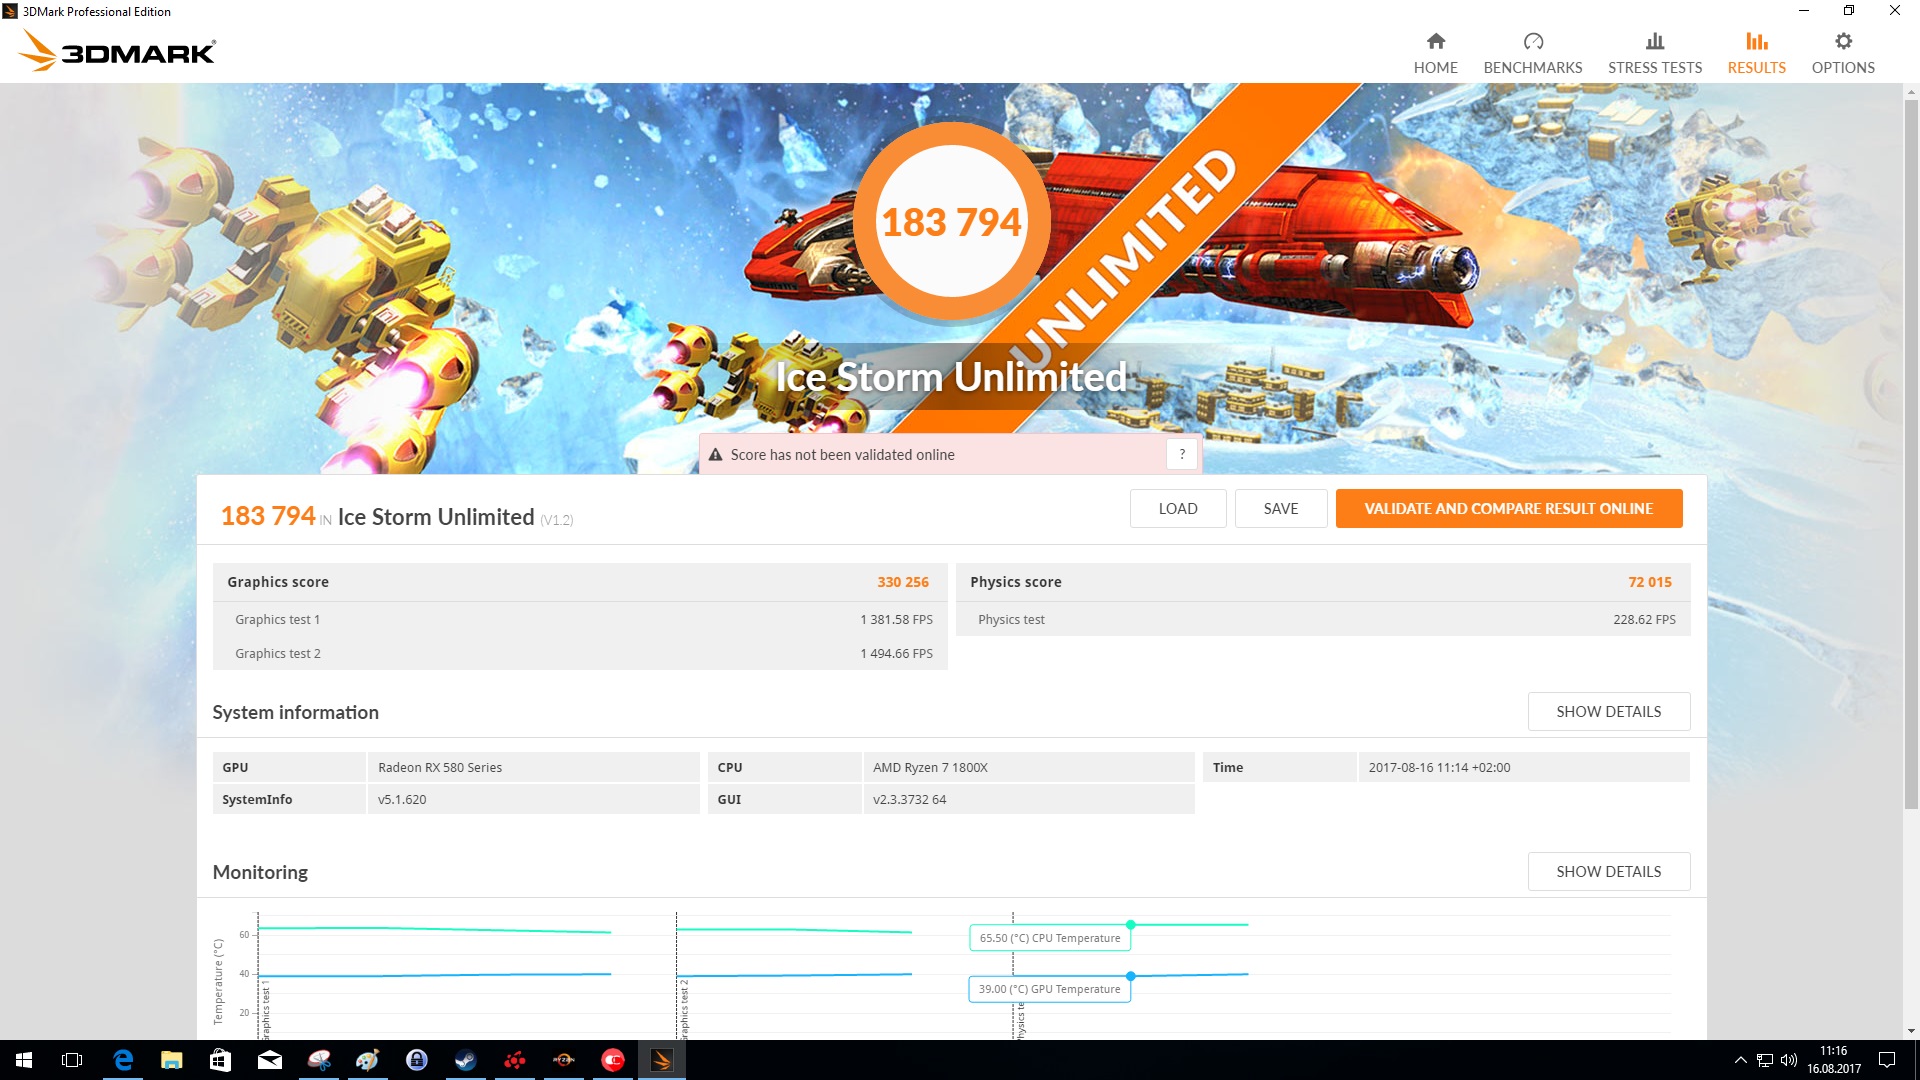
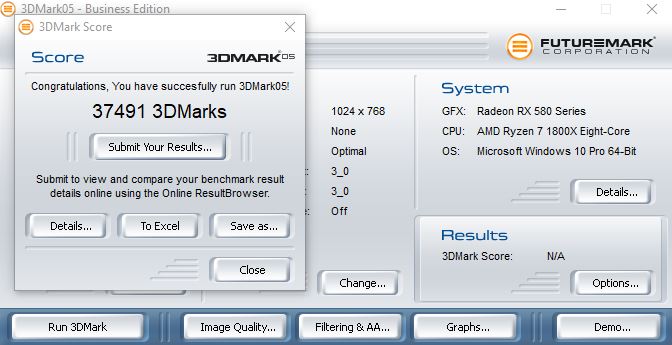
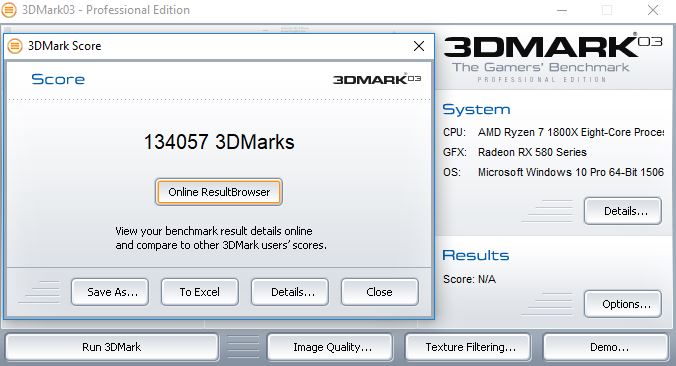
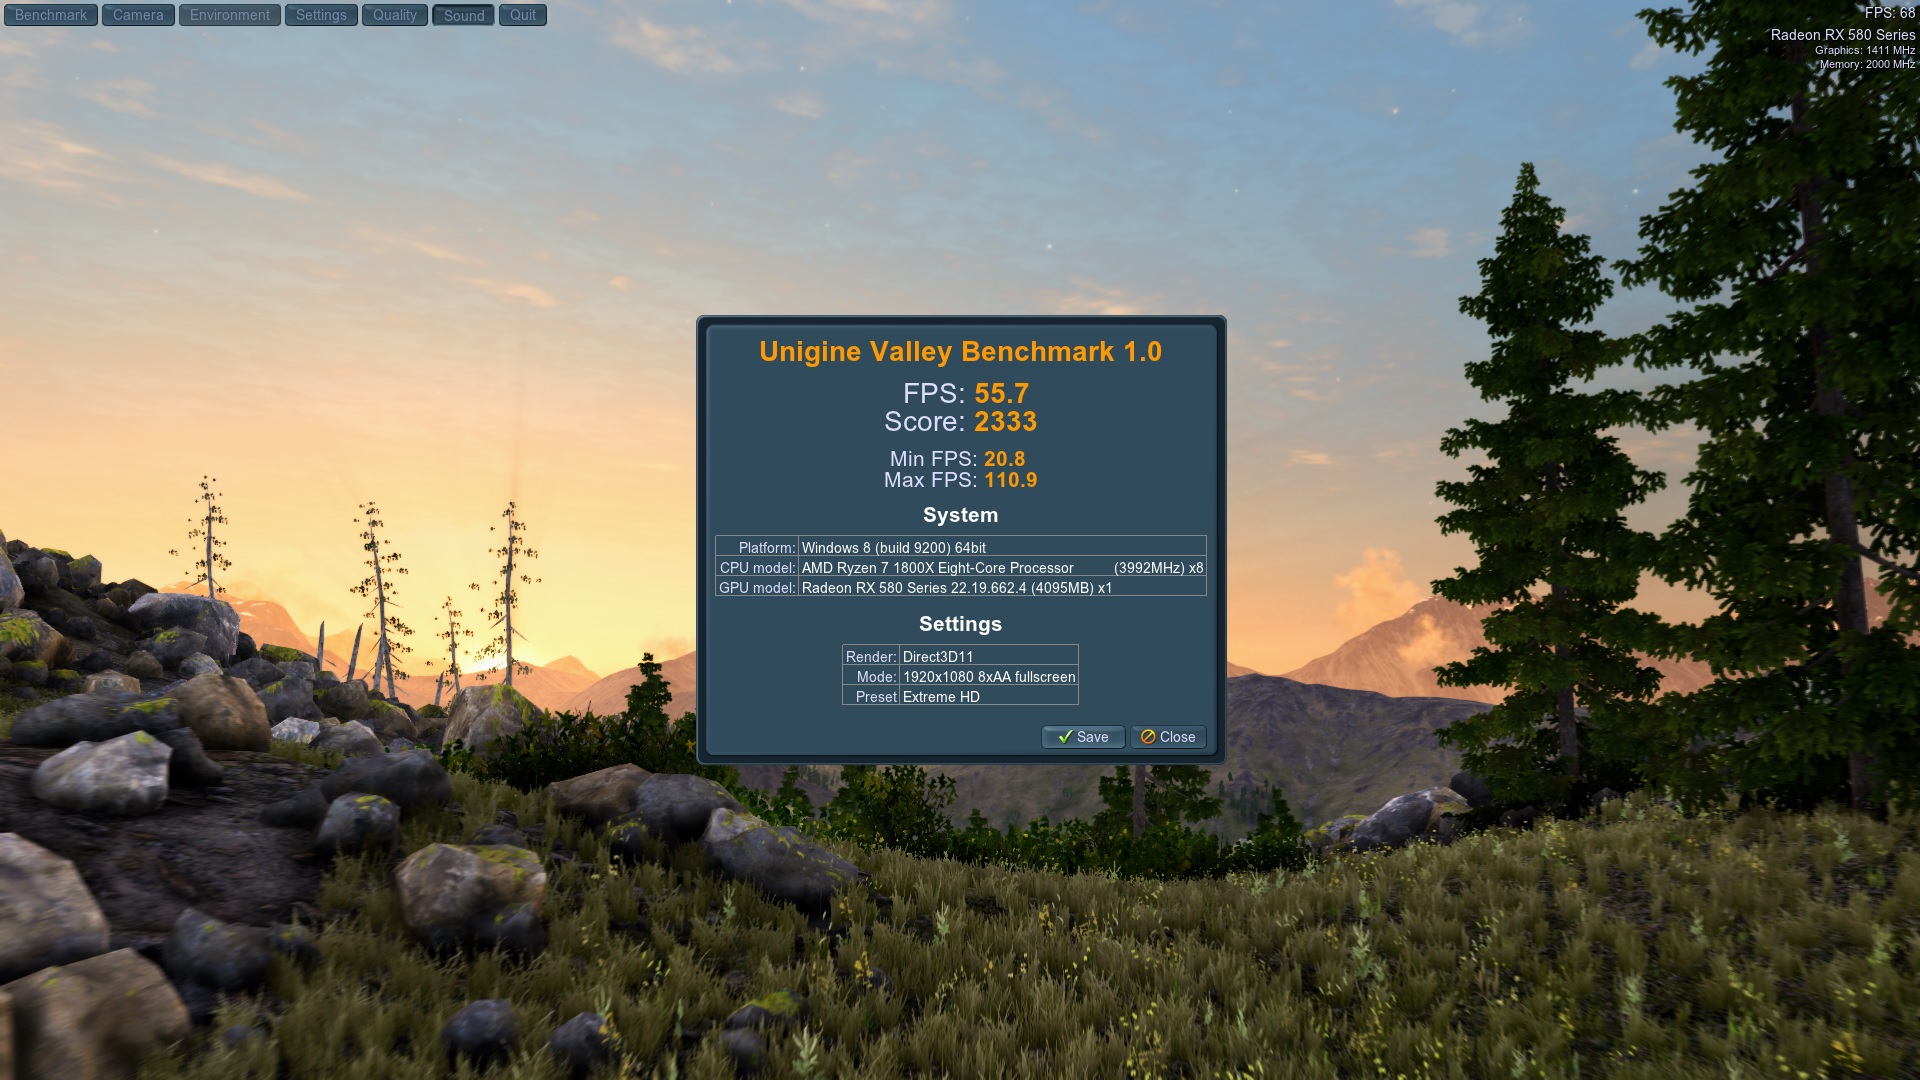
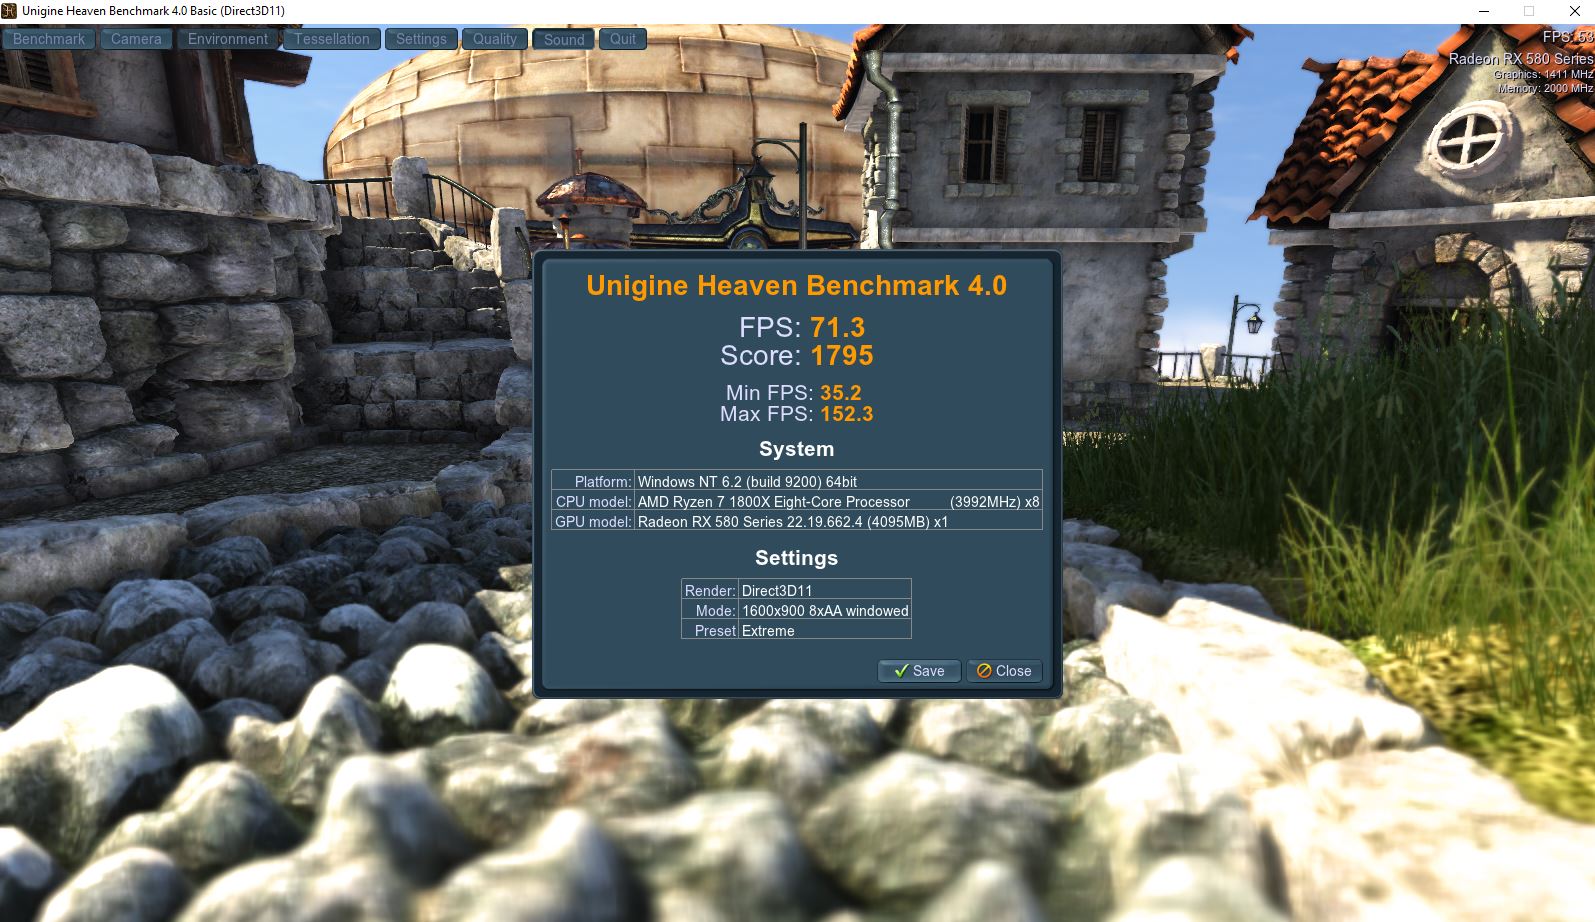
Synthetic Benchmarks
In the synthetic benchmarks, the Sapphire Nitro+ Radeon RX 580 is able to place ahead of the AMD Radeon RX 480, sometimes by up to 20%. However, compared to the Nvidia competitor, the Sapphire Nitro+ Radeon RX 580 remains clearly behind the Nvidia GeForce GTX 1070. Our test sample can only hold up against the slightly slower GeForce GTX 1060 here.
| 3DMark | |
| 1920x1080 Fire Strike Graphics | |
| Nvidia GeForce GTX 1080 Ti Founders Edition | |
| Nvidia GeForce GTX 1070 Founders Edition | |
| Sapphire Radeon RX 580 Nitro+ 8 GB | |
| Nvidia GeForce GTX 1060 Founders Edition 6 GB | |
| AMD Radeon RX 480 8 GB Reference | |
| MSI RX 470 Gaming X 4GB | |
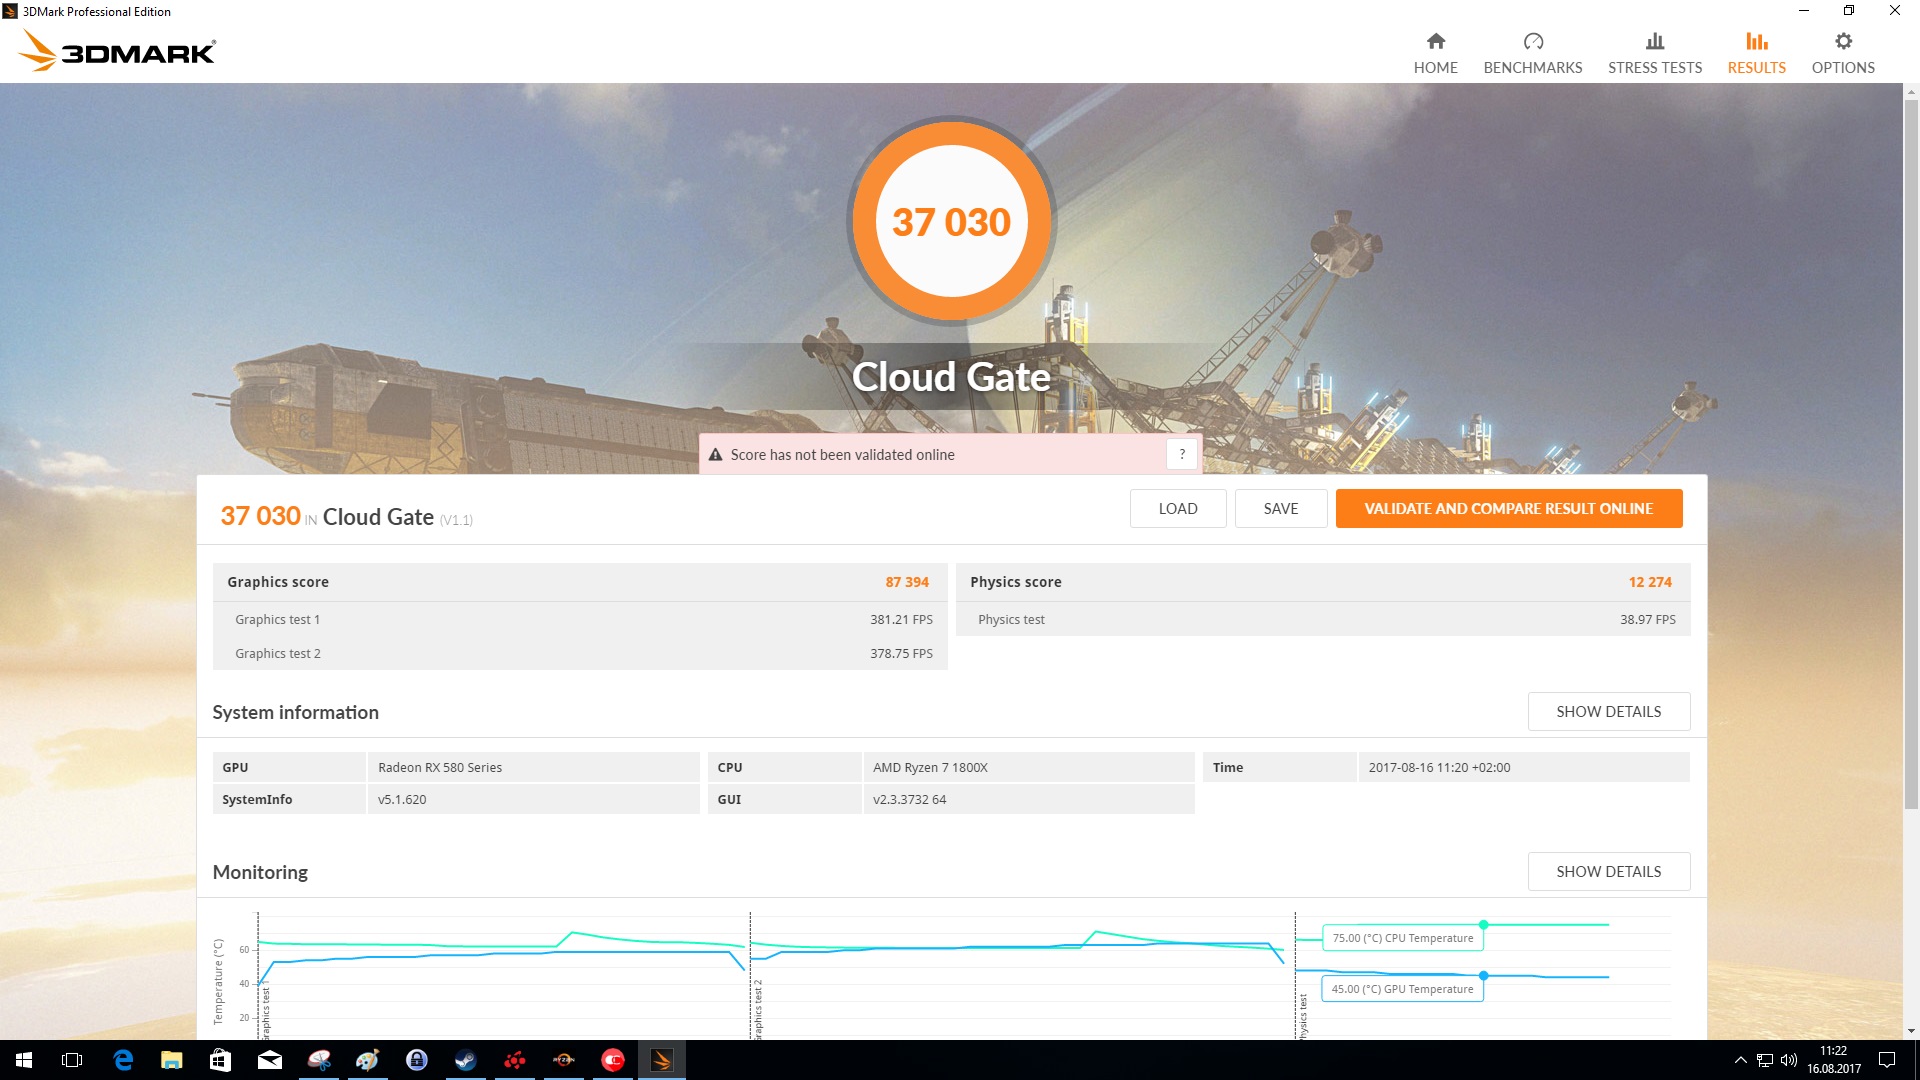
| 1280x720 Cloud Gate Standard Graphics | |
| Nvidia GeForce GTX 1070 Founders Edition | |
| Sapphire Radeon RX 580 Nitro+ 8 GB | |
| Nvidia GeForce GTX 1060 Founders Edition 6 GB | |
| AMD Radeon RX 480 8 GB Reference | |
| MSI RX 470 Gaming X 4GB | |
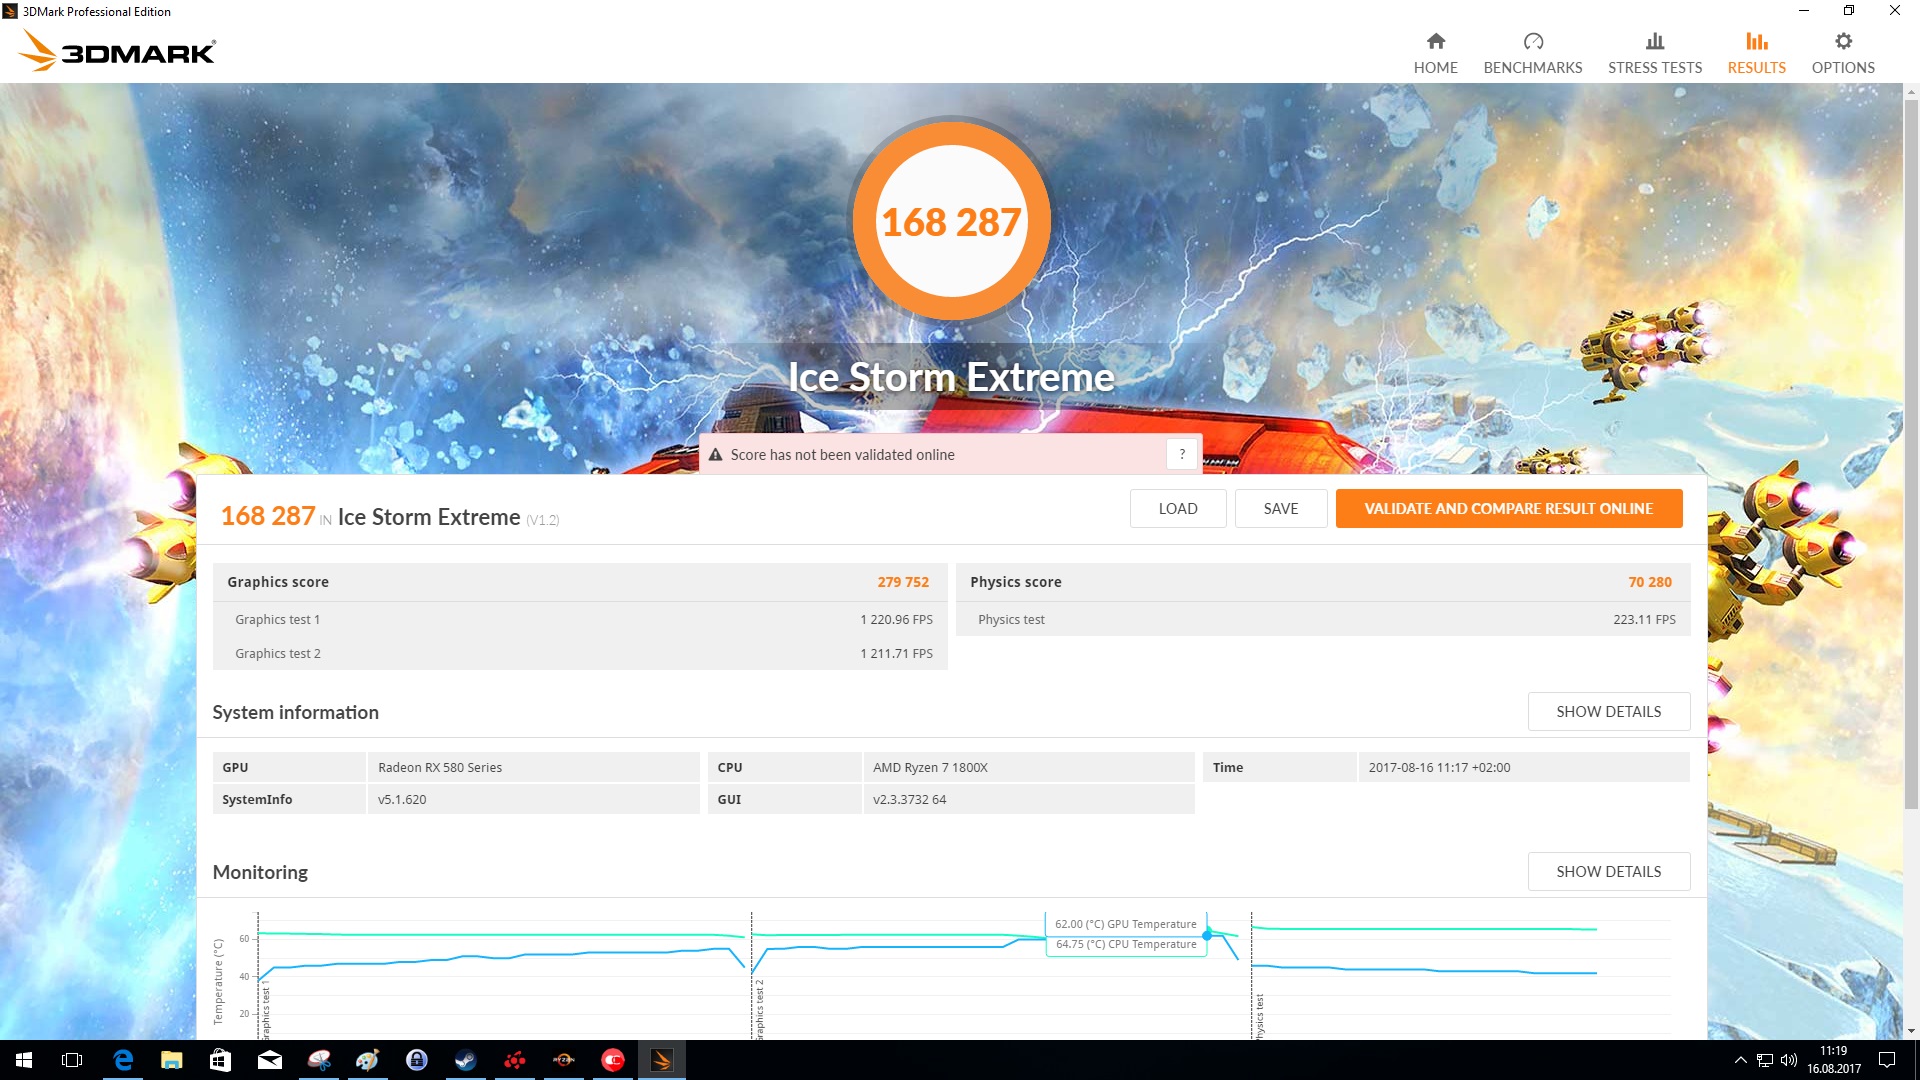
| Fire Strike Extreme Graphics | |
| Sapphire Radeon RX 580 Nitro+ 8 GB | |
| AMD Radeon RX 480 8 GB Reference | |
| 3DMark 11 - 1280x720 Performance GPU | |
| Nvidia GeForce GTX 1080 Ti Founders Edition | |
| Nvidia GeForce GTX 1070 Founders Edition | |
| Sapphire Radeon RX 580 Nitro+ 8 GB | |
| AMD Radeon RX 480 8 GB Reference | |
| MSI RX 470 Gaming X 4GB | |
| Nvidia GeForce GTX 1060 Founders Edition 6 GB | |
Games Benchmarks
Synthetic Benchmarks are one thing, but it is much more important how the gaming performance of the pixel accelerators is implemented. It shows here, that the Nvidia GeForce GTX 1060 often delivers more frames than our test card, even though it cannot place clearly ahead of it. The GeForce GTX 1070 remains unreachable (holding second place) and is only surpassed by the GeForce GTX 1080, which is again clearly faster.
However, the subjective gaming performance of the Sapphire Nitro+ Radeon RX 580 can be considered good throughout. The graphics card can display all the current games smoothly in maximum detail. Only in some particular games, such as "Deus Ex Mankind Divided" or "Ghost Recon Wildlands," we would recommend reducing the details to the "high" preset. If anyone wants to purchase this card to play beyond the 1080p resolution, we cannot recommend this purchase, though. We cannot assure a consistent 4K suitability since the performance of the Sapphire Nitro+ Radeon RX 580 is only sufficient to provide stutter-free gaming pleasure in a few games with such a high resolution.
If the current high-end graphics card of the Vega series is too expensive for you, with the AMD Radeon RX 580 you get a solid graphics card with which you can enjoy all the current games in Full HD without any problems.
| Far Cry Primal - 1920x1080 Ultra Preset AA:SM | |
| NVIDIA GeForce GTX 1080 Ti (Desktop) | |
| NVIDIA GeForce GTX 1070 (Desktop) | |
| NVIDIA GeForce GTX 1060 (Desktop) | |
| AMD Radeon RX 580 (Desktop) | |
| AMD Radeon RX 480 (Desktop) | |
| AMD Radeon RX 470 (Desktop) | |
| BioShock Infinite - 1920x1080 Ultra Preset, DX11 (DDOF) | |
| NVIDIA GeForce GTX 1080 Ti (Desktop) | |
| NVIDIA GeForce GTX 1070 (Desktop) | |
| AMD Radeon RX 580 (Desktop) | |
| AMD Radeon RX 480 (Desktop) | |
| Rise of the Tomb Raider - 1920x1080 Very High Preset AA:FX AF:16x | |
| NVIDIA GeForce GTX 1080 Ti (Desktop) | |
| NVIDIA GeForce GTX 1070 (Desktop) | |
| NVIDIA GeForce GTX 1060 (Desktop) | |
| NVIDIA GeForce GTX 1060 (Desktop) | |
| AMD Radeon RX 580 (Desktop) | |
| AMD Radeon RX 480 (Desktop) | |
| AMD Radeon RX 470 (Desktop) | |
| The Witcher 3 - 1920x1080 Ultra Graphics & Postprocessing (HBAO+) | |
| NVIDIA GeForce GTX 1080 Ti (Desktop) | |
| NVIDIA GeForce GTX 1070 (Desktop) | |
| AMD Radeon RX 580 (Desktop) | |
| NVIDIA GeForce GTX 1060 (Desktop) | |
| AMD Radeon RX 480 (Desktop) | |
| AMD Radeon RX 470 (Desktop) | |
| Deus Ex Mankind Divided - 1920x1080 Ultra Preset AA:2xMS AF:8x | |
| NVIDIA GeForce GTX 1080 Ti (Desktop) | |
| AMD Radeon RX 580 (Desktop) | |
| AMD Radeon RX 480 (Desktop) | |
| AMD Radeon RX 470 (Desktop) | |
| Watch Dogs 2 - 1920x1080 Ultra Preset | |
| NVIDIA GeForce GTX 1080 Ti (Desktop) | |
| AMD Radeon RX 580 (Desktop) | |
| AMD Radeon RX 480 (Desktop) | |
| AMD Radeon RX 470 (Desktop) | |
| Battlefield 1 - 1920x1080 Ultra Preset AA:T | |
| NVIDIA GeForce GTX 1080 Ti (Desktop) | |
| AMD Radeon RX 480 (Desktop) | |
| AMD Radeon RX 480 (Desktop) | |
| AMD Radeon RX 580 (Desktop) | |
| AMD Radeon RX 470 (Desktop) | |
| Resident Evil 7 - 1920x1080 Very High / On AA:FXAA+T | |
| NVIDIA GeForce GTX 1080 Ti (Desktop) | |
| AMD Radeon RX 580 (Desktop) | |
| AMD Radeon RX 480 (Desktop) | |
| AMD Radeon RX 470 (Desktop) | |
| GTA V - 1920x1080 Highest Settings possible AA:4xMSAA + FX AF:16x | |
| NVIDIA GeForce GTX 1080 Ti (Desktop) | |
| NVIDIA GeForce GTX 1070 (Desktop) | |
| AMD Radeon RX 580 (Desktop) | |
| AMD Radeon RX 480 (Desktop) | |
| Rainbow Six Siege - 1920x1080 Ultra Preset AA:T AF:16x | |
| NVIDIA GeForce GTX 1080 Ti (Desktop) | |
| NVIDIA GeForce GTX 1070 (Desktop) | |
| AMD Radeon RX 580 (Desktop) | |
| NVIDIA GeForce GTX 1060 (Desktop) | |
| AMD Radeon RX 480 (Desktop) | |
| AMD Radeon RX 470 (Desktop) | |
| The Division - 1920x1080 Ultra Preset AF:16x | |
| NVIDIA GeForce GTX 1080 Ti (Desktop) | |
| NVIDIA GeForce GTX 1070 (Desktop) | |
| AMD Radeon RX 580 (Desktop) | |
| NVIDIA GeForce GTX 1060 (Desktop) | |
| AMD Radeon RX 480 (Desktop) | |
| AMD Radeon RX 470 (Desktop) | |
| Dishonored 2 - 1920x1080 Ultra Preset AA:TX | |
| NVIDIA GeForce GTX 1080 Ti (Desktop) | |
| AMD Radeon RX 580 (Desktop) | |
| AMD Radeon RX 480 (Desktop) | |
| AMD Radeon RX 470 (Desktop) | |
| For Honor - 1920x1080 Extreme Preset AA:T AF:16x | |
| NVIDIA GeForce GTX 1080 Ti (Desktop) | |
| NVIDIA GeForce GTX 1070 (Desktop) | |
| AMD Radeon RX 580 (Desktop) | |
| AMD Radeon RX 480 (Desktop) | |
| AMD Radeon RX 470 (Desktop) | |
| Battlefield 4 - 1920x1080 Ultra Preset AA:4x MS | |
| NVIDIA GeForce GTX 1080 Ti (Desktop) | |
| NVIDIA GeForce GTX 1070 (Desktop) | |
| AMD Radeon RX 580 (Desktop) | |
| AMD Radeon RX 480 (Desktop) | |
| AMD Radeon RX 470 (Desktop) | |
| Sims 4 - 1920x1080 Ultra Preset | |
| AMD Radeon RX 580 (Desktop) | |
| NVIDIA GeForce GTX 1060 (Desktop) | |
| Doom - 1920x1080 Ultra Preset AA:SM | |
| NVIDIA GeForce GTX 1080 Ti (Desktop) | |
| NVIDIA GeForce GTX 1080 Ti (Desktop) | |
| NVIDIA GeForce GTX 1070 (Desktop) | |
| NVIDIA GeForce GTX 1060 (Desktop) | |
| AMD Radeon RX 480 (Desktop) | |
| AMD Radeon RX 470 (Desktop) | |
| AMD Radeon RX 580 (Desktop) | |
| Overwatch - 1920x1080 Epic (Render Scale 100 %) AA:SM AF:16x | |
| NVIDIA GeForce GTX 1080 Ti (Desktop) | |
| NVIDIA GeForce GTX 1070 (Desktop) | |
| AMD Radeon RX 580 (Desktop) | |
| AMD Radeon RX 480 (Desktop) | |
| NVIDIA GeForce GTX 1060 (Desktop) | |
| AMD Radeon RX 470 (Desktop) | |
| FIFA 17 - 1920x1080 Ultra Preset AA:4xMS | |
| AMD Radeon RX 480 (Desktop) | |
| AMD Radeon RX 580 (Desktop) | |
| AMD Radeon RX 470 (Desktop) | |
| Farming Simulator 17 - 1920x1080 Very High Preset AA:4xMS AF:4x | |
| NVIDIA GeForce GTX 1080 Ti (Desktop) | |
| NVIDIA GeForce GTX 1070 (Desktop) | |
| AMD Radeon RX 580 (Desktop) | |
| AMD Radeon RX 480 (Desktop) | |
| AMD Radeon RX 470 (Desktop) | |
| Call of Duty Infinite Warfare - 1920x1080 Ultra / On AA:T2X SM | |
| AMD Radeon RX 580 (Desktop) | |
| AMD Radeon RX 470 (Desktop) | |
| Ghost Recon Wildlands - 1920x1080 Ultra Preset AA:T AF:16x | |
| NVIDIA GeForce GTX 1080 Ti (Desktop) | |
| NVIDIA GeForce GTX 1070 (Desktop) | |
| AMD Radeon RX 580 (Desktop) | |
| AMD Radeon RX 480 (Desktop) | |
| AMD Radeon RX 470 (Desktop) | |
| Mass Effect Andromeda - 1920x1080 Ultra Preset (Resolution Scale Mode off) AA:T | |
| NVIDIA GeForce GTX 1080 Ti (Desktop) | |
| AMD Radeon RX 580 (Desktop) | |
| AMD Radeon RX 480 (Desktop) | |
| AMD Radeon RX 470 (Desktop) | |
| Prey - 1920x1080 Very High Preset AA:2TX SM AF:16x | |
| NVIDIA GeForce GTX 1080 Ti (Desktop) | |
| AMD Radeon RX 580 (Desktop) | |
| AMD Radeon RX 480 (Desktop) | |
| AMD Radeon RX 470 (Desktop) | |
| Rocket League - 1920x1080 High Quality AA:High FX | |
| NVIDIA GeForce GTX 1080 Ti (Desktop) | |
| AMD Radeon RX 580 (Desktop) | |
| AMD Radeon RX 480 (Desktop) | |
| AMD Radeon RX 470 (Desktop) | |
| Dirt 4 - 1920x1080 Ultra Preset AA:4xMS AF:16x | |
| NVIDIA GeForce GTX 1080 Ti (Desktop) | |
| AMD Radeon RX 580 (Desktop) | |
| AMD Radeon RX 480 (Desktop) | |
| AMD Radeon RX 470 (Desktop) | |
| Team Fortress 2 - 1920x1080 maximum AA:8x MS AF:16x | |
| NVIDIA GeForce GTX 1080 Ti (Desktop) | |
| AMD Radeon RX 580 (Desktop) | |
| low | med. | high | ultra | 4K | |
| BioShock Infinite (2013) | 265.1 | 212.9 | 202.5 | 116.1 | |
| Battlefield 4 (2013) | 197 | 187.7 | 183 | 87.6 | 47 |
| Sims 4 (2014) | 183.3 | 168.7 | 161.2 | 150.3 | |
| GTA V (2015) | 148.2 | 143.5 | 98.9 | 54.9 | 56.8 |
| The Witcher 3 (2015) | 215 | 142.8 | 79.3 | 45.6 | 28.1 |
| Rainbow Six Siege (2015) | 290.6 | 246.7 | 166 | 134.6 | 55.4 |
| Rise of the Tomb Raider (2016) | 247 | 158.9 | 83.9 | 65.4 | 27.8 |
| Far Cry Primal (2016) | 97 | 86 | 78 | 62 | 31 |
| The Division (2016) | 188.3 | 143.8 | 83.3 | 63.3 | 33.1 |
| Doom (2016) | 81.6 | 80.4 | 75 | 73.6 | 31.9 |
| Overwatch (2016) | 300 | 299.9 | 213.4 | 145.7 | 68.6 |
| Deus Ex Mankind Divided (2016) | 105.7 | 101.2 | 72 | 37.3 | 23 |
| FIFA 17 (2016) | 332.3 | 327.6 | 306.8 | 305.4 | 154.4 |
| Battlefield 1 (2016) | 173.6 | 155 | 101.8 | 88.5 | 40.2 |
| Farming Simulator 17 (2016) | 184.1 | 152.1 | 141.3 | 90.2 | 89.6 |
| Call of Duty Infinite Warfare (2016) | 118.6 | 105.9 | 103.4 | 97.6 | 51.5 |
| Dishonored 2 (2016) | 94.8 | 89.6 | 66 | 62.8 | 26.6 |
| Watch Dogs 2 (2016) | 88.4 | 79 | 66.1 | 44.2 | 23.8 |
| Resident Evil 7 (2017) | 357 | 220.5 | 139 | 132.4 | 38.8 |
| For Honor (2017) | 196.2 | 115.8 | 110.5 | 79.8 | 33.5 |
| Ghost Recon Wildlands (2017) | 107.1 | 73.2 | 68 | 37.6 | 27.5 |
| Mass Effect Andromeda (2017) | 127.3 | 97.9 | 66.5 | 56.4 | 25 |
| Prey (2017) | 142.2 | 141.1 | 133.4 | 116.1 | 38.8 |
| Rocket League (2017) | 249.9 | 232.2 | 172.6 | 72.6 | |
| Dirt 4 (2017) | 250 | 185.6 | 120.1 | 70.2 | 39.8 |
| Team Fortress 2 (2017) | 129 | 125.5 | 123.1 | 123.1 | 107.9 |
| Playerunknown's Battlegrounds (PUBG) (2017) | 124.8 | 84.8 | 70.4 | 48.6 | 18 |
| F1 2017 (2017) | 204 | 184 | 160 | 77 | 46 |
| Ark Survival Evolved (2017) | 116 | 56 | 37.5 | 26.1 | 9 |
| FIFA 18 (2017) | 347.8 | 344 | 318.7 | 313.1 | 158.2 |
| Middle-earth: Shadow of War (2017) | 143 | 105 | 80 | 60 | 23 |
| The Evil Within 2 (2017) | 81.1 | 63 | 58.5 | 56 | 21.2 |
| ELEX (2017) | 118.6 | 96.7 | 75.6 | 58.3 | 20.5 |
| Destiny 2 (2017) | 139.5 | 109.6 | 99.9 | 83.8 | 27.9 |
| Wolfenstein II: The New Colossus (2017) | 229.1 | 140.2 | 116.3 | 106.9 | 36.4 |
| Assassin´s Creed Origins (2017) | 64 | 59 | 56 | 47 | 23 |
| Need for Speed Payback (2017) | 131.4 | 74 | 95.9 | 91.5 | 30.7 |
| Star Wars Battlefront 2 (2017) | 204.9 | 108.1 | 93.6 | 78.9 | 26.3 |
| Fortnite (2018) | 348.3 | 130.2 | 105.4 | 80.2 | 23.2 |
| Final Fantasy XV Benchmark (2018) | 106.5 | 60.1 | 31.9 | 15 | |
| Kingdom Come: Deliverance (2018) | 118.8 | 86.7 | 72.2 | 49.3 | 15.8 |
Computing Performance
Overall, the 2,304 Shader units provide for a good computing performance. The processing power of the Sapphire Nitro+ Radeon RX 580 lies at a good 6 TFlops and was again slightly increased compared to the Radeon RX 480. Compared to the GeForce GTX 1060, the Radeon RX 580 can stand up well and achieves third place behind the two faster GeForce graphics cards (GTX 1070 / GTX 1080).
| AMD Radeon RX 580 (Desktop) Sapphire Radeon RX 580 Nitro+ 8 GB, R7 1800X | AMD Radeon RX 470 (Desktop) MSI RX 470 Gaming X 4GB, 4790K | AMD Radeon RX 480 (Desktop) AMD Radeon RX 480 8 GB Reference, 4790K | NVIDIA GeForce GTX 1060 (Desktop) Nvidia GeForce GTX 1060 Founders Edition 6 GB, 6700K | NVIDIA GeForce GTX 1070 (Desktop) Nvidia GeForce GTX 1070 Founders Edition, 4790K | NVIDIA GeForce GTX 1080 Ti (Desktop) Nvidia GeForce GTX 1080 Ti Founders Edition, 4790K | |
|---|---|---|---|---|---|---|
| LuxMark v2.0 64Bit | -17% | -5% | -14% | 40% | 79% | |
| Room GPUs-only | 1757 | 1440 -18% | 1661 -5% | 1773 1% | 2474 41% | 3050 74% |
| Sala GPUs-only | 3612 | 3020 -16% | 3468 -4% | 2584 -28% | 5012 39% | 6600 83% |
| ComputeMark v2.1 | -12% | -5% | -10% | 28% | 108% | |
| 1024x600 Normal, QJuliaRayTrace | 2777 | 2475 -11% | 2746 -1% | 3322 20% | 4761 71% | 7938 186% |
| 1024x600 Normal, Mandel Scalar | 2806 | 2447 -13% | 2539 -10% | 2002 -29% | 2861 2% | 4949 76% |
| 1024x600 Normal, Mandel Vector | 2407 | 2172 -10% | 2162 -10% | 1994 -17% | 2706 12% | 4391 82% |
| 1024x600 Normal, Fluid 2DTexArr | 1031 | 911 -12% | 991 -4% | 963 -7% | 1390 35% | 2092 103% |
| 1024x600 Normal, Fluid 3DTex | 1189 | 1039 -13% | 1220 3% | 985 -17% | 1402 18% | 2275 91% |
| 1024x600 Normal, Score | 10210 | 9044 -11% | 9659 -5% | 9266 -9% | 13121 29% | 21646 112% |
| Total Average (Program / Settings) | -15% /
-13% | -5% /
-5% | -12% /
-11% | 34% /
31% | 94% /
101% |
Professional Uses
The AMD Radeon RX 580 comes out on top against the GeForce GTX 1060 in the professional applications as well, while the GeForce GTX 1080 is clearly ahead by more than 81%. The Radeon RX 580 is only partly suitable for these professional applications since the driver optimizations are not optimal for these computations. The graphics cards of the Fire-Pro series by AMD, or the Quadro series by Nvidia achieve considerably better performance. These graphics cards were specially designed for this use, which is why the drivers were also particularly adjusted for this.
| AMD Radeon RX 580 (Desktop) Sapphire Radeon RX 580 Nitro+ 8 GB, AMD Ryzen 7 1800X | NVIDIA GeForce GTX 1060 (Desktop) Nvidia GeForce GTX 1060 Founders Edition 6 GB, Intel Core i7-6700K | NVIDIA GeForce GTX 1080 Ti (Desktop) Nvidia GeForce GTX 1080 Ti Founders Edition, Intel Core i7-4790K | NVIDIA Quadro M5000M MSI WT72-6QM, Intel Xeon E3-1505M v5 | NVIDIA Quadro M3000M SCHENKER W706, Intel Core i7-6700 | |
|---|---|---|---|---|---|
| SPECviewperf 12 | -2% | 81% | 60% | 19% | |
| 1900x1060 Solidworks (sw-03) | 66.3 | 52.3 -21% | 75.4 14% | 101 52% | 92 39% |
| 1900x1060 Siemens NX (snx-02) | 20.91 | 6.11 -71% | 10.2 -51% | 86.9 316% | 52 149% |
| 1900x1060 Showcase (showcase-01) | 64.7 | 67.2 4% | 155.2 140% | 44.14 -32% | 37 -43% |
| 1900x1060 Medical (medical-01) | 31.2 | 31.53 1% | 59.8 92% | 31.35 0% | 22 -29% |
| 1900x1060 Maya (maya-04) | 51.7 | 111.9 116% | 194.5 276% | 69.6 35% | 61 18% |
| 1900x1060 Energy (energy-01) | 5.74 | 6.1 6% | 14.8 158% | 6.86 20% | 4.8 -16% |
| 1900x1060 Creo (creo-01) | 43.94 | 40.07 -9% | 67.7 54% | 81.3 85% | 66 50% |
| 1900x1060 Catia (catia-04) | 92.9 | 51.3 -45% | 109.1 17% | 94.4 2% | 77 -17% |
| 1900x1060 3ds Max (3dsmax-05) | 102.3 | 128.2 25% |
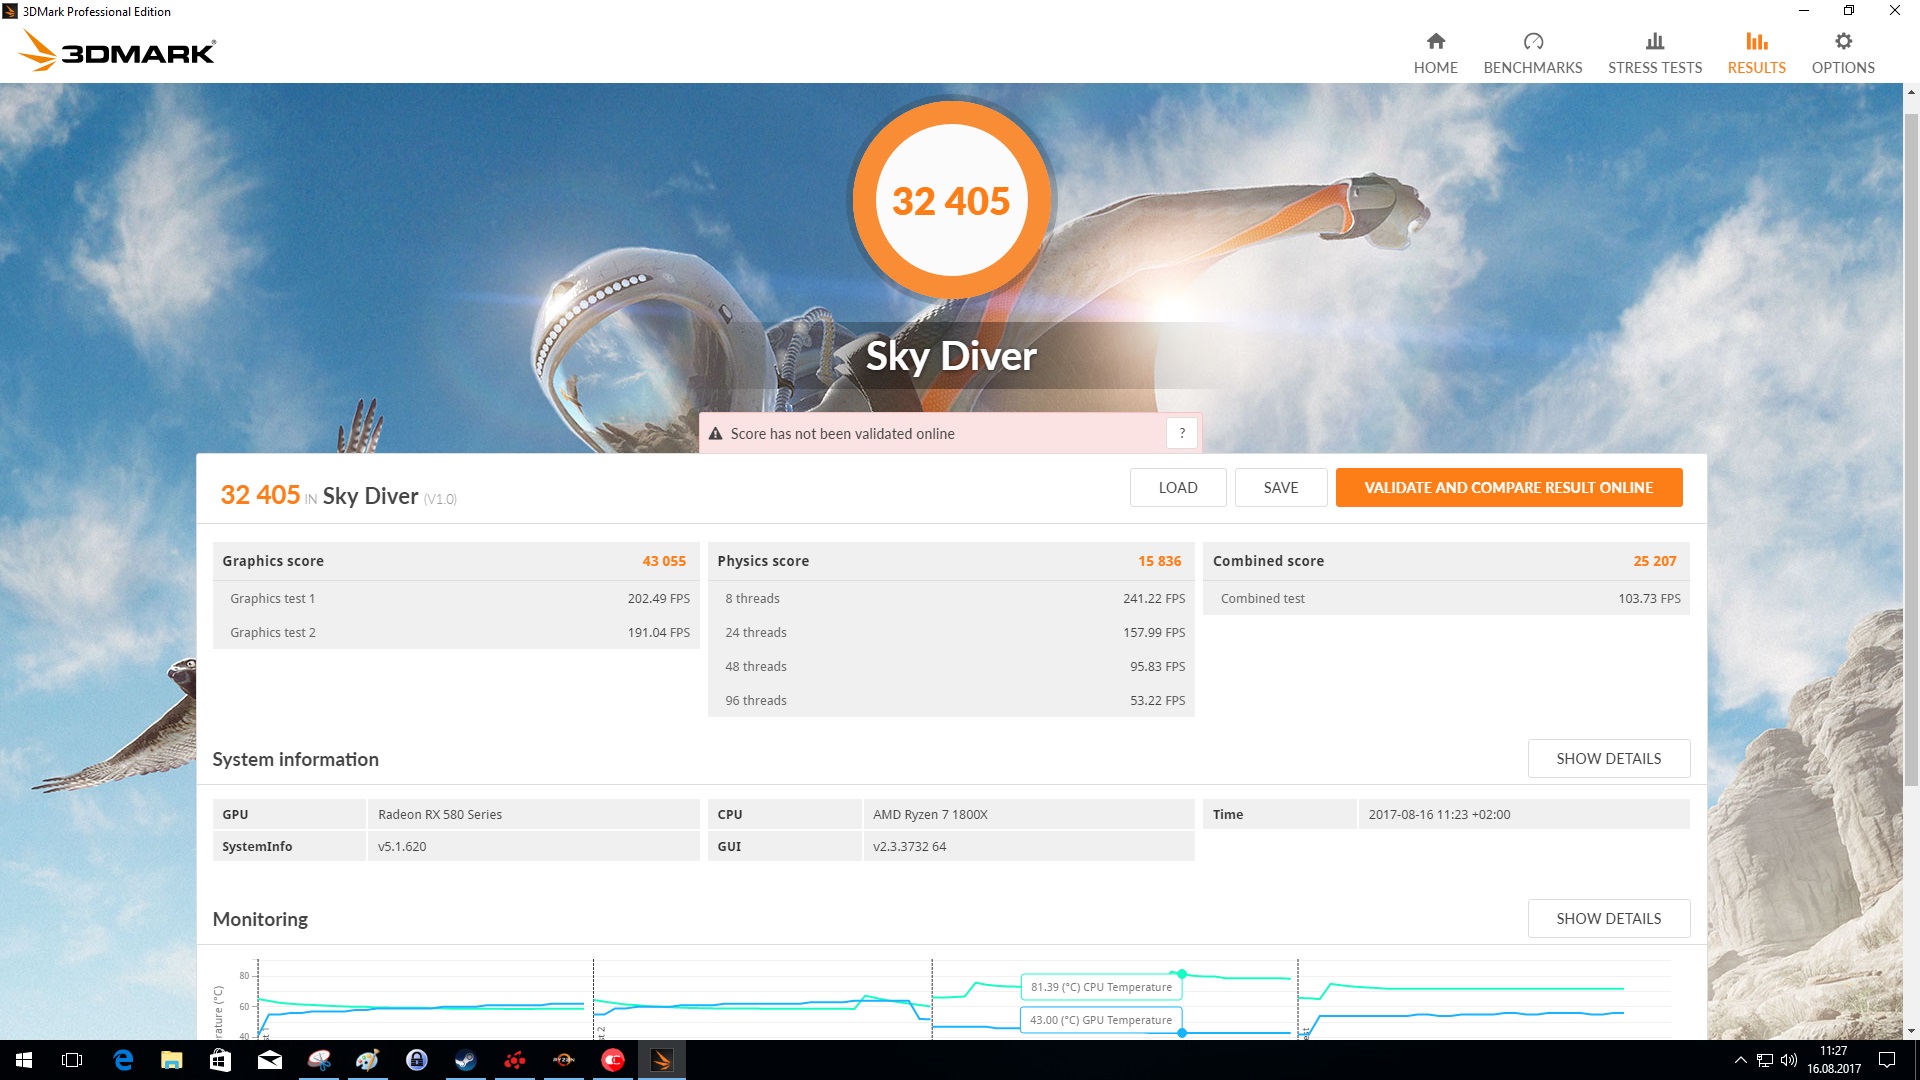
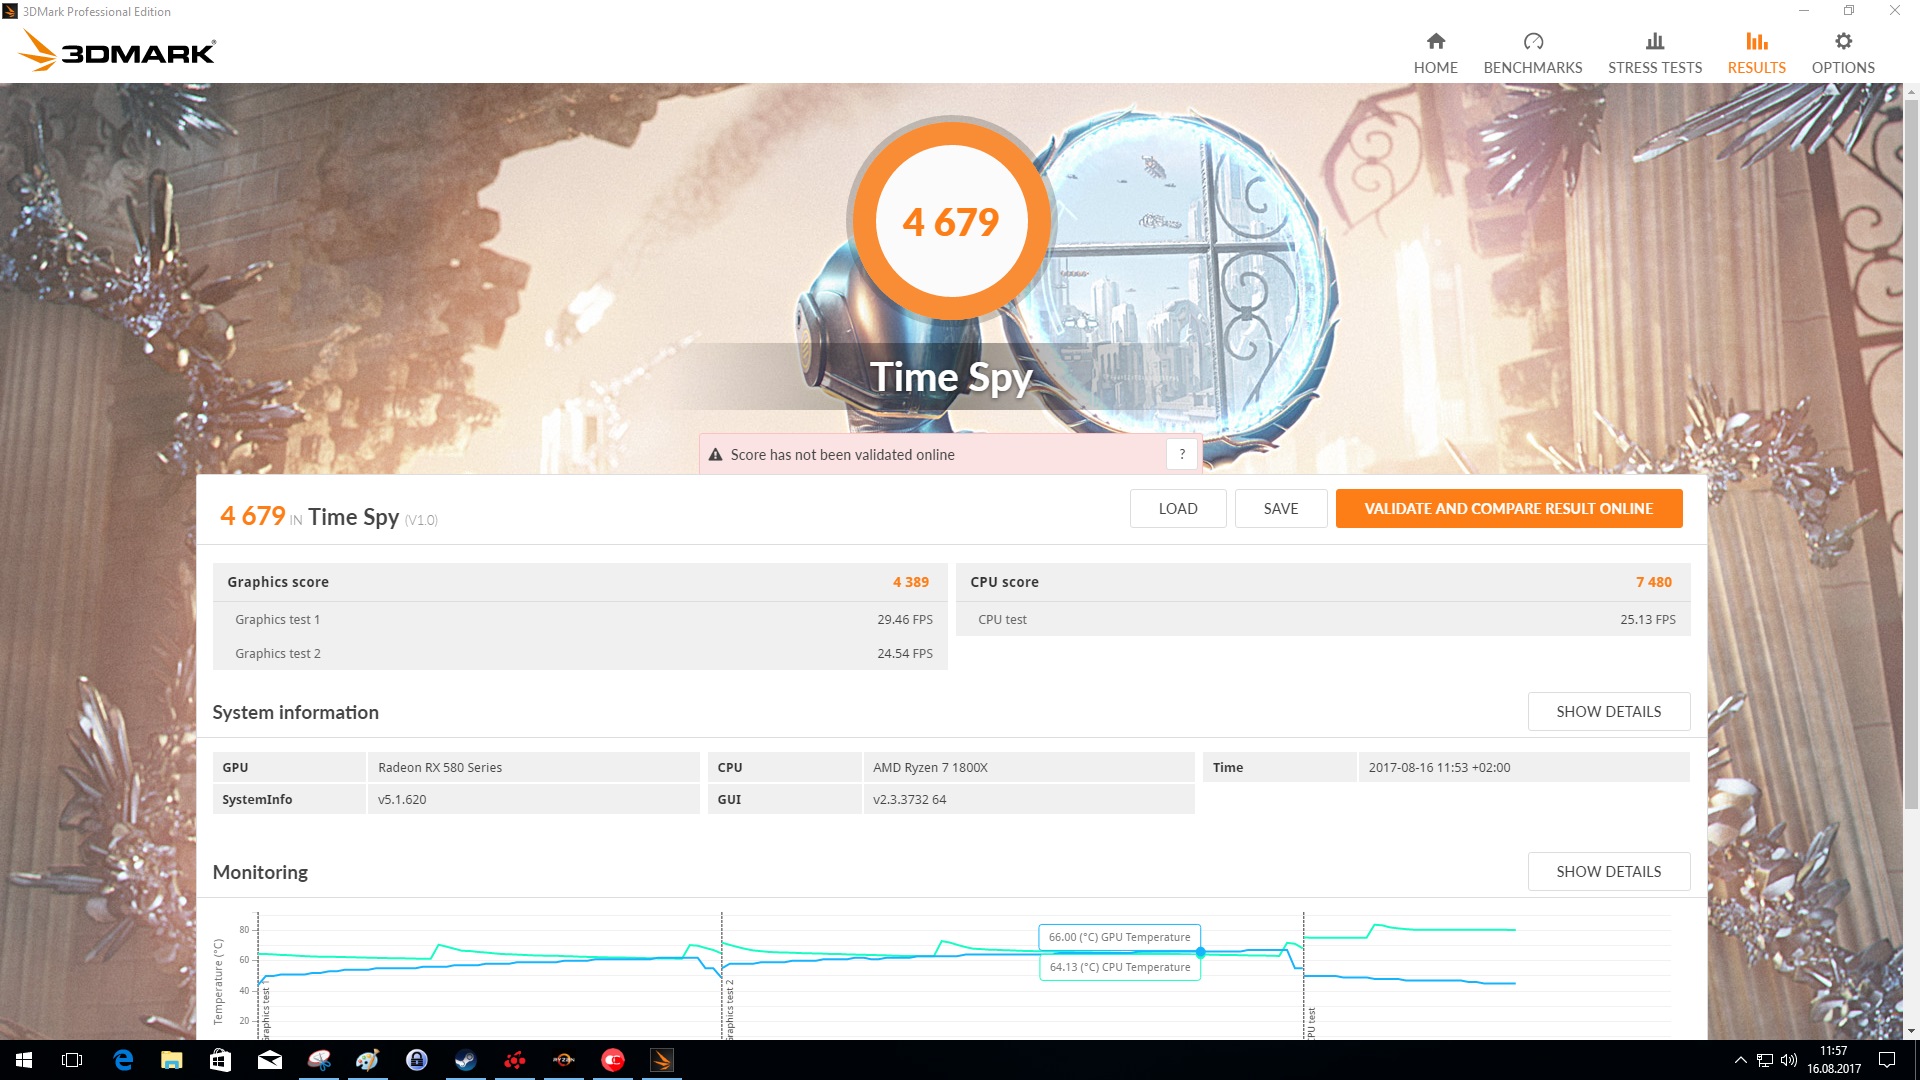
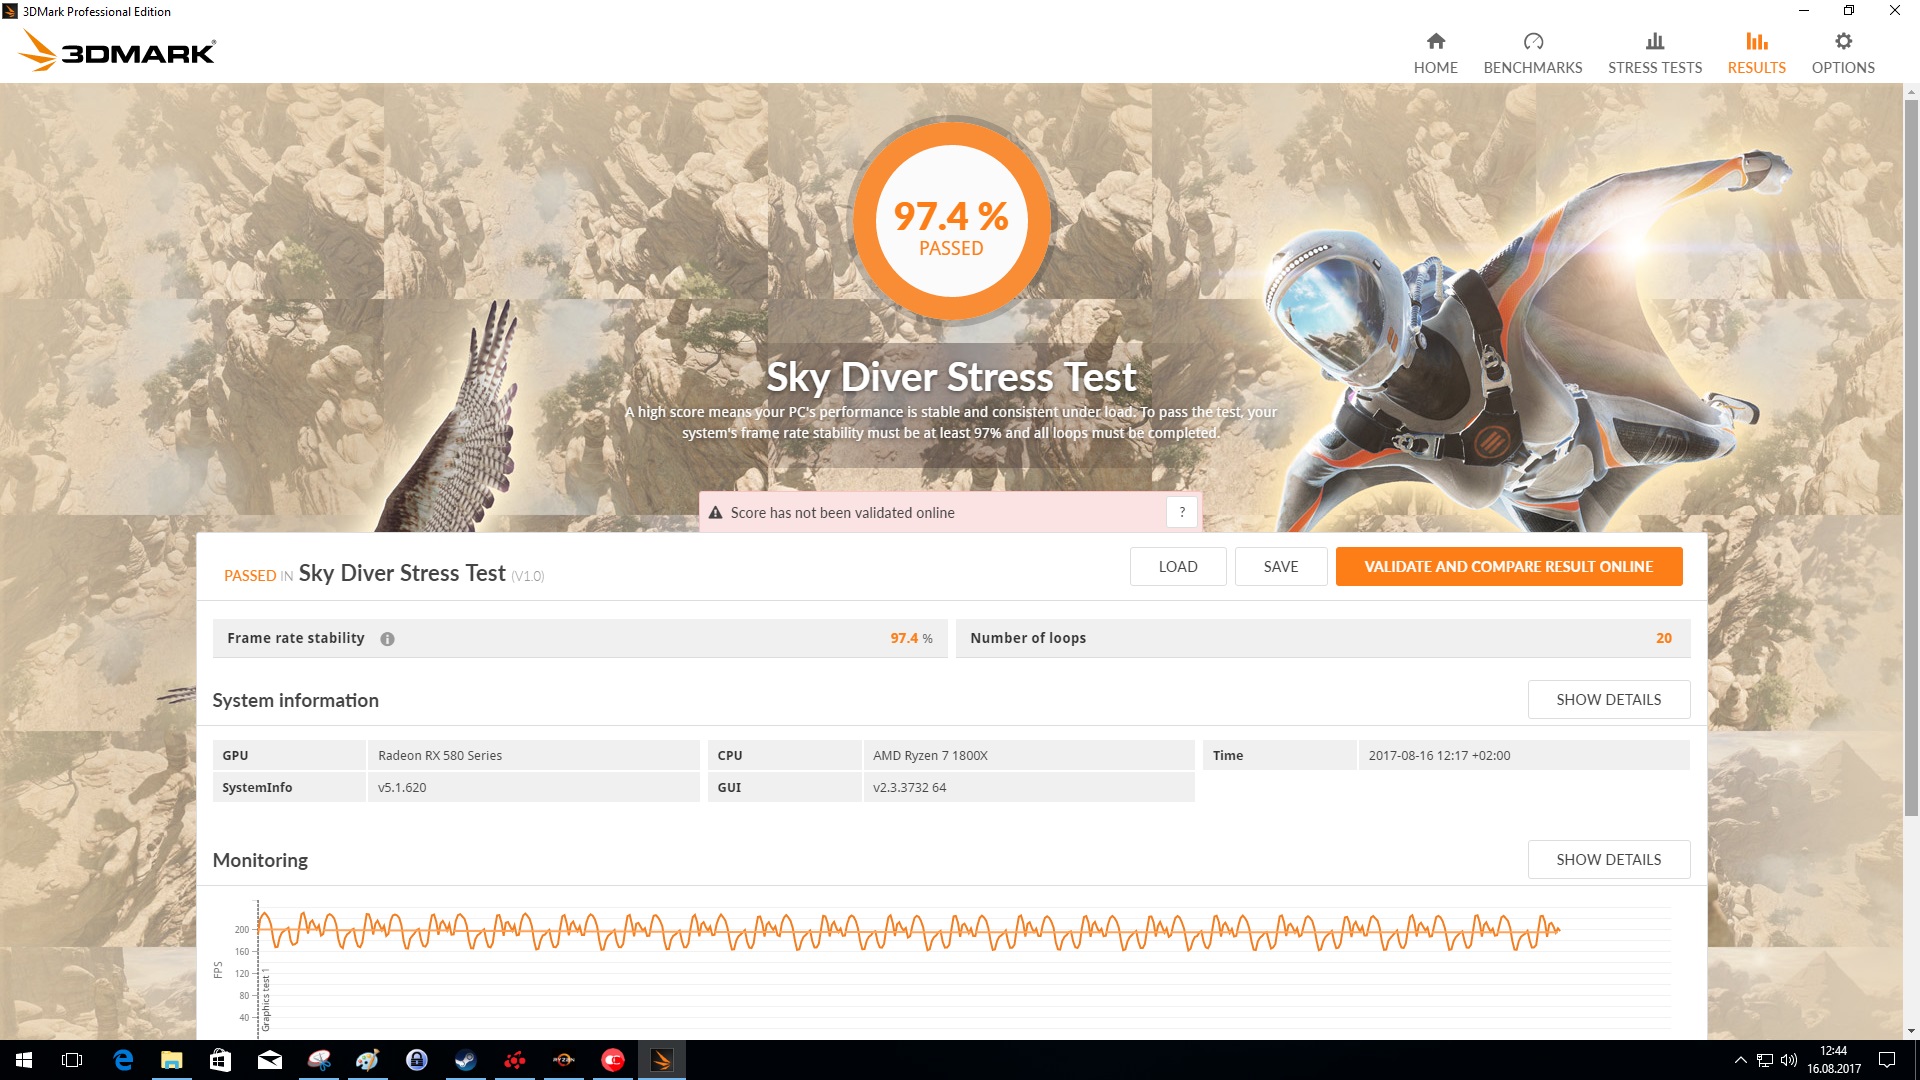
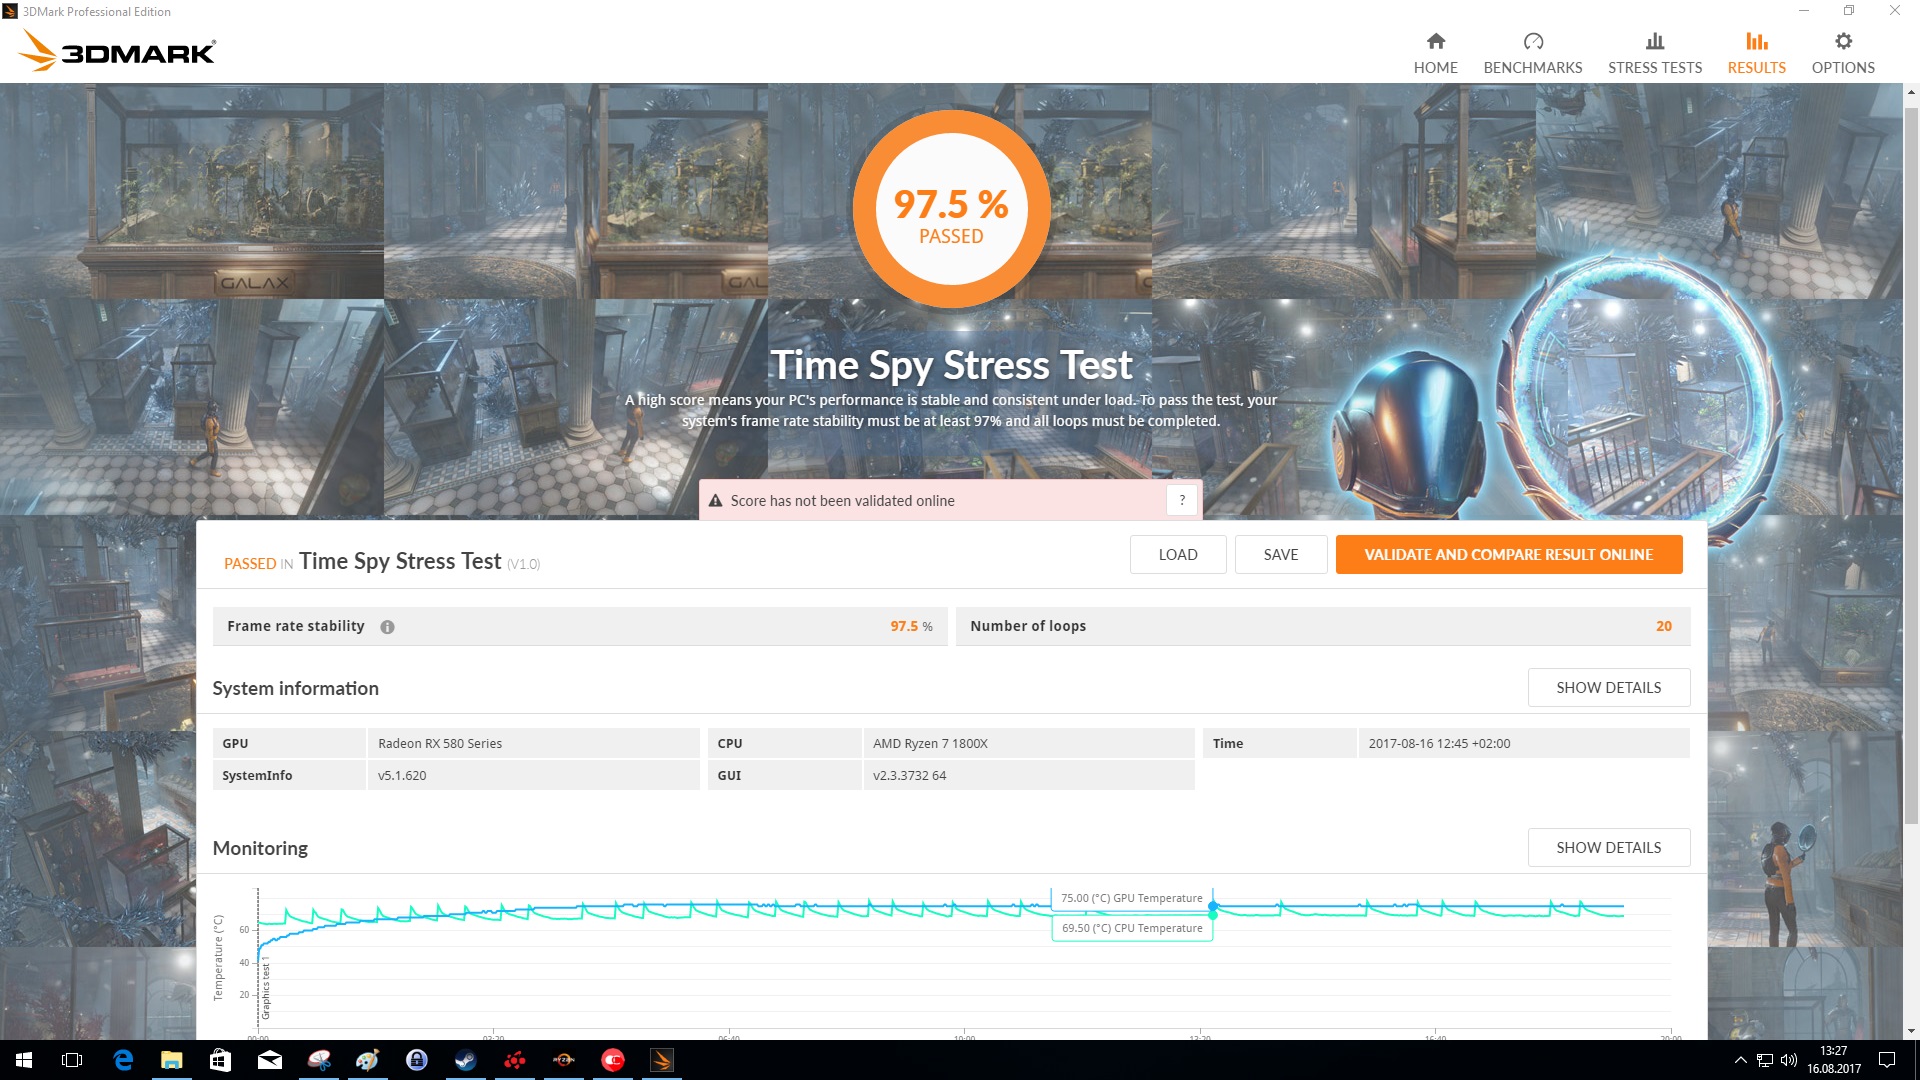
Stress Test and Emissions
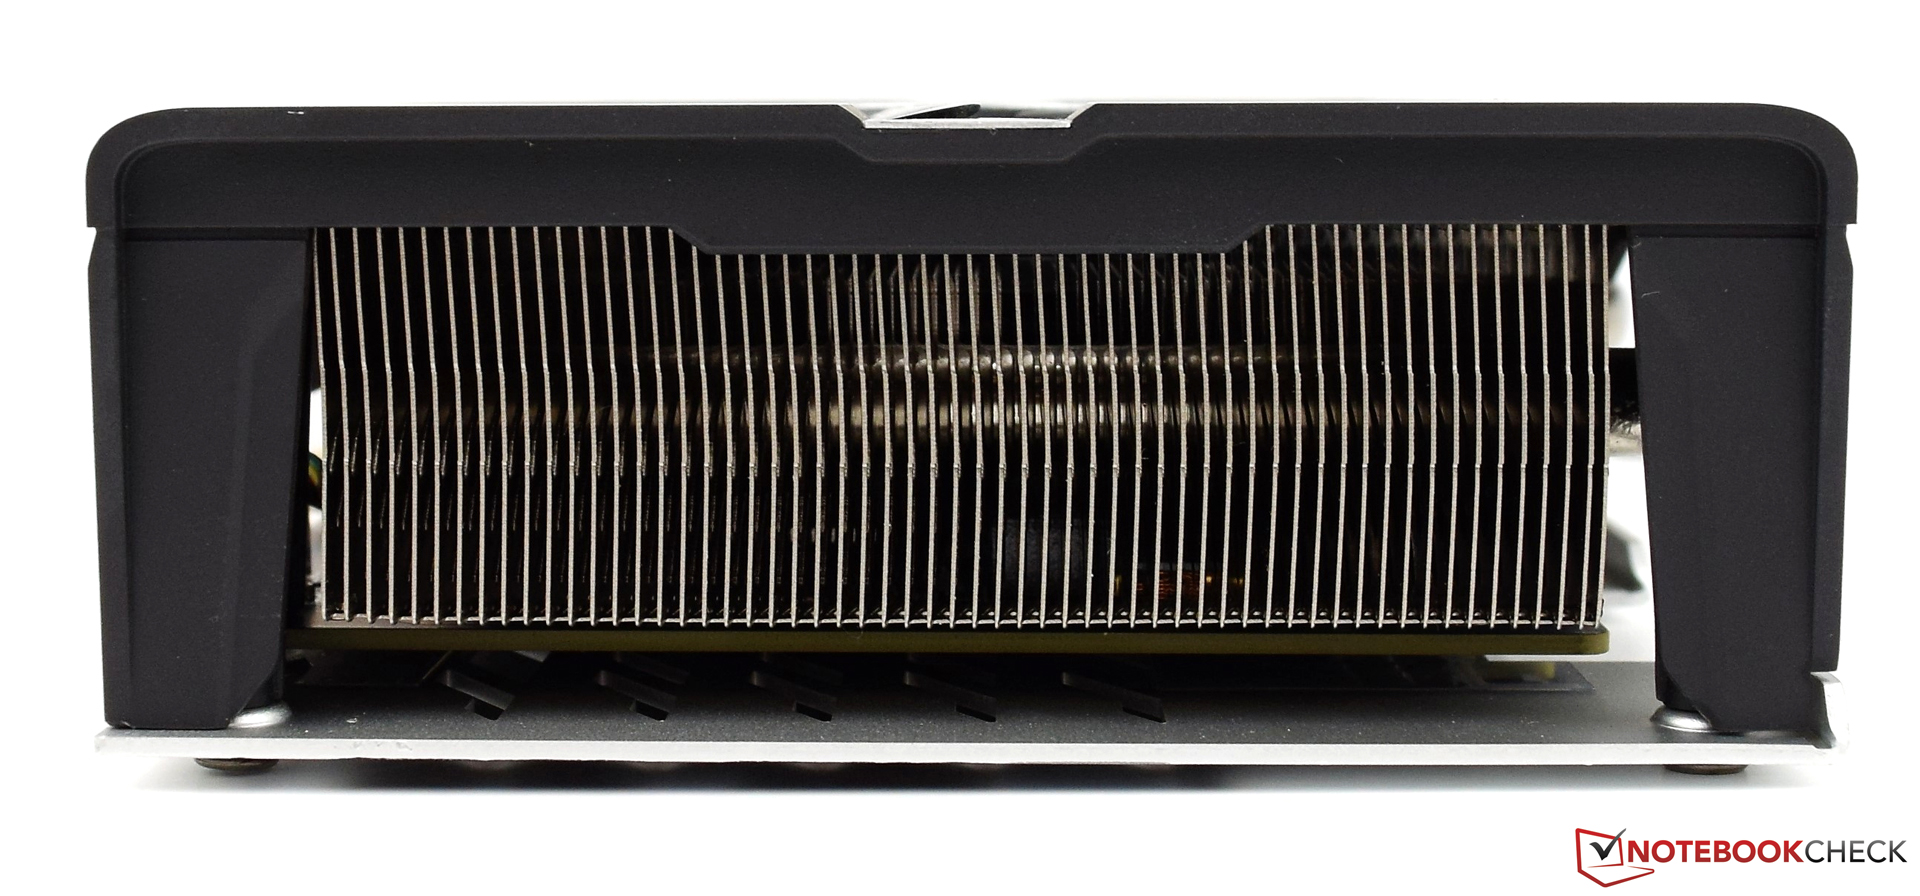
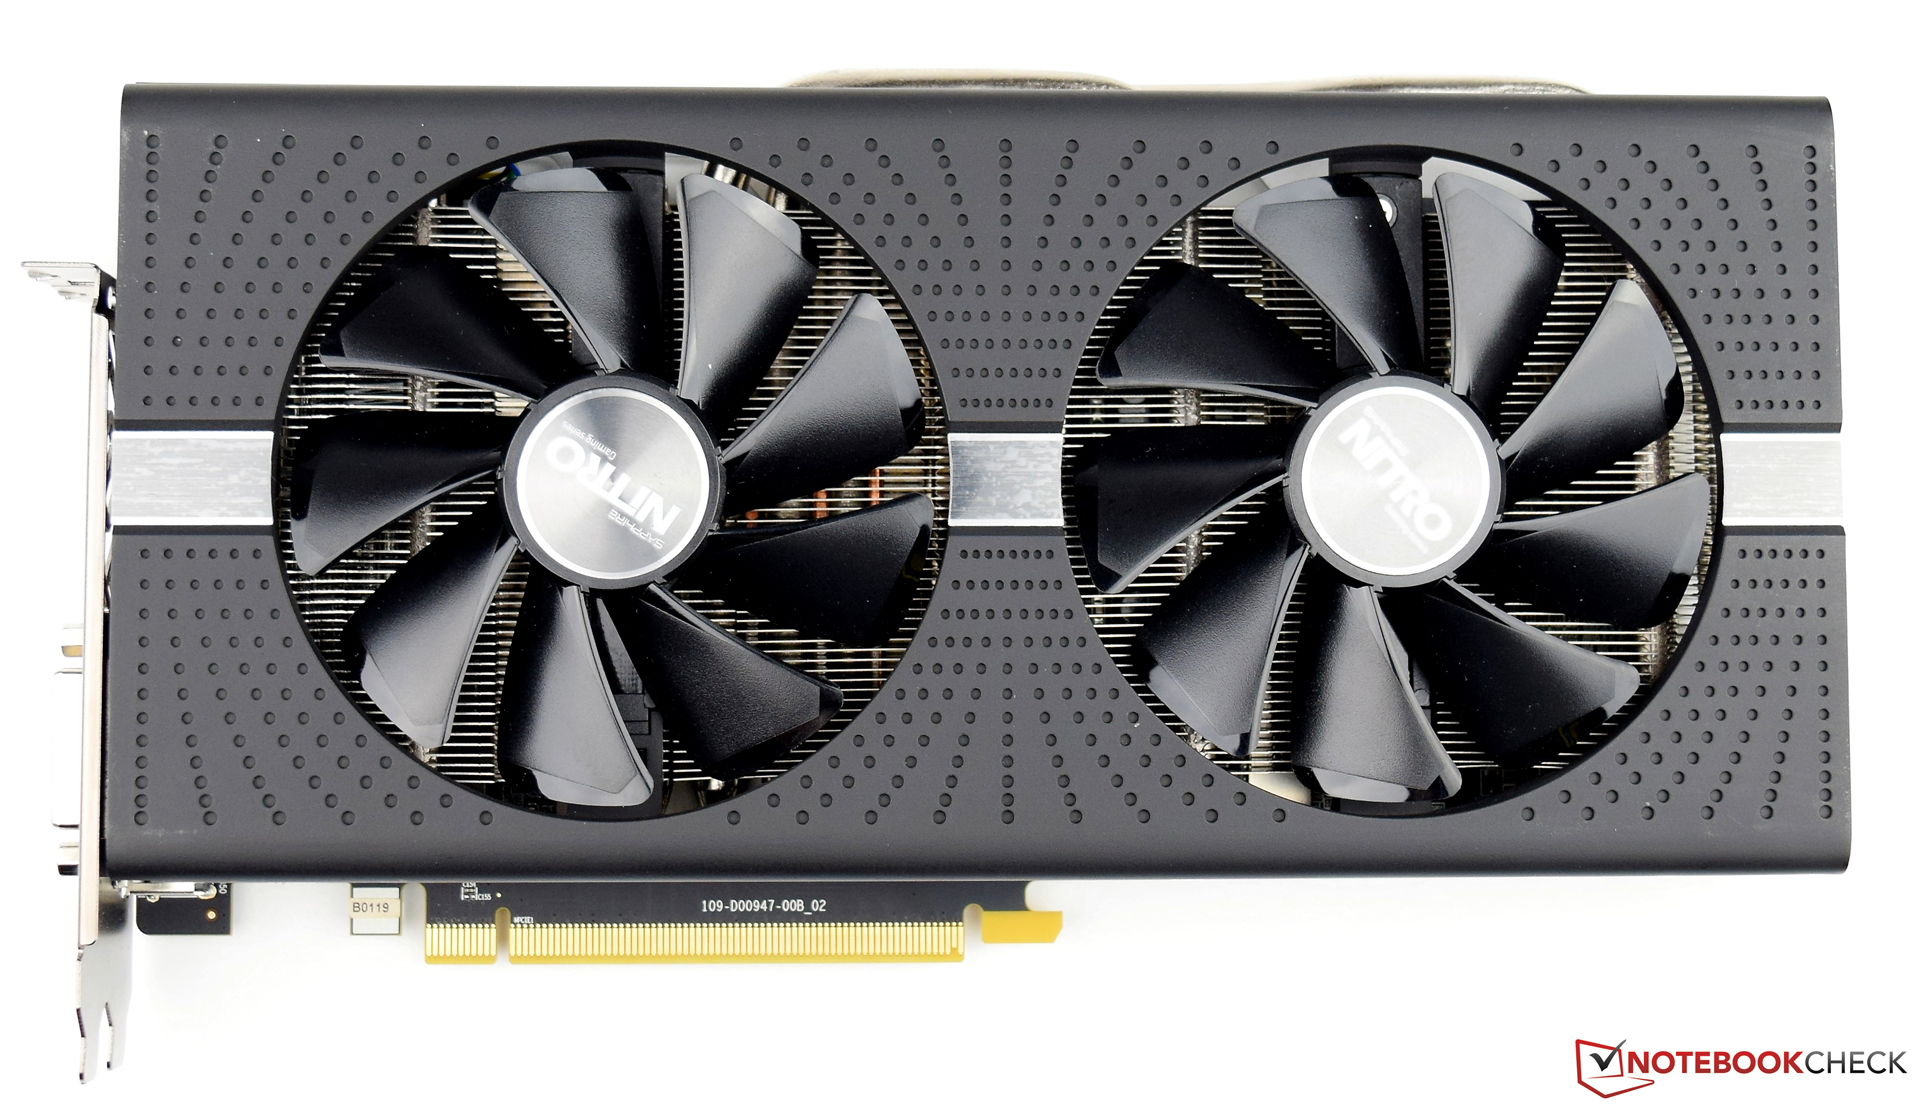
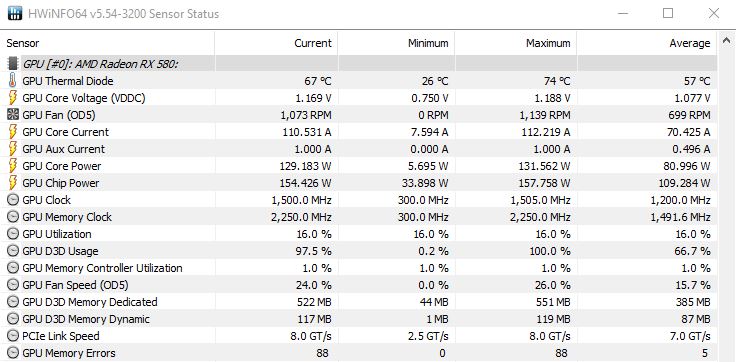
Under constant load, the Sapphire Nitro+ Radeon RX 580 can continue to use its full potential. The stress tests we ran (Sky Diver and Time Spy) show this with a result of about 97%. In the one-hour load test with FurMark, the 76 °C (169 °F) temperature is reached after 10 minutes. After that, the temperature levels out at 75 °C (167 °F). The two 95-mm axial fans spin at a conservative 850 rpm on average. With that, the operation of the graphics card is comfortably quiet even under load. The two fans produce a quiet rather than a high-frequency whirring. The clock speed of 1,411 MHz is maintained throughout. However, we can already guess that the overclocking potential might be limited slightly. The speed of the fans is only slowly increased when the temperature exceeds the limit of 76 °C (169 °F). Of course, these settings can also be adjusted manually with various tools. The WattMan tool included in the graphics driver offers many adjustment options and at the same time a good monitoring overview. If we adjust the fan speed to 1,100 rpm, the noise level only increases minimally, but the temperature of the graphics card decreases quickly to 70 °C (158 °F). If we set the fan speed to "Auto" again, both fans spin again at about 850 rpm and the temperature rises again to 75 °C (167 °F).
Power Consumption and Overclocking
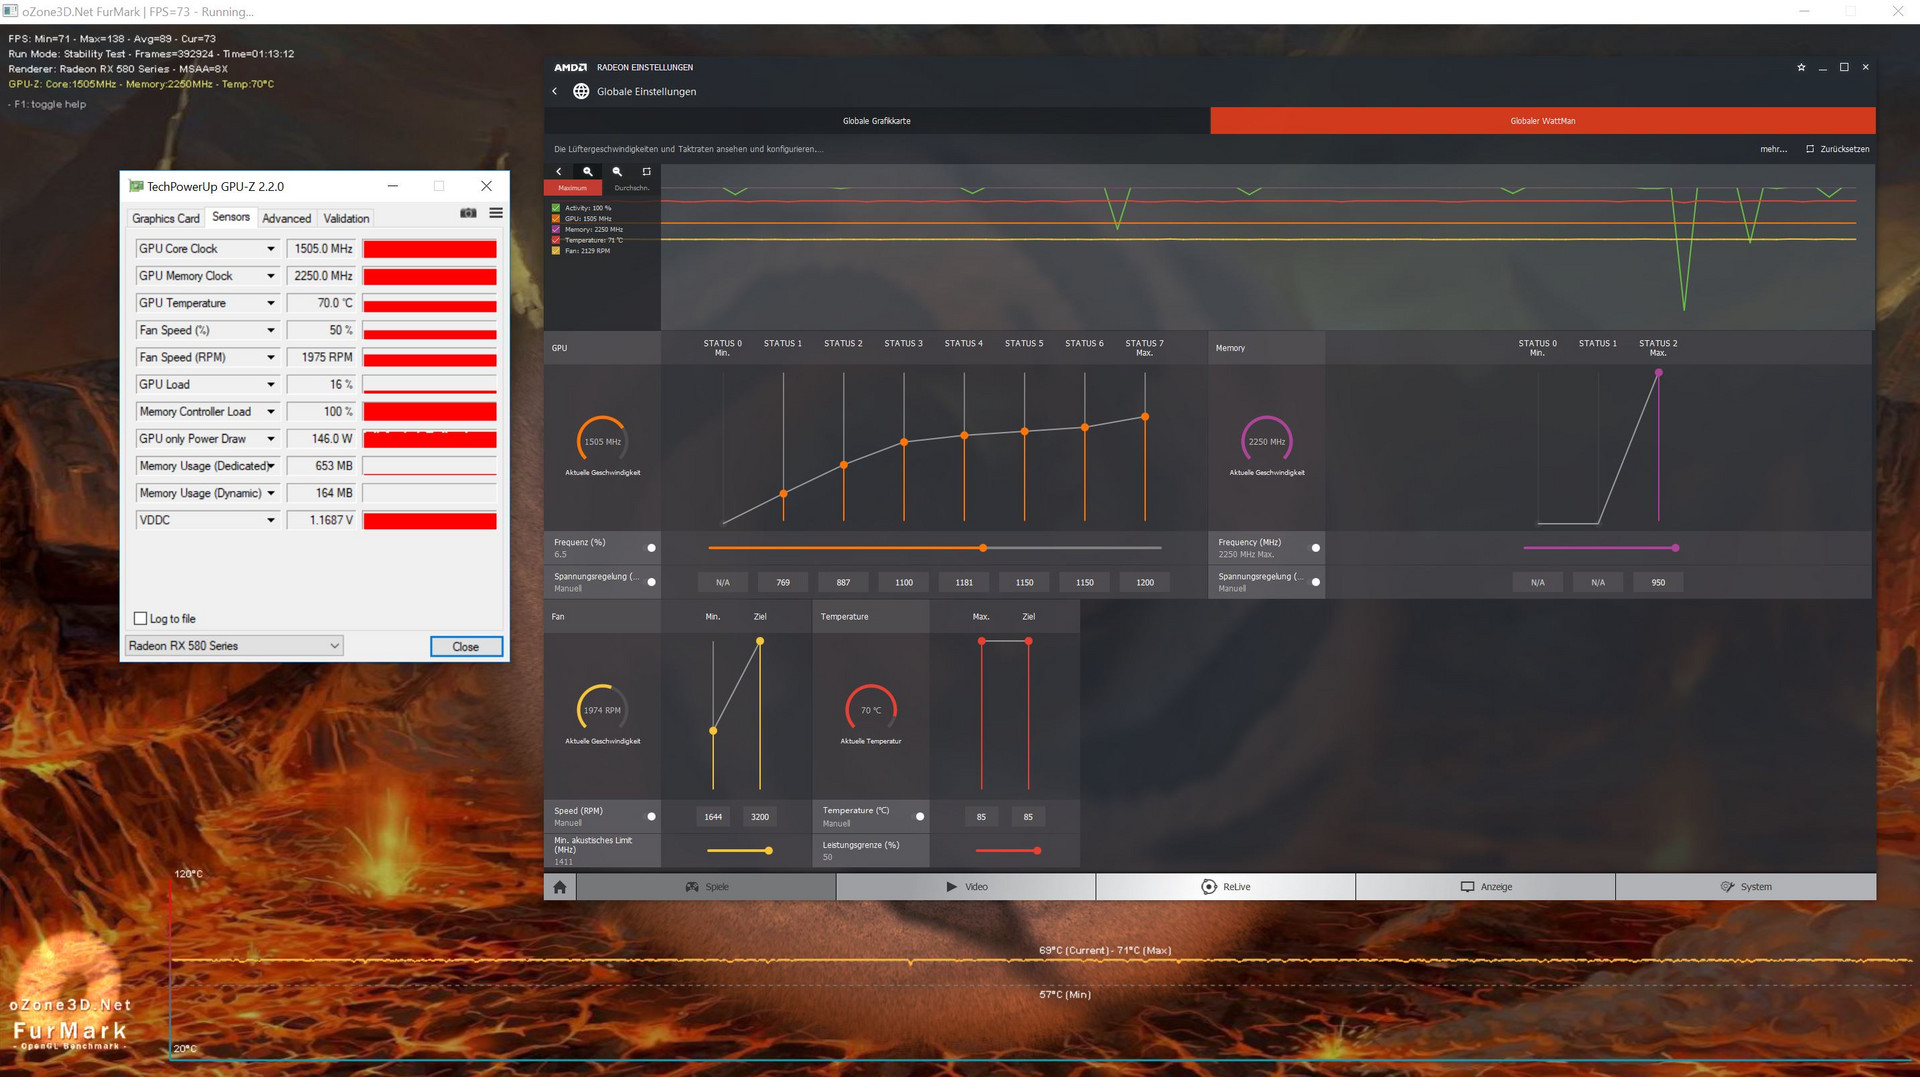
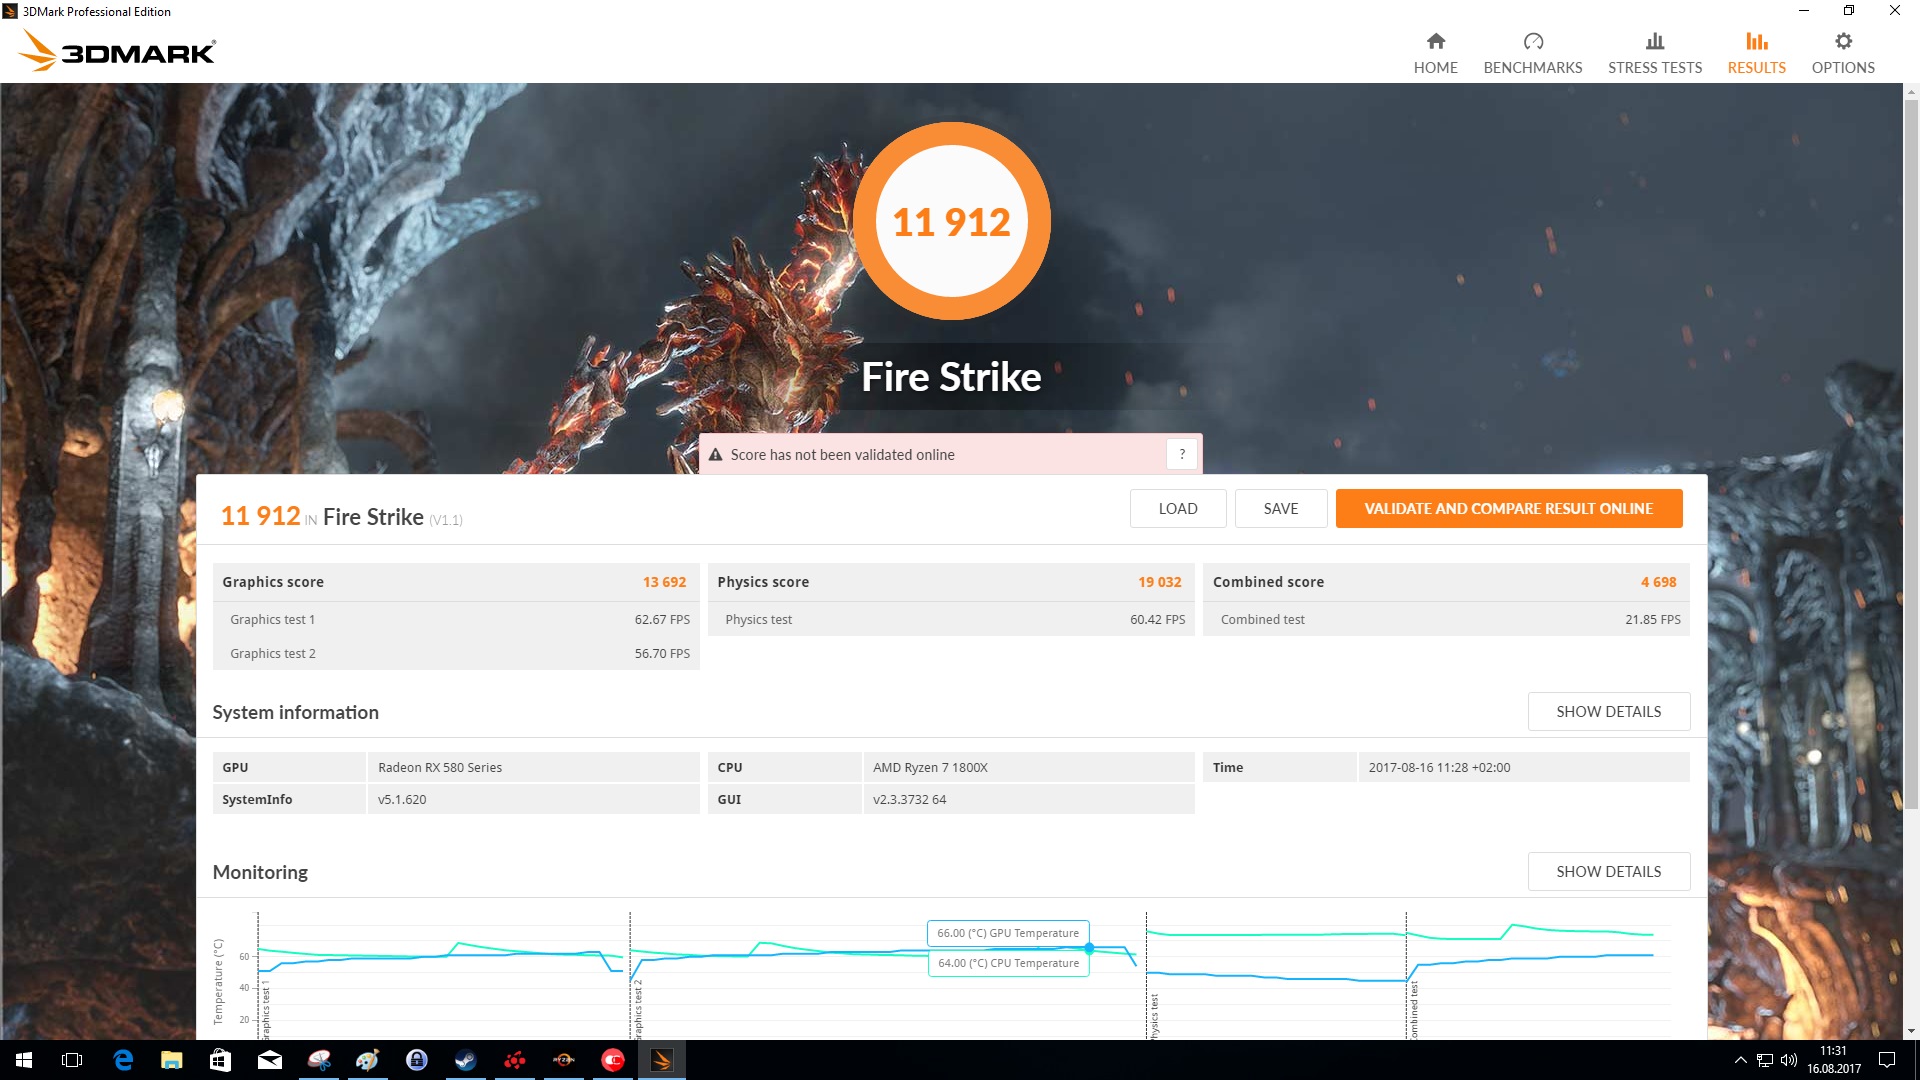
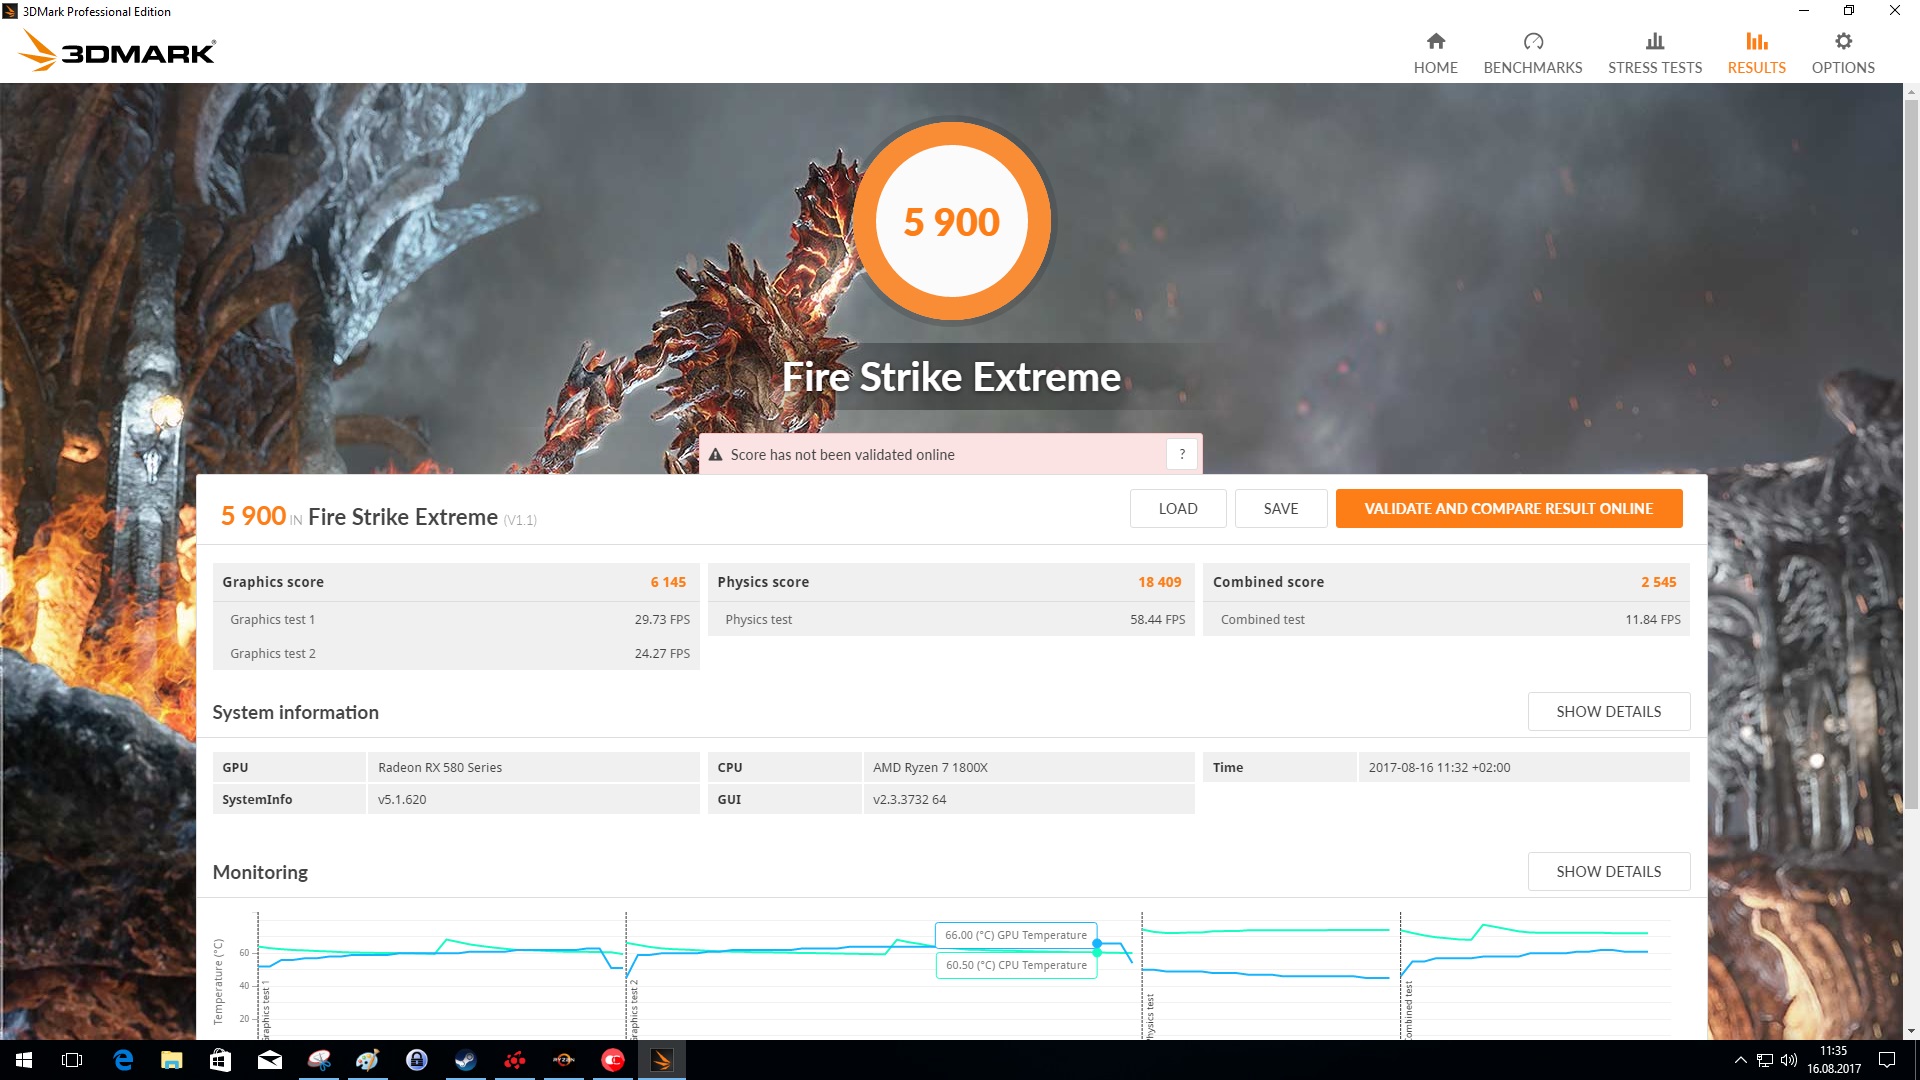
The overclocking results of the Sapphire Nitro+ Radeon RX 580 cannot be called very good, even though all the necessary settings can be adjusted with the WattMan tool. With the manual settings, the GPU can be overclocked to 1,475 MHz. Unfortunately, a stable operation at this clock speed was not possible with our graphics card. You can limit the maximum frequency possible for the VRAM with the tool. In this way, we could run it at 2,250 MHz without any problem. Since the power target was also increased by 20%, the temperature target also needed to be increased to avoid underclocking. Of course the speed of the two axial fans was also adjusted to provide the graphics card with enough fresh air. Despite the large fans, the noise level rises considerably, without reaching a level that can be called annoying, though.
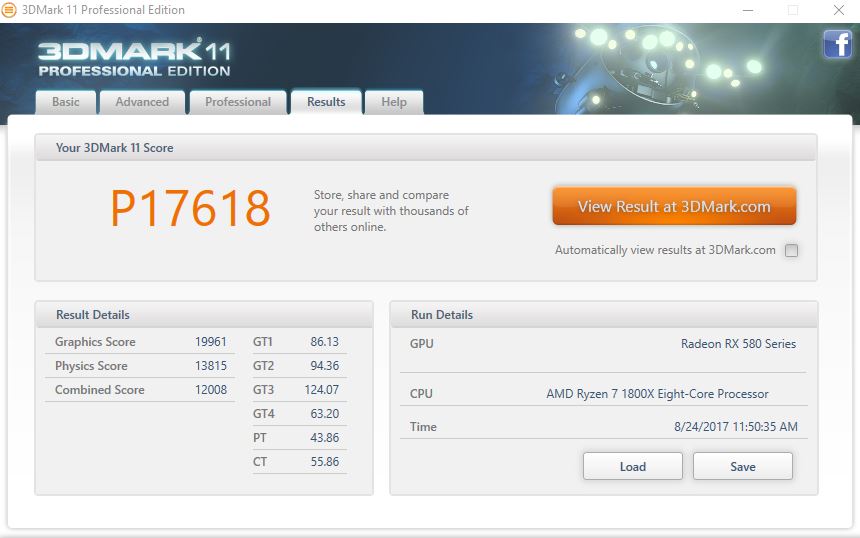
We tested the performance with the overclocking settings and were able to achieve an improvement from 19,961 points to 21,575 in the 3DMark 11 test. In the Fire Strike Extreme benchmark, the result could be improved from 6,145 to 6,570 points. However, we cannot speak about a noticeable improvement here. With a better cooling (liquid cooling), we could probably squeeze out another few percentage points of performance. But this will not make the graphics card 4K-capable throughout.
With a small slider adjustment, the Sapphire Nitro+ Radeon RX 580 offers the option to select a second BIOS, which operates the graphics chip at a clock speed of 1,411 MHz.
Verdict

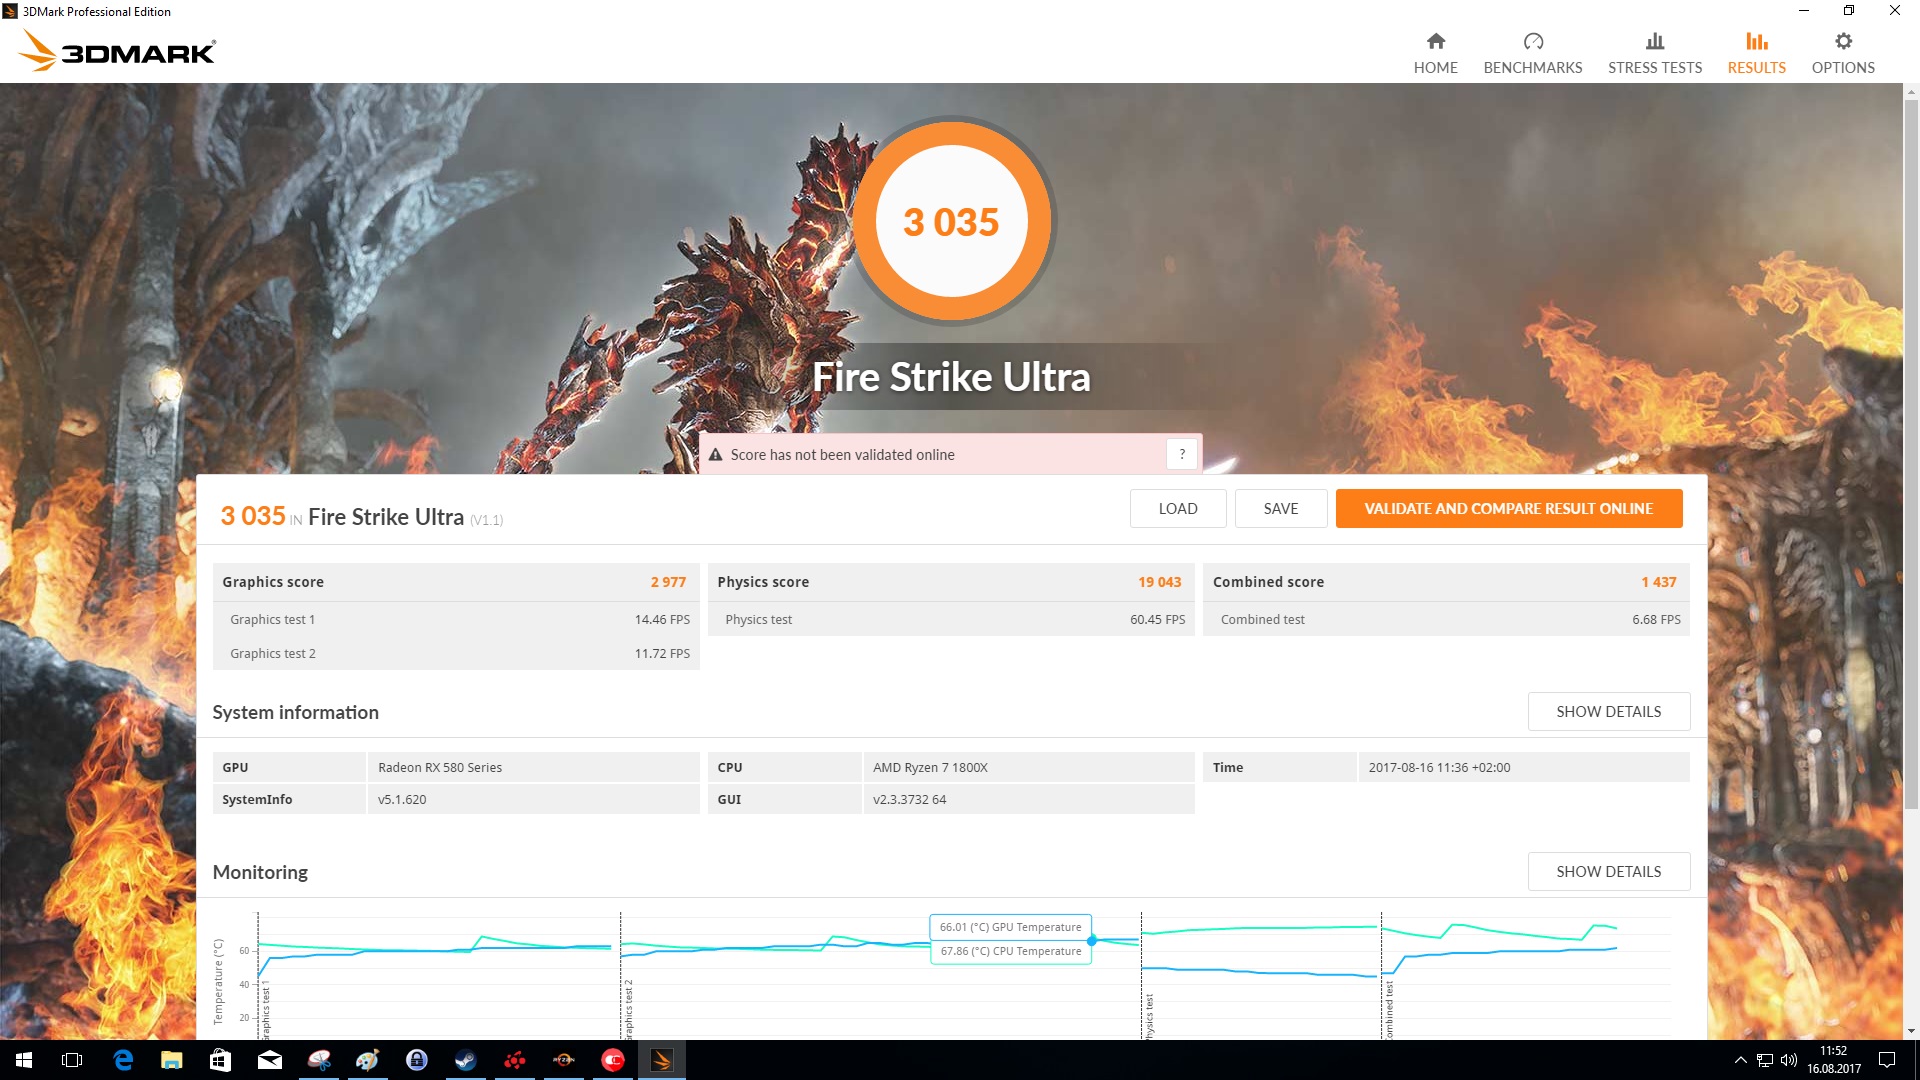
The Sapphire Nitro+ Radeon RX 580 is a gaming graphics card, which currently costs the owner 390 Euros (~$463, starting at $400 in the US). This graphics card is primarily interesting for gamers who play mainly in Full HD resolution. Even though the 8-GB VRAM are also sufficient for WQHD or UHD, the performance of the graphics card is insufficient to display the current games smoothly without compromises. The Sapphire Nitro+ Radeon RX 580 should be labeled as partly 4K capable, since the graphics card is able to display some games with playable frame rates on the screen.
Anyone who wants to do without Nvidia and for whom features such as FreeSync are in the foreground will be pleased with the Sapphire Nitro+ Radeon RX 580 by all means. The graphics card offers solid gaming performance and is also suitable as an interim solution until the AMD Radeon Vega graphics cards become more affordable.
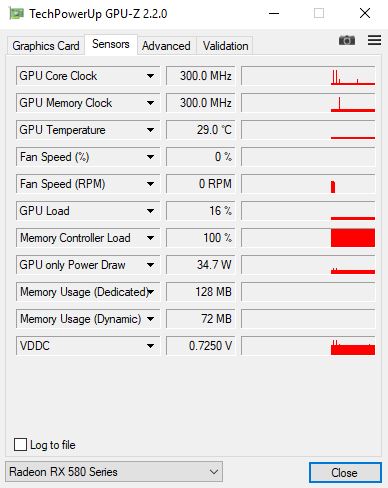
We like the high-quality build and the discrete highlights in the form of the RGB illumination. The dimensions of Sapphire's graphic card might lead to problems in some cases, since the case must offer a lot of space in terms of both length and width. Moreover, good case ventilation must be the standard. We also like the details, such as the overclocking and the power saving functions in 2D-Windows operation, which is also combined with the "Zero-Fan Mode."
And finally, the Sapphire Nitro+ Radeon RX 580 operates about 10% faster than its predecessor, which was based on the AMD Radeon RX 480. However, the Sapphire Nitro+ Radeon RX 580 is clearly beaten by the fastest graphics cards from Nvidia. The games performance is on the same level as that of the Nvidia GeForce GTX 1060.
