

Eurocom Q8 (i9-8950HK, GTX 1070, QHD) Laptop Review
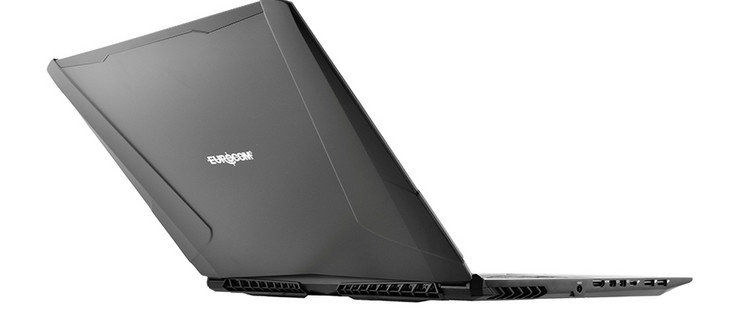
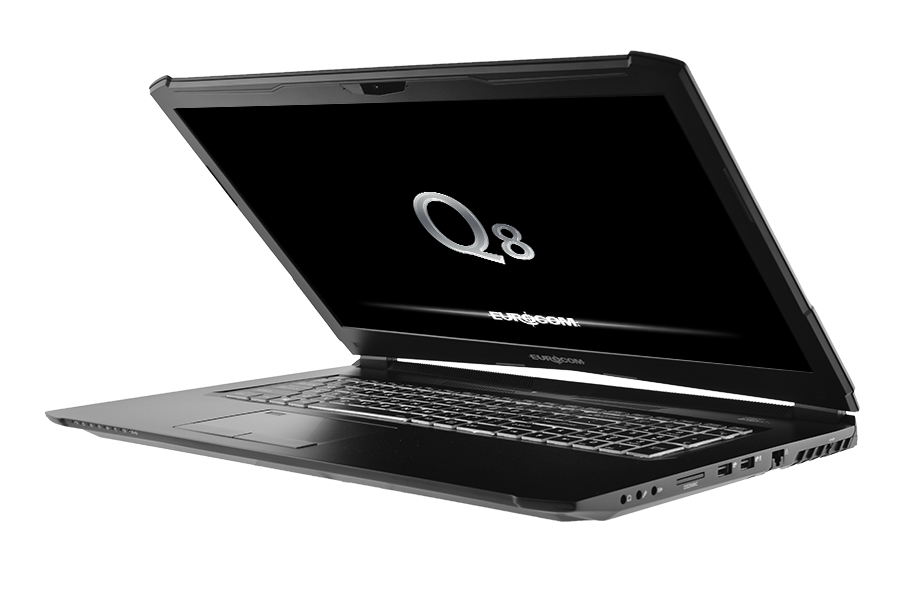
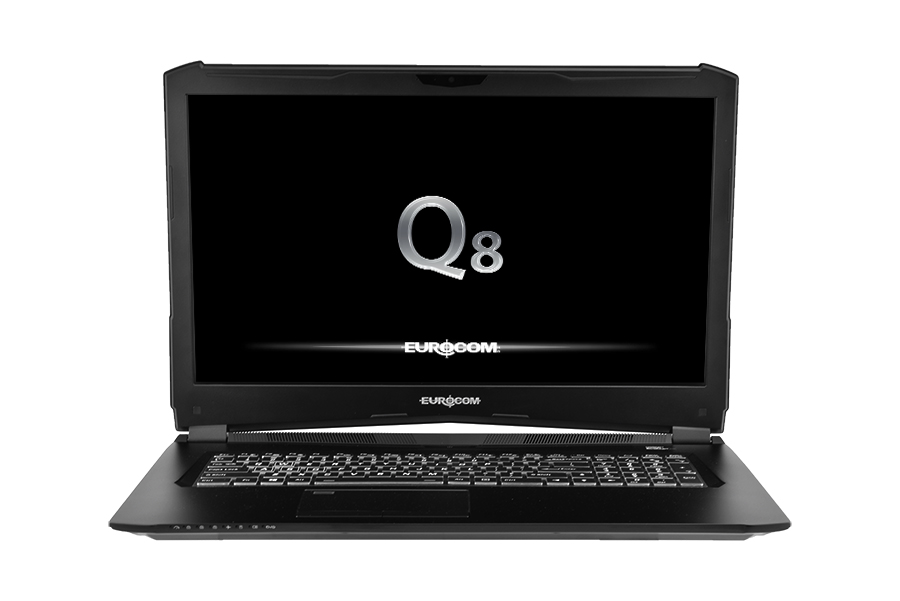
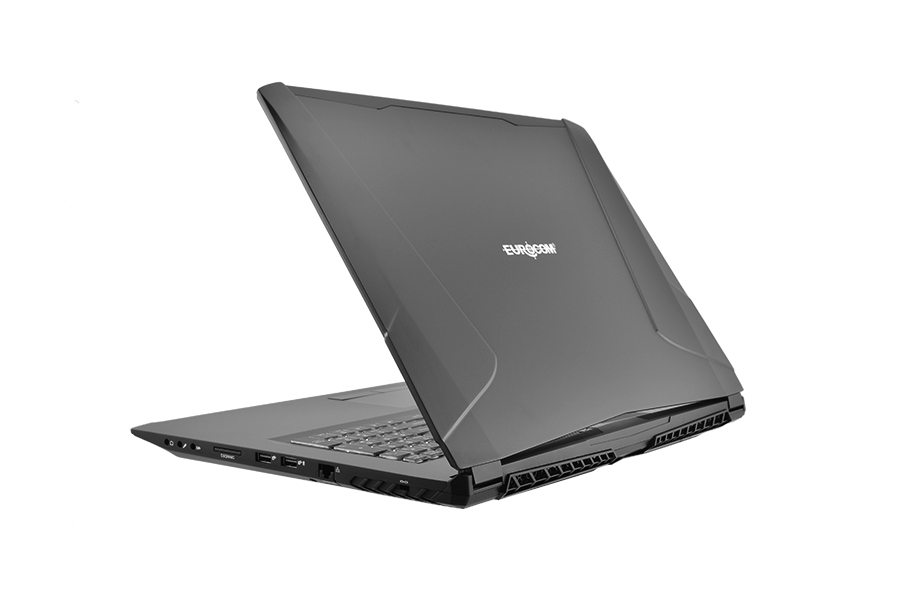
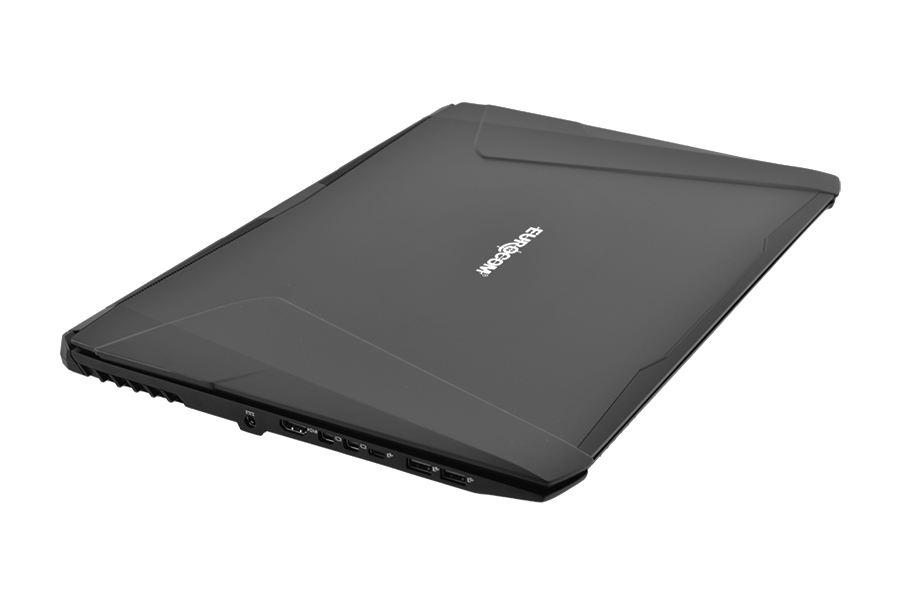
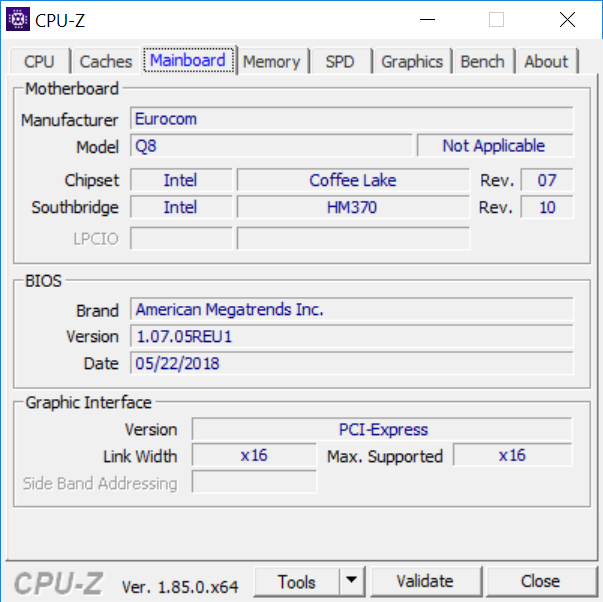
Based on the Clevo PA71 barebones chassis, the Q8 is Eurocom's 17.3-inch super-thin gaming notebook to complement its thicker enthusiast Sky series. It competes directly with other thin 17.3-inch systems including the MSI GS73VR, Razer Blade Pro, Aorus X7, Asus ROG GL703, and the EVGA SC17.
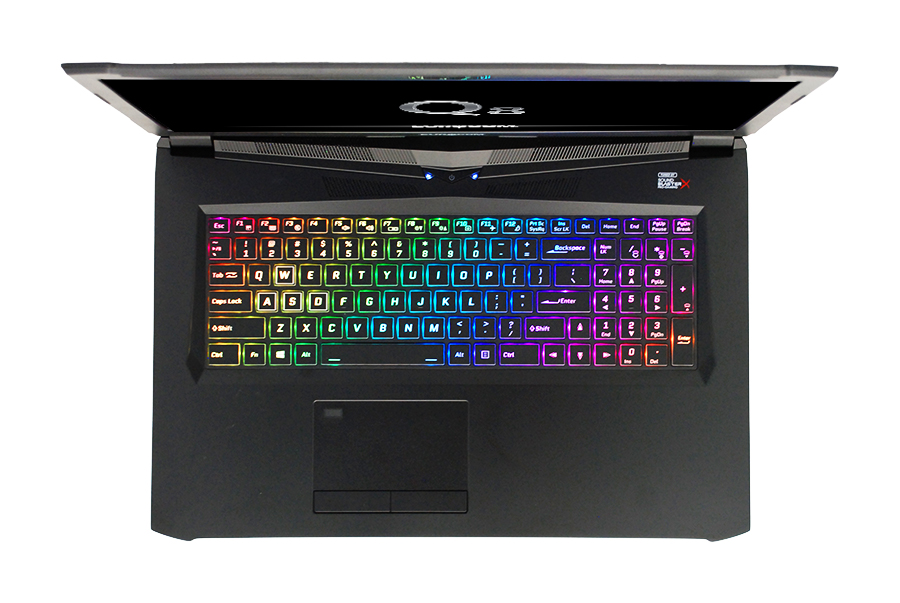
We recommend checking out our existing reviews on the Schenker XMG Pro 17 and PC Specialist Defiance IV since these systems utilize a very similar Clevo chassis design as our Eurocom Q8 albeit with less powerful CPUs or GPUs. Our overview of the case, ports, keyboard, and general feel of these systems also apply to the Q8. Thus, this page will focus more on performance and how well the system can cope with temperatures and noise when under stress. Does the newer Eurocom configuration bring enough power to the table to fend off the more popular alternatives?
See more from Eurocom and the Q series here:
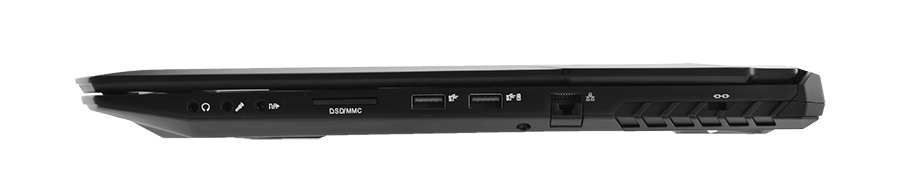
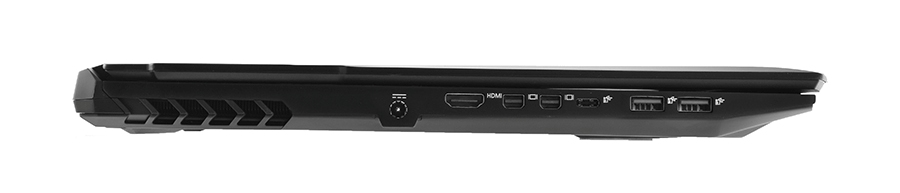
Connectivity
| SD Card Reader | |
| average JPG Copy Test (av. of 3 runs) | |
| Aorus X7 v7 (Toshiba Exceria Pro SDXC 64 GB UHS-II) | |
| Eurocom Q8 (Toshiba Exceria Pro SDXC 64 GB UHS-II) | |
| MSI GS73VR 7RG (Toshiba Exceria Pro SDXC 64 GB UHS-II) | |
| Asus GL703GE-ES73 (Toshiba Exceria Pro SDXC 64 GB UHS-II) | |
| maximum AS SSD Seq Read Test (1GB) | |
| Aorus X7 v7 (Toshiba Exceria Pro SDXC 64 GB UHS-II) | |
| MSI GS73VR 7RG (Toshiba Exceria Pro SDXC 64 GB UHS-II) | |
| Eurocom Q8 (Toshiba Exceria Pro SDXC 64 GB UHS-II) | |
| Asus GL703GE-ES73 (Toshiba Exceria Pro SDXC 64 GB UHS-II) | |
Communication
Our Q8 is equipped with an Intel 9560 module capable of transfer rates of up to 1.73 Gbps. Our current Linksys EA8500 setup can only test a maximum of 1 Gbps due to router and server limitations. Thus, wireless performance on the Q8 can be much faster than what we've recorded below should users have compatible networks.
| Networking | |
| iperf3 transmit AX12 | |
| Eurocom Q8 | |
| Asus Zephyrus M GM501 | |
| Aorus X7 v7 | |
| MSI GS73VR 7RG | |
| iperf3 receive AX12 | |
| Asus Zephyrus M GM501 | |
| Eurocom Q8 | |
| MSI GS73VR 7RG | |
| Aorus X7 v7 | |
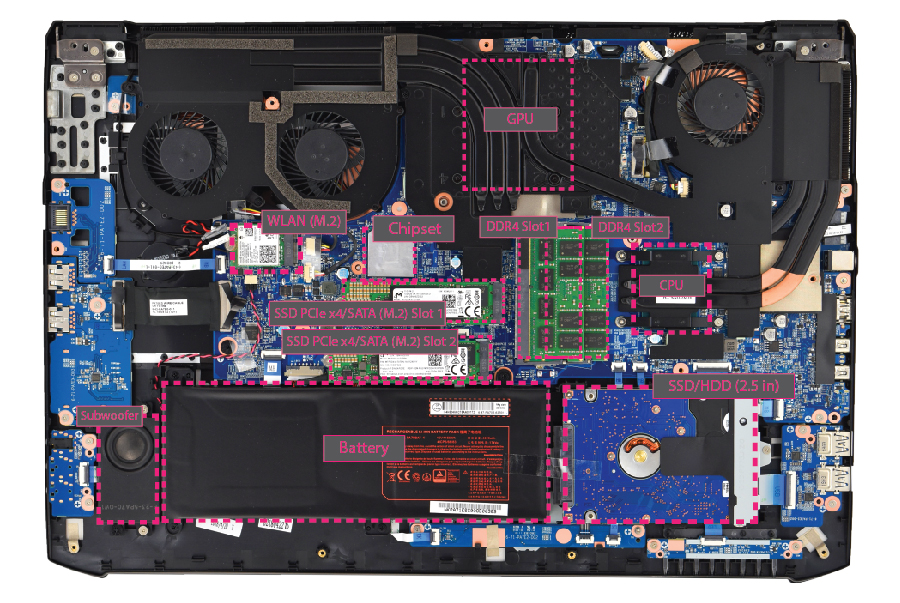
Maintenance
Warranty
The standard one-year limited warranty applies with optiosn to extend up to three years.
Display

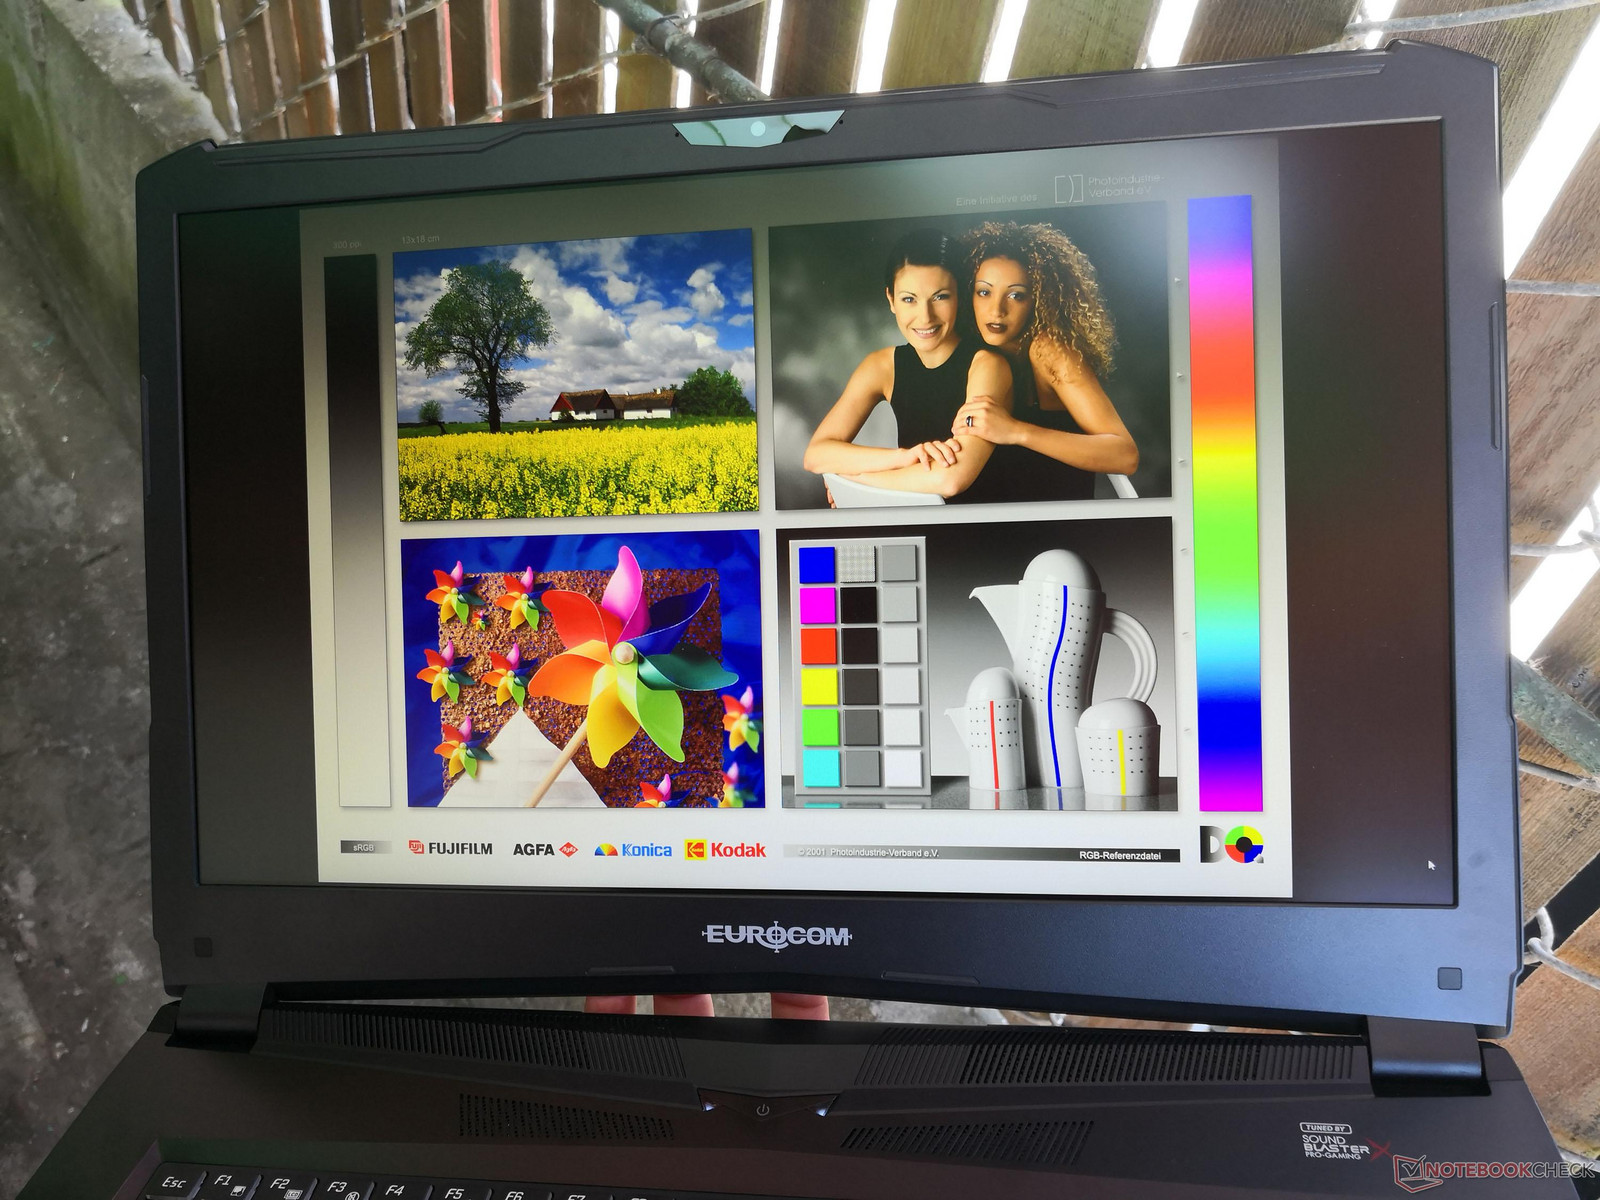
Eurocom offers a wider variety of display options for a single model compared to more popular alternatives. Users can choose from IPS 1080p 60 Hz, IPS 1080p 120 Hz, IPS 1080p 144 Hz, TN 1440p 120 Hz, and IPS 2160p 60 Hz with different color gamuts, response times, and brightness and contrast levels between them. Thus, the measurements and comments on this page reflect only the 1440p 120 Hz panel on our particular test unit. Very similar 1440p AU Optronics panels can also be found on the Alienware 17 R4 and older Aorus X7 v7.
Average brightness and contrast levels are similar to the Alienware and Aorus systems mentioned above. While the contrast ratio is good, it pales in comparison to many IPS panels where 1000:1 or greater is common. The matte panel is just slightly grainy and doesn't quite match the sharpness of a glossy panel.
| |||||||||||||||||||||||||
Brightness Distribution: 84 %
Center on Battery: 367.9 cd/m²
Contrast: 669:1 (Black: 0.55 cd/m²)
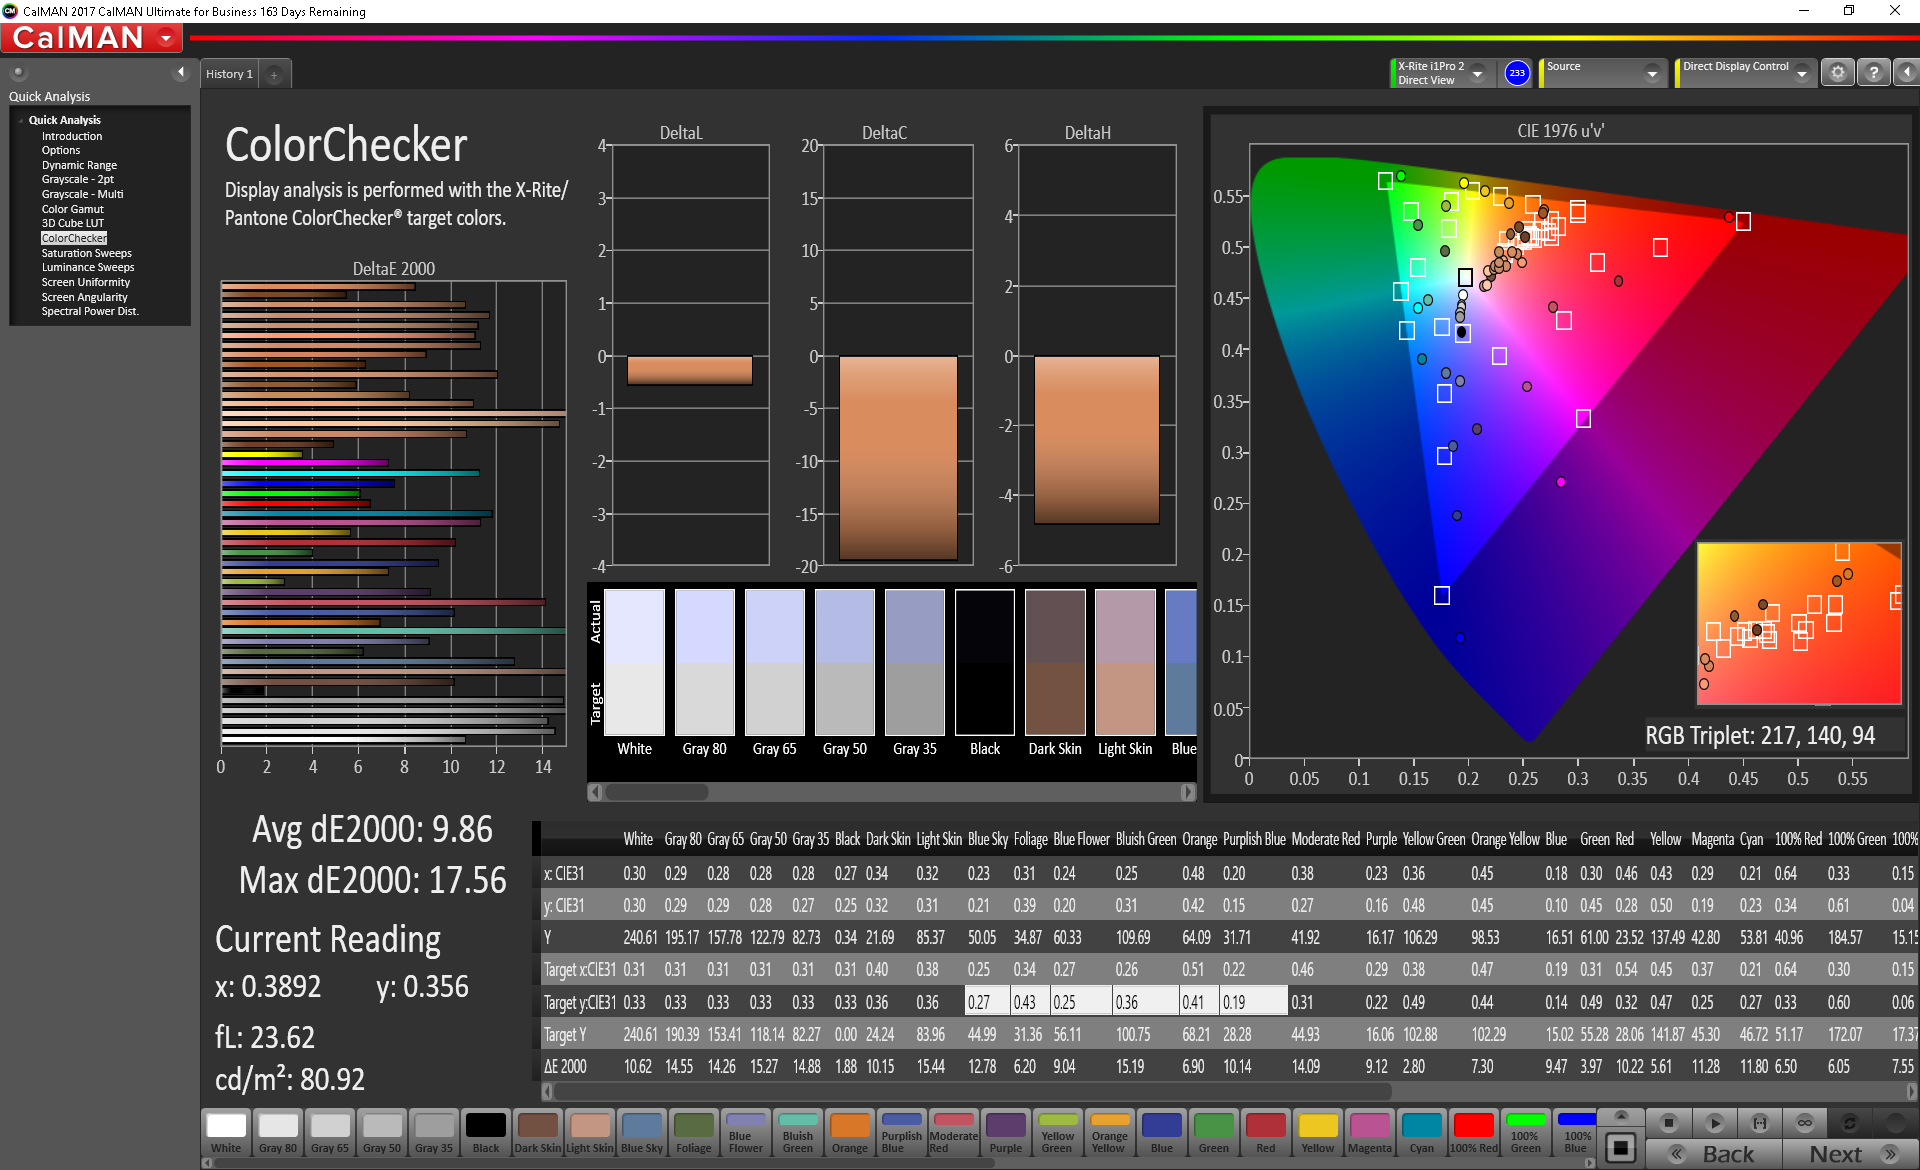
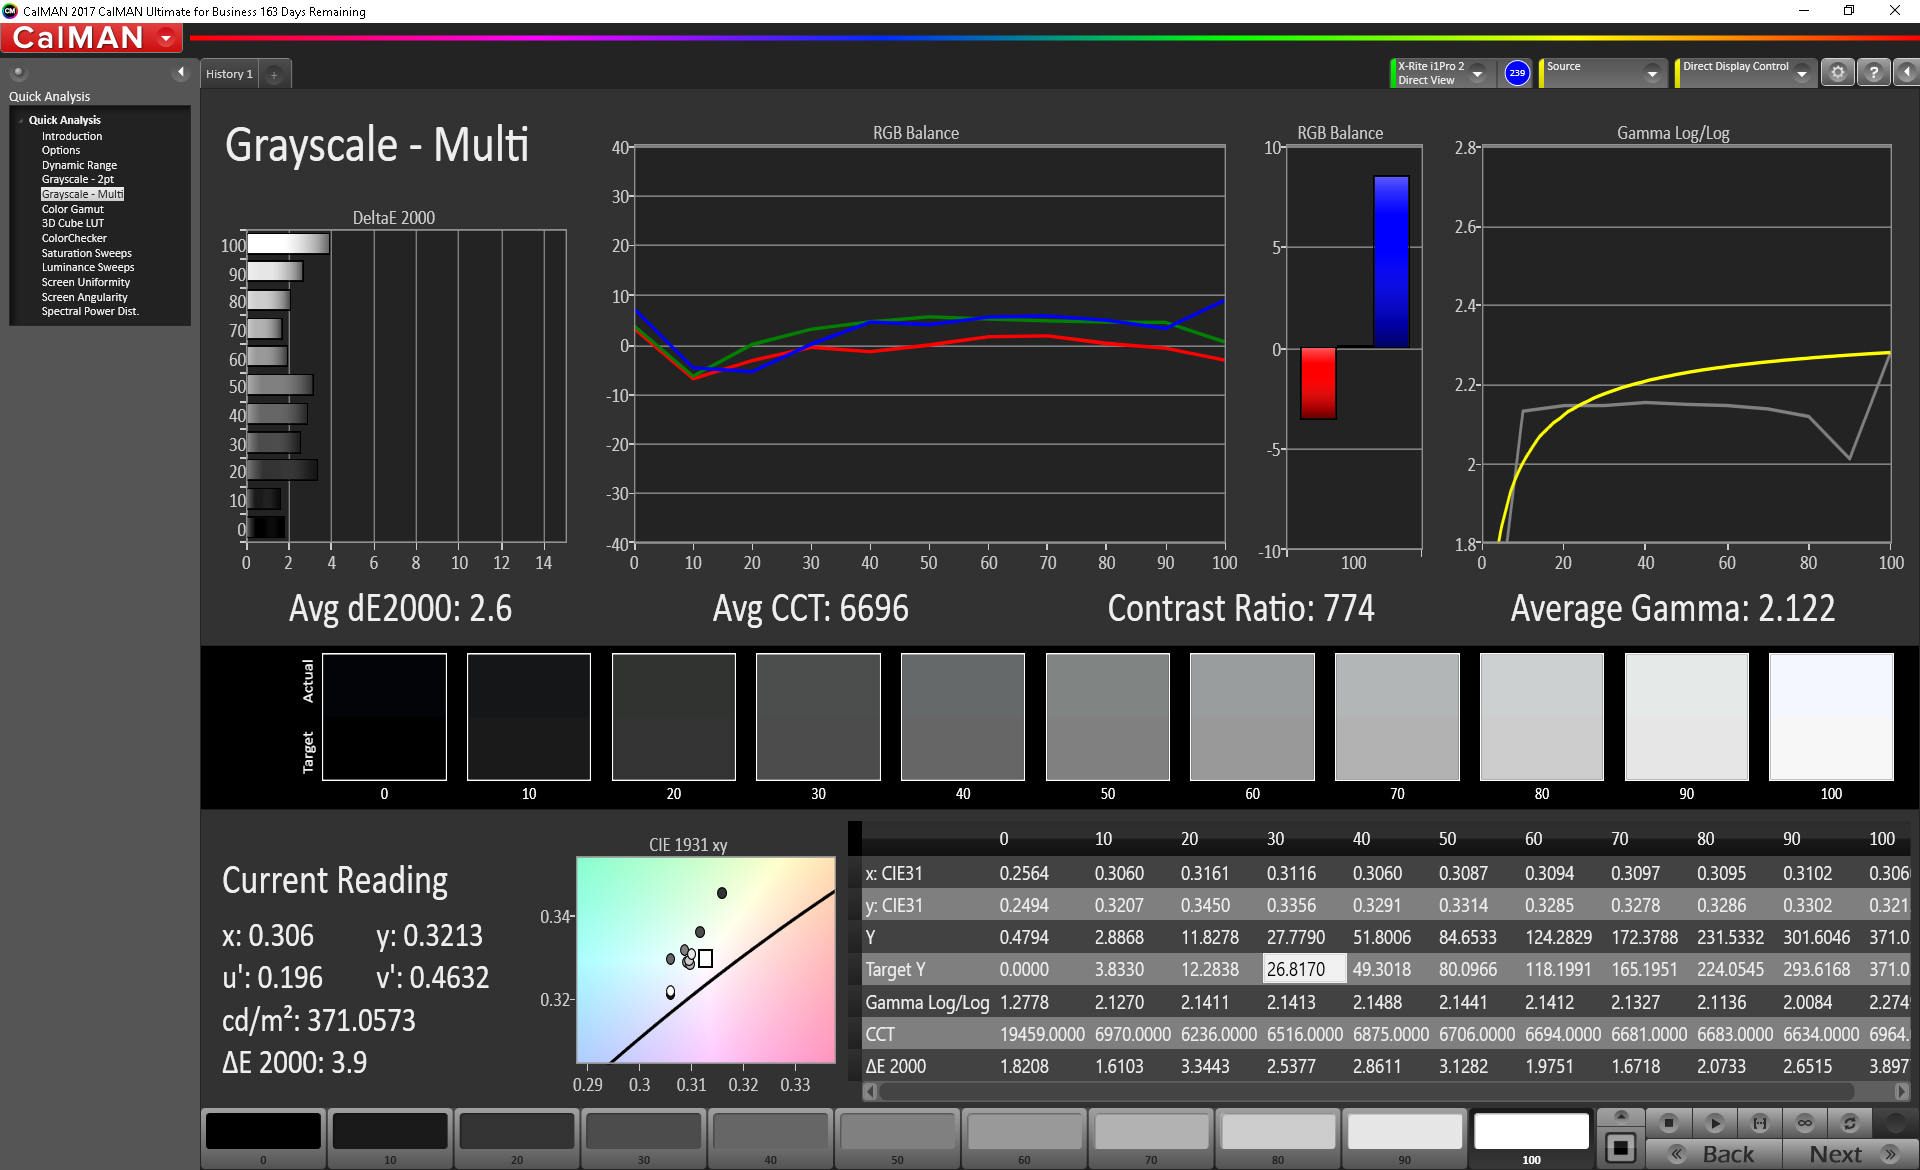
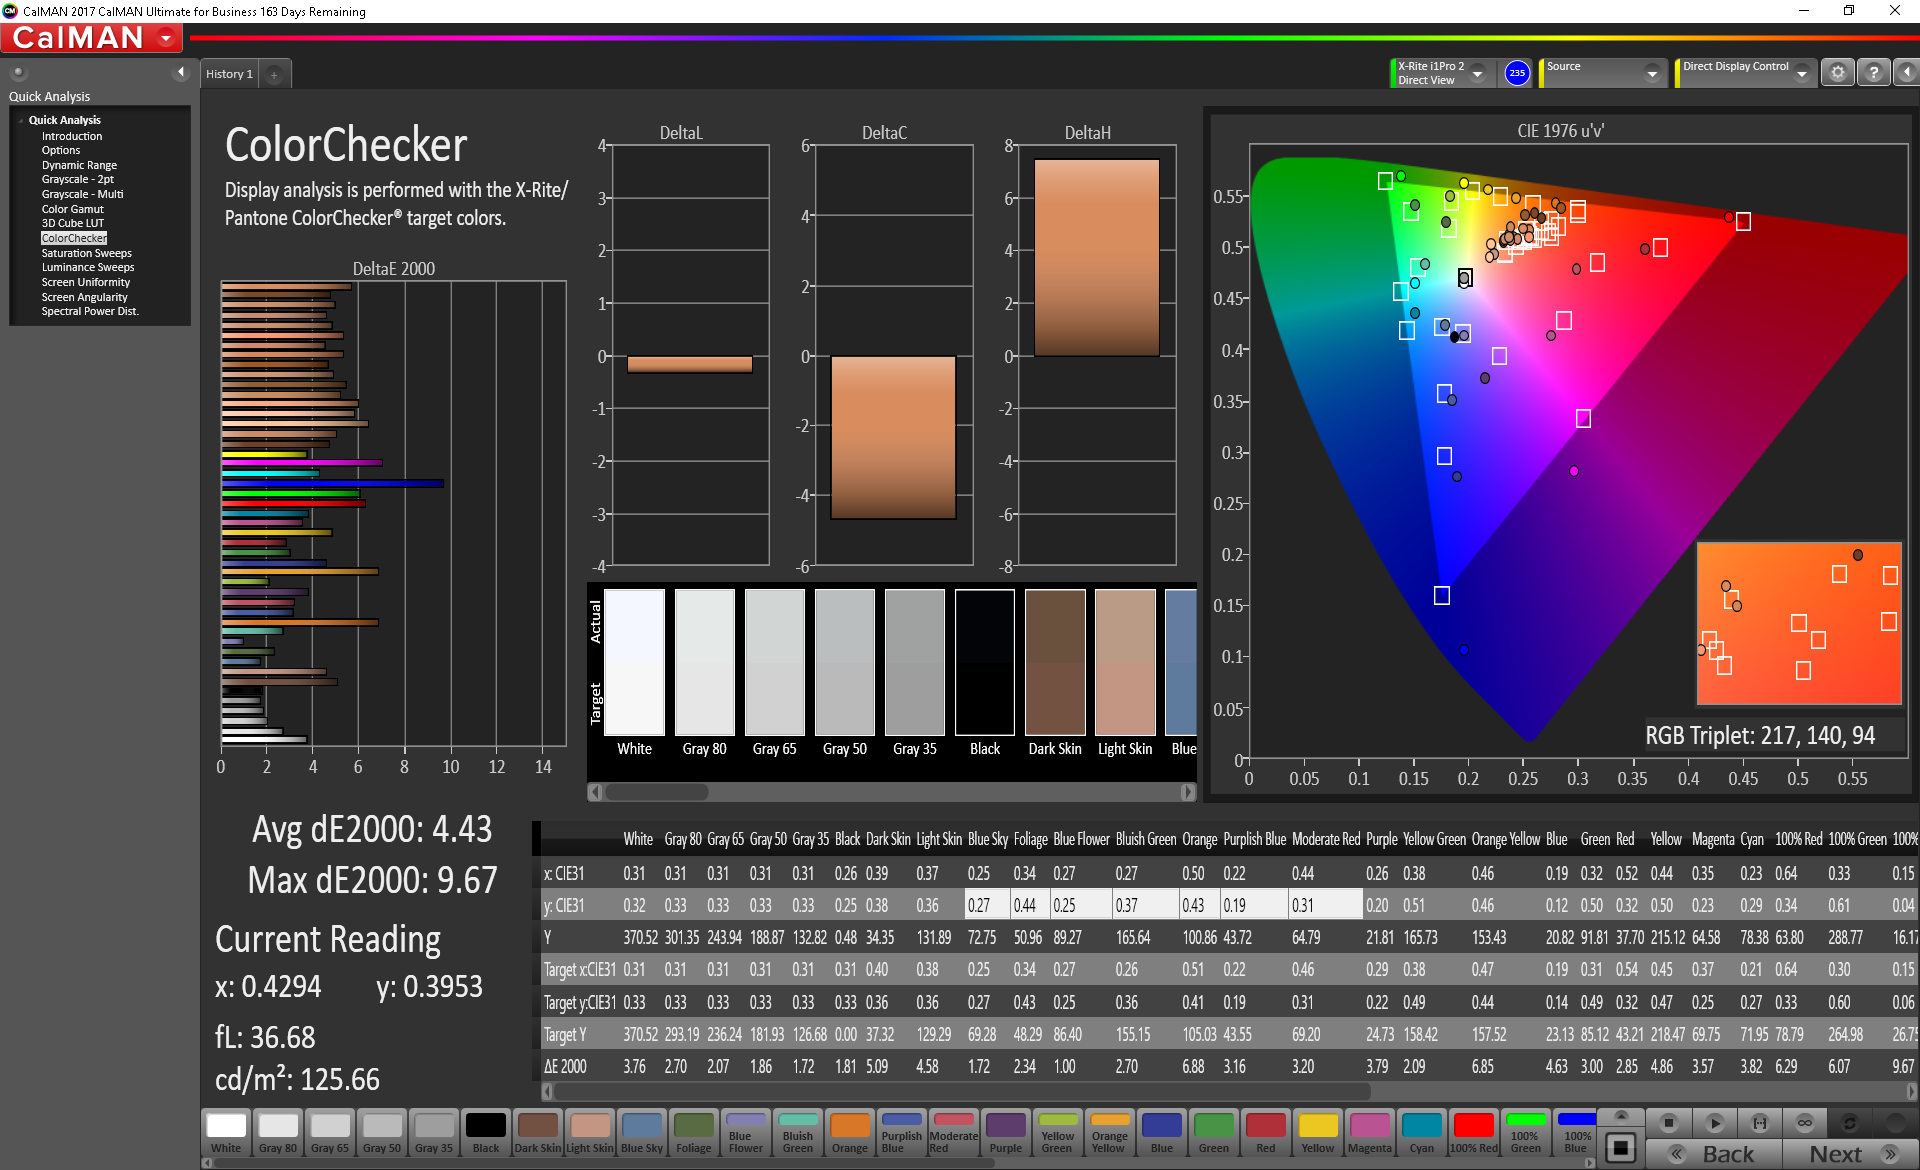
ΔE ColorChecker Calman: 9.86 | ∀{0.5-29.43 Ø4.82}
calibrated: 4.43
ΔE Greyscale Calman: 12.4 | ∀{0.09-98 Ø5.1}
80.5% sRGB (Argyll 1.6.3 3D)
52.5% AdobeRGB 1998 (Argyll 1.6.3 3D)
58.9% AdobeRGB 1998 (Argyll 3D)
81% sRGB (Argyll 3D)
58.7% Display P3 (Argyll 3D)
Gamma: 2.09
CCT: 11064 K
| Eurocom Q8 AU Optronics B173QTN01.0, Dell P/N WJGD4, TN LED, 17.3", 2560x1440 | MSI GS73VR 7RG ID: CMN1747, Name: Chi Mei N173HHE-G32, TN LED, 17.3", 1920x1080 | Asus GL703GE-ES73 Chi Mei CMN1747, TN, 17.3", 1920x1080 | Razer Blade Pro RZ09-0220 ID: AUO169D, Name: AU Optronics B173HAN01.6, IPS, 17.3", 1920x1080 | Alienware 17 R4 TN LED, 17.3", 2560x1440 | Aorus X7 v7 AU Optronics B173QTN01.4 (AUO1496), TN LED, 17.3", 2560x1440 | |
|---|---|---|---|---|---|---|
| Display | 41% | 39% | 10% | 3% | 8% | |
| Display P3 Coverage | 58.7 | 89.6 53% | 90.1 53% | 64 9% | 61.2 4% | 63 7% |
| sRGB Coverage | 81 | 100 23% | 99.8 23% | 89.7 11% | 82.9 2% | 87.1 8% |
| AdobeRGB 1998 Coverage | 58.9 | 86.9 48% | 83.1 41% | 64.9 10% | 60.5 3% | 63.7 8% |
| Response Times | -1% | 24% | -192% | -41% | 11% | |
| Response Time Grey 50% / Grey 80% * | 21.6 ? | 23.6 ? -9% | 11.6 ? 46% | 36.8 ? -70% | 30 ? -39% | 24 ? -11% |
| Response Time Black / White * | 9 ? | 8.4 ? 7% | 8.8 ? 2% | 37.2 ? -313% | 12.8 ? -42% | 6 ? 33% |
| PWM Frequency | 26040 ? | 26040 ? | ||||
| Screen | 20% | 36% | 32% | 16% | 15% | |
| Brightness middle | 367.9 | 350.9 -5% | 331.1 -10% | 367.4 0% | 402.3 9% | 375 2% |
| Brightness | 346 | 311 -10% | 312 -10% | 363 5% | 372 8% | 353 2% |
| Brightness Distribution | 84 | 79 -6% | 86 2% | 86 2% | 86 2% | 85 1% |
| Black Level * | 0.55 | 0.33 40% | 0.31 44% | 0.32 42% | 0.62 -13% | 0.58 -5% |
| Contrast | 669 | 1063 59% | 1068 60% | 1148 72% | 649 -3% | 647 -3% |
| Colorchecker dE 2000 * | 9.86 | 7.7 22% | 2.86 71% | 3.8 61% | 5.6 43% | 6.06 39% |
| Colorchecker dE 2000 max. * | 17.56 | 14.4 18% | 6.35 64% | 10.4 41% | 9.8 44% | 10.54 40% |
| Colorchecker dE 2000 calibrated * | 4.43 | 2.66 40% | ||||
| Greyscale dE 2000 * | 12.4 | 11.1 10% | 4.3 65% | 3.5 72% | 4.7 62% | 5.68 54% |
| Gamma | 2.09 105% | 2.11 104% | 2.268 97% | 2.18 101% | 2.14 103% | 2.3 96% |
| CCT | 11064 59% | 11813 55% | 7034 92% | 6467 101% | 7519 86% | 7998 81% |
| Color Space (Percent of AdobeRGB 1998) | 52.5 | 77.74 48% | 75 43% | 58.1 11% | 53.7 2% | 57 9% |
| Color Space (Percent of sRGB) | 80.5 | 100 24% | 100 24% | 89.3 11% | 82.2 2% | 87 8% |
| Total Average (Program / Settings) | 20% /
21% | 33% /
35% | -50% /
-2% | -7% /
6% | 11% /
13% |
* ... smaller is better
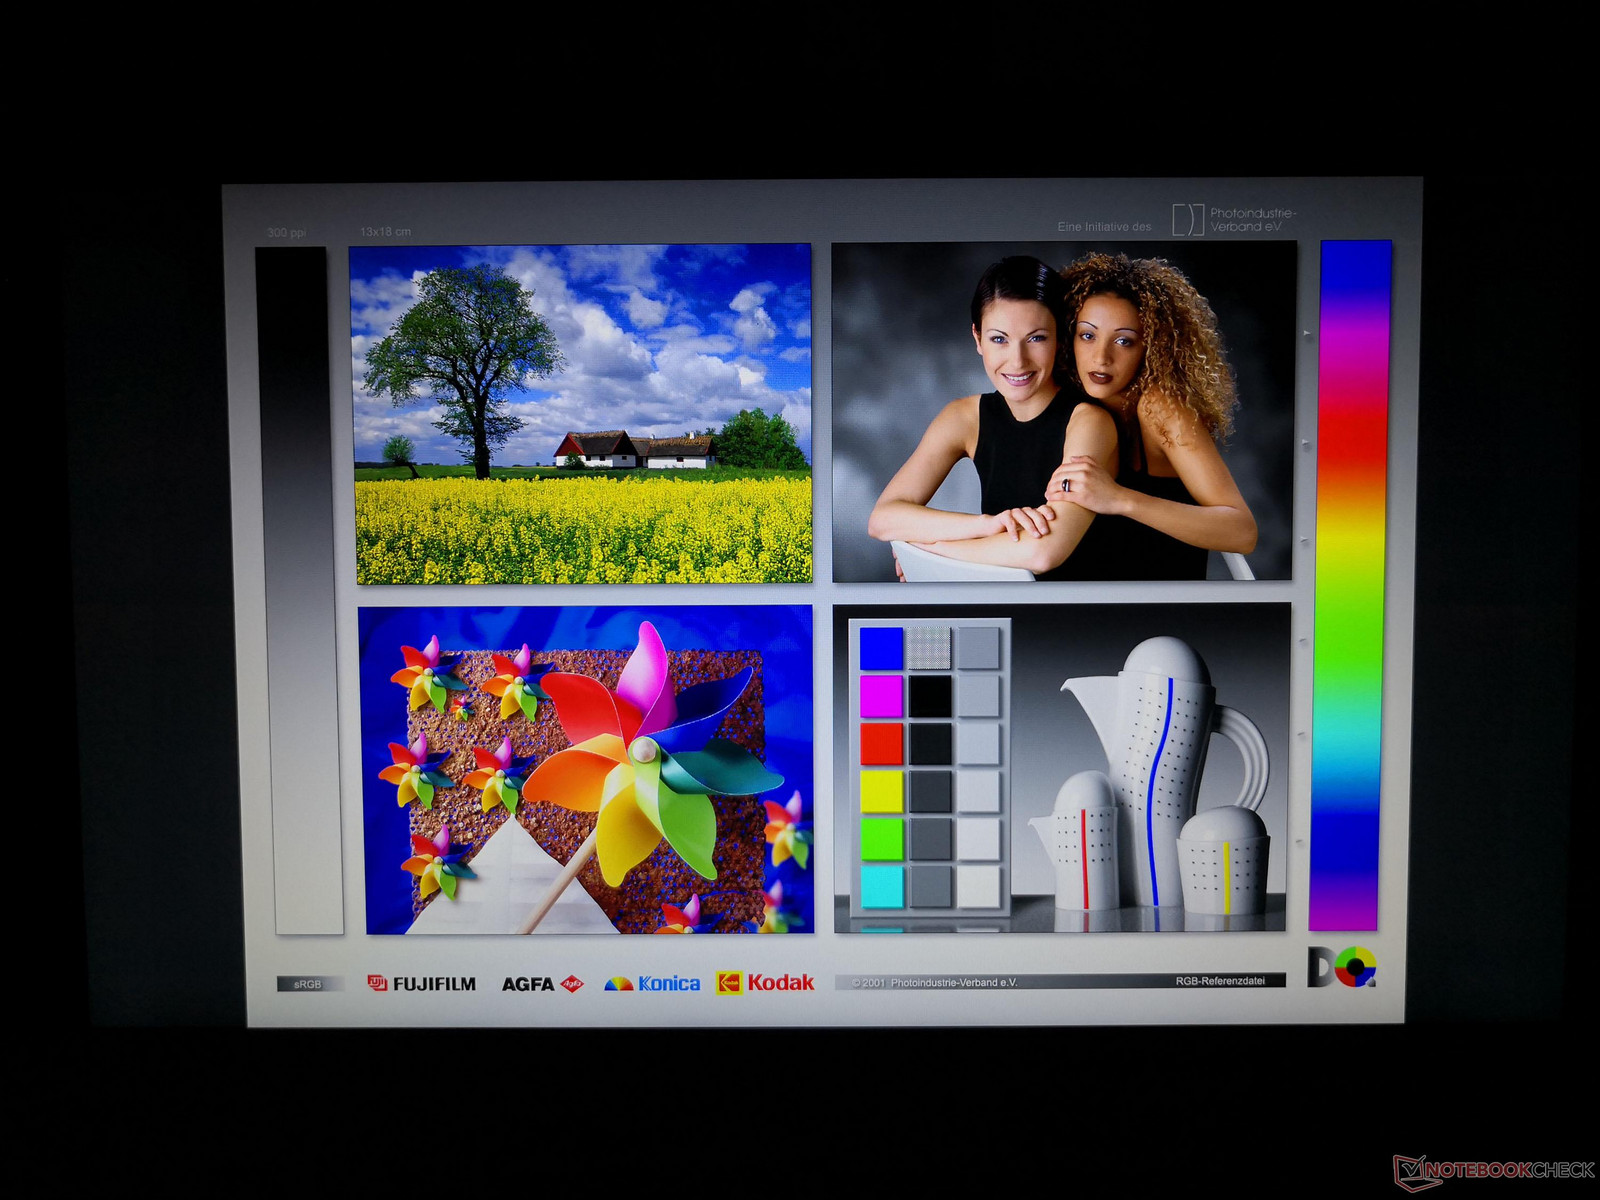
Color space is approximately 81 percent and 53 percent of the sRGB and AdobeRGB standards, respectively. Results are again not all that different from the QHD panels of the Alienware 17 R4 or Aorus X7 v7. Artists may want to consider the 4K UHD option for the Q8 since it offers full AdobeRGB coverage.
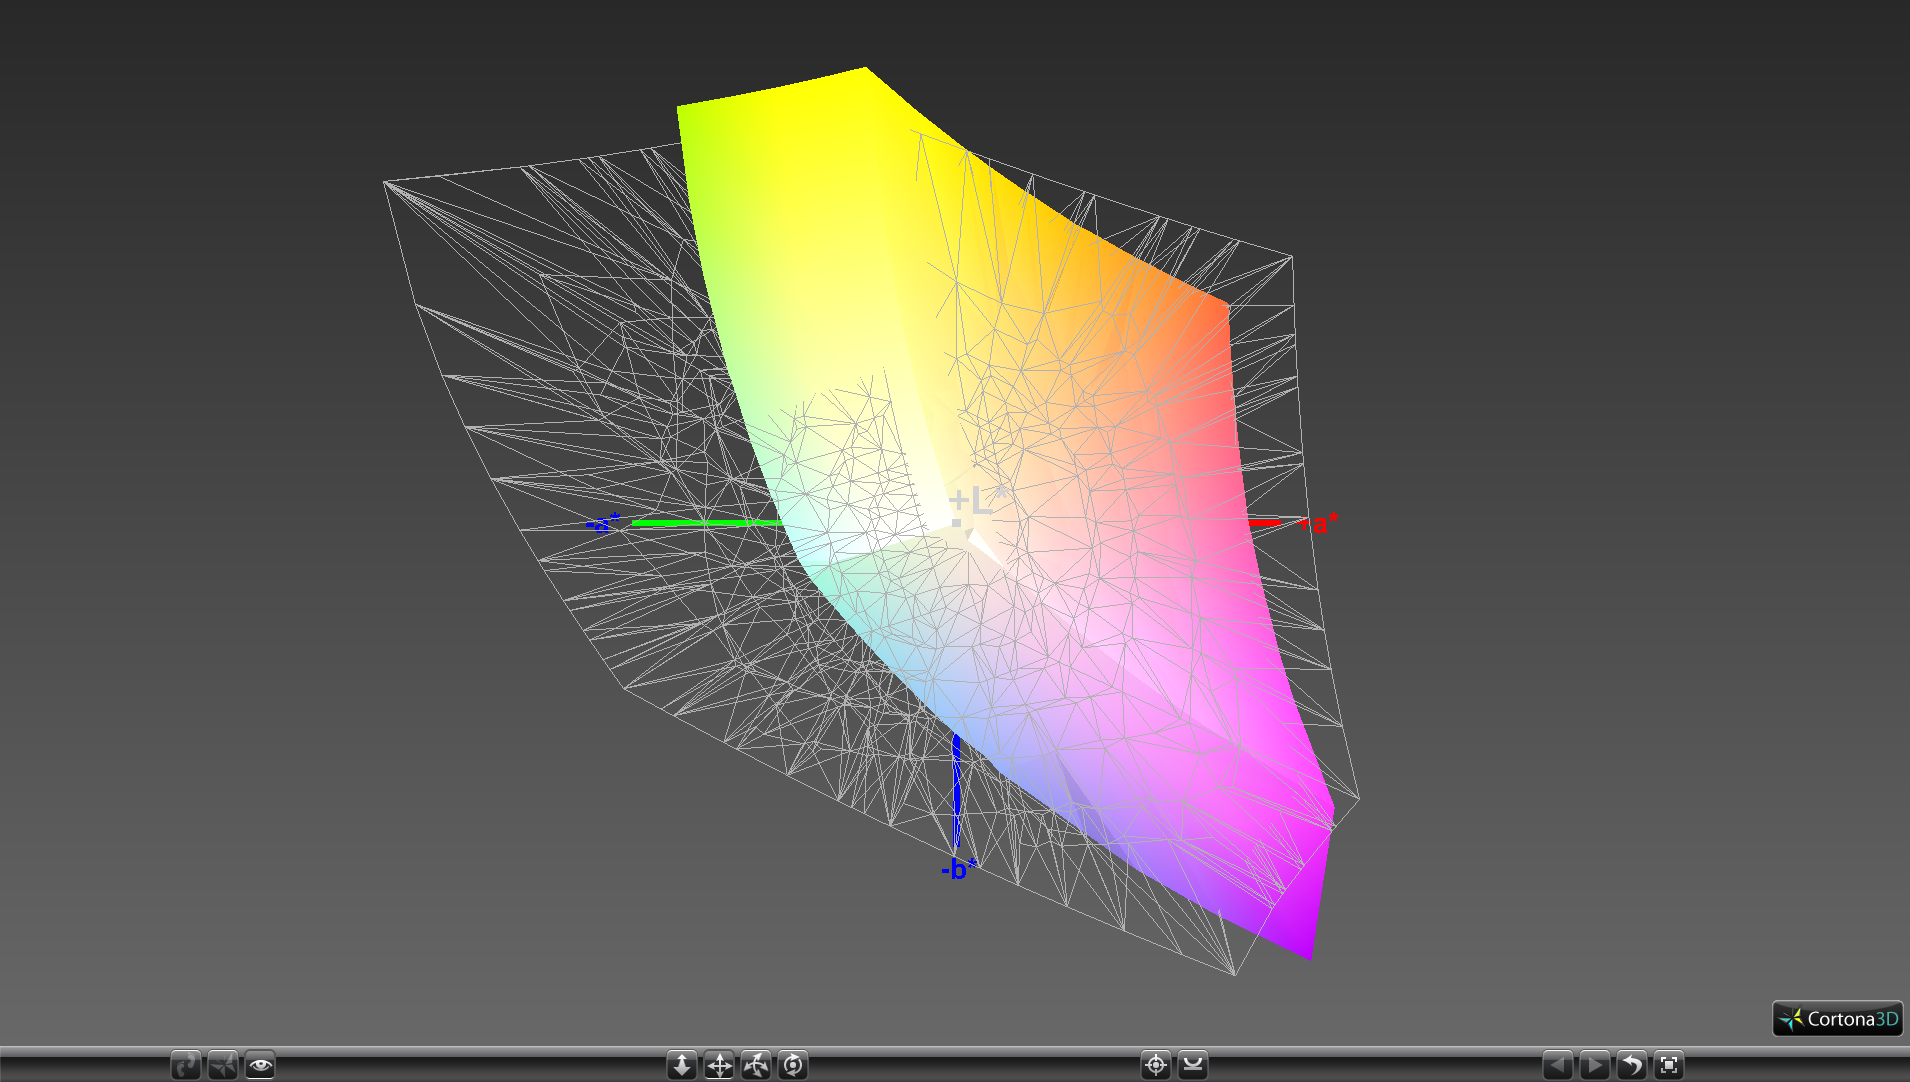
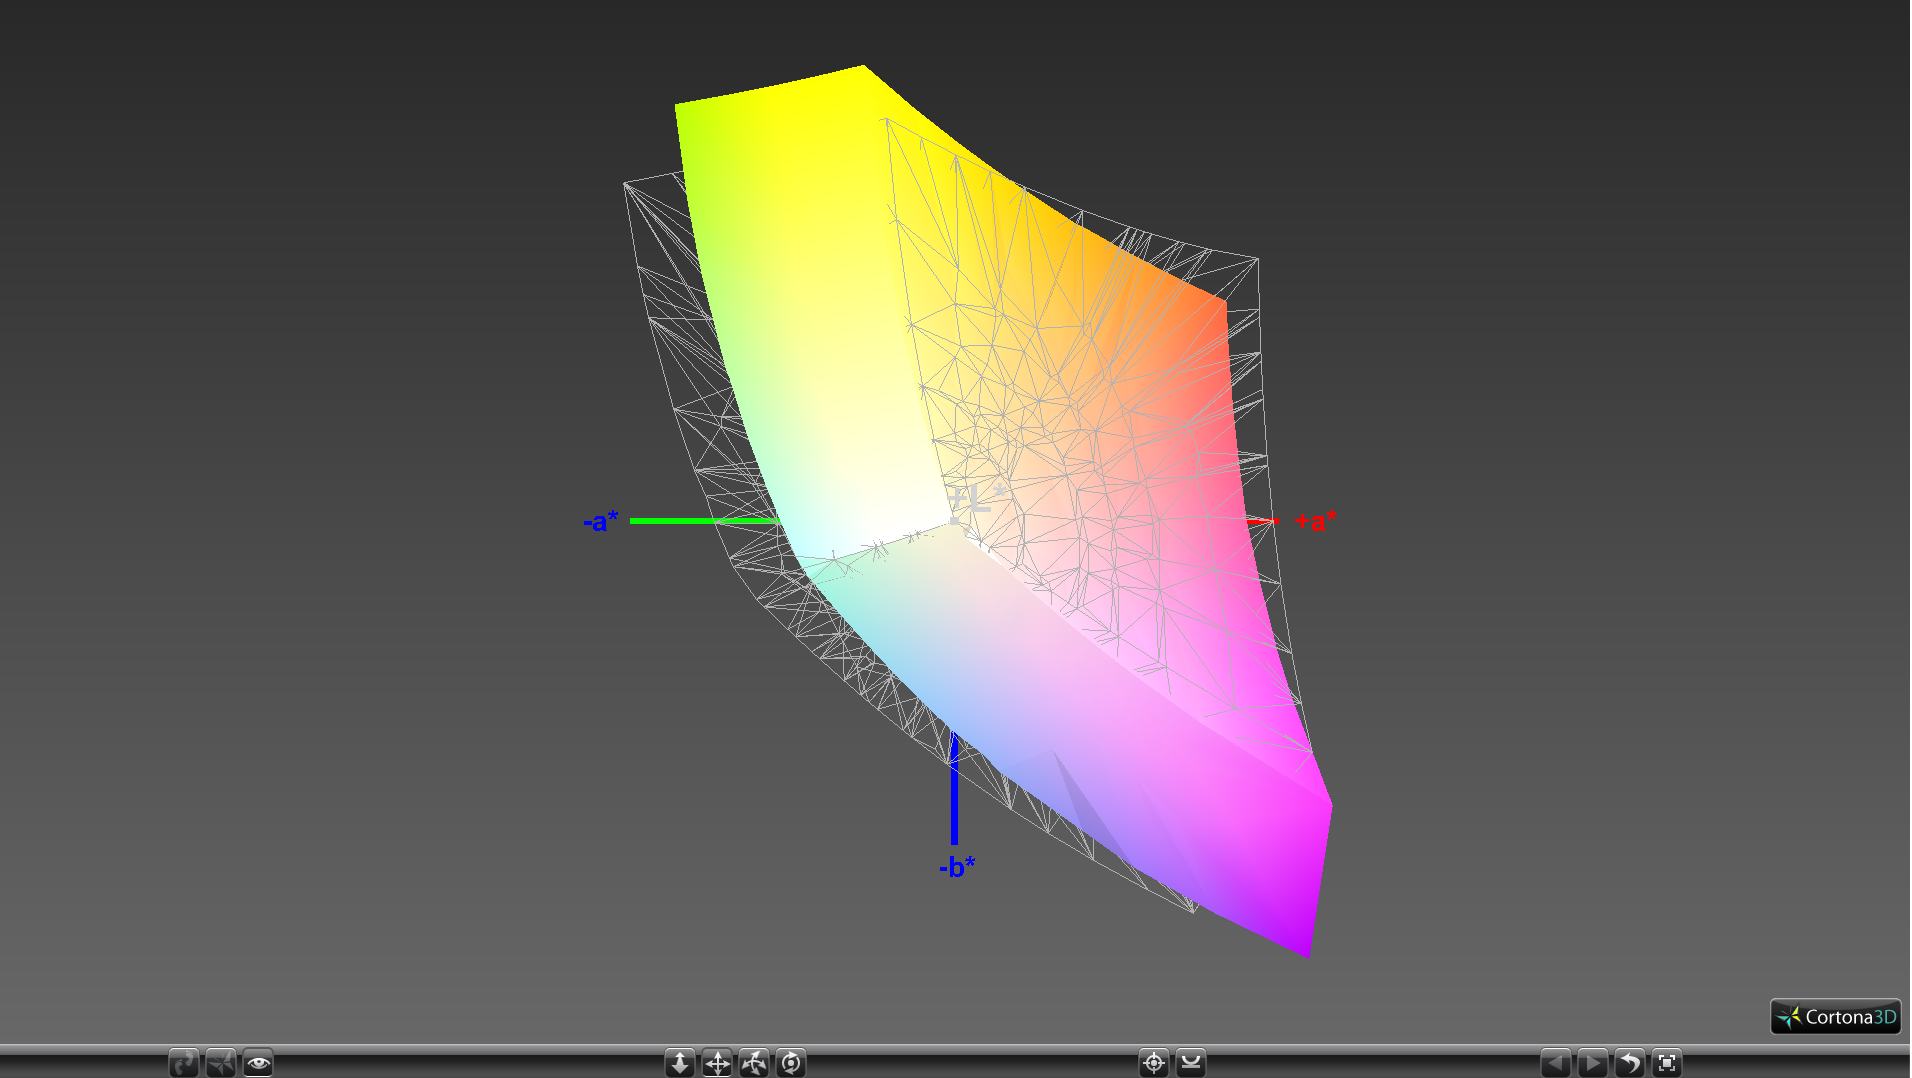
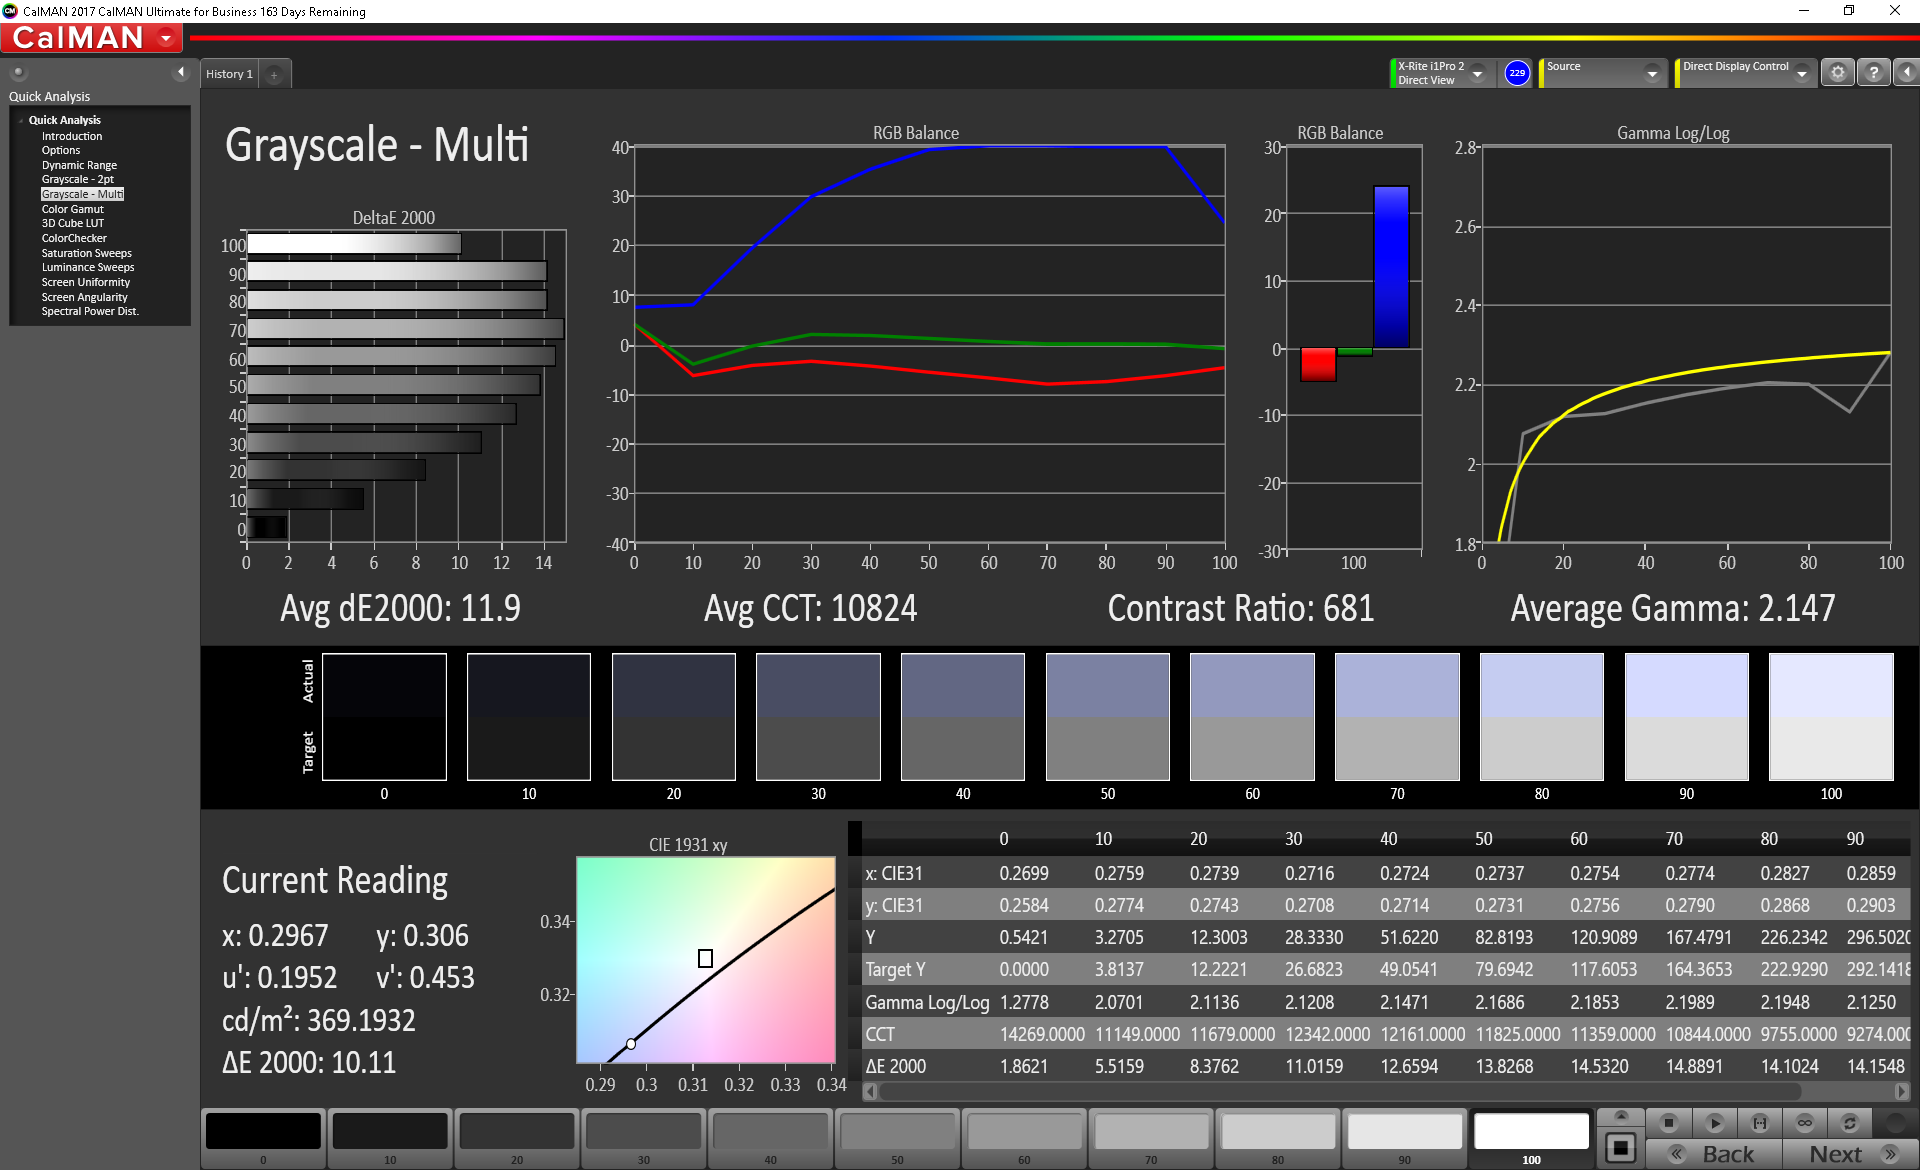
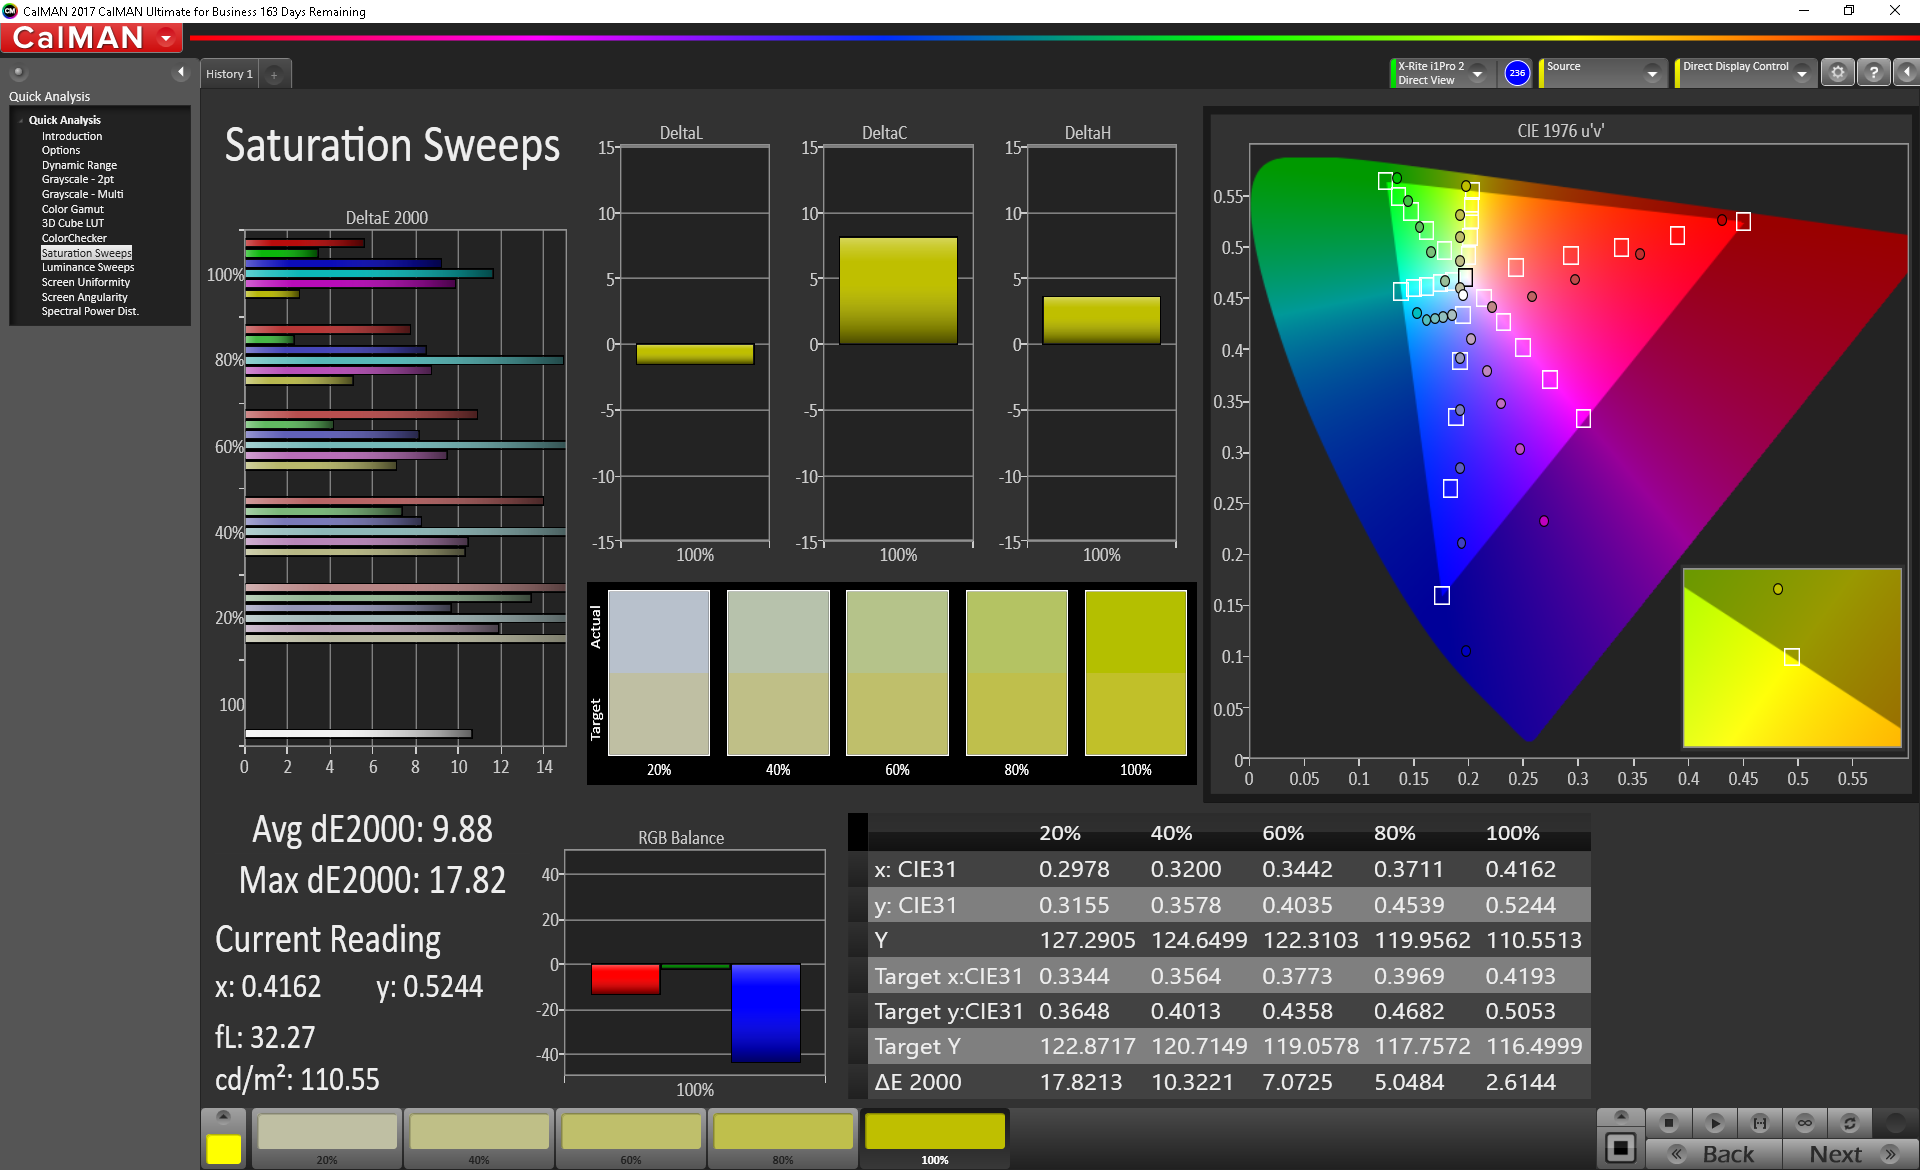
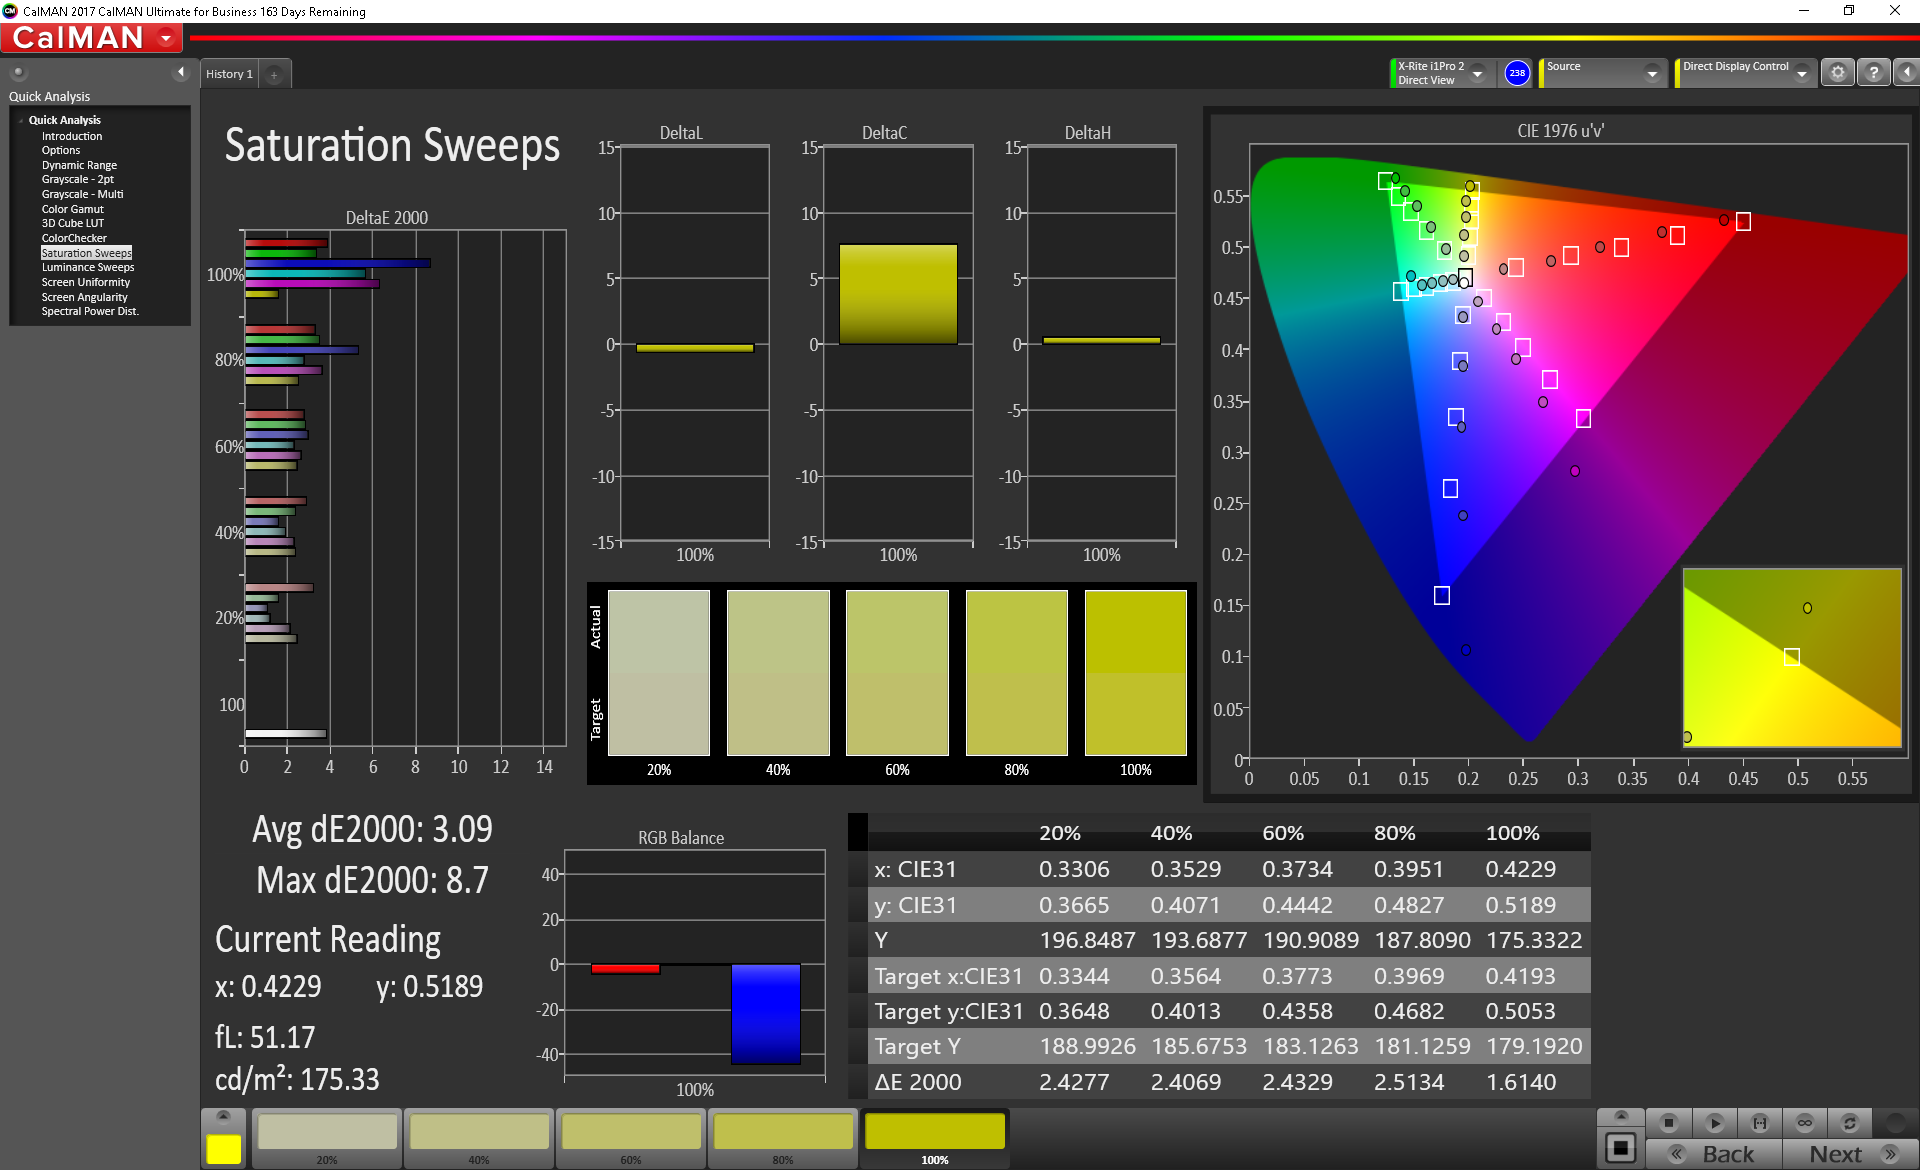
Spectrophotometer measurements reveal an overly cool color temperature with inaccurate grayscale and colors out of the box. A calibration addresses the issue and we highly recommend it for the best possible results. Colors are less accurate at higher saturation levels since sRGB coverage is incomplete.
Display Response Times
| ↔ Response Time Black to White | ||
|---|---|---|
| 9 ms ... rise ↗ and fall ↘ combined | ↗ 6.8 ms rise | 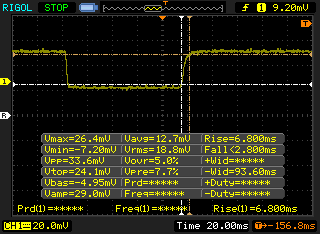 |
| ↘ 2.2 ms fall | ||
| The screen shows fast response rates in our tests and should be suited for gaming. In comparison, all tested devices range from 0.1 (minimum) to 240 (maximum) ms. » 23 % of all devices are better. This means that the measured response time is better than the average of all tested devices (20.5 ms). | ||
| ↔ Response Time 50% Grey to 80% Grey | ||
| 21.6 ms ... rise ↗ and fall ↘ combined | ↗ 12.4 ms rise | 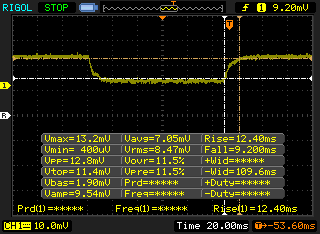 |
| ↘ 9.2 ms fall | ||
| The screen shows good response rates in our tests, but may be too slow for competitive gamers. In comparison, all tested devices range from 0.165 (minimum) to 636 (maximum) ms. » 31 % of all devices are better. This means that the measured response time is better than the average of all tested devices (32 ms). | ||
Screen Flickering / PWM (Pulse-Width Modulation)
| Screen flickering / PWM not detected | 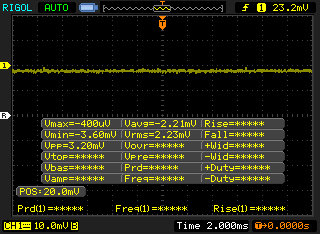 | ||
In comparison: 53 % of all tested devices do not use PWM to dim the display. If PWM was detected, an average of 8323 (minimum: 5 - maximum: 343500) Hz was measured. | |||
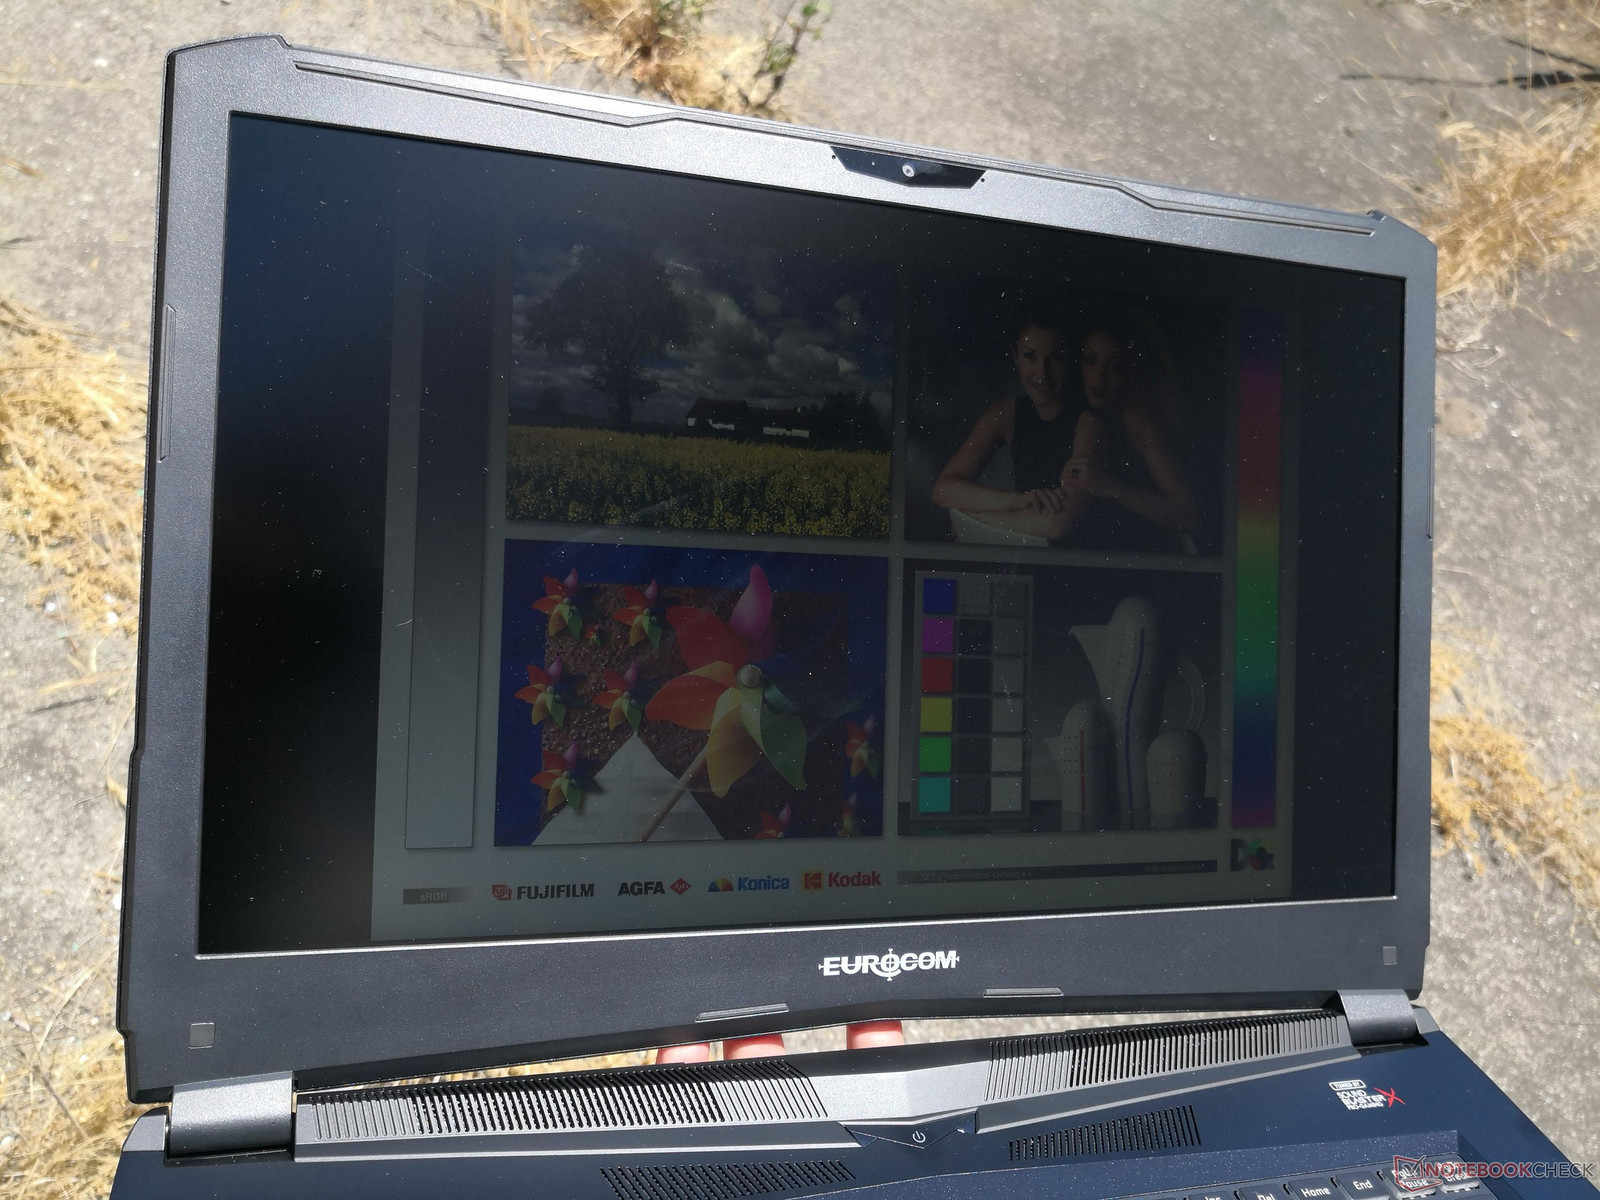
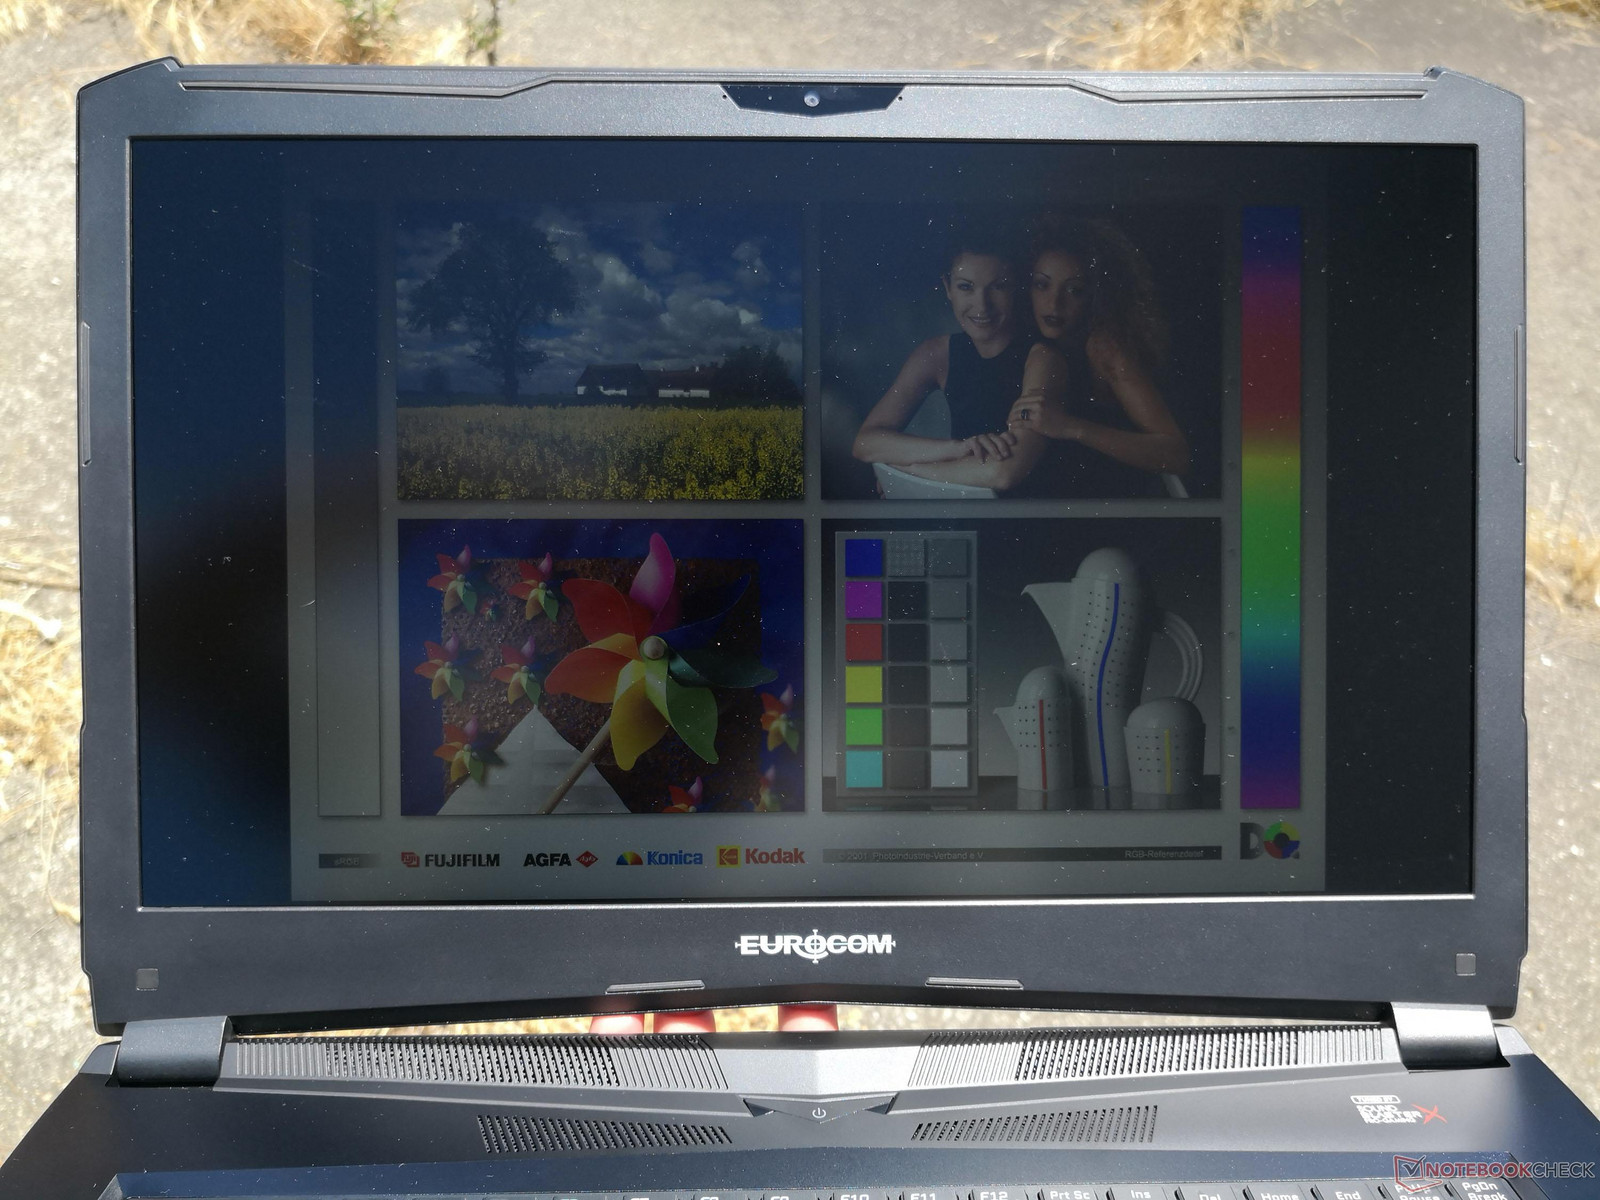
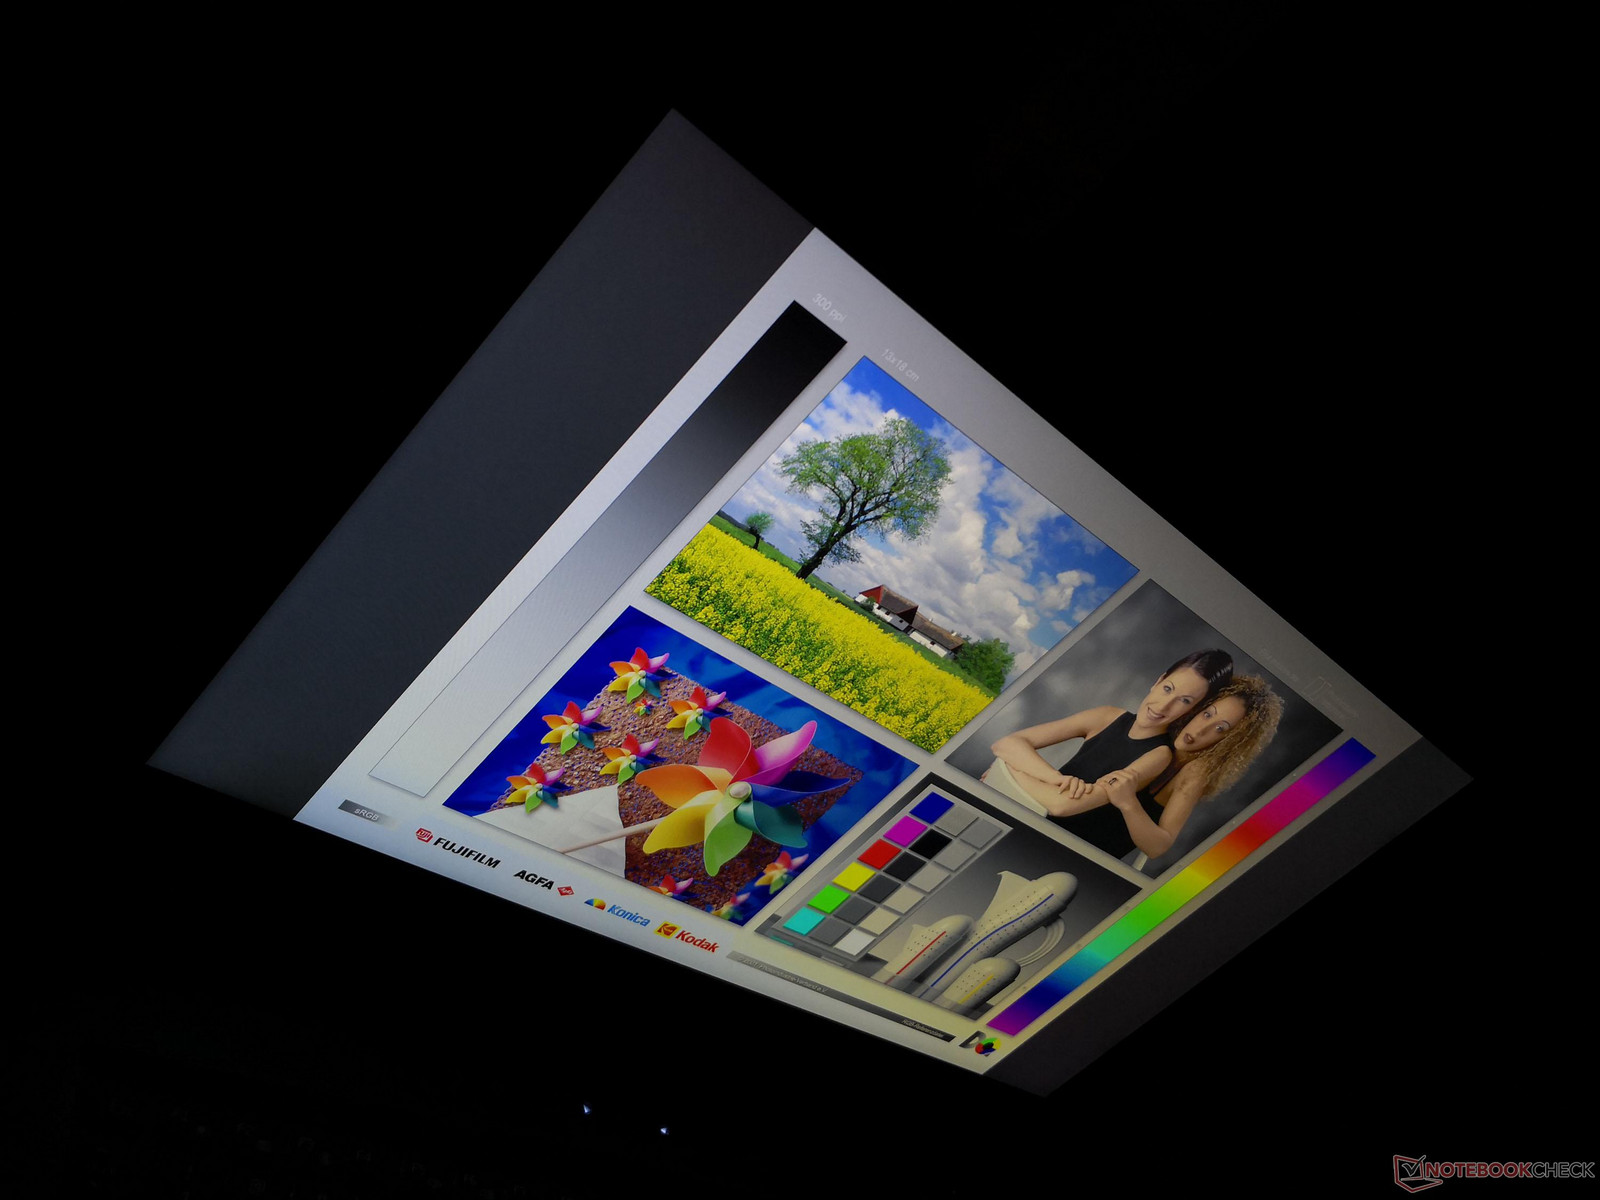
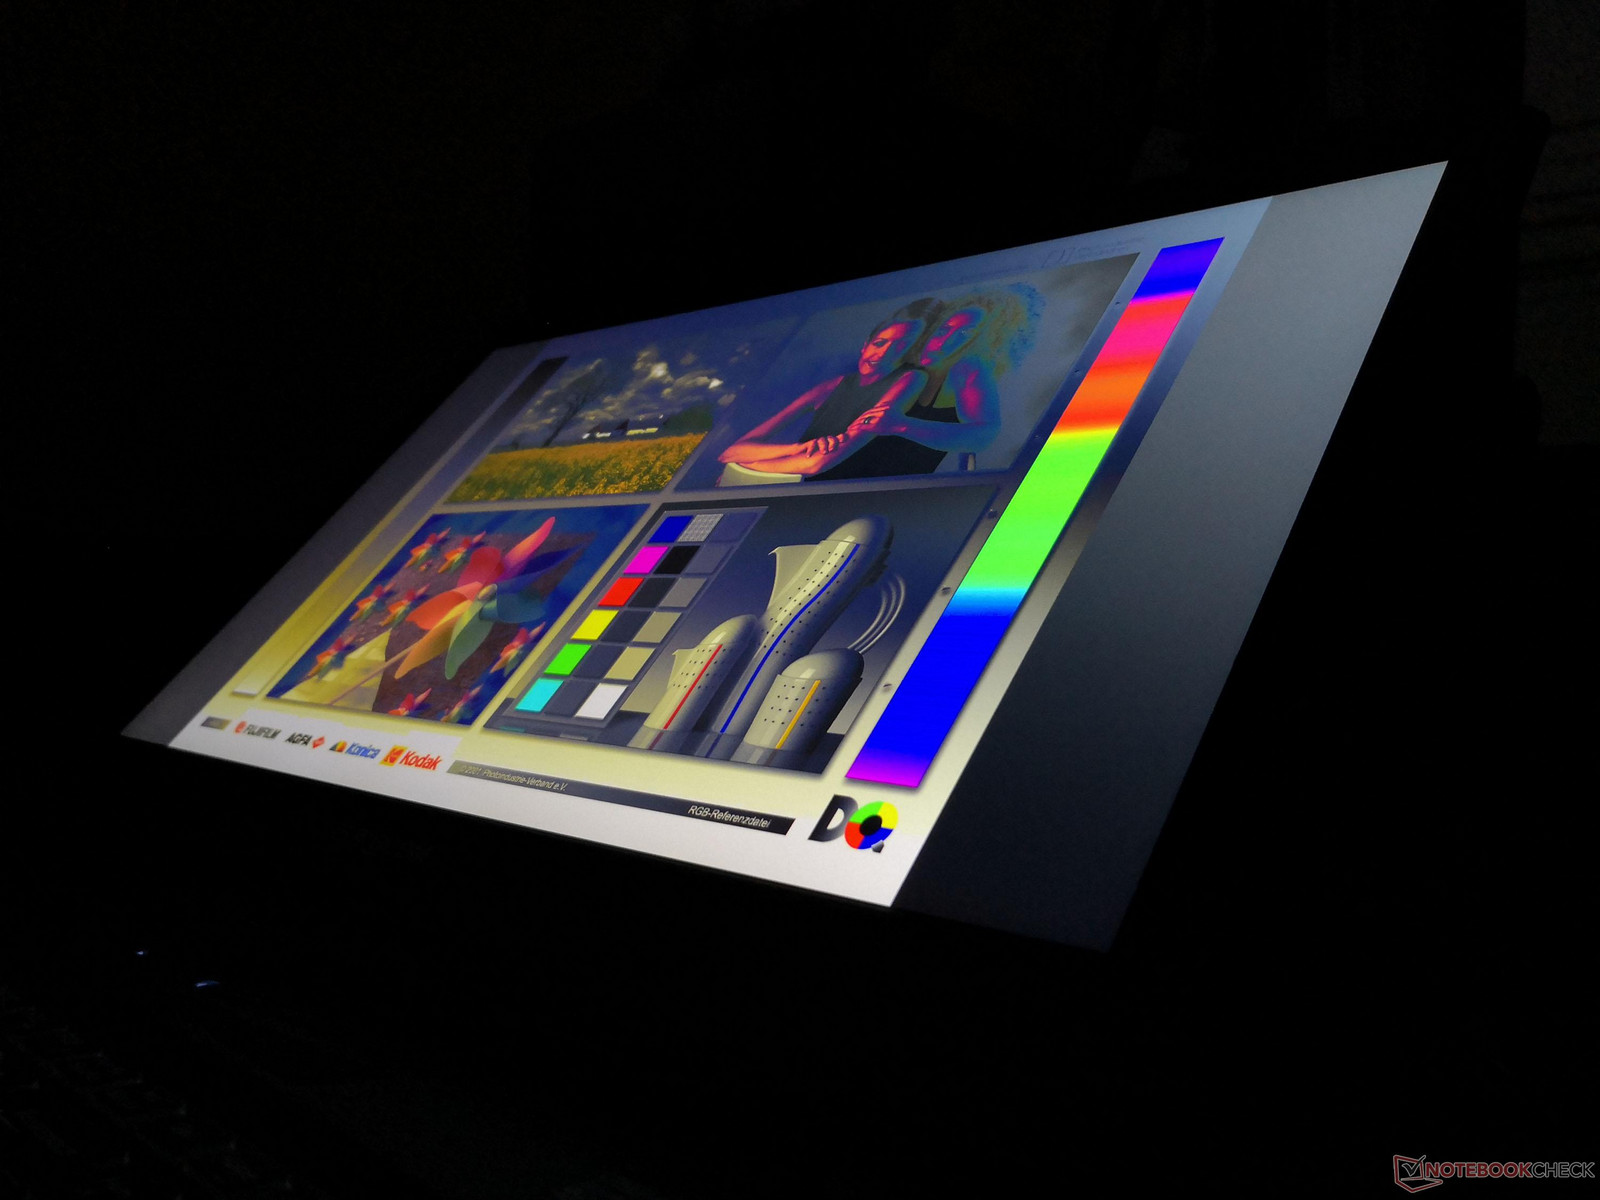
Outdoor visibility is average when under shade since glare is not a huge issue with the matte panel. Direct sunlight or overcast will still overwhelm the display and wash out colors.
Performance
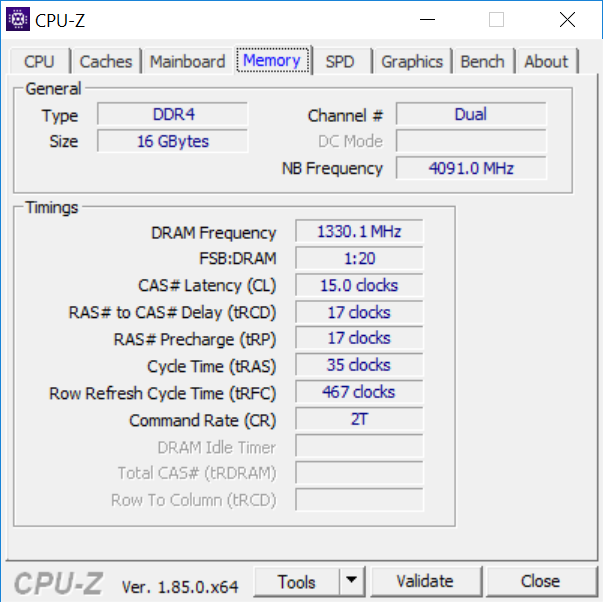
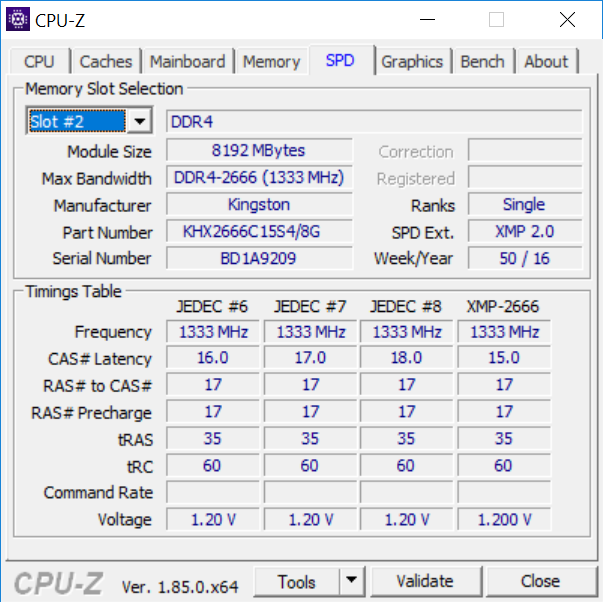
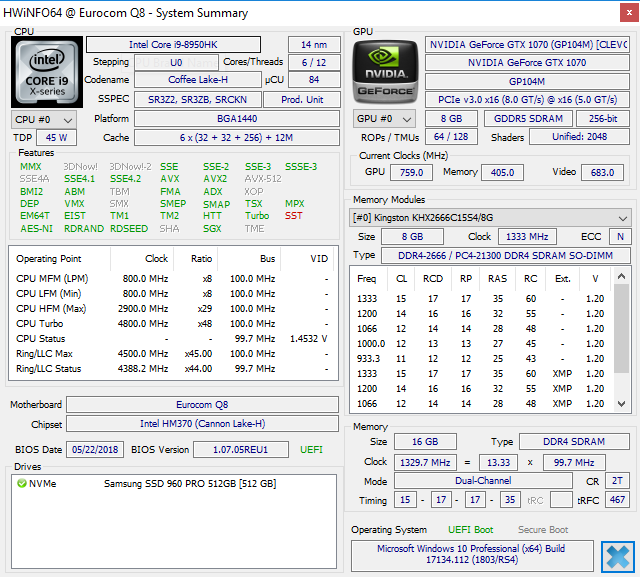
As of this writing, the Q8 is only shipping with the Core i9-8950HK CPU and GTX 1070 GPU in contrast to the typically wide selection of processors on most larger Eurocom models. RAM, display, and storage remain highly configurable.
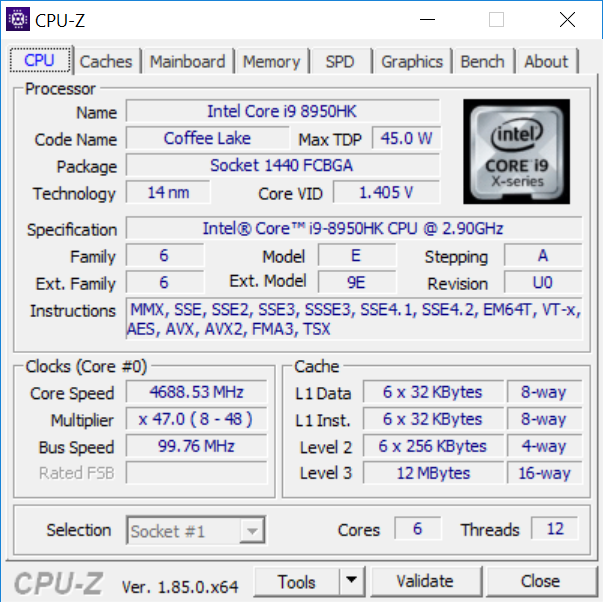
Processor
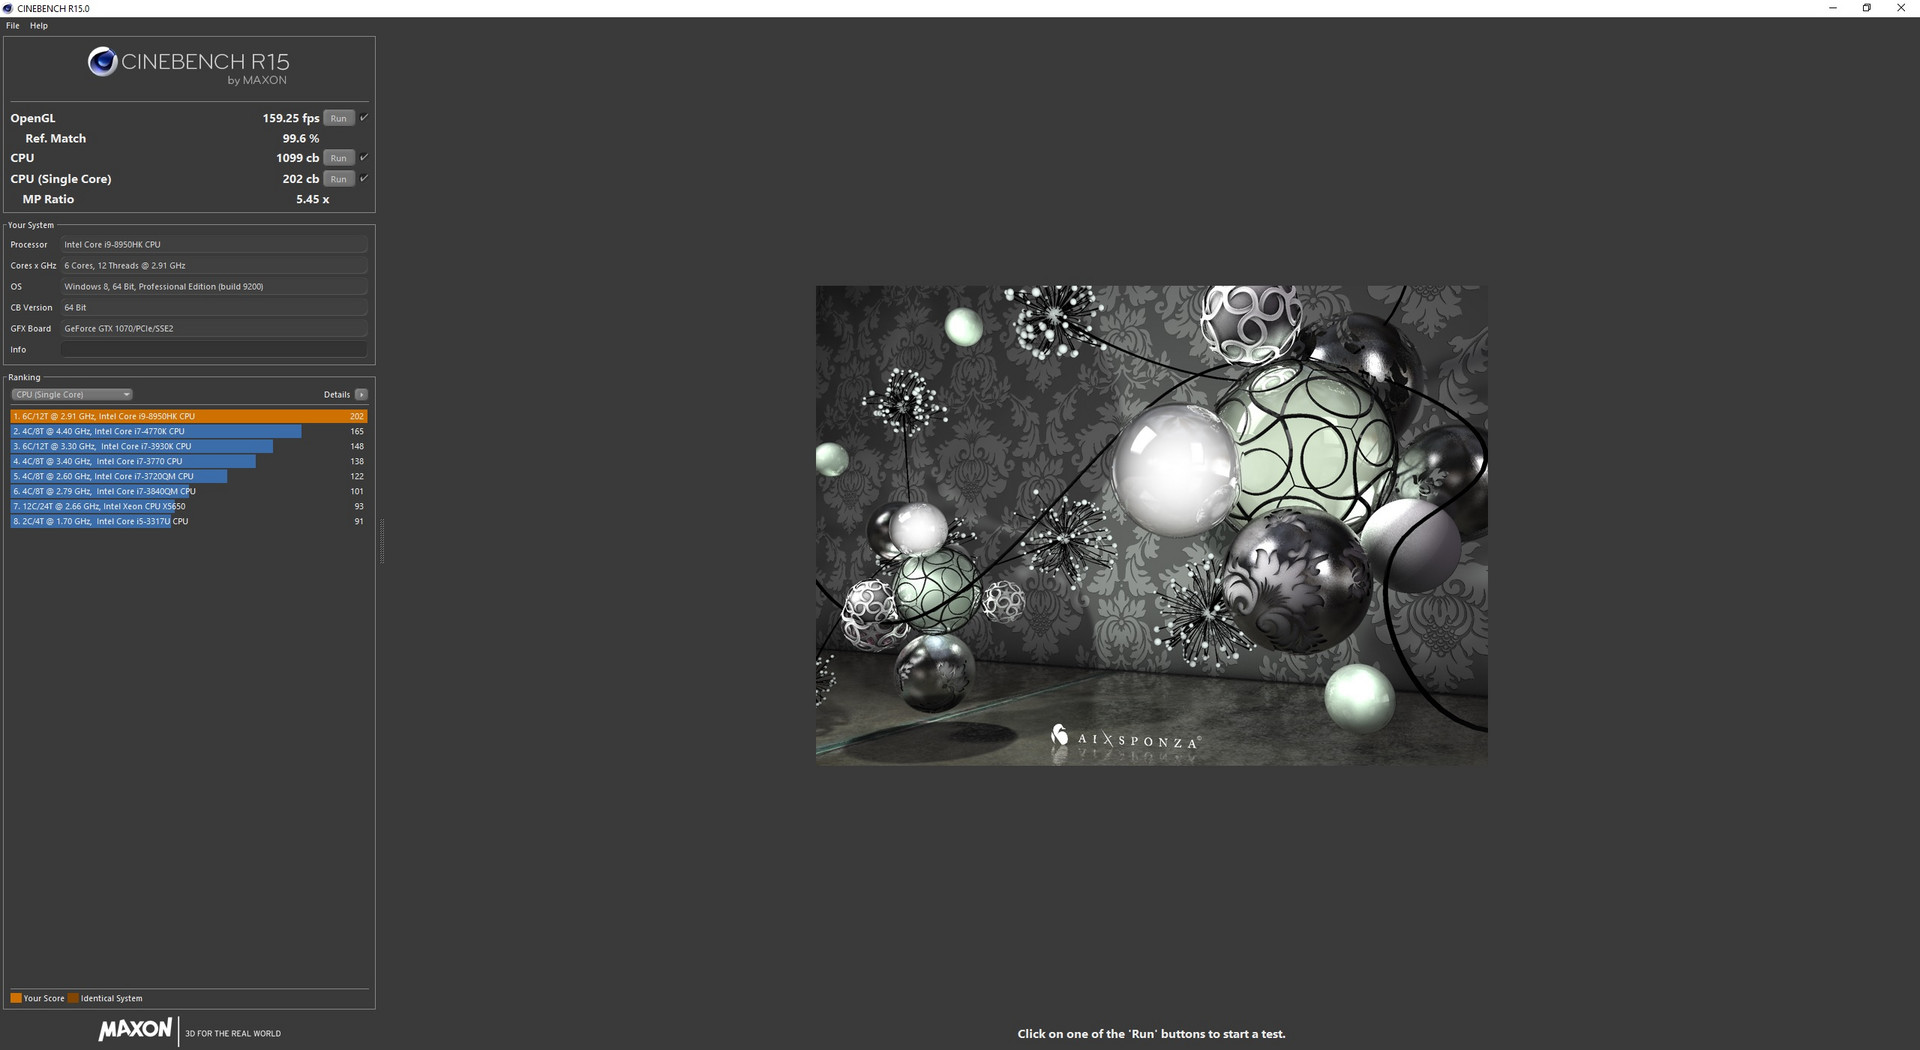
CPU performance is about 30 to 50 percent faster than the i7-7700HQ in the Q5 depending on the number of threads. Unfortunately, the i9-8950HK in the Q8 is performing slower than the average i9-8950HK in our database. This same CPU in the MSI GT75, for example, scores about 25 percent higher than the Q8 in CineBench R15 Multi-Thread (1378 vs. 1099 points).
Results become even worse when testing the performance sustainability of the CPU in the Q8. Running CineBench R15 Multi-Thread in a loop leads to a rough 15 percent drop in score from the initial 1099 points as shown below. Thus, not only is the CPU already slower than the same processor in other high-end notebooks, but it is unable to maintain Turbo Boost for extended periods.
More technical information and benchmarks on the Core i9-8950HK can be found here.
System Performance
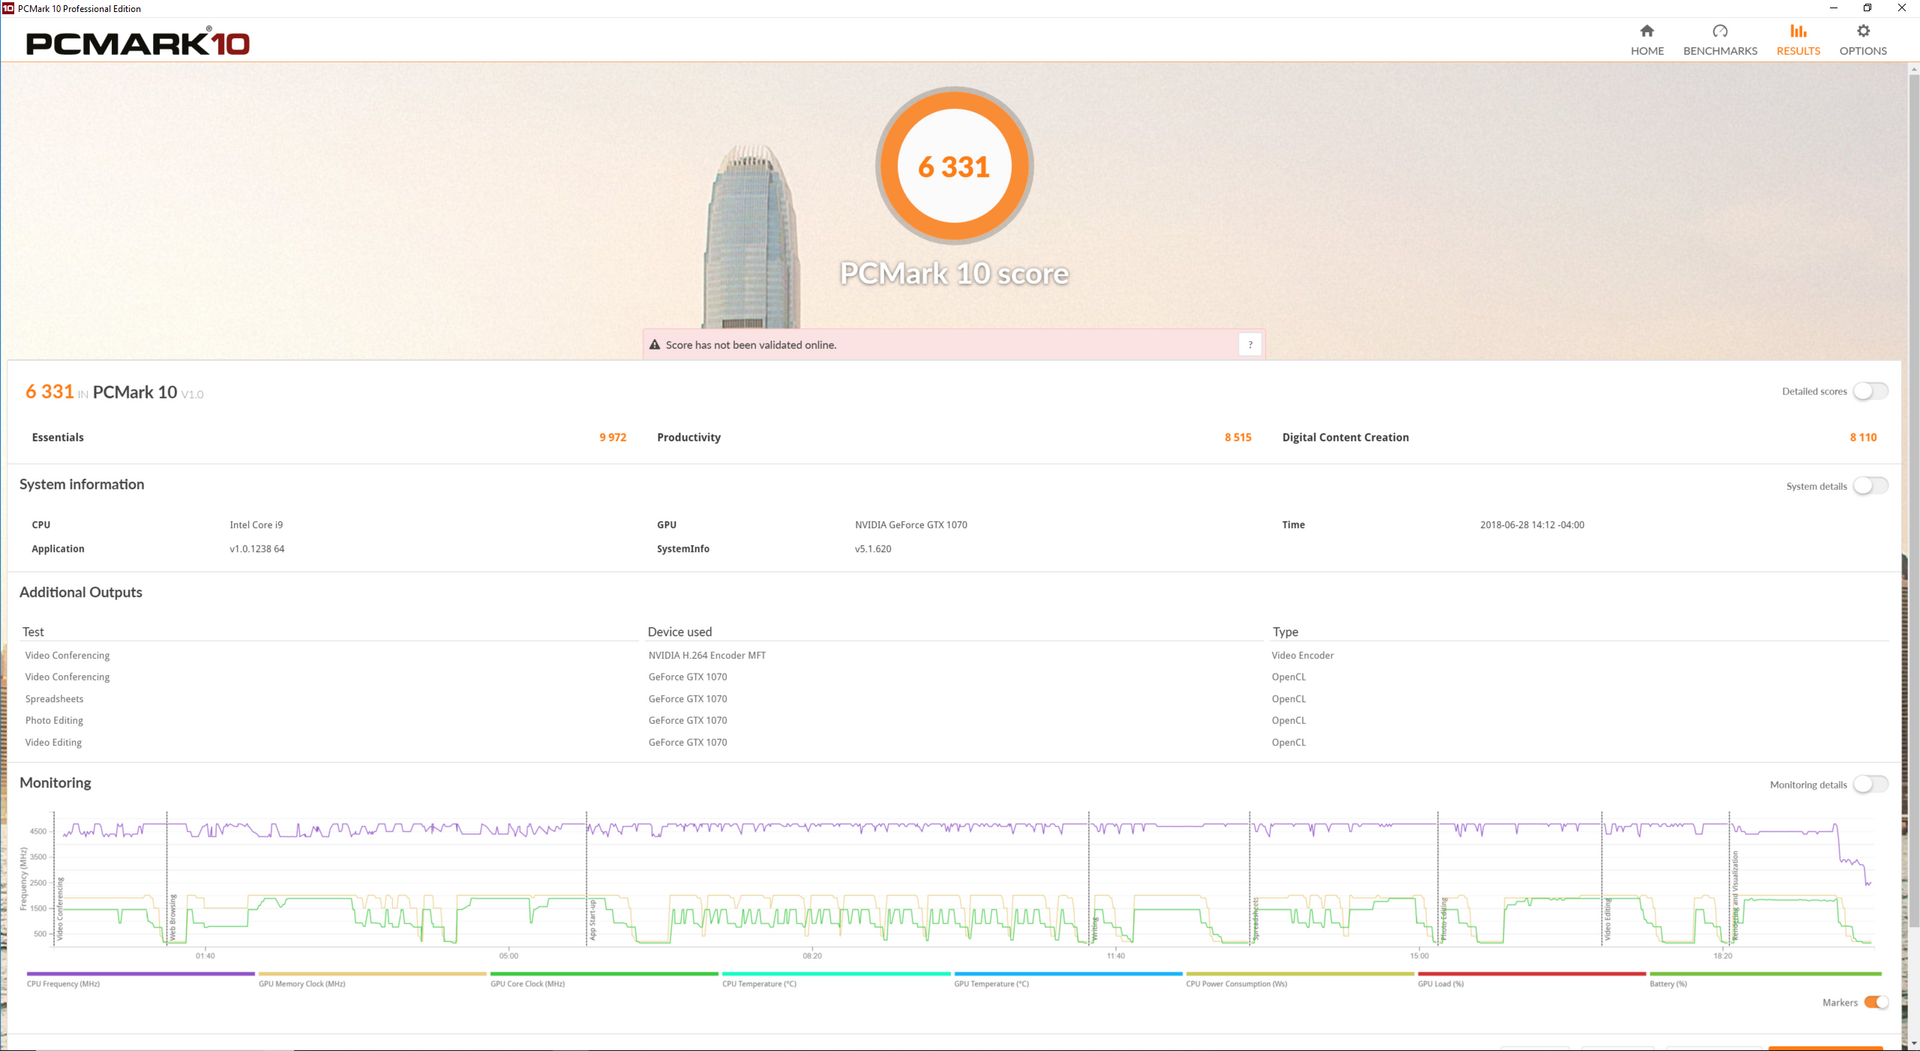
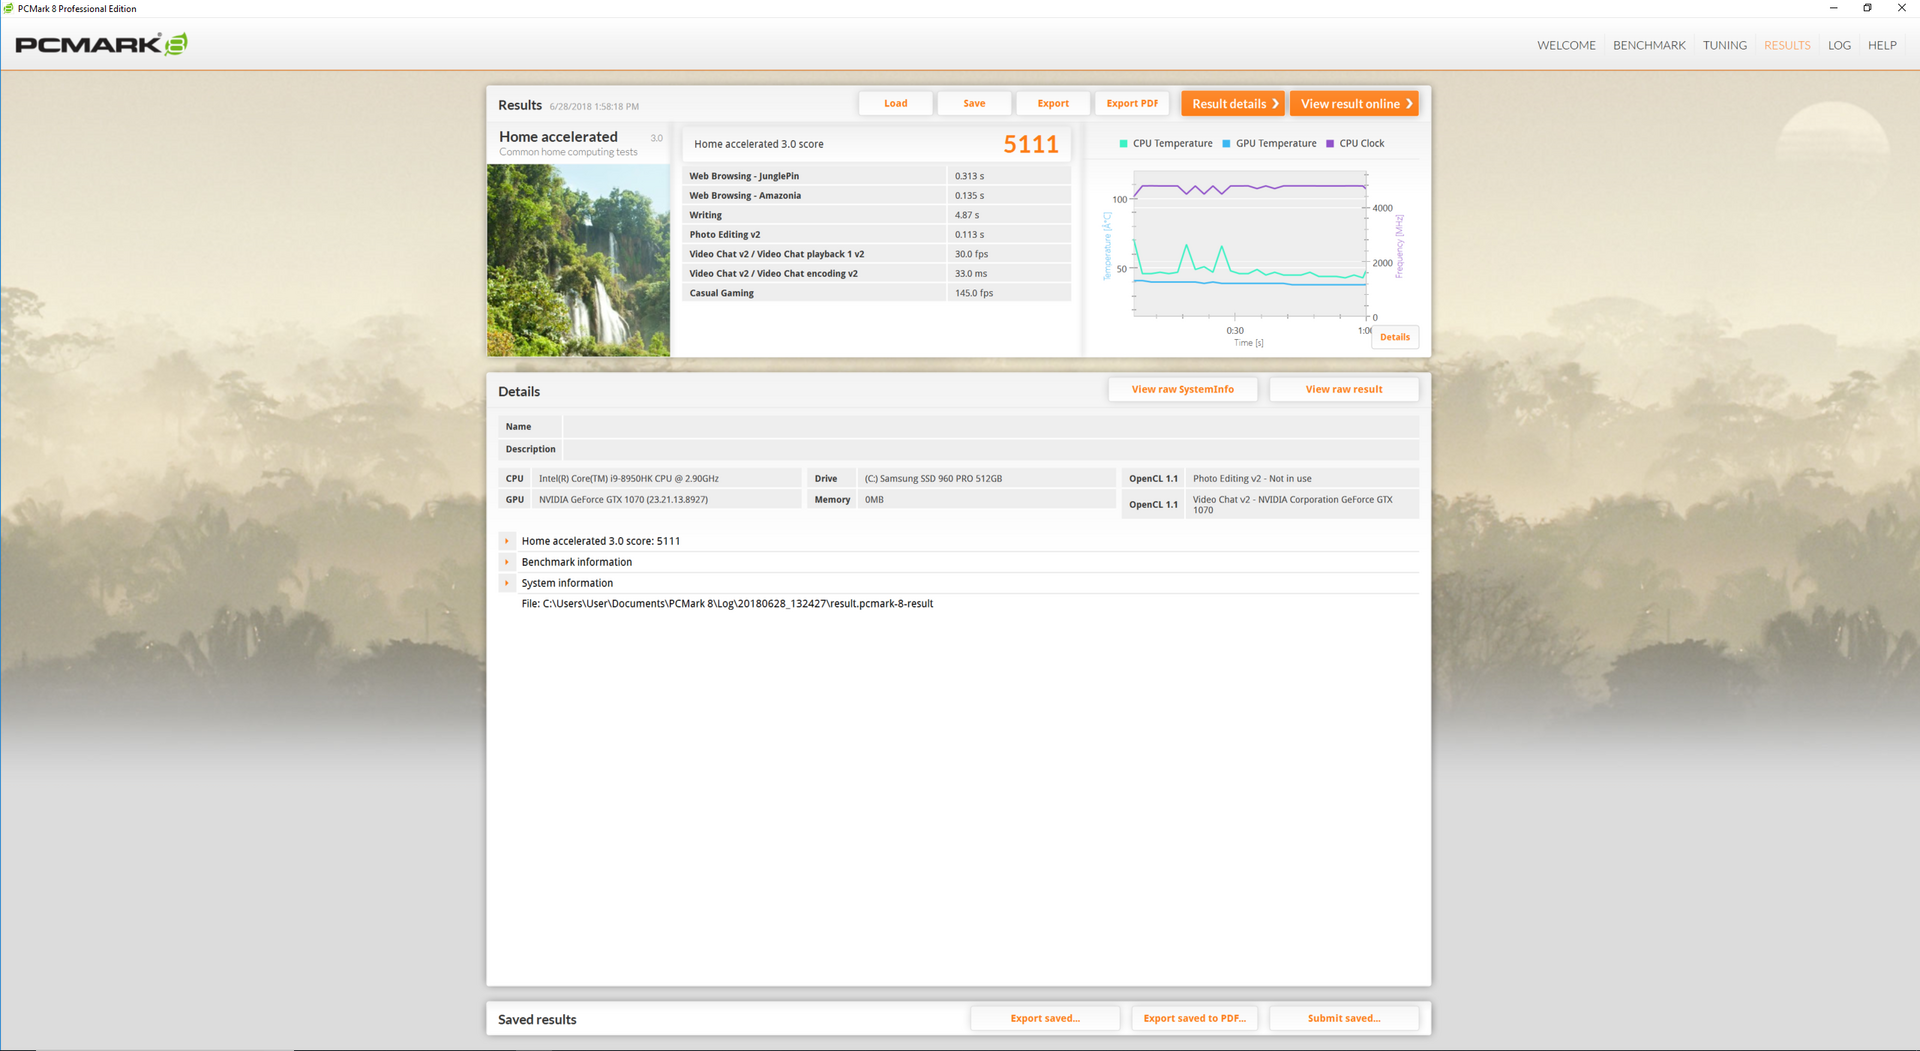
PCMark scores are higher than many of its competitors due in part to the higher number of physical cores for the i9-8950HK when compared to the previous generation of Intel CPUs. Results are impressively very close to the Eurocom Sky X4C equipped with the i7-8700K.
Our test unit exhibits no hardware or software issues. Nonetheless, wake-from-Sleep is unusually slow. It can sometimes take upwards of 6 to 10 seconds before the lock screen will appear after lifting the lid from a Sleep state.
| PCMark 10 - Score | |
| Eurocom Sky X4C | |
| Eurocom Q8 | |
| Aorus X7 v7 | |
| HP Omen X 17-ap0xx | |
| MSI GS73VR 7RG | |
| Razer Blade Pro RZ09-0220 | |
| Apple MacBook Pro 15 2017 (2.9 GHz, 560) | |
| PCMark 8 - Home Score Accelerated v2 | |
| Eurocom Sky X4C | |
| HP Omen X 17-ap0xx | |
| Eurocom Q8 | |
| Aorus X7 v7 | |
| Alienware 17 R4 | |
| MSI GS73VR 7RG | |
| Razer Blade Pro RZ09-0220 | |
| Apple MacBook Pro 15 2017 (2.9 GHz, 560) | |
| PCMark 8 Home Score Accelerated v2 | 5111 points | |
| PCMark 10 Score | 6331 points | |
Help | ||
Storage Devices
Three internal storage bays (1x 2.5-inch SATA III, 2x PCIe x4 M.2 2280) are available with RAID 0/1 options. In comparison, other super-thin competitors like the Razer Blade Pro or MSI GS73VR have just 2x internal storage bays each. Note that an installed 2.5-inch drive should be limited to 7 mm in thickness as 9.5 mm drives may not fit.
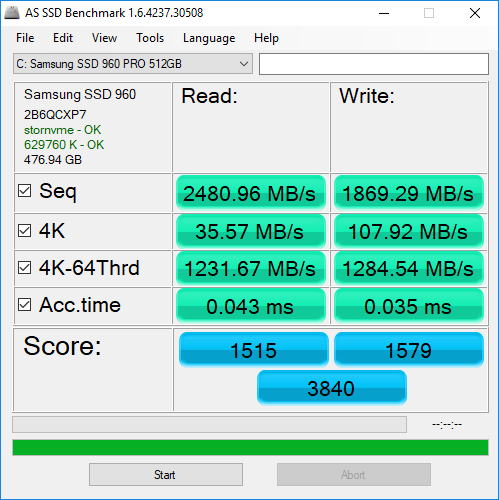
The 512 GB Samsung SSD 960 Pro in our test unit returns excellent transfer rates. Sequential write performance in particular is noticeably faster than the SK Hynix and Toshiba NVMe SSDs found in the Alienware 17 and Dell XPS 15 9570, respectively.
See our table of HDDs and SSDs for more benchmark comparisons.
| Eurocom Q8 Samsung SSD 960 Pro 512 GB m.2 | MSI GS73VR 7RG Samsung SSD PM871 MZNLN512HMJP | Razer Blade Pro RZ09-0220 Samsung SSD PM951 MZVLV256HCHP | Alienware 17 R4 SK Hynix PC300 NVMe 512 GB | Aorus X7 v7 Samsung SM961 MZVPW256HEGL | |
|---|---|---|---|---|---|
| AS SSD | -52% | -36% | -44% | -7% | |
| Copy Game MB/s | 958 | 381.5 -60% | 724 -24% | 574 -40% | 758 -21% |
| Copy Program MB/s | 406.7 | 229.8 -43% | 228.3 -44% | 446.1 10% | 327.2 -20% |
| Copy ISO MB/s | 1596 | 423.5 -73% | 1193 -25% | 1227 -23% | 1504 -6% |
| Score Total | 3840 | 1064 -72% | 1951 -49% | 2072 -46% | 3668 -4% |
| Score Write | 1579 | 417 -74% | 406 -74% | 858 -46% | 1021 -35% |
| Score Read | 1515 | 421 -72% | 1056 -30% | 831 -45% | 1803 19% |
| Access Time Write * | 0.035 | 0.032 9% | 0.034 3% | 0.123 -251% | 0.031 11% |
| Access Time Read * | 0.043 | 0.051 -19% | 0.06 -40% | 0.042 2% | 0.059 -37% |
| 4K-64 Write | 1285 | 273.6 -79% | 267.2 -79% | 671 -48% | 791 -38% |
| 4K-64 Read | 1232 | 337.7 -73% | 871 -29% | 620 -50% | 1485 21% |
| 4K Write | 107.9 | 96.8 -10% | 109.9 2% | 113.4 5% | 123.3 14% |
| 4K Read | 35.57 | 33.69 -5% | 38.31 8% | 35.61 0% | 48.35 36% |
| Seq Write | 1869 | 465.1 -75% | 291.8 -84% | 735 -61% | 1067 -43% |
| Seq Read | 2481 | 497.9 -80% | 1464 -41% | 1752 -29% | 2690 8% |
* ... smaller is better

GPU Performance
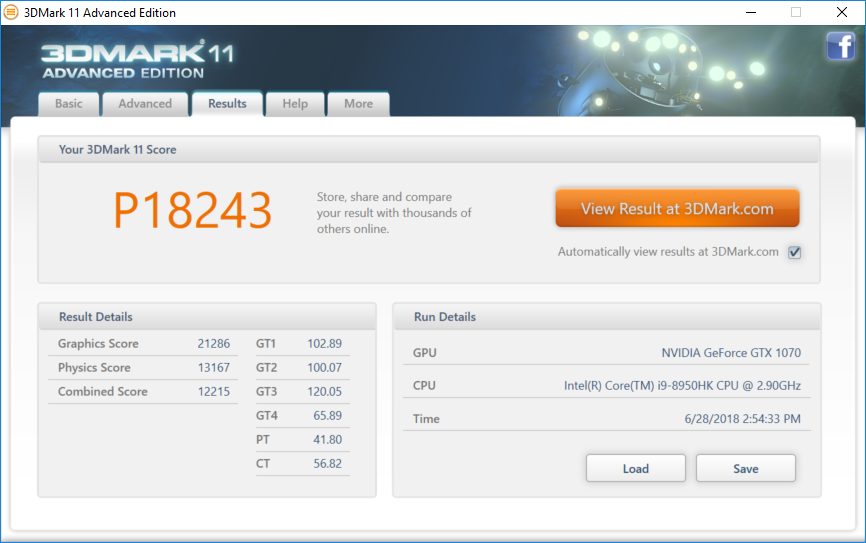
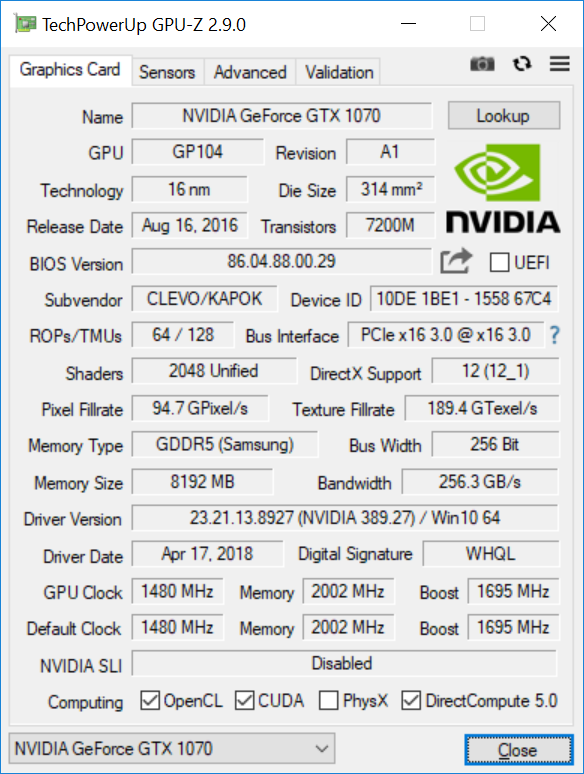
The full-fledged GeForce GTX 1070 GPU in the Q8 offers a 15 to 20 percent performance boost over the GTX 1070 Max-Q in the Eurocom Q6. The desktop GTX 1070 is still about 15 percent faster. Gamers should aim for 1440p and a steady 120 FPS to make the most of this particular display. This is achievable on mainstream competitive titles like DOTA 2, CS:GO, and Overwatch, but settings will have to be reduced for more demanding titles.
See our dedicated page on the GeForce GTX 1070 for more technical information and benchmark comparisons.
| 3DMark 11 Performance | 18243 points | |
Help | ||
| low | med. | high | ultra | |
|---|---|---|---|---|
| BioShock Infinite (2013) | 384.1 | 316.2 | 291.1 | 154.2 |
| The Witcher 3 (2015) | 48.2 |
Stress Test
We stress the notebook with demanding benchmarks to identify for any throttling or stability issues. When subjected to Prime95 load, the CPU can be observed running as high as 4.1 GHz for just the first few seconds before reaching 95 C and stabilizing at 2.8 GHz and a core temperature 72 C. The behavior matches with our power consumption readings where consumption is highest during the first few seconds of stress testing before leveling off. Running both Prime95 and FurMark simultaneously will throttle the CPU and GPU even further for steady temperatures of 69 C and 60 C, respectively.
Running Witcher 3 to represent real-world gaming load returns abnormal results. As shown by our HWiNFO screenshots below, CPU and GPU clock rates alternate between 1.8 GHz and 4.4 MHz and 1025 MHz and 1785 MHz, respectively. The inexplicably large fluctuations mean very unsteady frame rates. Witcher 3 jumps between 43 FPS and 62 FPS just from idling on the world map. Note that the system was set to High Performance mode on both Windows and the Control Center utility prior to the test. Results are very odd because 3DMark 11 and Bioshock Infinite scores appear to be normal, and so the fluctuating behavior may be dependent on the CPU and/or GPU demands of the application.
Running on battery power will limit both CPU and GPU performance. A 3DMark 11 run on batteries returns Physics and Graphics scores of 6792 and 12876 points, respectively, compared to 13167 and 21286 points when on mains.
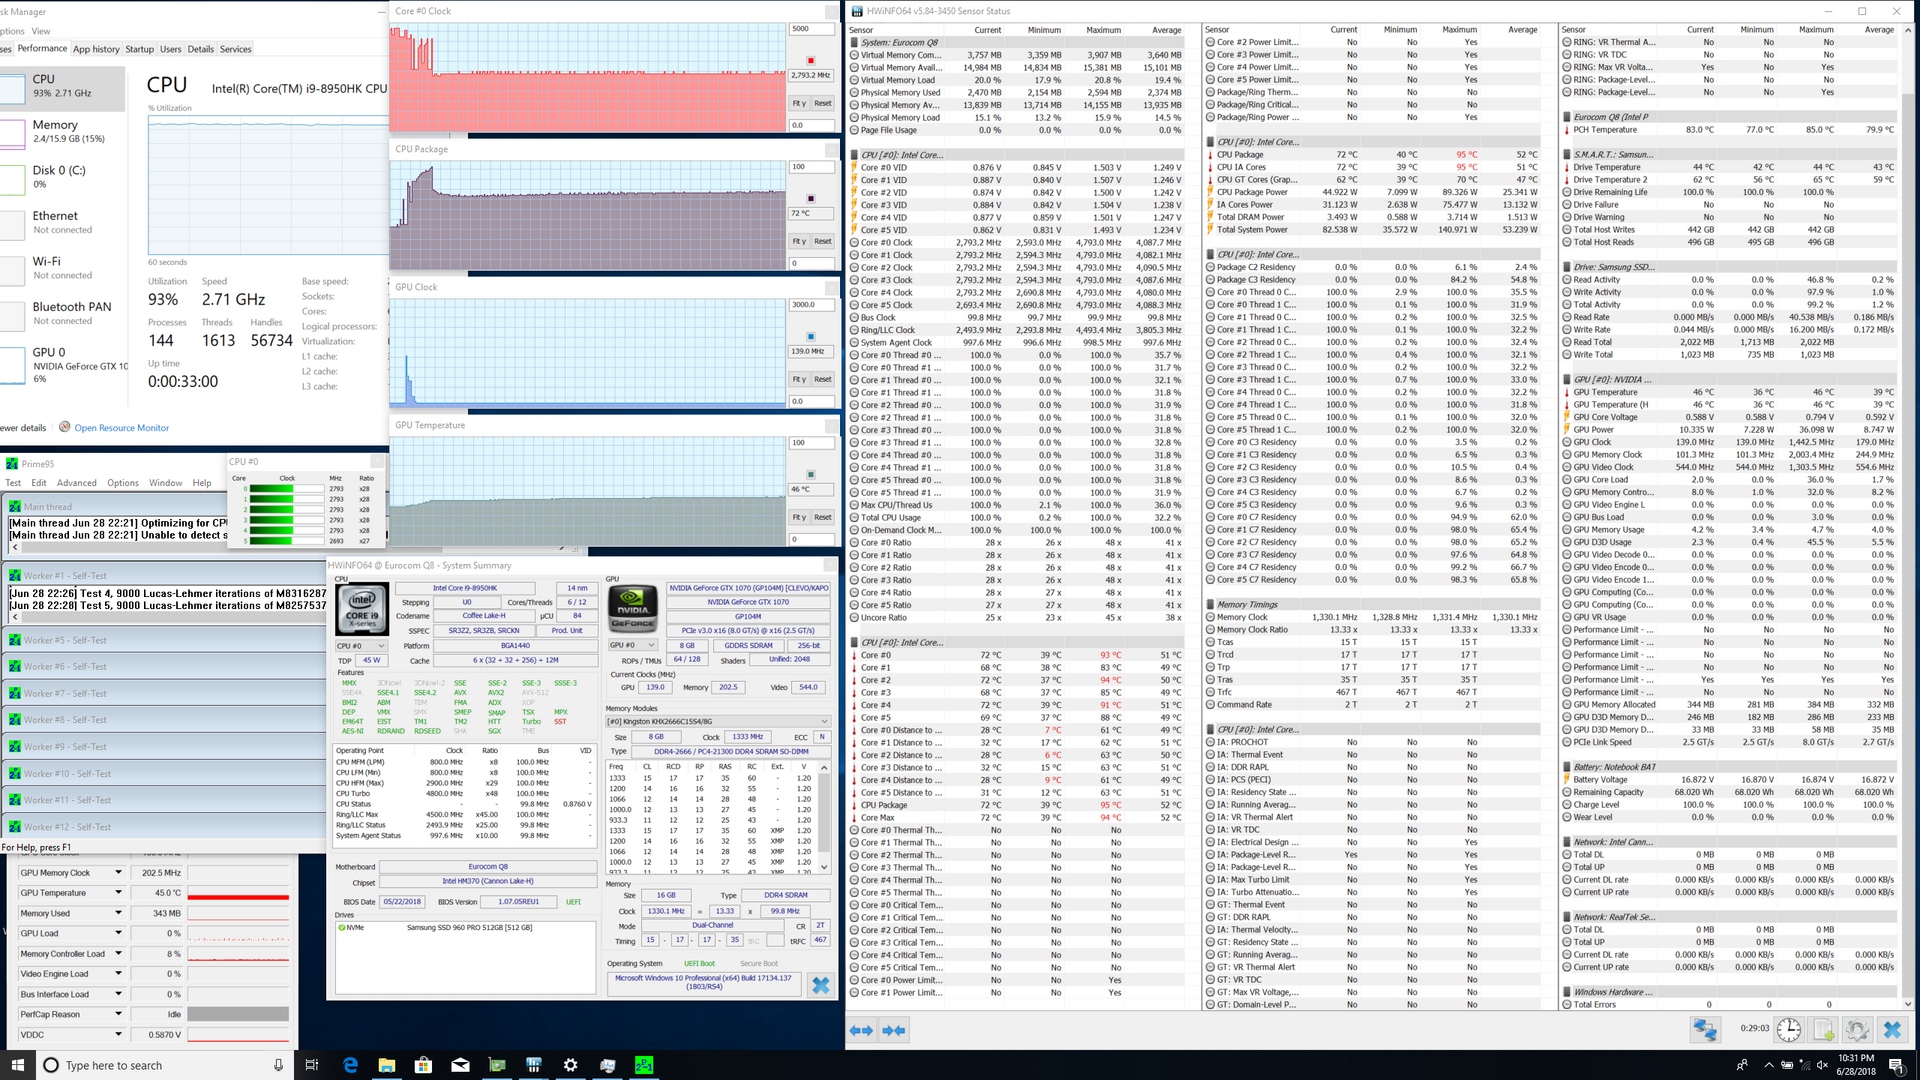
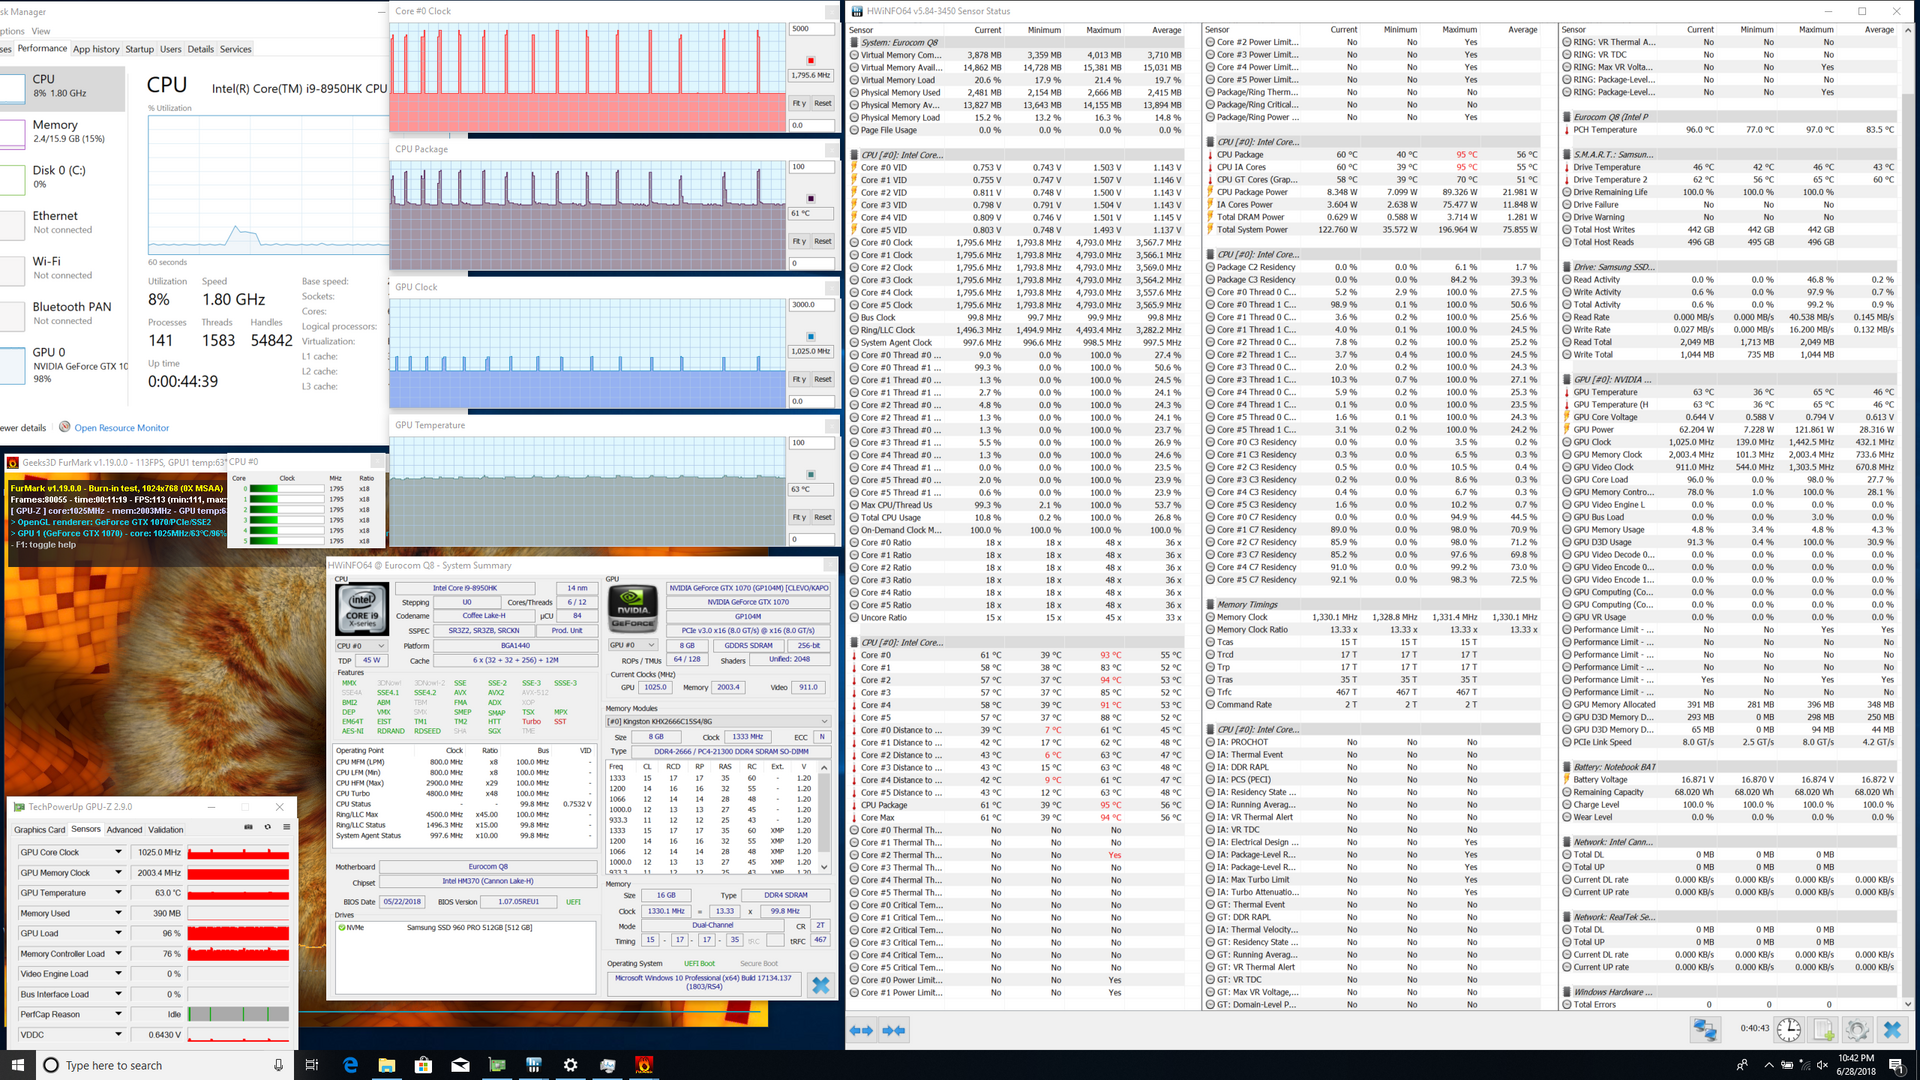
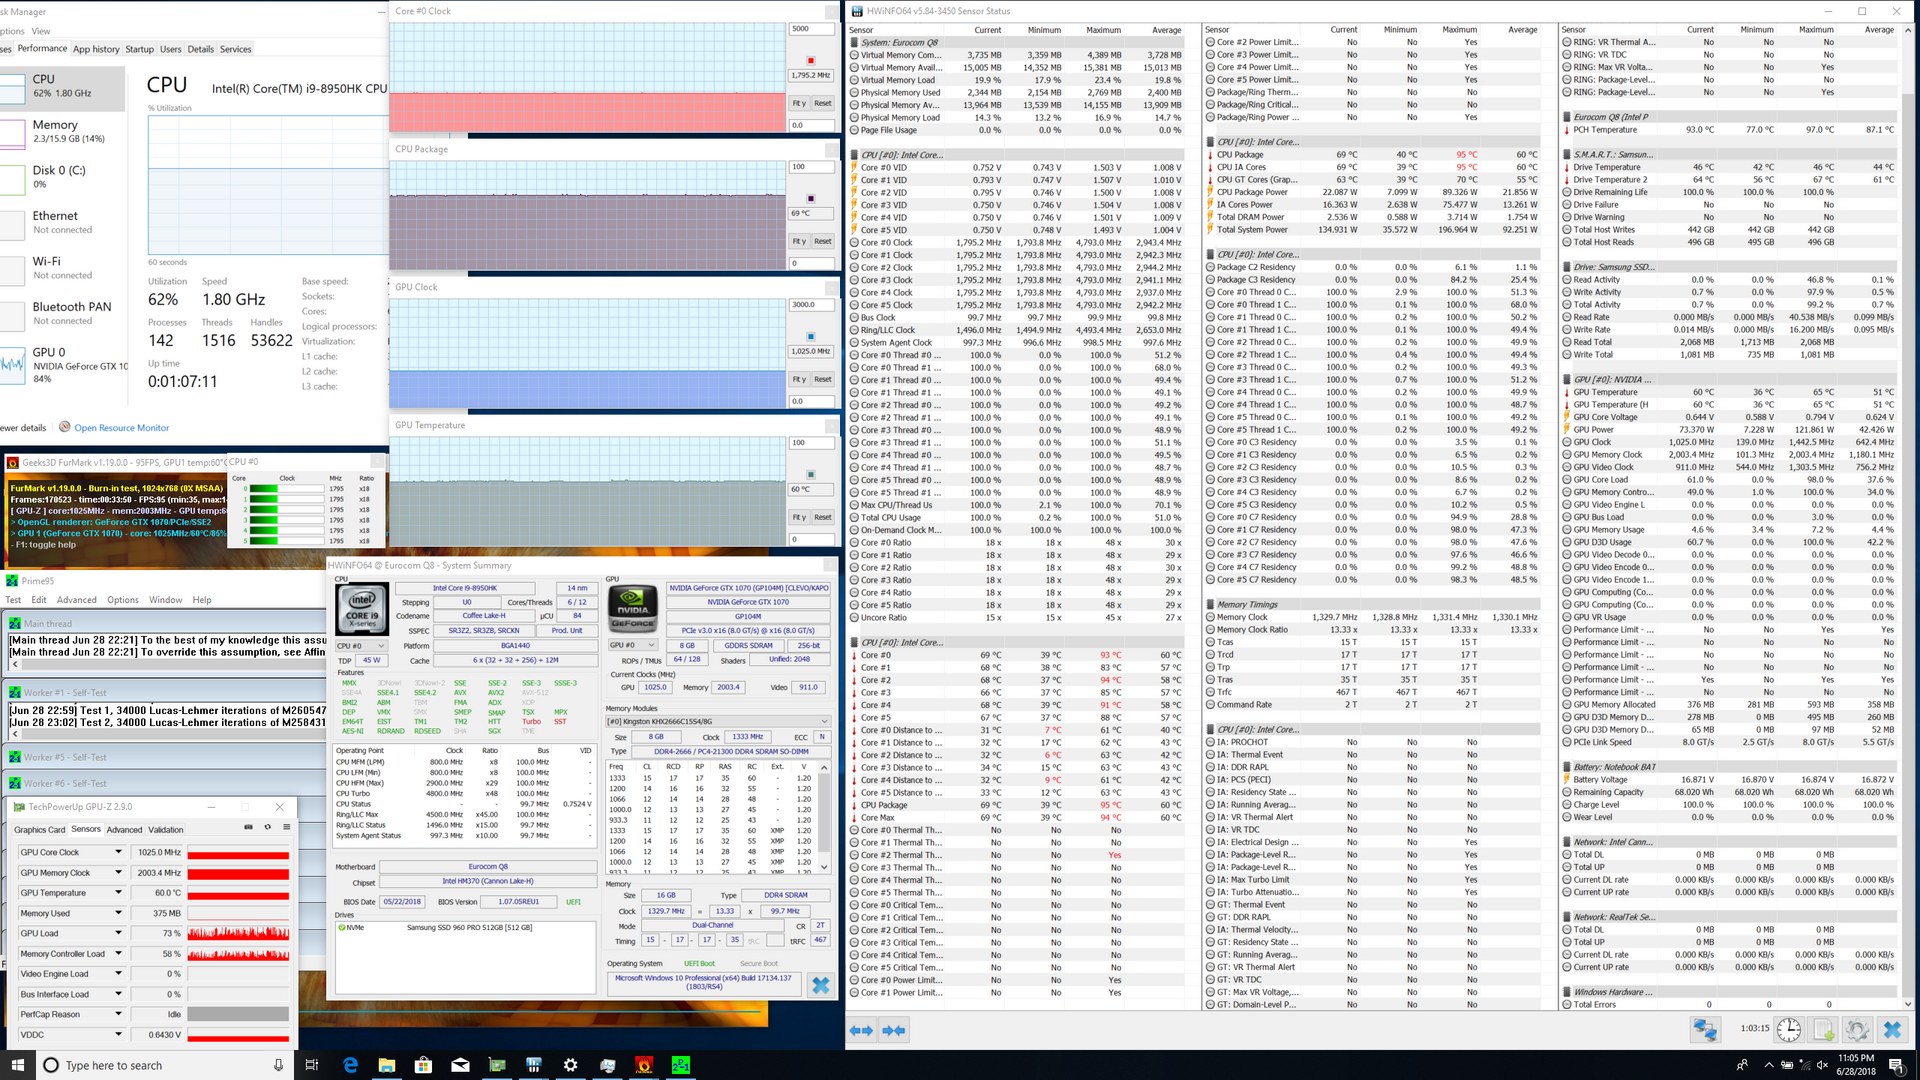
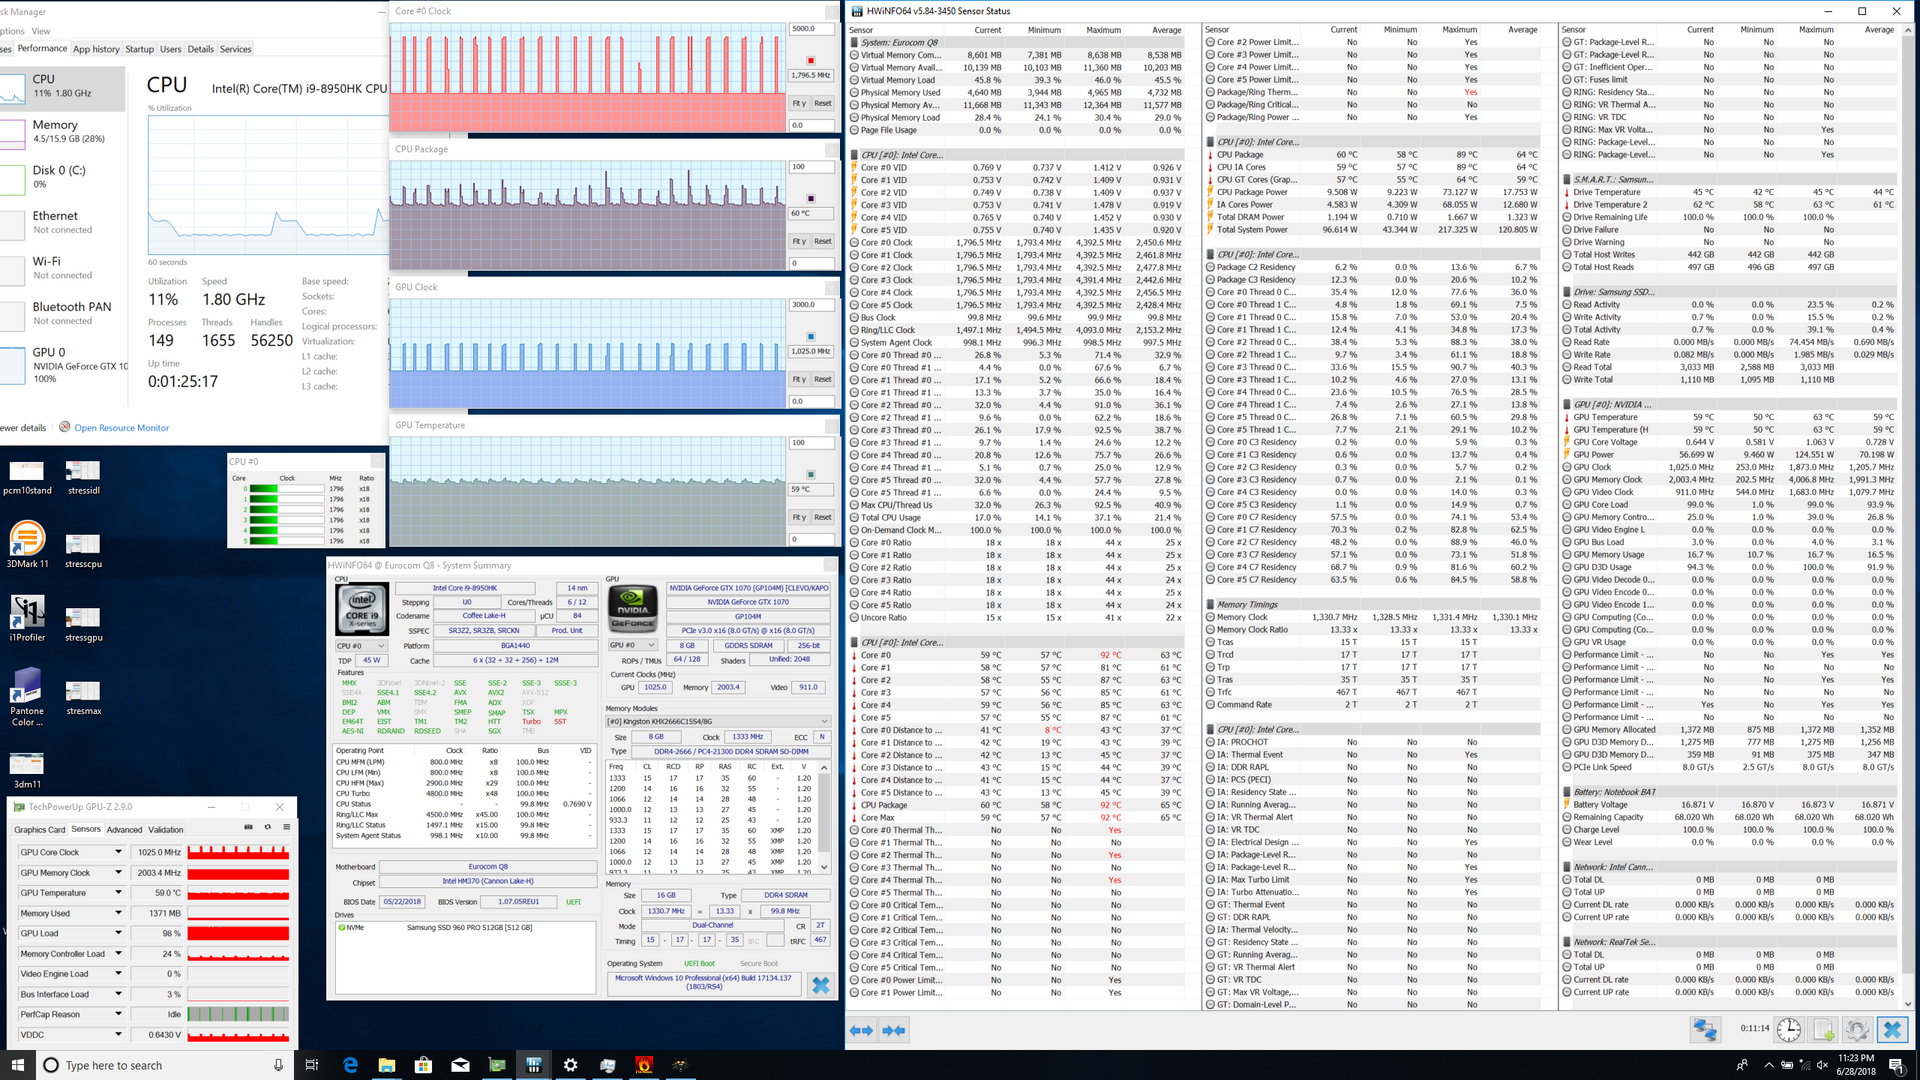
| CPU Clock (GHz) | GPU Clock (MHz) | Average CPU Temperature (°C) | Average GPU Temperature (°C) | |
| Prime95 Stress | 2.8 | -- | 72 | -- |
| FurMark Stress | -- | 1025 - 1443 | -- | 63 |
| Prime95 + FurMark Stress | 1.8 | 1025 | 69 | 60 |
| Witcher 3 Stress | 1.8 - 4.4 | 1025 - 1785 | 60 - 70 | 59 |
Emissions
System Noise
System fans are sensitive to onscreen load when on the High Performance profile. We recommend running on Power Saver when browsing, streaming, or word processing to avoid pulsing fans of up to 36 dB(A).
The Q8 will run more loudly than the larger Sky X4C during medium loads. Running just the first benchmark scene of 3DMark 06, for example, results in a fan noise of almost 47 dB(A) compared to 42 dB(A) on both the Sky X4C and GS73VR. Headphones are the best option when playing games if fan noise could be a concern.
We can otherwise notice no electronic noise or unsteady fan behavior from our unit.
Noise Level
| Idle |
| 28.2 / 31.8 / 36.3 dB(A) |
| Load |
| 46.7 / 49.7 dB(A) |
 | ||
30 dB silent 40 dB(A) audible 50 dB(A) loud |
||
min: | ||
| Eurocom Q8 GeForce GTX 1070 Mobile, i9-8950HK, Samsung SSD 960 Pro 512 GB m.2 | Eurocom Sky X4C GeForce GTX 1080 Mobile, i7-8700K, Samsung SSD 960 Pro 1TB m.2 NVMe | Razer Blade Pro RZ09-0220 GeForce GTX 1060 Mobile, i7-7700HQ, Samsung SSD PM951 MZVLV256HCHP | Alienware 17 R4 GeForce GTX 1080 Mobile, i7-7820HK, SK Hynix PC300 NVMe 512 GB | Aorus X7 v7 GeForce GTX 1070 Mobile, i7-7820HK, Samsung SM961 MZVPW256HEGL | MSI GS73VR 7RG GeForce GTX 1070 Max-Q, i7-7700HQ, Samsung SSD PM871 MZNLN512HMJP | |
|---|---|---|---|---|---|---|
| Noise | 2% | 7% | -7% | -6% | 4% | |
| off / environment * | 28 | 28.6 -2% | 28.1 -0% | 28.2 -1% | 30 -7% | 28 -0% |
| Idle Minimum * | 28.2 | 28.6 -1% | 29.5 -5% | 35.6 -26% | 33 -17% | 29.4 -4% |
| Idle Average * | 31.8 | 28.6 10% | 29.6 7% | 35.6 -12% | 36 -13% | 30.7 3% |
| Idle Maximum * | 36.3 | 31.1 14% | 29.6 18% | 35.7 2% | 41 -13% | 34 6% |
| Load Average * | 46.7 | 42.2 10% | 31.6 32% | 50.2 -7% | 41 12% | 42 10% |
| Witcher 3 ultra * | 46.9 | 53.8 -15% | 46 2% | 50.2 -7% | 45 4% | 45.8 2% |
| Load Maximum * | 49.7 | 50 -1% | 51.8 -4% | 50.2 -1% | 52 -5% | 45.8 8% |
* ... smaller is better
Temperature
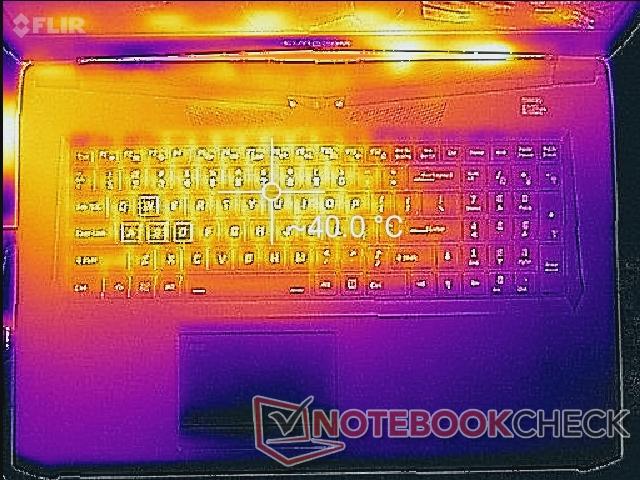
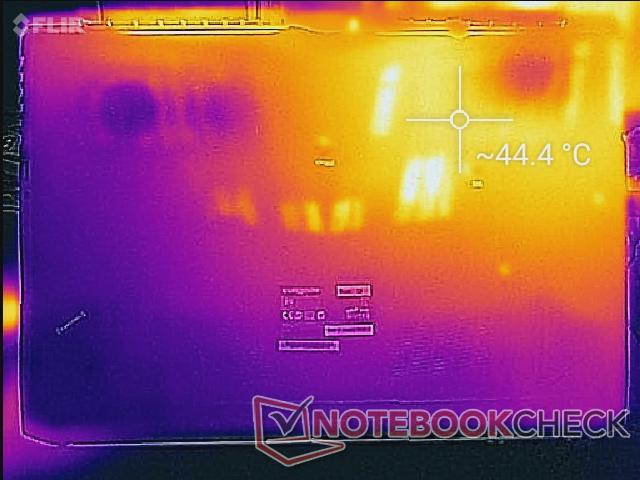
Surface temperatures when under load are cooler than on the Schenker XMG Pro 17 and PC Specialist Defiance IV even though they all share very similar Clevo designs. Hot spots on the Schenker, for example, can reach up to 56 C compared to just 44 C on our Q8 when under similar gaming loads.
The temperature discrepancy can be partly explained by the cooler core temperatures of the Q8. Since the Eurocom tends to throttle more heavily with unusual GPU performance in some cases, surface temperatures are cooler as a result.
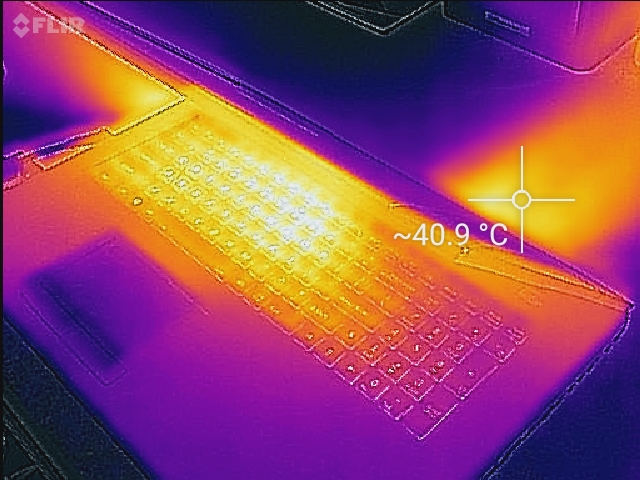
Generally, users can expect the left side of the notebook to be warmer than the right when gaming because of the asymmetric cooling solution. The WASD keys and center of the keyboard can as warm as 41 C.
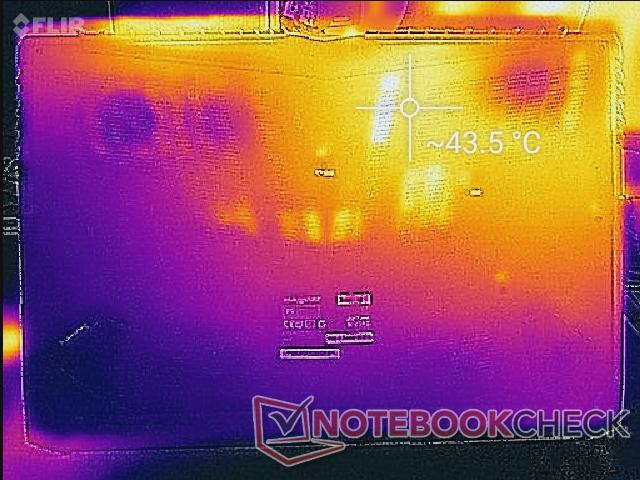
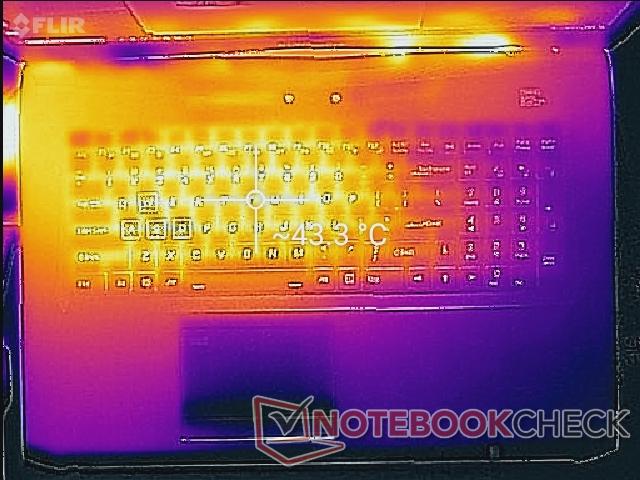
(±) The maximum temperature on the upper side is 43.4 °C / 110 F, compared to the average of 40.5 °C / 105 F, ranging from 21.2 to 68.8 °C for the class Gaming.
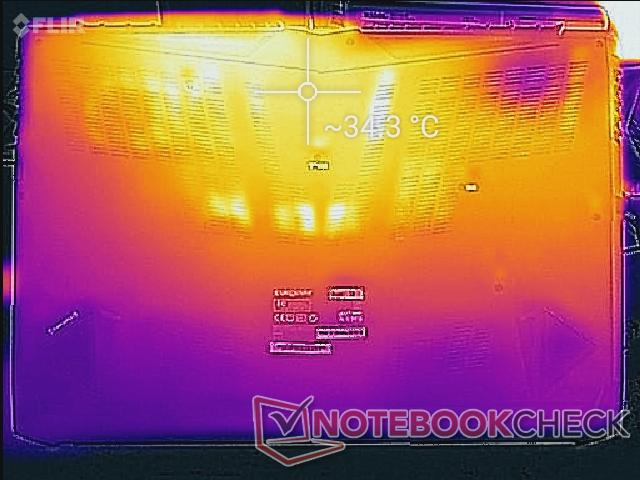
(±) The bottom heats up to a maximum of 44 °C / 111 F, compared to the average of 43.3 °C / 110 F
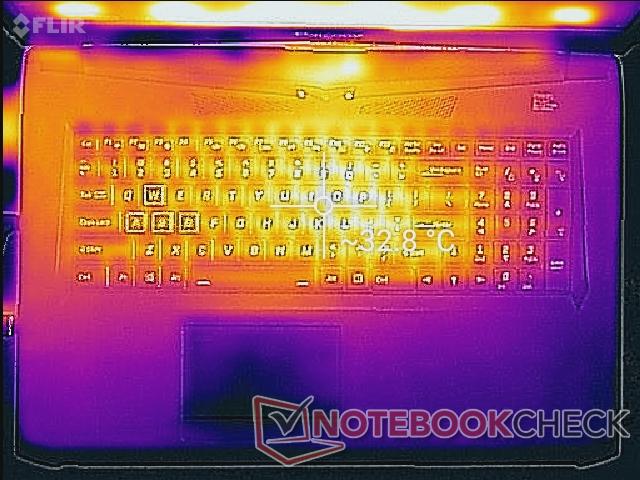
(+) In idle usage, the average temperature for the upper side is 29.3 °C / 85 F, compared to the device average of 33.9 °C / 93 F.
(±) Playing The Witcher 3, the average temperature for the upper side is 34.7 °C / 94 F, compared to the device average of 33.9 °C / 93 F.
(+) The palmrests and touchpad are cooler than skin temperature with a maximum of 31 °C / 87.8 F and are therefore cool to the touch.
(-) The average temperature of the palmrest area of similar devices was 28.9 °C / 84 F (-2.1 °C / -3.8 F).
Eurocom Q8 audio analysis
(-) | not very loud speakers (66.6 dB)
Bass 100 - 315 Hz
(±) | reduced bass - on average 13.4% lower than median
(±) | linearity of bass is average (12.1% delta to prev. frequency)
Mids 400 - 2000 Hz
(±) | higher mids - on average 5.4% higher than median
(±) | linearity of mids is average (12.1% delta to prev. frequency)
Highs 2 - 16 kHz
(+) | balanced highs - only 4.3% away from median
(±) | linearity of highs is average (11.5% delta to prev. frequency)
Overall 100 - 16.000 Hz
(-) | overall sound is not linear (30.3% difference to median)
Compared to same class
» 95% of all tested devices in this class were better, 2% similar, 3% worse
» The best had a delta of 6%, average was 18%, worst was 132%
Compared to all devices tested
» 88% of all tested devices were better, 3% similar, 9% worse
» The best had a delta of 4%, average was 24%, worst was 134%
Apple MacBook 12 (Early 2016) 1.1 GHz audio analysis
(+) | speakers can play relatively loud (83.6 dB)
Bass 100 - 315 Hz
(±) | reduced bass - on average 11.3% lower than median
(±) | linearity of bass is average (14.2% delta to prev. frequency)
Mids 400 - 2000 Hz
(+) | balanced mids - only 2.4% away from median
(+) | mids are linear (5.5% delta to prev. frequency)
Highs 2 - 16 kHz
(+) | balanced highs - only 2% away from median
(+) | highs are linear (4.5% delta to prev. frequency)
Overall 100 - 16.000 Hz
(+) | overall sound is linear (10.2% difference to median)
Compared to same class
» 6% of all tested devices in this class were better, 2% similar, 91% worse
» The best had a delta of 5%, average was 19%, worst was 53%
Compared to all devices tested
» 4% of all tested devices were better, 1% similar, 95% worse
» The best had a delta of 4%, average was 24%, worst was 134%
Energy Management
Power Consumption
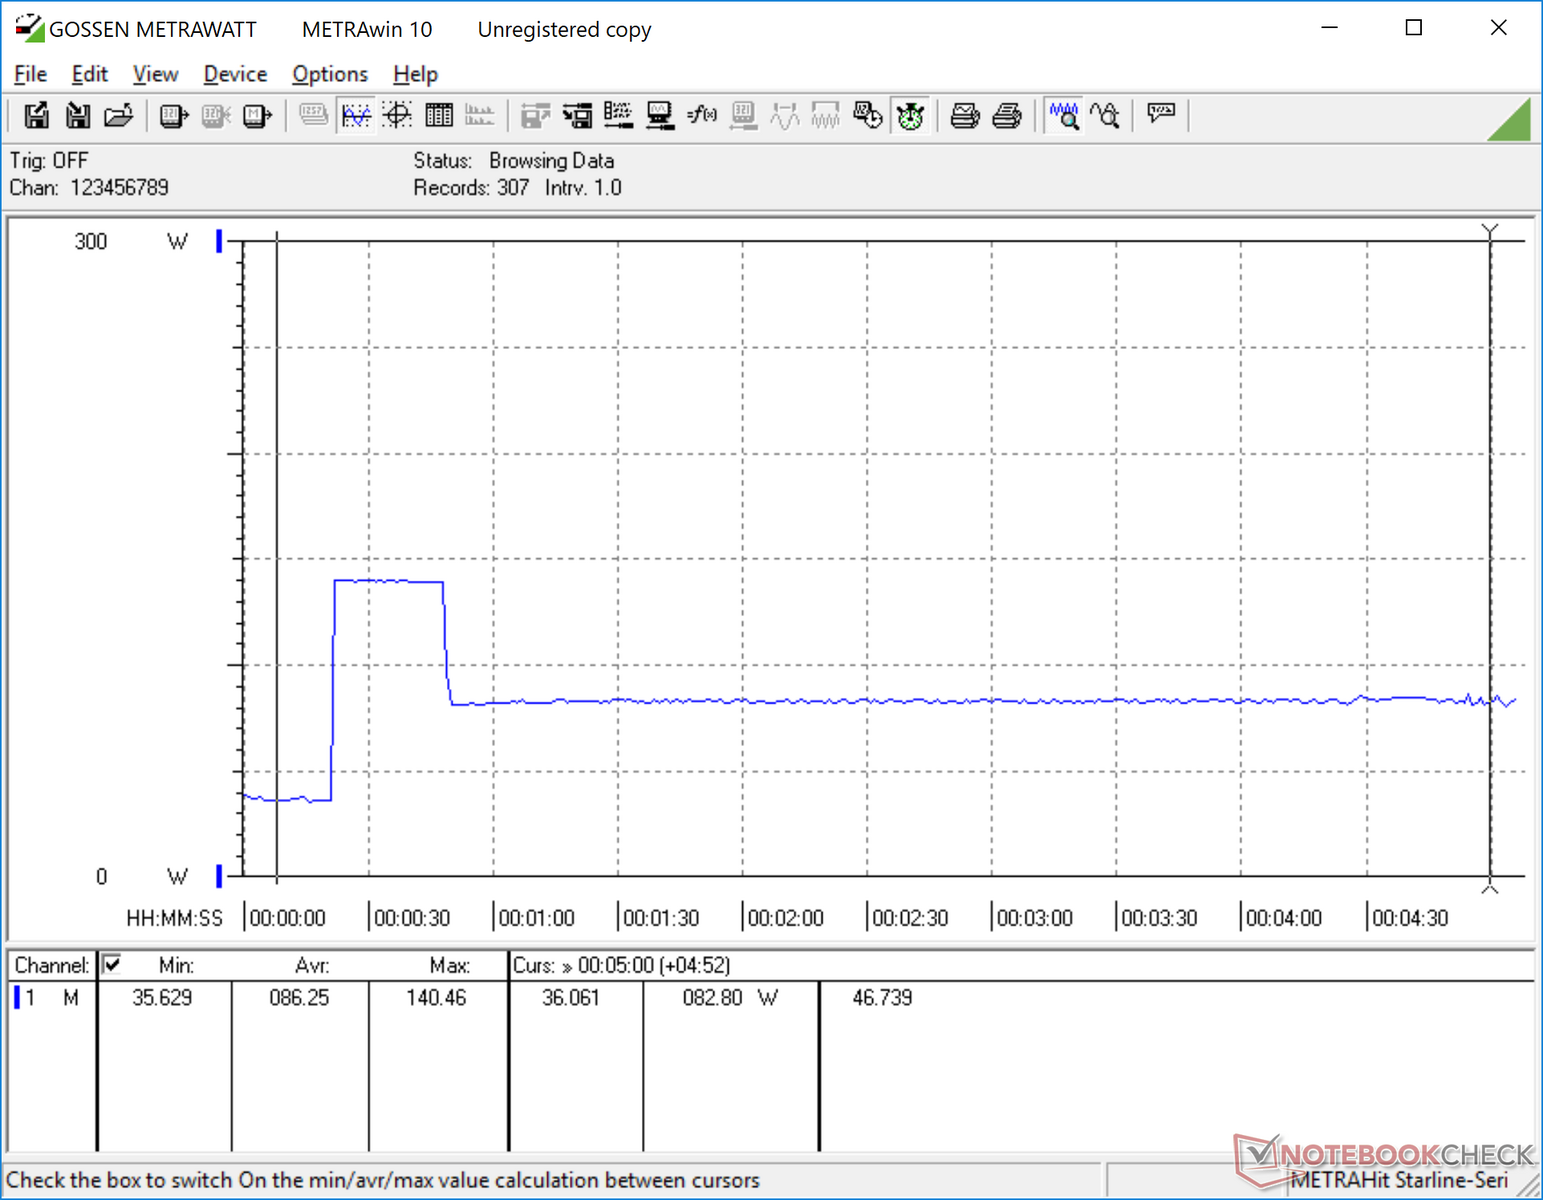
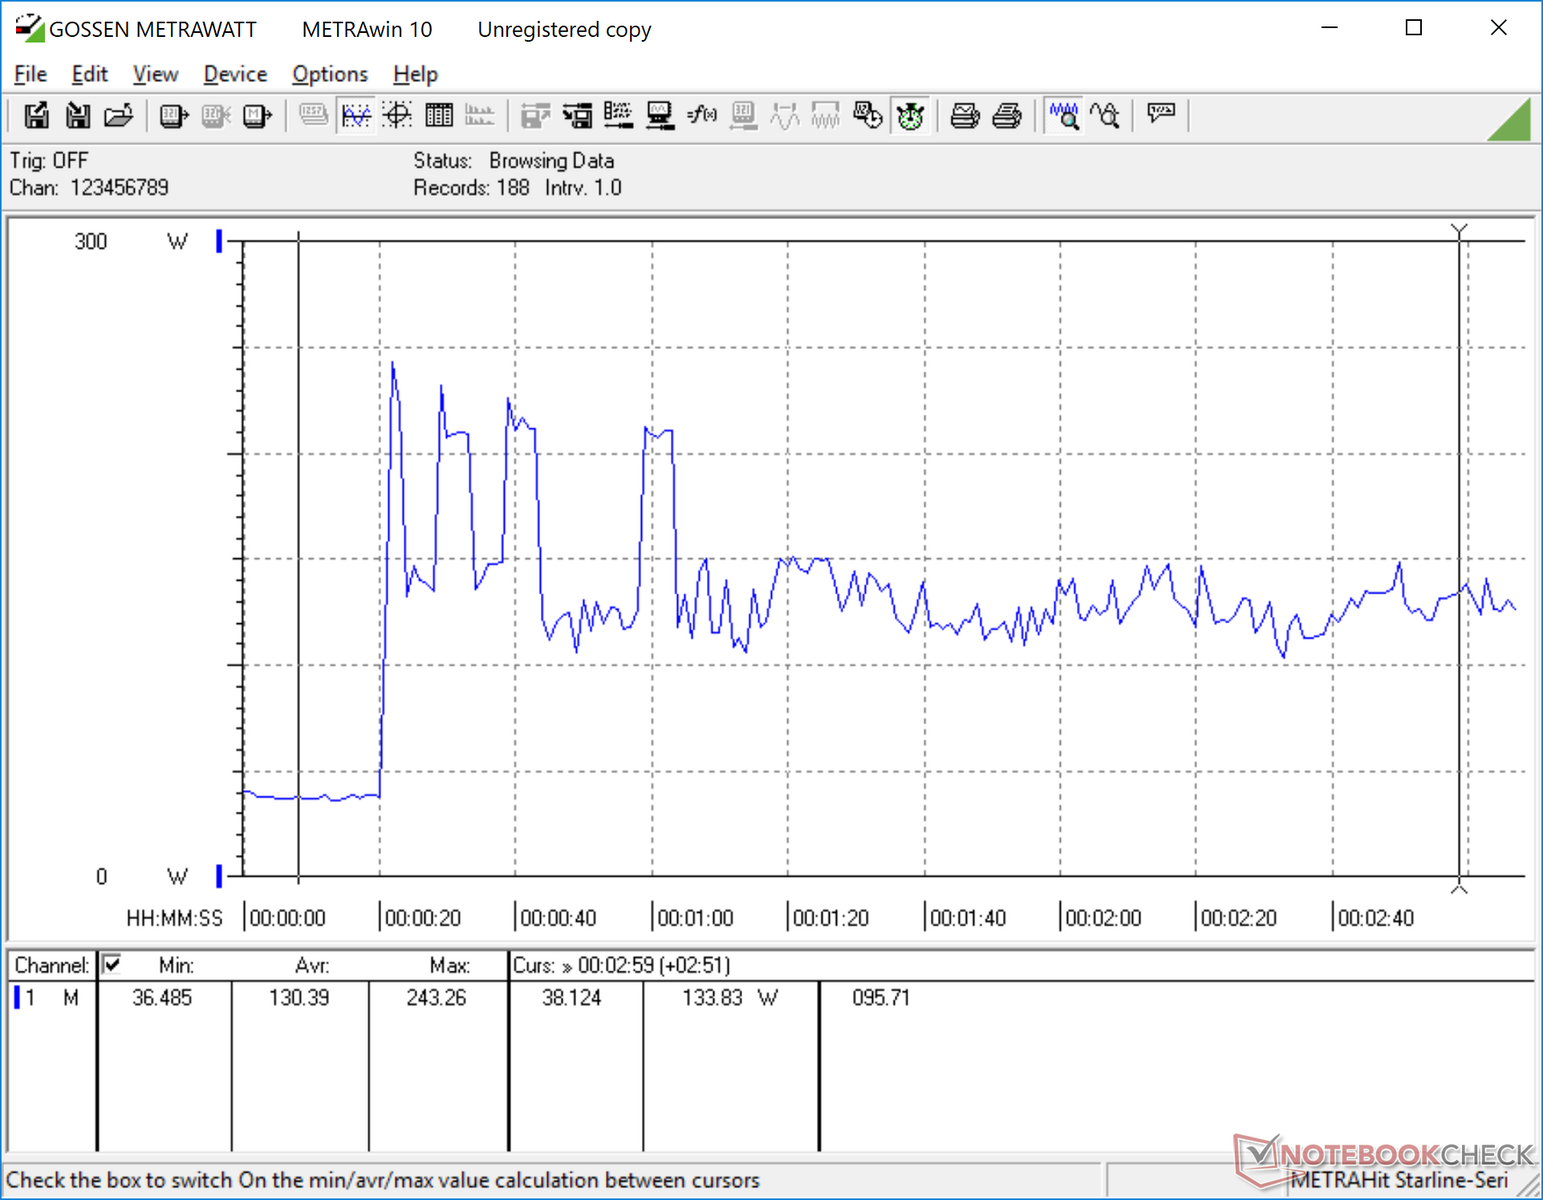
The system will draw anywhere from 26 W to 32 W when idling on desktop depending on the power profile and brightness level. Running Witcher 3 demands about 192 W to be very similar to the Aorus X7 v7 with the same GPU. Power consumption during maximum load (Prime95+FurMark) is lower than Witcher 3 load because of the throttling that occurs as shown by the chart below.
The medium-sized AC adapter (~16.7 x 8.3 x 3.5 cm) is rated for a maximum of 230 W. We are able to measure consumption of up to 243 W but only for very short periods.
| Off / Standby | |
| Idle | |
| Load |
|
Key:
min: | |
| Eurocom Q8 i9-8950HK, GeForce GTX 1070 Mobile, Samsung SSD 960 Pro 512 GB m.2, TN LED, 2560x1440, 17.3" | Razer Blade Pro RZ09-0220 i7-7700HQ, GeForce GTX 1060 Mobile, Samsung SSD PM951 MZVLV256HCHP, IPS, 1920x1080, 17.3" | Alienware 17 R4 i7-7820HK, GeForce GTX 1080 Mobile, SK Hynix PC300 NVMe 512 GB, TN LED, 2560x1440, 17.3" | Aorus X7 v7 i7-7820HK, GeForce GTX 1070 Mobile, Samsung SM961 MZVPW256HEGL, TN LED, 2560x1440, 17.3" | Asus Strix GL703GM-DS74 i7-8750H, GeForce GTX 1060 Mobile, Samsung PM961 MZVLW256HEHP, TN LED, 1920x1080, 17.3" | |
|---|---|---|---|---|---|
| Power Consumption | 35% | -33% | -20% | 8% | |
| Idle Minimum * | 26.3 | 10.6 60% | 37.5 -43% | 27 -3% | 18.88 28% |
| Idle Average * | 29 | 16 45% | 37.6 -30% | 33 -14% | 24.36 16% |
| Idle Maximum * | 32.3 | 16.4 49% | 37.6 -16% | 40 -24% | 32.27 -0% |
| Load Average * | 82.4 | 75.9 8% | 122.4 -49% | 107 -30% | 107.74 -31% |
| Witcher 3 ultra * | 192 | 111.2 42% | 180.3 6% | 190 1% | 142 26% |
| Load Maximum * | 170.2 | 163.8 4% | 277.4 -63% | 259 -52% | 160.28 6% |
* ... smaller is better
Battery Life
Runtimes from the internal 66 Wh battery are short at just about 2.5 hours of real-world WLAN use. This test was performed on the Balanced power profile with the integrated UHD Graphics 630 GPU active and a display brightness setting of 150 nits. Most competing systems last longer but not by very much such as the MSI GS73VR and Aorus X7 v7 at about 3 hours each when under similar WLAN conditions.
Charging from near empty to full capacity takes around 1.5 hours.
| Eurocom Q8 i9-8950HK, GeForce GTX 1070 Mobile, 66 Wh | MSI GS73VR 7RG i7-7700HQ, GeForce GTX 1070 Max-Q, 51 Wh | Razer Blade Pro RZ09-0220 i7-7700HQ, GeForce GTX 1060 Mobile, 70 Wh | Alienware 17 R4 i7-7820HK, GeForce GTX 1080 Mobile, 99 Wh | Aorus X7 v7 i7-7820HK, GeForce GTX 1070 Mobile, 94 Wh | Asus Zephyrus M GM501 i7-8750H, GeForce GTX 1070 Mobile, 55 Wh | |
|---|---|---|---|---|---|---|
| Battery Runtime | 25% | 174% | 18% | 18% | 7% | |
| WiFi v1.3 | 153 | 191 25% | 419 174% | 181 18% | 180 18% | 164 7% |
| Reader / Idle | 349 | 721 | 276 | 221 | 237 | |
| Load | 57 | 72 | 69 | 81 | 70 |
Pros
Cons
Verdict
(July 3, 2018 update: We've since discovered that the abnormal throttling is due to a bug in the installed version of the Control Center system utility tool. The bug causes the GPU to throttle in some 3D applications including Witcher 3. Clevo is currently working on a fix with no ETA as of this writing. Until then, killing the Control Center application through Task Manager will prevent the GPU throttling described in this review. Our original text remains.)
The Eurocom Q8 starts at $2300 USD for both the i9-8950HK and GTX 1070 GPU. For gaming purposes, Intel's 8th gen Coffee Lake-H offers only marginal boosts in frame rates over 7th gen Kaby Lake options. Users can potentially save money by considering older notebooks with the Core i7-7700HQ and GTX 1070 and still get very nearly the same performance as the Eurocom Q8 when gaming.
The strange throttling behavior of the Q8 when gaming makes the system a difficult recommendation for the time being. It's possible that this affects only our particular test unit. Even so, the Core i9 is not running at its fullest potential here and even if it could, its minor gaming advantages over the less expensive i7-8750H or even i7-7700HQ don't reflect the much higher asking price.
The Eurocom Q8 leaves a good first impression as far as serviceability and connectivity are concerned. Performance is shaky and with lower performance-per-Dollar than a traditional Core i7 offering.
Eurocom Q8
- 07/03/2018 v6 (old)
Allen Ngo
Price comparison
