Qualcomm Adreno 650 vs Qualcomm Adreno 643 vs Qualcomm Adreno 690
Qualcomm Adreno 650 ► remove from comparison
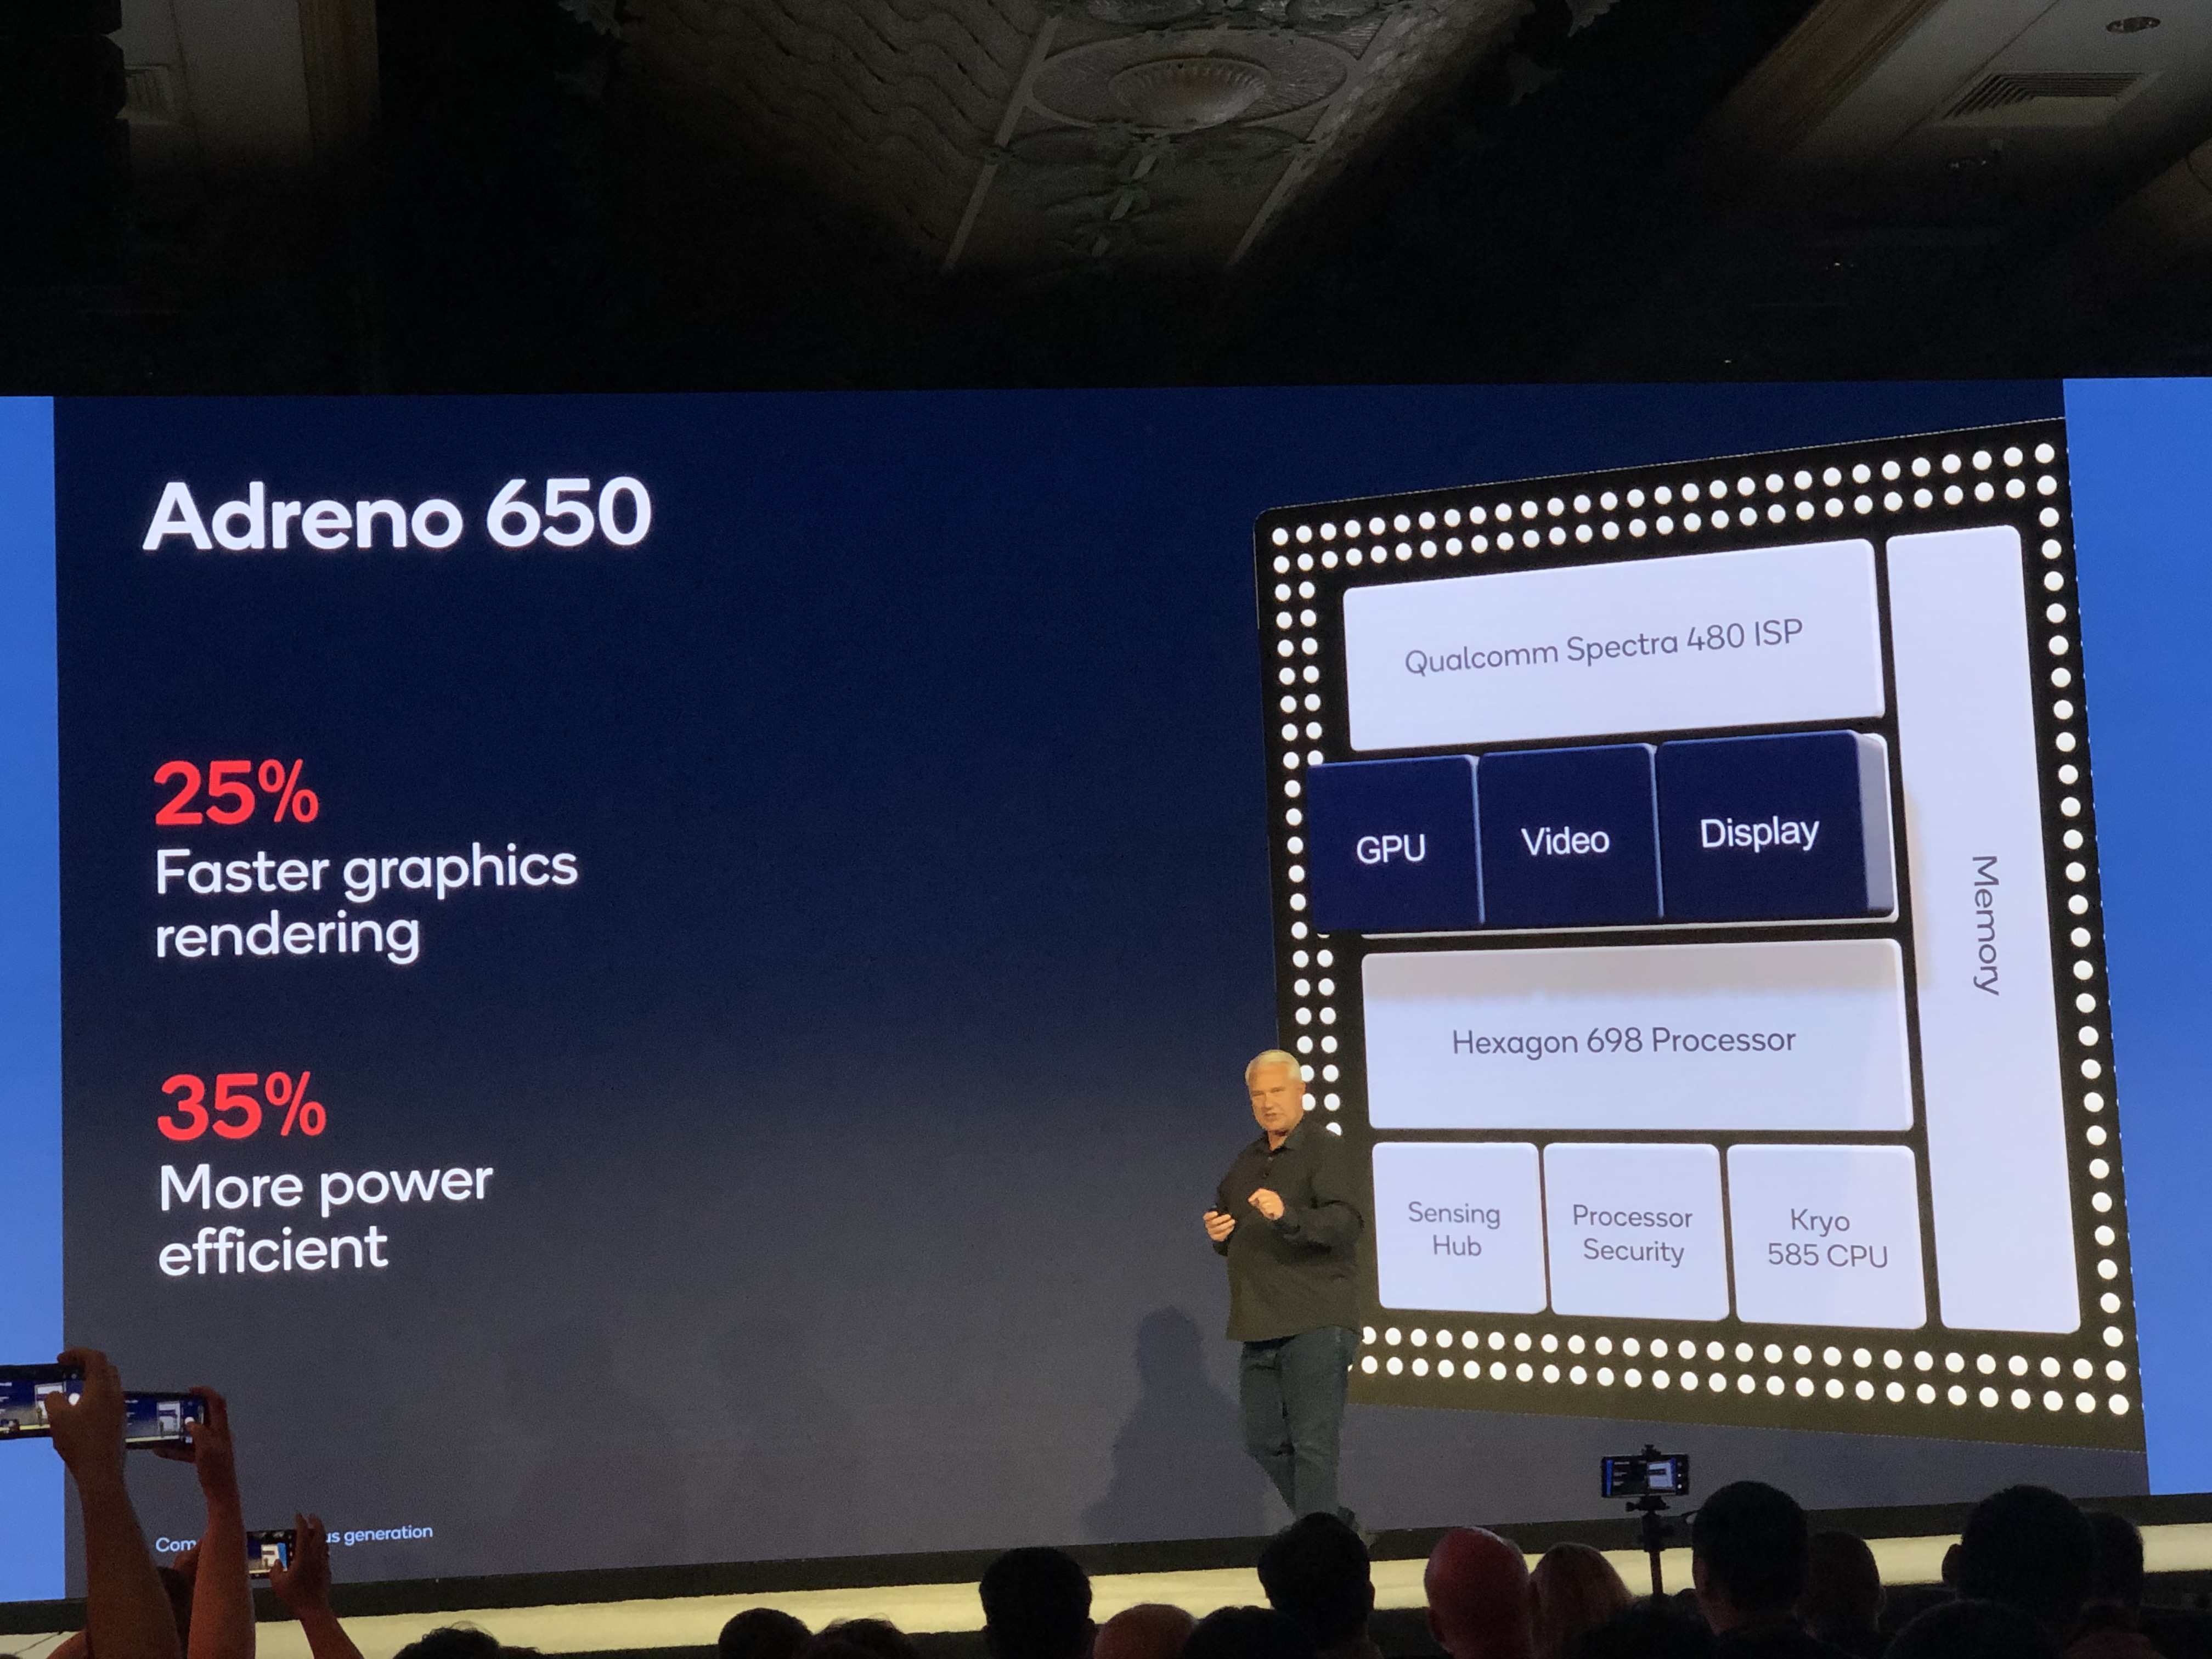
The Qualcomm Adreno 650 is a smartphone and tablet GPU that is integrated within the Qualcomm Snapdragon 865 , 865+ and 870 SoCs. The chip will be available from early 2020 and will be used mainly in high-end Android devices. The base clock speed of the GPU is 250 MHz and the boost depends on the used SoC. For the 865 it is 587 MHz, the 865 Plus increased to 846 MHz and the 2021 870 reached 670 MHz.
According to Qualcomm, the Adreno 650 GPU offers a 25% improved performance over the Adreno 640 , its predecessor, which is integrated into the Snapdragon 855 SoC. The enhanced performance is achieved by the Adreno 650 having 50% more compute units (ALUs) than the Adreno 640. Furthermore, the clock speed of the pixel shaders was also increased by 50%.
The performance in our first benchmarks of a reference system positions itself above the ARM Mali-G76 MP16 and e.g. in 3DMark Sling Shot Extreme even on the top spot. In GFXBench only the Apple A13 GPU is able to best the Adreno 650 (regarding smartphone GPUs).
As a novelty, the GPU driver can be updated in the Android Play Store. Furthermore, some features are running under the Elite Gaming brand (e.g., 144 Hz display support, desktop forward rendering).
The Adreno 650 supports Vulkan 1.1, DirectX 12, OpenGL ES 3.2, and OpenCL 2.0 FP. Furthermore, games and videos can use HDR10+ and Dolby Vision (with a supported display). The 650 supports 2 displays with up to 4K 60 Hz / QHD+ 144 Hz.
Qualcomm Adreno 643 ► remove from comparison
The Qualcomm Adreno 643 is an integrated graphics unit (iGPU) that is used in the Qualcomm QCM6490 and QCS6490. The SoC is not only intended for use in Android-based smartphones and tablets, but also for IoT products with Linux, Ubuntu or Windows 11 IoT Enterprise. In the QCM6490 and QCS6490 the 643 clocks at 812 MHz.
Qualcomm Adreno 690 ► remove from comparison
The Qualcomm Adreno 690 is an integrated graphics card in the Qualcomm Snapdragon 8cx Gen 3 SoC for Windows laptops. According to Qualcomm, the 690 is up to 60% faster than the previous generation. In our tests with the Lenovo ThinkPad X13s, the Adreno 690 was only on par with a low en Intel UHD Graphics iGPU and not well suited for 3D games.
The chip is manufactured in 5nm at Samsung (5LPE) and suited for fanless laptops.
Qualcomm Adreno 650 Qualcomm Adreno 643 Qualcomm Adreno 690 Adreno 600 Series Architecture Adreno 600 Core Speed 250 - 670 (Boost) MHz 812 MHz Shared Memory yes yes yes API DirectX 12, OpenGL ES 3.2 DirectX 12, OpenGL ES 3.2, OpenCL 2.0, Vulkan 1.x DirectX 12 technology 7 nm 6 nm 5 nm Features OpenGL ES 3.2, OpenCL 2.0, DirectX 12, Vulkan 1.1 OpenGL ES 3.2, OpenCL 2.0, DirectX 12, Vulkan 1.1 Date of Announcement 04.12.2019 12.08.2021 06.12.2018 Power Consumption 7 Watt
Benchmarks Performance Rating - 3DMark 11 + Fire Strike + Time Spy - Adreno 690
1.3 pt (4%)
...
max:
3DMark - 3DMark Time Spy Score
909 Points (3%)
3DMark - 3DMark Time Spy Graphics
811 Points (2%)
3DMark - 3DMark Ice Storm Unlimited Graphics
min: 110875 avg: 149779 median: 149017 (17%) max: 180392 Points
3DMark - 3DMark Cloud Gate Score
min: 8602 avg: 9818 median: 9818 (10%) max: 11034 Points
3DMark - 3DMark Cloud Gate Graphics
min: 13768 avg: 16708 median: 16707.5 (4%) max: 19647 Points
3DMark - 3DMark Fire Strike Standard Score
min: 2758 avg: 2835 median: 2834.5 (5%) max: 2911 Points
3DMark - 3DMark Fire Strike Standard Graphics
min: 2837 avg: 2933 median: 2932.5 (3%) max: 3028 Points
3DMark - 3DMark Ice Storm Graphics
14652 Points (2%)
3DMark - 3DMark Sling Shot (ES 3.0) Unlimited
min: 7970 avg: 9563 median: 9684 (42%) max: 11492 Points
3DMark - 3DMark Sling Shot (ES 3.0) Unlimited Graphics
min: 11617 avg: 13051 median: 12858 (28%) max: 16809 Points
3DMark - 3DMark Sling Shot Extreme (ES 3.1) Unlimited
min: 6960 avg: 8089 median: 8085 (40%) max: 8975 Points
6499 Points (32%)
3DMark - 3DMark Sling Shot Extreme (ES 3.1) Unlimited Graphics
min: 8593 avg: 9728 median: 9498 (28%) max: 11999 Points
7131 Points (21%)
3DMark - 3DMark Wild Life Unlimited
min: 3789 avg: 4168 median: 4230 (2%) max: 5039 Points
3135 Points (2%)
3DMark - 3DMark Wild Life Extreme Unlimited
min: 1103 avg: 1218 median: 1223 (1%) max: 1246 Points
887 Points (1%)
3067 Points (4%)
3DMark 11 - 3DM11 Performance Score
min: 3063 avg: 3085 median: 3077 (4%) max: 3115 Points
3DMark 11 - 3DM11 Performance GPU
min: 2898 avg: 2930 median: 2912 (3%) max: 2979 Points
Cinebench R10 Cinebench R10 Shading (32bit) + Qualcomm Adreno 690 Cinebench R10 - Cinebench R10 Shading (32bit)
558 Points (0%)
Cinebench R15 + Qualcomm Adreno 690 Cinebench R15 - Cinebench R15 OpenGL 64 Bit
min: 13.4 avg: 13.7 median: 13.7 (1%) max: 14 fps
Cinebench R15 OpenGL Ref. Match 64 Bit + Qualcomm Adreno 690 Cinebench R15 - Cinebench R15 OpenGL Ref. Match 64 Bit
98 % (98%)
GFXBench - GFXBench 5.0 4K Aztec Ruins High Tier Offscreen
min: 9.7 avg: 9.9 median: 10 (4%) max: 10 fps
8.2 fps (3%)
GFXBench - GFXBench 5.0 Aztec Ruins High Tier Offscreen
min: 18 avg: 21.1 median: 21 (4%) max: 27 fps
18 fps (3%)
GFXBench - GFXBench 5.0 Aztec Ruins Normal Tier Offscreen
min: 27 avg: 55 median: 55 (4%) max: 67 fps
49 fps (4%)
GFXBench - GFXBench Car Chase Offscreen
min: 39 avg: 52.6 median: 51 (6%) max: 62 fps
40 fps (5%)
GFXBench 3.1 - GFXBench Manhattan ES 3.1 Offscreen
min: 67 avg: 87.2 median: 88 (2%) max: 103 fps
69 fps (1%)
GFXBench 3.0 - GFXBench 3.0 Manhattan Offscreen
min: 96 avg: 125.1 median: 125 (7%) max: 151 fps
90 fps (5%)
GFXBench (DX / GLBenchmark) 2.7 + Qualcomm Adreno 650 GFXBench (DX / GLBenchmark) 2.7 - GFXBench T-Rex HD Offscreen C24Z16
min: 168 avg: 209.5 median: 206 (2%) max: 266 fps
GFXBench T-Rex HD Offscreen C24Z16 + Qualcomm Adreno 643
159 fps (1%)
Antutu v9 - AnTuTu v9 GPU
min: 214123 avg: 240087 median: 240035 (30%) max: 276746 Points
192996 Points (24%)
Basemark GPU 1.2 - Basemark GPU 1.2 Vulkan Official Medium Offscreen 1080
min: 72.6 avg: 75.5 median: 75 (0%) max: 78.57 fps
51.8 fps (0%)
Geekbench 6.2 - Geekbench 6.2 GPU OpenCL
2688 Points (1%)
2937 Points (1%)
Geekbench 6.2 - Geekbench 6.2 GPU Vulkan
2532 Points (1%)
3054 Points (1%)
PassMark PerformanceTest Mobile V1 - PerformanceTest Mobile V1 2D Graphics Tests
54110 Points (54%)
PassMark PerformanceTest Mobile V1 - PerformanceTest Mobile V1 3D Graphics Tests
42627 Points (75%)
Power Consumption - Furmark Stress Test Power Consumption - external Monitor *
min: 17 avg: 19.7 median: 19.7 (3%) max: 22.3 Watt
Power Consumption - The Witcher 3 Power Consumption - external Monitor *
15.8 Watt (2%)
Power Consumption - Witcher 3 Power Consumption *
16.4 Watt (4%)
Power Consumption - GFXBench Aztec Ruins Normal Tier Offscreen Power Consumption 150cd *
min: 5.18 avg: 8.2 median: 7.6 (3%) max: 12.7 Watt
5.9 Watt (2%)
Average Benchmarks Qualcomm Adreno 650 → 100% n=1 Average Benchmarks Qualcomm Adreno 643 → 73% n=1 Average Benchmarks Qualcomm Adreno 690 → 251% n=1
- Range of benchmark values for this graphics card
- Average benchmark values for this graphics card
* Smaller numbers mean a higher performance
1 This benchmark is not used for the average calculation
Game Benchmarks The following benchmarks stem from our benchmarks of review laptops. The performance depends on the used graphics memory, clock rate, processor, system settings, drivers, and operating systems. So the results don't have to be representative for all laptops with this GPU. For detailed information on the benchmark results, click on the fps number.
100%
Adreno 650:
60 119 [X] Asus ROG Phone 3 2.0.0.3727
Qualcomm Snapdragon 865+ (Plus) 2.4GHz
Adreno 650
min:
106 fps, max:
122 fps
~ 90 fps
100%
Adreno 650:
60 [X] Xiaomi Poco F4 3.3.0.5735
Qualcomm Snapdragon 870 5G 2.4GHz
Adreno 650
min:
54 fps, max:
61 fps
117 [X] Asus ROG Phone 3 2.0.0.3727
Qualcomm Snapdragon 865+ (Plus) 2.4GHz
Adreno 650
min:
97 fps, max:
121 fps
~ 89 fps
100%
Adreno 650:
60 118 [X] Asus ROG Phone 3 2.0.0.3727
Qualcomm Snapdragon 865+ (Plus) 2.4GHz
Adreno 650
min:
111 fps, max:
121 fps
~ 89 fps
100%
Adreno 650:
60 [X] Asus ROG Phone 3 1.0.17
Qualcomm Snapdragon 865+ (Plus) 2.4GHz
Adreno 650
min:
56 fps, max:
61 fps
fps
100%
Adreno 650:
60 60 [X] OnePlus 8T 1.0.0_1112729_1135452
Qualcomm Snapdragon 865 2.4GHz
Adreno 650
min:
54 fps, max:
61 fps
~ 60 fps
97%
Adreno 643:
58 [X] Fairphone 5 4.2.1_18831865_18963989
Qualcomm QCM6490 2GHz
Adreno 643
min:
35 fps, max:
61 fps
fps
Adreno 643:
40 [X] Fairphone 5 4.2.1_18831865_18963989
Qualcomm QCM6490 2GHz
Adreno 643
min:
27 fps, max:
58 fps
fps
100%
Adreno 650:
59 60 [X] OnePlus 8T 1.0.0_1112729_1135452
Qualcomm Snapdragon 865 2.4GHz
Adreno 650
min:
50 fps, max:
61 fps
60 [X] Asus ROG Phone 3 1.1.1_1437351_1398019
Qualcomm Snapdragon 865+ (Plus) 2.4GHz
Adreno 650
min:
29 fps, max:
61 fps
60 [X] Xiaomi Poco F3 1.5.0_2574575_2578841
Qualcomm Snapdragon 870 5G 2.4GHz
Adreno 650
min:
37 fps, max:
61 fps
~ 60 fps
63%
Adreno 643:
38 [X] Fairphone 5 4.2.1_18831865_18963989
Qualcomm QCM6490 2GHz
Adreno 643
min:
21 fps, max:
61 fps
fps
98%
Adreno 643:
60 [X] Fairphone 5 2.9.0
Qualcomm QCM6490 2GHz
Adreno 643
min:
50 fps, max:
61 fps
fps
69%
Adreno 643:
40 [X] Fairphone 5 2.9.0
Qualcomm QCM6490 2GHz
Adreno 643
min:
32 fps, max:
41 fps
fps
75%
Adreno 643:
40 [X] Fairphone 5 2.9.0
Qualcomm QCM6490 2GHz
Adreno 643
min:
38 fps, max:
41 fps
fps
100%
Adreno 650:
60 60 62 ~ 61 fps
100%
Adreno 650:
60 60 61 ~ 60 fps
60%
Adreno 643:
60 [X] Fairphone 5 1.10.0
Qualcomm QCM6490 2GHz
Adreno 643
min:
59 fps, max:
60 fps
fps
100%
Adreno 650:
30 [X] OnePlus 8 Pro 2.1.2a
Qualcomm Snapdragon 865 2.4GHz
Adreno 650
min:
29 fps, max:
31 fps
30 60 60 ~ 45 fps
100%
Adreno 650:
60 144 ~ 102 fps
Average Gaming Qualcomm Adreno 650 → 100% Average Gaming 30-70 fps → 100%
Average Gaming Qualcomm Adreno 643 → 77% Average Gaming 30-70 fps → 77%
Qualcomm Adreno 690 low med. high ultra QHD 4K F1 22 26 22.5 17 12.6 X-Plane 11.11 14 12 11 Final Fantasy XV Benchmark 19 12.3 7.29 Dota 2 Reborn 58 55 44 37 The Witcher 3 25 16 10 4 GTA V 29.9 < 30 fps < 60 fps < 120 fps ≥ 120 fps 5 1 4 1 4 1 2 1
Qualcomm Adreno 643 low med. high ultra QHD 4K Genshin Impact 58 40 38 PUBG Mobile 60 40 40 Dead Trigger 2 60 < 30 fps < 60 fps < 120 fps ≥ 120 fps 1 1 2 1 1 1
For more games that might be playable and a list of all games and graphics cards visit our Gaming List
v1.26
log 27. 04:24:18
#0 checking url part for id 9971 +0s ... 0s
#1 checking url part for id 11804 +0s ... 0s
#2 checking url part for id 11411 +0s ... 0s
#3 not redirecting to Ajax server +0s ... 0s
#4 did not recreate cache, as it is less than 5 days old! Created at Sat, 25 May 2024 05:40:03 +0200 +0.001s ... 0.001s
#5 composed specs +0.126s ... 0.127s
#6 did output specs +0s ... 0.127s
#7 start showIntegratedCPUs +0s ... 0.127s
#8 getting avg benchmarks for device 9971 +0.038s ... 0.165s
#9 got single benchmarks 9971 +0.095s ... 0.259s
#10 getting avg benchmarks for device 11804 +0.002s ... 0.261s
#11 got single benchmarks 11804 +0.006s ... 0.267s
#12 getting avg benchmarks for device 11411 +0.015s ... 0.283s
#13 got single benchmarks 11411 +0.01s ... 0.293s
#14 got avg benchmarks for devices +0s ... 0.293s
#15 min, max, avg, median took s +0.154s ... 0.447s
#16 before gaming benchmark output +0s ... 0.447s
#17 Got 204 rows for game benchmarks. +0.037s ... 0.484s
#18 composed SQL query for gamebenchmarks +0s ... 0.484s
#19 got data and put it in $dataArray +0.009s ... 0.493s
#20 benchmarks composed for output. +0.037s ... 0.53s
#21 calculated avg scores. +0s ... 0.53s
#22 return log +0.002s ... 0.532s
Please share our article, every link counts!
Redaktion, 2017-09- 8 (Update: 2023-07- 1)
 Deutsch
 English
 Español
 Français
 Italiano
 Nederlands
 Polski
 Português
 Русский
 Türkçe
 Svenska
 Chinese
 Magyar