Notebookcheck Logo

Intel Core i9-13900K vs Apple M2 Pro 10-Core

Intel Core i9-13900K

► remove from comparison Intel i9-13900K

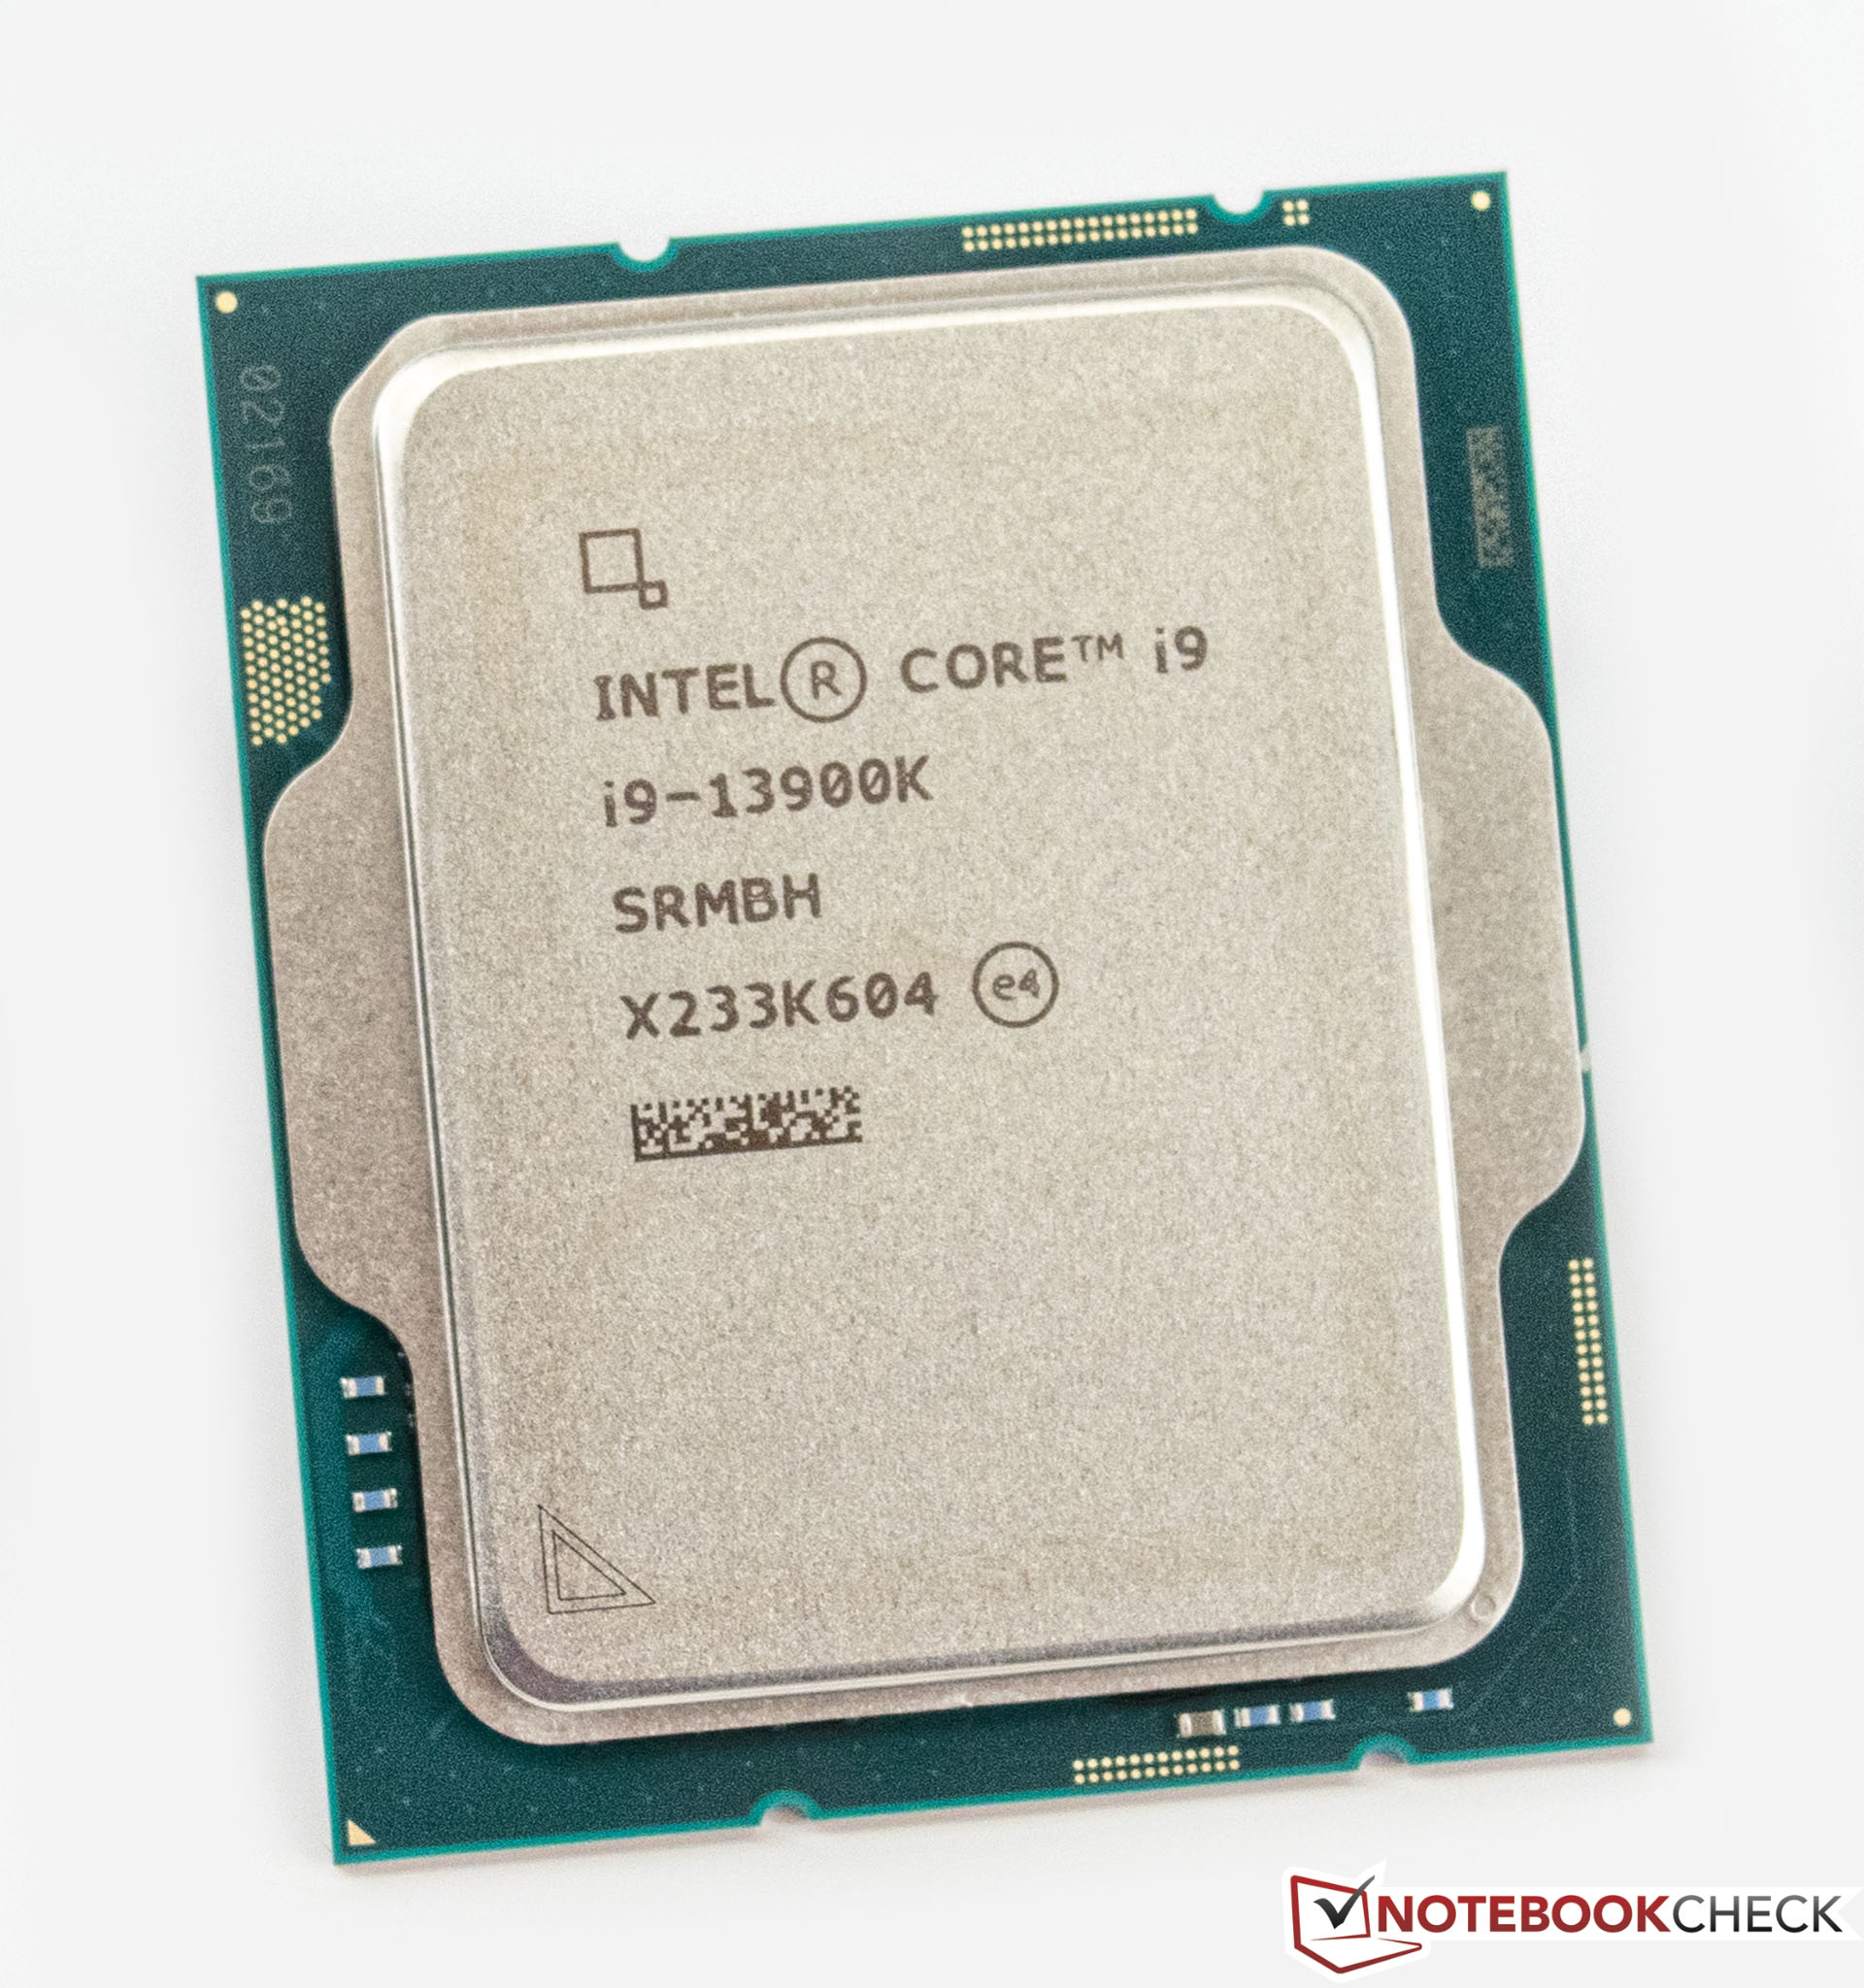
The Intel Core i9-13900K is a fast high-end desktop processor of the Raptor Lake series. It includes a hybrid architecture for the CPU cores with combined 24 cores and 32 threads. Eight fast Raptor Cove performance cores (P-cores) with HyperThreading and a clock speed of 3 - 5.8 GHz and sixteen Gracemont efficiency cores without HyperThreading and a clock speed of 2.2 - 4.3 GHz.

Thanks to the faster P-cores and more E-cores, the i9-13900K is significantly faster than the old i9-12900K (especially in multi-threaded workloads). Compared to the Raphael AMD Ryzen 9 7950X (Zen 4), the 13900K offers a slightly higher multi-thread-performance and a slightly lower single core performance. In games, the Intel CPU is currently the clear winner (at the time of announcement of the 7950X).

The 13900K is rated at 125 Watt TDP base power (PL1) and 253 Watt Turbo Power (PL2) and therefore slightly higher than the old i9-12900K.

Apple M2 Pro 10-Core

► remove from comparison Apple M2 Pro 10-Core

The Apple M2 Pro 10-Core is a System on a Chip (SoC) from Apple that is found in the early 2023 MacBook Pro 14 and Mac Mini entry level models. It offers 10 of the 12 cores available in the chip divided in six performance cores (P-cores) and four power-efficiency cores (E-cores). The E-cores clock with up to 3.4 GHz, the P-Cores up to 3.7 GHz (mostly 3.3 GHz in multi-threaded workloads and 3.4 GHz in single threaded).

The big cores (codename Avalanche) offer 192 KB instruction cache, 128 KB data cache, and 36 MB shared L2 cache (up from 24 MB in the M1 Pro). The four efficiency cores (codename Blizzard) are a lot smaller and offer only 128 KB instruction cache, 64 KB data cache, and 4 MB shared cache. CPU and GPU can both use the 24 MB SLC (System Level Cache). 

The unified memory (16 or 32 GB LPDDR5-6400) next to the chip is connected by a 256 Bit memory controller (200 GB/s bandwidth) and can be used by the GPU and CPU.

The performance of the M2 Pro 10-Core should be similar to the old M1 Pro with all 10 cores. The multi-threaded performance should be slower, as the M2 10-core has two p-cores less (and 2 e-cores more) but the single-threaded performance should be better due to the faster clock speed and architectural improvements. The old M1 Pro 8-core should be noticeably slower.

The integrated graphics card in the M1 Pro 10-core offers all 16 of the 19 cores.

Furthermore, the SoC integrates a fast 16 core neural engine (faster than M1 Pro), a secure enclave (e.g., for encryption), a unified memory architecture, Thunderbolt 4 controller, an ISP, and media de- and encoders (including ProRes).

The M2 Pro is manufactured in 5 nm at TSMC (second generation) and integrates 40 billion transistors. 

ModelIntel Core i9-13900KApple M2 Pro 10-Core
CodenameRaptor Lake
SeriesIntel Raptor Lake-SApple M2
Series: M2
Intel Core i9-13900K « 3 - 5.8 GHz24 / 32 cores36 MB L3
Intel Core i7-13700K compare3.4 - 5.4 GHz16 / 24 cores30 MB L3
Intel Core i5-13600K compare3.5 - 5.1 GHz14 / 20 cores24 MB L3
Intel Core i7-14701TE compare2.1 - 5.2 GHz8 / 16 cores33 MB L3
Intel Core i5-13500 compare2.5 - 4.8 GHz14 / 20 cores24 MB L3
Intel Core i5-14501TE compare2.2 - 5.1 GHz6 / 12 cores12 MB L3
Intel Core i5-14501E compare3.3 - 5.2 GHz6 / 12 cores24 MB L3
Intel Core i5-14401E compare2.5 - 4.7 GHz6 / 12 cores12 MB L3
Intel Core i5-14401TE compare2 - 4.5 GHz6 / 12 cores12 MB L3
Intel Core i5-13500T compare1.6 - 4.6 GHz14 / 20 cores24 MB L3
Apple M2 Max compare2.42 - 3.7 GHz12 / 12 cores48 MB L3
Apple M2 Pro compare2.42 - 3.5 GHz12 / 12 cores24 MB L3
Apple M2 Pro 10-Core « 2.42 - 3.7 GHz10 / 10 cores24 MB L3
Apple M2 compare2.42 - 3.48 GHz8 / 8 cores8 MB L3
Clock3000 - 5800 MHz2424 - 3696 MHz
L2 Cache32 MB36 MB
L3 Cache36 MB24 MB
Cores / Threads24 / 32
8 x 5.8 GHz Intel Raptor Cove P-Core
16 x 4.3 GHz Intel Gracemont E-Core
10 / 10
TDP125 Watt
Technology10 nm5 nm
Die Size257 mm2
max. Temp.100 °C
SocketLGA 1700
FeaturesIntel UHD Graphics 770, DDR5 5600 MT/s, DDR4 3200 MT/sARMv8 Instruction Set
iGPUIntel UHD Graphics 770 (300 - 1650 MHz)Apple M2 Pro 16-Core GPU
Architecturex86ARM
$589 U.S.
Announced
Manufacturerwww.intel.com
L1 Cache7.3 MB
Transistors40000 Million

Benchmarks

Performance Rating - CB R15 + R20 + 7-Zip + X265 + Blender + 3DM11 CPU - i9-13900K
49 pt (82%)
Restrict / Search: Model: Max. age: years
Cinebench R23 - Cinebench R23 Multi Core
min: 32592     avg: 37310     median: 38271.5 (36%)     max: 40103 Points
11811 Points (11%)
Cinebench R23 - Cinebench R23 Single Core
min: 2203     avg: 2238     median: 2238.5 (94%)     max: 2272 Points
1643 Points (69%)
Cinebench R20 - Cinebench R20 CPU (Single Core)
min: 828     avg: 849     median: 849.5 (93%)     max: 870 Points
449 Points (49%)
Cinebench R20 - Cinebench R20 CPU (Multi Core)
min: 13415     avg: 14459     median: 14620.5 (36%)     max: 15181 Points
3235 Points (8%)
Cinebench R15 - Cinebench R15 CPU Multi 64 Bit
min: 5321     avg: 5798     median: 5805.5 (37%)     max: 6191 Points
1664 Points (11%)
Cinebench R15 - Cinebench R15 CPU Single 64 Bit
min: 299     avg: 314.1     median: 318 (88%)     max: 328 Points
231 Points (64%)
Cinebench R11.5 - Cinebench R11.5 CPU Multi 64 Bit
min: 62.2     avg: 67     median: 67.5 (87%)     max: 70.78 Points
Cinebench R11.5 - Cinebench R11.5 CPU Single 64 Bit
min: 3.8     avg: 3.9     median: 3.9 (92%)     max: 3.93 Points
Cinebench R10 - Cinebench R10 Rend. Single (32bit)
min: 11661     avg: 11989     median: 12017.5 (73%)     max: 12259 Points
Cinebench R10 - Cinebench R10 Rend. Multi (32bit)
min: 85342     avg: 88253     median: 87738 (64%)     max: 92192 Points
Cinebench R10 - Cinebench R10 Rend. Multi (64bit)
min: 132000     avg: 134526     median: 133567 (85%)     max: 138969 Points
Cinebench R10 - Cinebench R10 Rend. Single (64bit)
min: 17418     avg: 17943     median: 17998.5 (22%)     max: 18355 Points
wPrime 2.10 - wPrime 2.0 1024m *
min: 79.738     avg: 84.6     median: 84.2 (1%)     max: 90.13 s
wPrime 2.10 - wPrime 2.0 32m *
min: 1.818     avg: 2.1     median: 2 (0%)     max: 2.305 s
WinRAR - WinRAR 4.0
min: 13210     avg: 14265     median: 14271 (23%)     max: 15309 Points
7-Zip 18.03 - 7-Zip 18.03 Multi Thread 4 runs
min: 127201     avg: 142777     median: 146984 (84%)     max: 148053 MIPS
7-Zip 18.03 - 7-Zip 18.03 Single Thread 4 runs
min: 7176     avg: 7343     median: 7272 (86%)     max: 7539 MIPS
X264 HD Benchmark 4.0 - x264 Pass 2
min: 247.5     avg: 261.5     median: 264.8 (7%)     max: 269 fps
X264 HD Benchmark 4.0 - x264 Pass 1
min: 412     avg: 419     median: 419.3 (11%)     max: 425.5 fps
HWBOT x265 Benchmark v2.2 - HWBOT x265 4k Preset
min: 34.5     avg: 39.9     median: 40.7 (72%)     max: 42.6 fps
TrueCrypt - TrueCrypt Serpent
min: 2.6     avg: 2.9     median: 2.9 (85%)     max: 3 GB/s
TrueCrypt - TrueCrypt Twofish
min: 5.2     avg: 5.4     median: 5.4 (93%)     max: 5.4 GB/s
TrueCrypt - TrueCrypt AES
min: 20.5     avg: 23.3     median: 22.9 (60%)     max: 27 GB/s
Blender - Blender 3.3 Classroom CPU *
min: 136     avg: 145.2     median: 140.5 (2%)     max: 174 Seconds
435 Seconds (6%)
Blender - Blender 2.79 BMW27 CPU *
min: 80     avg: 85.7     median: 84 (1%)     max: 101 Seconds
415 Seconds (3%)
R Benchmark 2.5 - R Benchmark 2.5 *
min: 0.3468     avg: 0.4     median: 0.4 (8%)     max: 0.3911 sec
3DMark 06 - CPU - 3DMark 06 - CPU
min: 19989     avg: 20578     median: 20192 (43%)     max: 21934 Points
Super Pi mod 1.5 XS 1M - Super Pi mod 1.5 XS 1M *
min: 5.655     avg: 5.7     median: 5.7 (1%)     max: 5.86 s
Super Pi mod 1.5 XS 2M - Super Pi mod 1.5 XS 2M *
min: 12.287     avg: 12.6     median: 12.5 (1%)     max: 13.193 s
Super Pi Mod 1.5 XS 32M - Super Pi mod 1.5 XS 32M *
min: 289.628     avg: 296.6     median: 293.3 (1%)     max: 310.125 s
3DMark Vantage - 3DM Vant. Perf. CPU no Physx
min: 86915     avg: 97290     median: 96473 (74%)     max: 112434 Points
3DMark 11 - 3DM11 Performance Physics
min: 29023     avg: 31289     median: 31187.5 (77%)     max: 33181 Points
3DMark - 3DMark Ice Storm Physics
min: 79257     avg: 97847     median: 97246.5 (79%)     max: 111988 Points
3DMark - 3DMark Ice Storm Extreme Physics
min: 80320     avg: 96904     median: 97919.5 (79%)     max: 102987 Points
3DMark - 3DMark Ice Storm Unlimited Physics
min: 83056     avg: 98634     median: 97311 (78%)     max: 105981 Points
3DMark - 3DMark Cloud Gate Physics
min: 26626     avg: 29034     median: 29044.5 (73%)     max: 30955 Points
3DMark - 3DMark Fire Strike Standard Physics
min: 46013     avg: 51456     median: 51140 (91%)     max: 54226 Points
3DMark - 3DMark Time Spy CPU
min: 16236     avg: 20507     median: 20037 (84%)     max: 22794 Points
Geekbench 6.5 - Geekbench 6.5 Single-Core
3070 Points (77%)
2668 Points (67%)
Geekbench 6.5 - Geekbench 6.5 Multi-Core
20800 Points (81%)
12943 Points (50%)
Geekbench 6.0 - Geekbench 6.0 Single-Core
2653 Points (84%)
Geekbench 6.0 - Geekbench 6.0 Multi-Core
12168 Points (50%)
Geekbench 5.5 - Geekbench 5.1 - 5.5 64 Bit Single-Core
min: 2106     avg: 2237     median: 2286 (87%)     max: 2290 Points
min: 1926     avg: 1937     median: 1936.5 (73%)     max: 1947 Points
Geekbench 5.5 - Geekbench 5.1 - 5.5 64 Bit Multi-Core
min: 22448     avg: 23743     median: 24033 (43%)     max: 24157 Points
min: 12074     avg: 12132     median: 12131.5 (22%)     max: 12189 Points
Geekbench 5.0 - Geekbench 5.0 64 Bit Single-Core
min: 2148     avg: 2191     median: 2197 (10%)     max: 2246 Points
Geekbench 5.0 - Geekbench 5.0 64 Bit Multi-Core
min: 22024     avg: 23446     median: 23664 (75%)     max: 24021 Points
Geekbench 4.4 - Geekbench 4.1 - 4.4 64 Bit Single-Core
min: 9218     avg: 9542     median: 9598 (96%)     max: 9683 Points
Geekbench 4.4 - Geekbench 4.1 - 4.4 64 Bit Multi-Core
min: 77347     avg: 84105     median: 85336 (84%)     max: 86695 Points
Mozilla Kraken 1.1 - Kraken 1.1 Total Score *
min: 423     avg: 430.6     median: 432 (1%)     max: 438 ms
447.4 ms (1%)
Octane V2 - Octane V2 Total Score
75471 Points (55%)
WebXPRT 4 - WebXPRT 4 Score
min: 304     avg: 317.6     median: 316 (87%)     max: 335 Points
250 Points (69%)
WebXPRT 3 - WebXPRT 3 Score
min: 338     avg: 364     median: 368 (66%)     max: 382 Points
391 Points (70%)
CrossMark - CrossMark Overall
min: 2263     avg: 2497     median: 2580 (96%)     max: 2589 Points
1772 Points (66%)
Power Consumption - Prime95 Power Consumption - external Monitor *
min: 228     avg: 354.3     median: 359 (62%)     max: 471 Watt
Power Consumption - Cinebench R15 Multi Power Consumption - external Monitor *
min: 349     avg: 392.5     median: 370.5 (68%)     max: 480 Watt
2.2 Watt (1%)
Power Consumption - Idle Power Consumption 150cd 1min *
5.2 Watt (6%)
Power Consumption - Power Efficiency - Cinebench R15 Multi external Monitor
min: 12.9     avg: 15     median: 15.2 (11%)     max: 16.8 Points per Watt

Average Benchmarks Intel Core i9-13900K → 100% n=16

Average Benchmarks Apple M2 Pro 10-Core → 61% n=16

- Range of benchmark values for this graphics card
red legend - Average benchmark values for this graphics card
* Smaller numbers mean a higher performance
1 This benchmark is not used for the average calculation

Add one or more devices and compare

In the following list you can select (and also search for) devices that should be added to the comparison. You can select more than one device.

restrict list:
v1.33
log 30. 08:15:44

#0 ran 0s before starting gpusingle class +0s ... 0s

#1 checking url part for id 14625 +0s ... 0s

#2 checking url part for id 14977 +0s ... 0s

#3 redirected to Ajax server, took 1759212943s time from redirect:0 +0s ... 0s

#4 did not recreate cache, as it is less than 5 days old! Created at Mon, 29 Sep 2025 12:06:34 +0200 +0s ... 0s

#5 composed specs +0.005s ... 0.005s

#6 did output specs +0s ... 0.005s

#7 getting avg benchmarks for device 14625 +0.004s ... 0.009s

#8 got single benchmarks 14625 +0.021s ... 0.031s

#9 getting avg benchmarks for device 14977 +0.001s ... 0.031s

#10 got single benchmarks 14977 +0.004s ... 0.035s

#11 got avg benchmarks for devices +0s ... 0.035s

#12 min, max, avg, median took s +0.041s ... 0.077s

#13 return log +0.003s ... 0.079s

Please share our article, every link counts!
Mail Logo
> Expert Reviews and News on Laptops, Smartphones and Tech Innovations > Benchmarks / Tech > Processor Comparison - Head 2 Head
Redaktion, 2017-09- 8 (Update: 2023-07- 1)