Notebookcheck Logo

Intel Core i7-9850H vs Intel Core i5-11500B

Intel Core i7-9850H

► remove from comparison Intel i7-9850H

The Intel Core i7-9850H is a high-end processor for laptops with six cores based on the Coffee Lake architecture (2019 refresh, CFL-HR). The processor clocks at between 2.6 and 4.6 GHz (4 GHz with 6 cores) and can execute up to twelve threads simultaneously thanks to Hyper-Threading. According to Intel, the CPU is manufactured in an improved 14nm (14nm++) process. Compared to the predecessor, the Core i7-8850H, the 9850H offers only improved clock rates.

The Coffee Lake architecture is similar to Kaby Lake and differs only in the amount of cores (now six cores for the high end versions) and the improved 14nm process (14nm++ according to Intel).

Performance

Due to the two additional cores, performance has increased by almost 50% compared to a similar clocked Kaby Lake processor like the Core i7-7920HQ (3.1 - 4.1 GHz). Single-core performance has not improved since its Kaby Lake predecessor. Compared to the i7-8850H, the performance improved only slightly.

Graphics

The integrated Intel UHD Graphics 630 iGPU is supposed to offer a slightly higher performance as its clock rate has been increased by 50 MHz (rumored). The architecture is identical to that of the Intel HD Graphics 630. We do expect a performance improvement, but as a low-end solution it will probably only display current games smoothly at reduced details - if at all.

Power Consumption

Intel specifies the TDP with 45 watts and therefore the i7 is only suited for big laptops with good cooling solutions. Using cTDP-down, the CPU can also be configured to 35 Watt resulting in a reduced performance.

Intel Core i5-11500B

► remove from comparison Intel i5-11500B

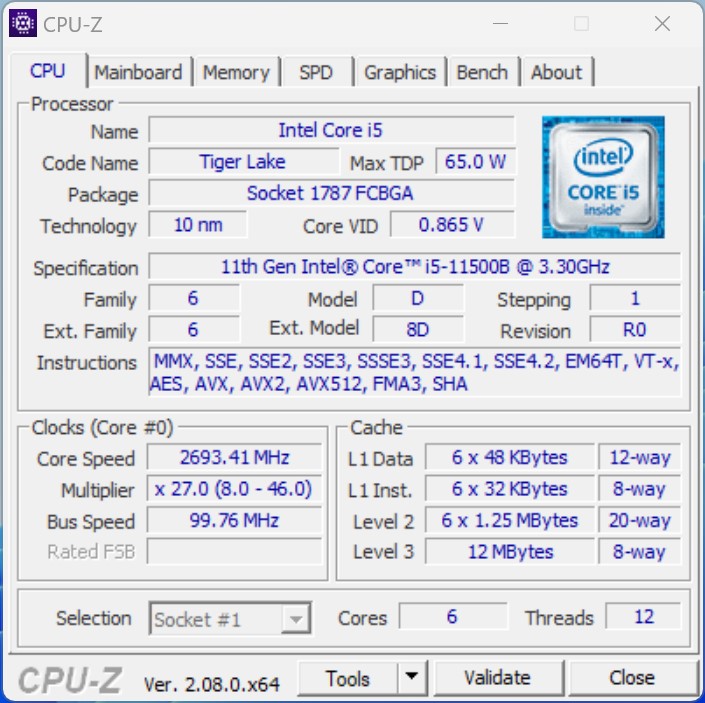
The Intel Core i5-11500B is a hexa-core processor for desktops and mini PCs. It is based on the Tiger Lake architecture (H45) and was presented in Q2 2021. The chip offers a TDP of 65 watts (configurable). The six processor cores can clock from 3.3 to 4.6 GHz (single-core turbo). The processor offers 12 MB level 3 cache and supports DDR4 RAM with up to 3,200 MT/s. The integrated graphics are based on the Xe architecture and are named UHD Graphics (32 EUs). In the 11500B it clocks from 350 to 1,450 MHz. The chip is manufactured using the 10 nm SuperFin process.

Performance

The performance of the Intel Core i5-11500B depends primarily on the performance of the installed cooling unit. The TDP of the SoC can also be lowered. In principle, however, the Intel Core i5-11500B should offer slightly more performance than an Intel Core i5-11400H (6 cores 2.7 - 4.5 GHz).

Features

As with the smaller Tiger Lake chips, Wi-Fi (Wi-Fi 6E) and Thunderbolt 4 / USB 4 are (partially) integrated into the chip for faster, cheaper and space-saving implementations in desktops and mini-PCs. The i5-11500B also offers 20 PCIe 4.0 lanes.

ModelIntel Core i7-9850HIntel Core i5-11500B
CodenameCoffee Lake-HTiger Lake-H
SeriesIntel Coffee LakeIntel Tiger Lake
Series: Tiger Lake Tiger Lake-H
Intel Core i9-9980HK compare2.4 - 5 GHz8 / 16 cores16 MB L3
Intel Core i9-9880H compare2.3 - 4.8 GHz8 / 16 cores16 MB L3
Intel Core i9-8950HK compare2.9 - 4.8 GHz6 / 12 cores12 MB L3
Intel Xeon E-2186M compare2.9 - 4.8 GHz6 / 12 cores12 MB L3
Intel Xeon E-2276M compare2.8 - 4.7 GHz6 / 12 cores12 MB L3
Intel Core i7-9850H « 2.6 - 4.6 GHz6 / 12 cores12 MB L3
Intel Core i7-9750H compare2.6 - 4.5 GHz6 / 12 cores12 MB L3
Intel Xeon E-2176M compare2.7 - 4.4 GHz6 / 12 cores12 MB L3
Intel Core i7-8850H compare2.6 - 4.3 GHz6 / 12 cores9 MB L3
Intel Core i7-8750H compare2.2 - 4.1 GHz6 / 12 cores9 MB L3
Intel Core i5-9400H compare2.5 - 4.3 GHz4 / 8 cores8 MB L3
Intel Core i5-9300HF compare2.4 - 4.1 GHz4 / 8 cores8 MB L3
Intel Core i5-9300H compare2.4 - 4.1 GHz4 / 8 cores8 MB L3
Intel Core i5-8400H compare2.5 - 4.2 GHz4 / 8 cores8 MB L3
Intel Core i5-8300H compare2.3 - 4 GHz4 / 8 cores8 MB L3
Intel Core i3-8100H compare3 GHz4 / 4 cores8 MB L3
Intel Core i9-11900KB compare3.3 - 5.3 GHz8 / 16 cores24 MB L3
Intel Core i9-11900H compare2.5 - 4.9 GHz8 / 16 cores24 MB L3
Intel Core i9-11950H compare2.6 - 5 GHz8 / 16 cores24 MB L3
Intel Xeon W-11955M compare2.6 - 5 GHz8 / 16 cores24 MB L3
Intel Core i7-11850H compare2.5 - 4.8 GHz8 / 16 cores24 MB L3
Intel Core i7-11800H compare2.3 - 4.6 GHz8 / 16 cores24 MB L3
Intel Xeon W-11855M compare3.2 - 4.9 GHz6 / 12 cores18 MB L3
Intel Core i5-11500B « 3.3 - 4.6 GHz6 / 12 cores12 MB L3
Intel Core i5-11400H compare2.7 - 4.5 GHz6 / 12 cores12 MB L3
Intel Core i5-11260H compare2.6 - 4.4 GHz6 / 12 cores12 MB L3
Clock2600 - 4600 MHz3300 - 4600 MHz
L1 Cache384 KB480 KB
L2 Cache1.5 MB7.5 MB
L3 Cache12 MB12 MB
Cores / Threads6 / 126 / 12
TDP45 Watt65 Watt
Technology14 nm10 nm
SocketFCBGA1440BGA1787
FeaturesDual-Channel DDR4 Memory Controller, HyperThreading, AVX, AVX2, Quick Sync, Virtualization, AES-NIDDR4-3200 RAM, PCIe 4, 8 GT/s bus, DL Boost, GNA, MMX, SSE, SSE2, SSE3, SSSE3, SSE4.1, SSE4.2, AVX, AVX2, AVX-512, BMI2, ABM, FMA, ADX, VMX, SMEP, SMAP, EIST, TM1, TM2, HT, Turbo, SST, AES-NI, RDRAND, RDSEED, SHA
iGPUIntel UHD Graphics 630 (350 - 1150 MHz)Intel UHD Graphics Xe 32EUs (Tiger Lake-H) (350 - 1450 MHz)
Architecturex86x86
Announced
max. Temp.100 °C

Benchmarks

Performance Rating - CB R15 + R20 + 7-Zip + X265 + Blender + 3DM11 CPU - i7-9850H
30.3 pt (50%)
Restrict / Search: Model: Max. age: years
Performance Rating - CB R15 + R20 + 7-Zip + X265 + Blender + 3DM11 CPU - i5-11500B
33.7 pt (56%)
Restrict / Search: Model: Max. age: years
Cinebench 2024 - Cinebench 2024 CPU Single Core
88 Points (49%)
Cinebench 2024 - Cinebench 2024 CPU Multi Core
451 Points (8%)
Cinebench R23 - Cinebench R23 Multi Core
8318 Points (8%)
Cinebench R23 - Cinebench R23 Single Core
1484 Points (62%)
Cinebench R20 - Cinebench R20 CPU (Single Core)
min: 425     avg: 439.5     median: 439.5 (48%)     max: 454 Points
566 Points (62%)
Cinebench R20 - Cinebench R20 CPU (Multi Core)
min: 1800     avg: 2114     median: 2114 (5%)     max: 2428 Points
3236 Points (8%)
Cinebench R15 - Cinebench R15 CPU Multi 64 Bit
min: 1114     avg: 1205     median: 1230 (8%)     max: 1272 Points
1322 Points (8%)
Cinebench R15 - Cinebench R15 CPU Single 64 Bit
min: 192     avg: 193.8     median: 193 (53%)     max: 196.5 Points
223 Points (62%)
Cinebench R11.5 - Cinebench R11.5 CPU Multi 64 Bit
12.5 Points (16%)
15 Points (19%)
Cinebench R11.5 - Cinebench R11.5 CPU Single 64 Bit
2.1 Points (51%)
2.6 Points (62%)
Cinebench R10 - Cinebench R10 Rend. Single (32bit)
7169 Points (43%)
9000 Points (54%)
Cinebench R10 - Cinebench R10 Rend. Multi (32bit)
31938 Points (23%)
41001 Points (30%)
Cinebench R10 - Cinebench R10 Rend. Multi (64bit)
42090 Points (27%)
54928 Points (35%)
Cinebench R10 - Cinebench R10 Rend. Single (64bit)
9224 Points (11%)
11802 Points (14%)
wPrime 2.10 - wPrime 2.0 1024m *
278 s (3%)
152 s (2%)
wPrime 2.10 - wPrime 2.0 32m *
8.3 s (2%)
4.6 s (1%)
WinRAR - WinRAR 4.0
5621 Points (9%)
6789 Points (11%)
7-Zip 18.03 - 7-Zip 18.03 Multi Thread 4 runs
min: 25786     avg: 29714     median: 31087 (18%)     max: 32268 MIPS
36194 MIPS (21%)
7-Zip 18.03 - 7-Zip 18.03 Single Thread 4 runs
min: 5020     avg: 5066     median: 5086 (60%)     max: 5092 MIPS
5498 MIPS (65%)
X264 HD Benchmark 4.0 - x264 Pass 2
68.3 fps (2%)
68.7 fps (2%)
X264 HD Benchmark 4.0 - x264 Pass 1
201.3 fps (5%)
234.5 fps (6%)
HWBOT x265 Benchmark v2.2 - HWBOT x265 4k Preset
min: 7     avg: 8.4     median: 9 (16%)     max: 9.1 fps
10.3 fps (18%)
TrueCrypt - TrueCrypt Serpent
0.8 GB/s (22%)
0.8 GB/s (24%)
TrueCrypt - TrueCrypt Twofish
1.2 GB/s (21%)
1.3 GB/s (22%)
TrueCrypt - TrueCrypt AES
7.4 GB/s (19%)
8.3 GB/s (22%)
Blender - Blender 3.3 Classroom CPU *
673 Seconds (9%)
Blender - Blender 2.79 BMW27 CPU *
min: 411     avg: 459.3     median: 415 (3%)     max: 552 Seconds
379 Seconds (3%)
R Benchmark 2.5 - R Benchmark 2.5 *
0.6 sec (12%)
3DMark 06 - CPU - 3DMark 06 - CPU
min: 9137     avg: 10056     median: 10056 (21%)     max: 10975 Points
12580 Points (27%)
Super Pi mod 1.5 XS 1M - Super Pi mod 1.5 XS 1M *
8.2 s (2%)
7.3 s (2%)
Super Pi mod 1.5 XS 2M - Super Pi mod 1.5 XS 2M *
18.1 s (1%)
16 s (1%)
Super Pi Mod 1.5 XS 32M - Super Pi mod 1.5 XS 32M *
467.6 s (2%)
373 s (2%)
3DMark Vantage - 3DM Vant. Perf. CPU no Physx
min: 26292     avg: 34763     median: 37665 (29%)     max: 40333 Points
47824 Points (37%)
3DMark 11 - 3DM11 Performance Physics
min: 9987     avg: 11361     median: 11512 (28%)     max: 12585 Points
13784 Points (34%)
3DMark - 3DMark Ice Storm Physics
min: 54664     avg: 57802     median: 56870 (46%)     max: 61872 Points
70795 Points (58%)
3DMark - 3DMark Ice Storm Extreme Physics
70878 Points (58%)
3DMark - 3DMark Ice Storm Unlimited Physics
74085 Points (59%)
3DMark - 3DMark Cloud Gate Physics
min: 8390     avg: 9853     median: 9841 (25%)     max: 11328 Points
12557 Points (32%)
3DMark - 3DMark Fire Strike Standard Physics
min: 14059     avg: 15802     median: 15330 (27%)     max: 18016 Points
19930 Points (36%)
3DMark - 3DMark Time Spy CPU
min: 4588     avg: 5605     median: 5953 (25%)     max: 6275 Points
7021 Points (30%)
Geekbench 6.5 - Geekbench 6.5 Single-Core
2173 Points (53%)
Geekbench 6.5 - Geekbench 6.5 Multi-Core
8148 Points (32%)
Geekbench 6.0 - Geekbench 6.0 Single-Core
2058 Points (65%)
Geekbench 6.0 - Geekbench 6.0 Multi-Core
7760 Points (32%)
Geekbench 5.5 - Geekbench 5.1 - 5.5 64 Bit Single-Core
1150 Points (44%)
1566 Points (59%)
Geekbench 5.5 - Geekbench 5.1 - 5.5 64 Bit Multi-Core
5270 Points (9%)
7132 Points (13%)
Geekbench 5.0 - Geekbench 5.0 64 Bit Single-Core
min: 1135     avg: 1169     median: 1169 (5%)     max: 1203 Points
1535 Points (7%)
Geekbench 5.0 - Geekbench 5.0 64 Bit Multi-Core
min: 5353     avg: 5620     median: 5619.5 (18%)     max: 5886 Points
7012 Points (22%)
Geekbench 4.4 - Geekbench 4.1 - 4.4 64 Bit Single-Core
min: 5320     avg: 5509     median: 5594 (56%)     max: 5614 Points
6663 Points (67%)
Geekbench 4.4 - Geekbench 4.1 - 4.4 64 Bit Multi-Core
min: 18098     avg: 22010     median: 23715 (23%)     max: 24218 Points
28454 Points (28%)
Geekbench 4.0 - Geekbench 4.0 64 Bit Single-Core
5376 Points (59%)
Geekbench 4.0 - Geekbench 4.0 64 Bit Multi-Core
20077 Points (26%)
Mozilla Kraken 1.1 - Kraken 1.1 Total Score *
min: 1010     avg: 1018     median: 1015 (1%)     max: 1028 ms
649 ms (1%)
Octane V2 - Octane V2 Total Score
min: 38630     avg: 39090     median: 39091 (29%)     max: 39548 Points
WebXPRT 3 - WebXPRT 3 Score
271 Points (49%)
CrossMark - CrossMark Overall
1416 Points (53%)
Power Consumption - Prime95 Power Consumption - external Monitor *
75.7 Watt (13%)
Power Consumption - Cinebench R15 Multi Power Consumption - external Monitor *
95 Watt (17%)
Power Consumption - Idle Power Consumption - external Monitor *
14.5 Watt (10%)
Power Consumption - Power Efficiency - Cinebench R15 Multi external Monitor
13.9 Points per Watt (10%)

Average Benchmarks Intel Core i7-9850H → 100% n=39

Average Benchmarks Intel Core i5-11500B → 125% n=39

- Range of benchmark values for this graphics card
red legend - Average benchmark values for this graphics card
* Smaller numbers mean a higher performance
1 This benchmark is not used for the average calculation

Add one or more devices and compare

In the following list you can select (and also search for) devices that should be added to the comparison. You can select more than one device.

restrict list:
v1.34
log 09. 04:16:46

#0 ran 0s before starting gpusingle class +0s ... 0s

#1 checking url part for id 11350 +0s ... 0s

#2 checking url part for id 17400 +0s ... 0s

#3 redirected to Ajax server, took 1759976206s time from redirect:0 +0s ... 0s

#4 did not recreate cache, as it is less than 5 days old! Created at Tue, 07 Oct 2025 05:18:31 +0200 +0s ... 0s

#5 composed specs +0.004s ... 0.004s

#6 did output specs +0s ... 0.004s

#7 getting avg benchmarks for device 11350 +0.001s ... 0.006s

#8 got single benchmarks 11350 +0.001s ... 0.007s

#9 getting avg benchmarks for device 17400 +0.004s ... 0.011s

#10 got single benchmarks 17400 +0.006s ... 0.016s

#11 got avg benchmarks for devices +0s ... 0.016s

#12 min, max, avg, median took s +0.032s ... 0.048s

#13 return log +0.008s ... 0.056s

Please share our article, every link counts!
Mail Logo
> Expert Reviews and News on Laptops, Smartphones and Tech Innovations > Benchmarks / Tech > Processor Comparison - Head 2 Head
Redaktion, 2017-09- 8 (Update: 2023-07- 1)