Notebookcheck Logo

Intel Core i7-12700K vs Intel Processor N95 vs Intel Core i5-12600K

Intel Core i7-12700K

► remove from comparison Intel i7-12700K

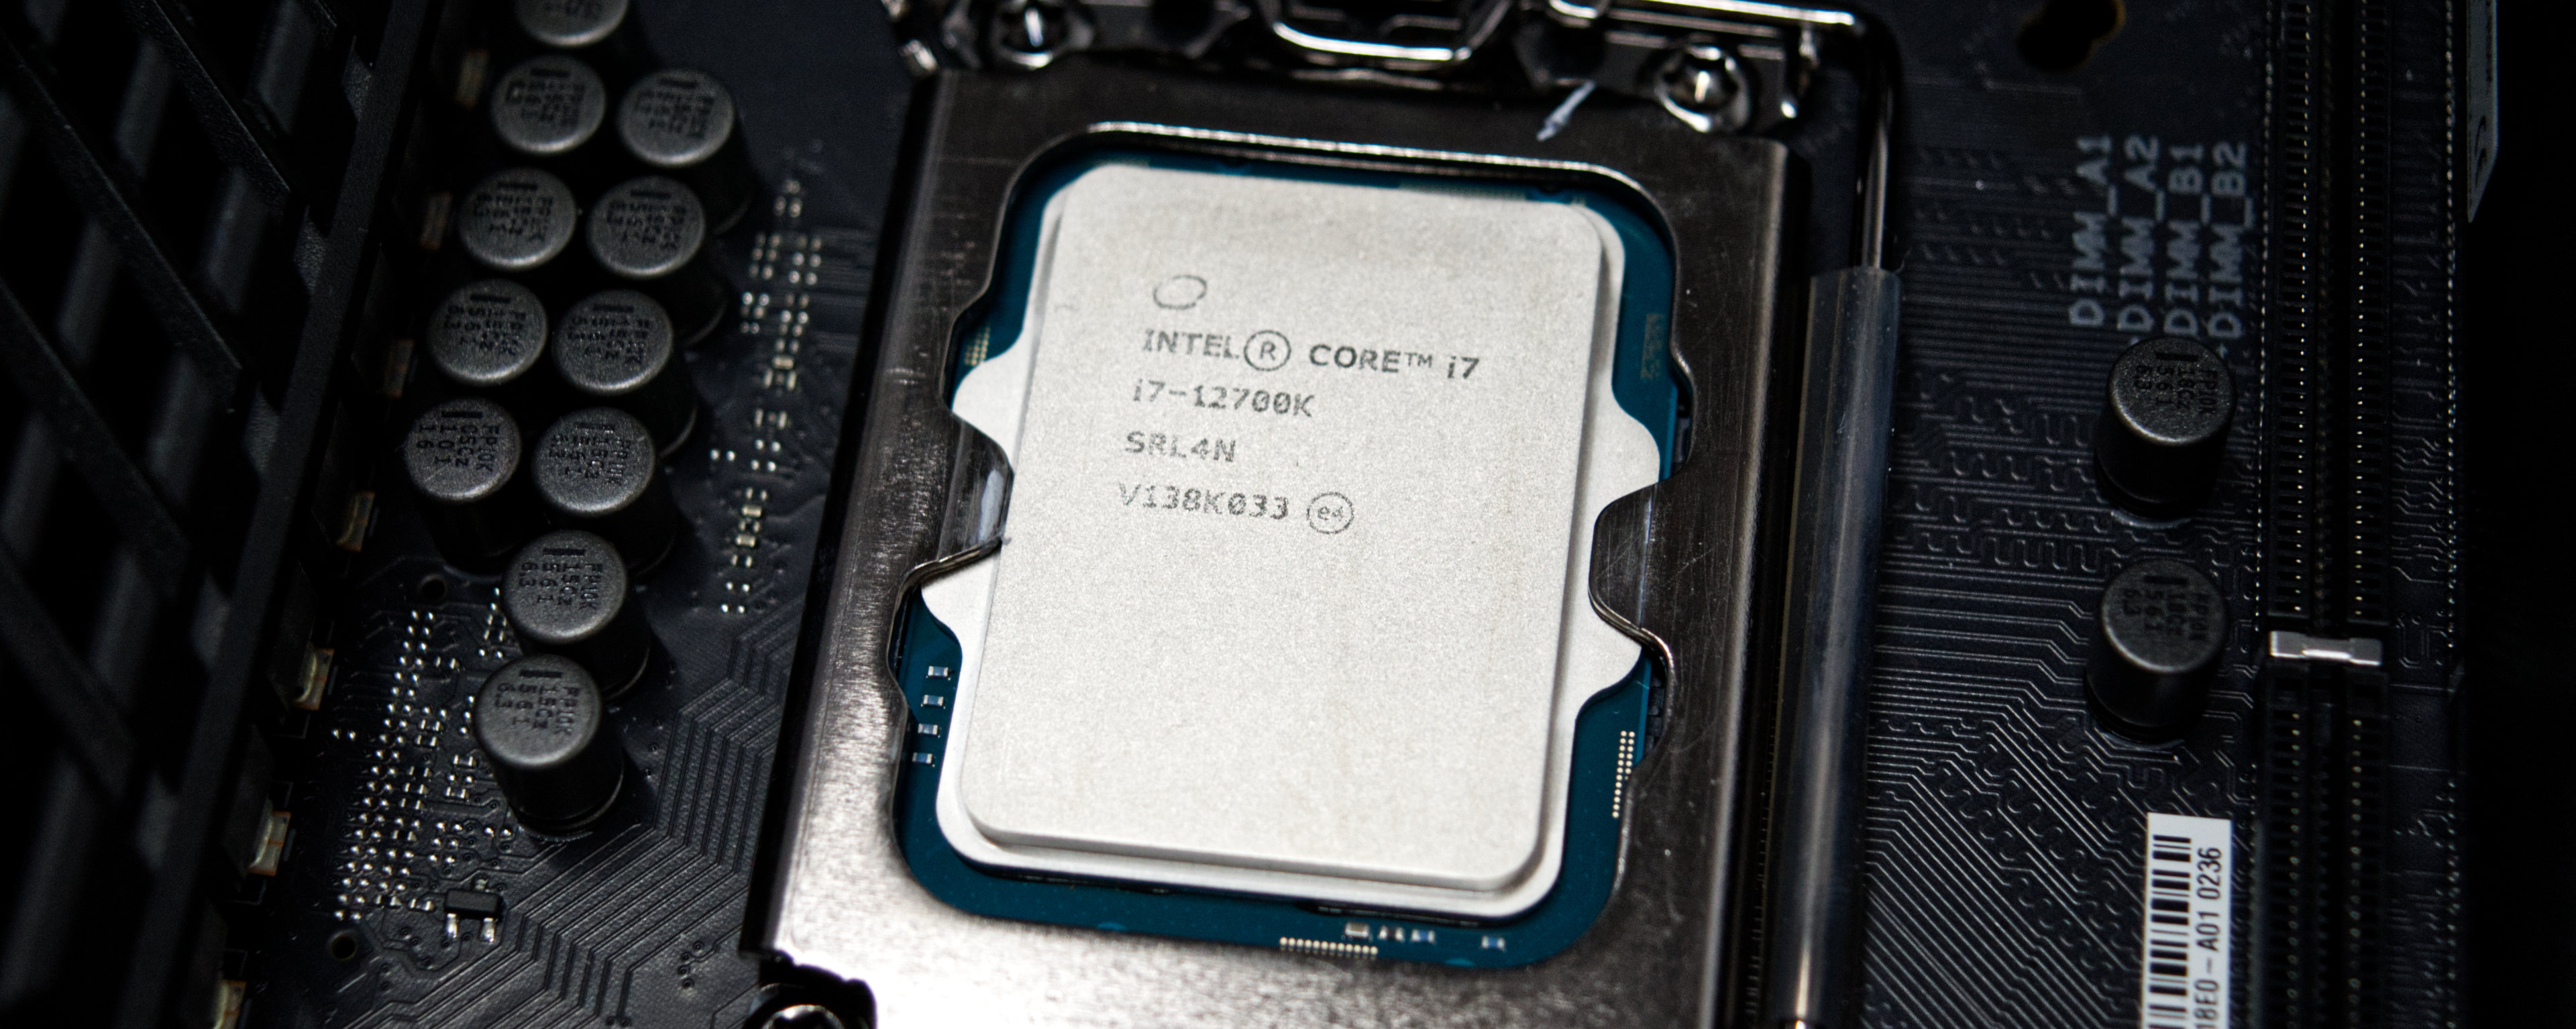
The Intel Core i7-12700K is a high end CPU for desktops based on the Alder Lake architecture. It was first announced in November 2021 and offers 8 performance cores and 4 efficiency cores. The performance cores (P-cores) support HyperThreading, leading to 20 Threads that can be processed at once. The performance cores can clock with up to 5 GHz (Turbo Boost Max 3.0), the efficiency cores can clock with up to 3.9 GHz. All cores can use 25 MB Smart Cache. The integrated memory controller supports up to 128 GB DDR5 with 4800 MT/s (dual channel).

Thread Director (in hardware) can support the operating system to decide which thread to use on the performance or efficiency cores for the best performance.

The integrated graphics adapter is based on the Xe-architecture and called Intel UHD Graphics 770. It clocks between 300 and 1.5 GHz.

For AI tasks, the CPU also integrates GNA 3.0 and DL Boost. Quick Sync in version 8 is the same as in the Rocket Lake CPUs and supports MPEG-2, AVC, VC-1 decode, JPEG, VP8 decode, VP9, HEVC and AV1 decode in hardware.

Performance

The average 12700K in our database is way ahead of the Ryzen 7 5800X and the Ryzen 9 3900X, as far as multi-thread benchmark scores are concerned. Which is a very, very impressive result, as of late 2022.

Power consumption

This Core i7 series chip has a Base power consumption of 125 W, with its highest Intel-recommended Turbo power consumption sitting at 190 W. It might be a good idea to get an AIO cooling solution for a chip this power hungry.

The i7-12700K is manufactured on Intel's fourth-generation 10 nm process marketed as Intel 7 for lower-than-average, as of early 2023, energy efficiency.

Intel Processor N95

► remove from comparison Intel N95

The Intel Processor N95 (sometimes also called Celeron N95 or Pentium N95) is an entry-level mobile CPU for thin and light laptops from the Alder Lake-N series. It was announced in early 2023 and offers no performance cores and 4 of the 8 efficient cores (E-cores, Gracemont architecture). The chip does not support HyperThreading and clocks with up to 3.4 GHz. The performance of the E-cores should be similar to old Skylake cores (compare to the Core i7-6700HQ). All cores can use up to 6 MB L3-cache. Compared to the similar Processor N100, the N95 offers a slightly higher TDP and therefore maybe a slightly improved sustained performance.

Performance

The average N95 in our database is in the same league as the Pentium 7505 and the Core i3-1115G4, as far as multi-thread benchmark scores are concerned. That's not a great result, to put it mildly.

Your mileage may vary depending on how high the CPU power limits are and how competent the cooling solution of your system is.

Features

The Alder Lake-N chips only support single channel memory with up to DDR5-4800, DDR4-3200 or LPDDR5-4800. The chip also supports Quick Sync and AV1 decoding (most likely same engine as in Alder Lake). Furthermore, Wi-Fi 6E and Bluetooth 5.2 are partly integrated (but no Thunderbolt). External chips can be connected via PCIe Gen3 x9 (via the PCH).

The integrated graphics adapter is based on the Xe-architecture and offers only 16 of the 32 EUs (Execution Units) operating at only 1200 MHz. Due to the single channel memory, low clock speeds, and low shader count, the gaming performance of the iGPU is very limited.

Power consumption

The N95 has a base power consumption of 12 W (compared to the 6 W of the N100) and is therefore well suited for thin and light systems. The CPU is built with a further improved 10nm SuperFin process at Intel (called Intel 7).

Intel Core i5-12600K

► remove from comparison Intel i5-12600K

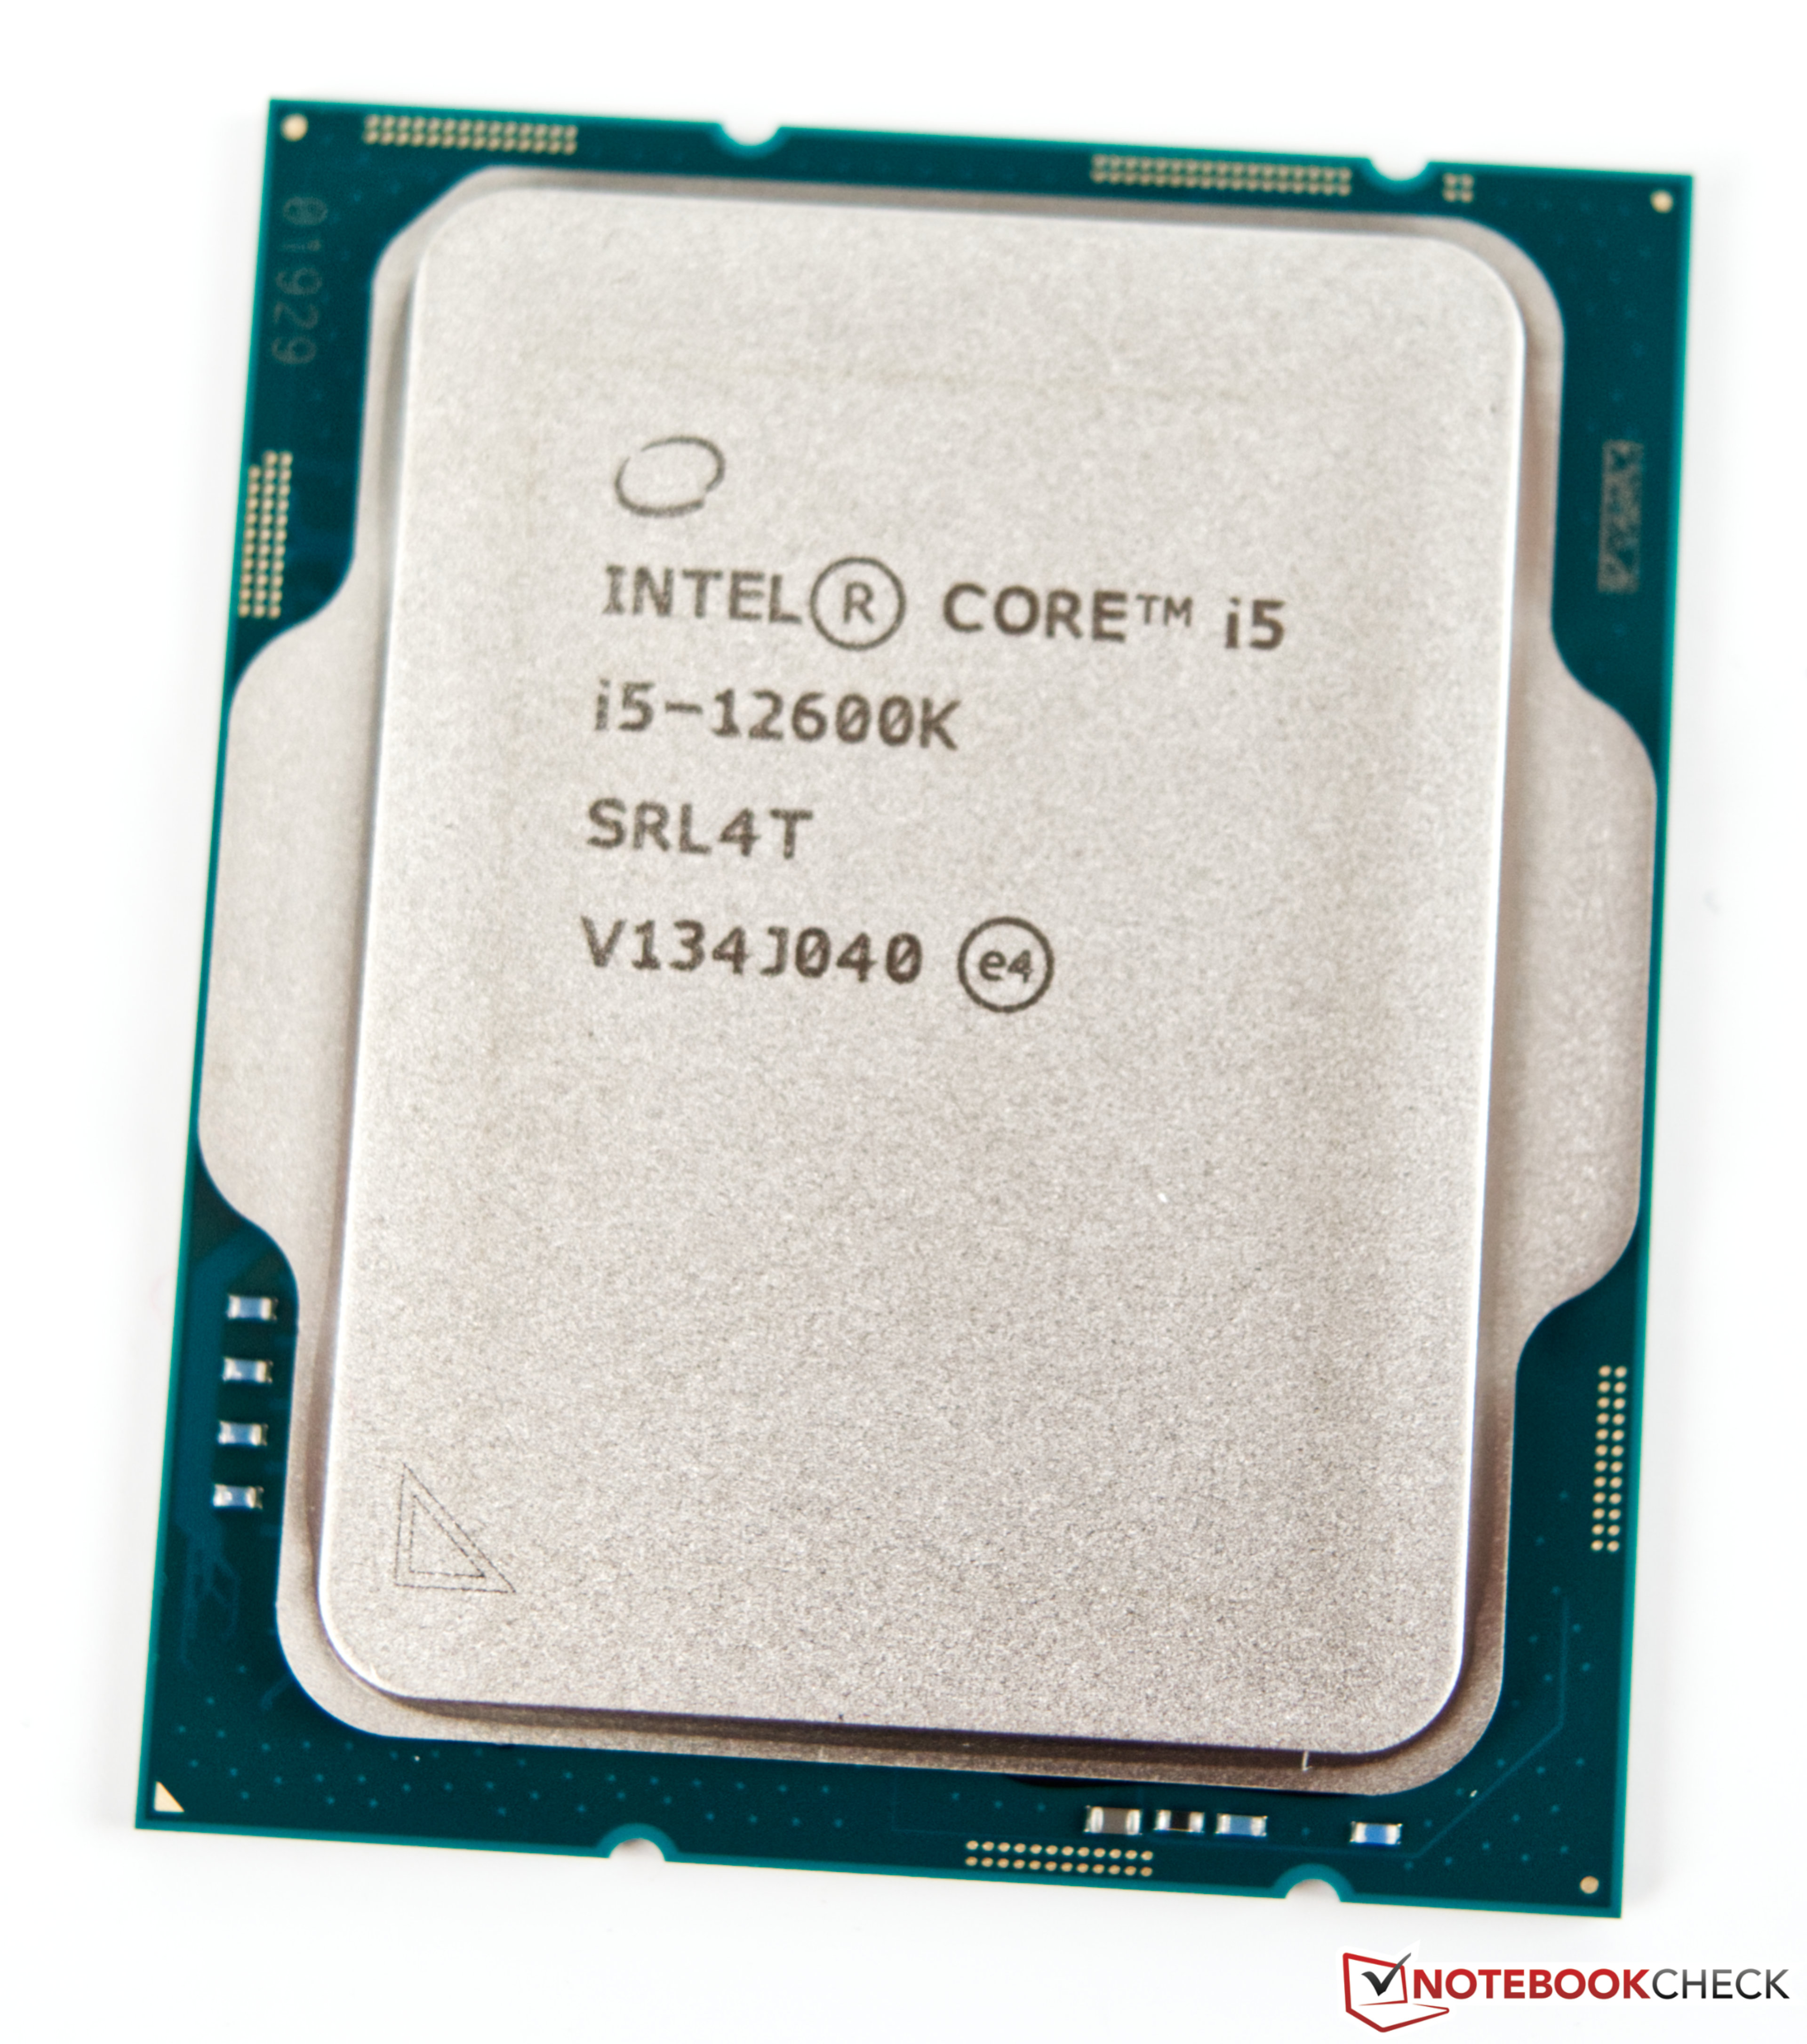
The Intel Core i5-12600K is a mid-range CPU for desktops based on the Alder Lake architecture. It was first announced in November 2021 and offers 6 performance cores and 4 efficiency cores. The performance cores (P-cores) support HyperThreading, leading to 16 Threads that can be processed at once. The performance cores can clock with up to 4.9 GHz, the efficiency cores can clock with up to 3.6 GHz. All cores can use 20 MB Smart Cache. The integrated memory controller supports up to 128 GB DDR5 with 4800 MT/s (dual channel).

Thread Director (in hardware) can support the operating system to decide which thread to use on the performance or efficiency cores for the best performance.

The integrated graphics adapter is based on the Xe-architecture and called Intel UHD Graphics 770. It clocks between 300 and 1.45 GHz.

For AI tasks, the CPU also integrates GNA 3.0 and DL Boost. Quick Sync in version 8 is the same as in the Rocket Lake CPUs and supports MPEG-2, AVC, VC-1 decode, JPEG, VP8 decode, VP9, HEVC and AV1 decode in hardware.

Performance

The average 12600K in our database is way ahead of the Ryzen 9 3900 and the Core i9-10900K, as far as multi-thread benchmark scores are concerned. This is a very fast CPU that should have no trouble running triple-A games for at least a couple of years.

Power consumption

This Core i5 series chip has a Base power consumption of 125 W, with its maximum Intel-recommended Turbo power consumption sitting at 150 W.

The i5-12600K is built with Intel's fourth generation 10 nm process marketed as Intel 7 for lower-than-average, as of mid 2023, energy efficiency.

ModelIntel Core i7-12700KIntel Processor N95Intel Core i5-12600K
CodenameAlder LakeAlder Lake-NAlder Lake
SeriesIntel Alder Lake-SIntel Alder Lake-NIntel Alder Lake-S
Series: Alder Lake-S Alder Lake
Intel Core i9-12900K3.2 - 5.2 GHz16 / 24 cores30 MB L3
Intel Core i9-129002.4 - 5.1 GHz16 / 24 cores20 MB L3
Intel Core i7-12700K « 2.7 - 5 GHz12 / 20 cores25 MB L3
Intel Core i7-12700F3.3 - 4.9 GHz12 / 20 cores25 MB L3
Intel Core i7-127003.3 - 4.9 GHz12 / 20 cores25 MB L3
Intel Core i5-12600K2.8 - 4.9 GHz10 / 16 cores20 MB L3
Intel Core i3-N3051.8 - 3.8 GHz8 / 8 cores6 MB L3
Intel Core i3-N300 - 3.8 GHz8 / 8 cores6 MB L3
Intel Processor N2001 - 3.7 GHz4 / 4 cores6 MB L3
Intel Processor N97 - 3.6 GHz4 / 4 cores6 MB L3
Intel Processor N95 « - 3.4 GHz4 / 4 cores6 MB L3
Intel Processor N1001 - 3.4 GHz4 / 4 cores6 MB L3
Intel Processor N501 - 3.4 GHz2 / 2 cores6 MB L3
Intel Core i9-12900K3.2 - 5.2 GHz16 / 24 cores30 MB L3
Intel Core i9-129002.4 - 5.1 GHz16 / 24 cores20 MB L3
Intel Core i7-12700K2.7 - 5 GHz12 / 20 cores25 MB L3
Intel Core i7-12700F3.3 - 4.9 GHz12 / 20 cores25 MB L3
Intel Core i7-127003.3 - 4.9 GHz12 / 20 cores25 MB L3
Intel Core i5-12600K « 2.8 - 4.9 GHz10 / 16 cores20 MB L3
Clock2700 - 5000 MHz <=3400 MHz2800 - 4900 MHz
L2 Cache12 MB9.5 MB
L3 Cache25 MB6 MB20 MB
Cores / Threads12 / 204 / 4
4 x 3.4 GHz Intel Crestmont E-Core
10 / 16
TDP125 Watt15 Watt125 Watt
Technology10 nm10 nm10 nm
max. Temp.100 °C105 °C100 °C
SocketLGA1700BGA1264LGA1700
FeaturesDDR4-3200/DDR5-4800 RAM, PCIe 5, Thr. Dir., DL Boost, GNA, vPro Enterp., MMX, SSE, SSE2, SSE3, SSSE3, SSE4.1, SSE4.2, AVX, AVX2, BMI2, ABM, FMA, ADX, SMEP, SMAP, EIST, TM1, TM2, HT, Turbo, SST, AES-NI, RDRAND, RDSEED, SHADDR4-3200/DDR5-4800/LPDDR5-4800 RAM (sin. chan.), PCIe 3, GNA, MMX, SSE, SSE2, SSE3, SSSE3, SSE4.1, SSE4.2, AVX, AVX2, BMI2, ABM, FMA, ADX, VMX, SMEP, SMAP, EIST, TM1, TM2, Turbo, SST, AES-NI, RDRAND, RDSEED, SHADDR4-3200/DDR5-4800 RAM, PCIe 5, Thr. Dir., DL Boost, GNA, vPro Enterp., MMX, SSE, SSE2, SSE3, SSSE3, SSE4.1, SSE4.2, AVX, AVX2, BMI2, ABM, FMA, ADX, SMEP, SMAP, EIST, TM1, TM2, HT, Turbo, SST, AES-NI, RDRAND, RDSEED, SHA
iGPUIntel UHD Graphics 770 (300 - 1500 MHz)Intel UHD Graphics Xe 16EUs (Tiger Lake-H) ( - 1200 MHz)Intel UHD Graphics 770 (300 - 1450 MHz)
Architecturex86x86x86
$409 U.S.$289 U.S.
Announced
Manufacturerark.intel.comark.intel.comark.intel.com

Benchmarks

Performance Rating - CB R15 + R20 + 7-Zip + X265 + Blender + 3DM11 CPU - i7-12700K
41.2 pt (69%)
Restrict / Search: Model: Max. age: years
Performance Rating - CB R15 + R20 + 7-Zip + X265 + Blender + 3DM11 CPU - N95
24.8 pt (41%)
Restrict / Search: Model: Max. age: years
Performance Rating - CB R15 + R20 + 7-Zip + X265 + Blender + 3DM11 CPU - i5-12600K
40 pt (67%)
Restrict / Search: Model: Max. age: years
Cinebench 2024 - Cinebench 2024 CPU Single Core
100%
1 N95 +
60 Points (30%)
Cinebench 2024 - Cinebench 2024 CPU Multi Core
100%
1 N95 +
min: 181     avg: 182.3     median: 182 (3%)     max: 184 Points
Cinebench R23 - Cinebench R23 Multi Core
min: 17003     avg: 19784     median: 19784 (18%)     max: 22565 Points
14%
N95 +
min: 2528     avg: 2711     median: 2769 (3%)     max: 2786 Points
17491 Points (16%)
Cinebench R23 - Cinebench R23 Single Core
min: 1806     avg: 1851     median: 1850.5 (75%)     max: 1895 Points
49%
N95 +
min: 618     avg: 820     median: 914 (37%)     max: 935 Points
1907 Points (78%)
Cinebench R20 - Cinebench R20 CPU (Single Core)
min: 731     avg: 736     median: 735.5 (80%)     max: 740 Points
48%
N95 +
min: 229     avg: 306.8     median: 350 (38%)     max: 357 Points
734 Points (80%)
Cinebench R20 - Cinebench R20 CPU (Multi Core)
min: 6953     avg: 7801     median: 7800.5 (19%)     max: 8648 Points
13%
N95 +
min: 976     avg: 1030     median: 1030 (3%)     max: 1067 Points
6692 Points (16%)
Cinebench R15 - Cinebench R15 CPU Multi 64 Bit
3325 Points (21%)
13%
N95 +
min: 408     avg: 437     median: 445 (3%)     max: 452 Points
2555 Points (16%)
Cinebench R15 - Cinebench R15 CPU Single 64 Bit
272 Points (75%)
56%
N95 +
min: 98     avg: 136.2     median: 151 (42%)     max: 155 Points
275 Points (76%)
Cinebench R11.5 - Cinebench R11.5 CPU Multi 64 Bit
38.4 Points (50%)
14%
N95 +
min: 5.18     avg: 5.5     median: 5.6 (7%)     max: 5.62 Points
30 Points (39%)
Cinebench R11.5 - Cinebench R11.5 CPU Single 64 Bit
3.3 Points (78%)
56%
N95 +
min: 1.3     avg: 1.7     median: 1.8 (43%)     max: 1.86 Points
3.3 Points (79%)
Cinebench R10 - Cinebench R10 Rend. Single (32bit)
9305 Points (56%)
51%
N95 +
min: 3562     avg: 4529     median: 4783 (29%)     max: 5141 Points
9381 Points (57%)
Cinebench R10 - Cinebench R10 Rend. Multi (32bit)
63484 Points (46%)
22%
N95 +
min: 12582     avg: 13741     median: 13854 (10%)     max: 14545 Points
55462 Points (40%)
Cinebench R10 - Cinebench R10 Rend. Multi (64bit)
102539 Points (65%)
22%
N95 +
min: 20429     avg: 21521     median: 22075 (14%)     max: 22275 Points
89478 Points (57%)
Cinebench R10 - Cinebench R10 Rend. Single (64bit)
15179 Points (18%)
50%
N95 +
min: 5904     avg: 7259     median: 7574 (9%)     max: 8177 Points
15180 Points (18%)
wPrime 2.10 - wPrime 2.0 1024m *
171.2 s (2%)
32%
N95 +
min: 519.662     avg: 541     median: 537.3 (6%)     max: 568.939 s
202.7 s (2%)
wPrime 2.10 - wPrime 2.0 32m *
2.7 s (1%)
16%
N95 +
min: 16.449     avg: 17.2     median: 17 (3%)     max: 18.213 s
4.7 s (1%)
WinRAR - WinRAR 4.0
10389 Points (16%)
22%
N95 +
min: 2181     avg: 2303     median: 2319.5 (4%)     max: 2391 Points
6239 Points (10%)
7-Zip 18.03 - 7-Zip 18.03 Multi Thread 4 runs
min: 65508     avg: 73439     median: 73438.5 (42%)     max: 81369 MIPS
17%
N95 +
min: 11654     avg: 12003     median: 12177 (7%)     max: 12224 MIPS
64260 MIPS (37%)
7-Zip 18.03 - 7-Zip 18.03 Single Thread 4 runs
min: 6117     avg: 6270     median: 6269.5 (74%)     max: 6422 MIPS
61%
N95 +
min: 2972     avg: 3521     median: 3803 (45%)     max: 3866 MIPS
5944 MIPS (70%)
X264 HD Benchmark 4.0 - x264 Pass 2
179 fps (5%)
18%
N95 +
min: 29.65     avg: 31.7     median: 32.4 (1%)     max: 32.45 fps
148 fps (4%)
X264 HD Benchmark 4.0 - x264 Pass 1
349.5 fps (9%)
46%
N95 +
min: 145.25     avg: 158.2     median: 162.2 (4%)     max: 163.3 fps
333.5 fps (9%)
HWBOT x265 Benchmark v2.2 - HWBOT x265 4k Preset
min: 14.9     avg: 20.5     median: 20.5 (36%)     max: 26.1 fps
16%
N95 +
min: 3.03     avg: 3.2     median: 3.2 (6%)     max: 3.29 fps
30.1 fps (53%)
TrueCrypt - TrueCrypt Serpent
1.6 GB/s (47%)
15%
N95 +
min: 0.236     avg: 0.2     median: 0.2 (7%)     max: 0.244 GB/s
1.3 GB/s (38%)
TrueCrypt - TrueCrypt Twofish
2.8 GB/s (48%)
18%
N95 +
min: 0.492     avg: 0.5     median: 0.5 (9%)     max: 0.501 GB/s
2.2 GB/s (38%)
TrueCrypt - TrueCrypt AES
15.7 GB/s (41%)
17%
N95 +
min: 2.4     avg: 2.7     median: 2.7 (7%)     max: 2.8 GB/s
12.8 GB/s (33%)
Blender - Blender 3.3 Classroom CPU *
100%
1 N95 +
min: 2161     avg: 2202     median: 2186.5 (28%)     max: 2275 Seconds
Blender - Blender 2.79 BMW27 CPU *
min: 152.3     avg: 173.1     median: 173.1 (1%)     max: 193.9 Seconds
16%
N95 +
min: 1103     avg: 1120     median: 1113 (8%)     max: 1152 Seconds
189.5 Seconds (1%)
R Benchmark 2.5 - R Benchmark 2.5 *
min: 0.412     avg: 0.4     median: 0.4 (9%)     max: 0.423 sec
50%
N95 +
min: 0.83     avg: 0.9     median: 0.8 (18%)     max: 1.135 sec
0.4 sec (10%)
3DMark 06 - CPU - 3DMark 06 - CPU
16827 Points (36%)
35%
N95 +
min: 5612     avg: 5863     median: 5952 (13%)     max: 6017 Points
15722 Points (33%)
Super Pi mod 1.5 XS 1M - Super Pi mod 1.5 XS 1M *
7.3 s (2%)
38%
N95 +
min: 7.058     avg: 18.8     median: 19.4 (4%)     max: 24.428 s
7.4 s (2%)
Super Pi mod 1.5 XS 2M - Super Pi mod 1.5 XS 2M *
16.6 s (1%)
41%
N95 +
min: 17.513     avg: 39.7     median: 40.5 (2%)     max: 50.772 s
16.4 s (1%)
Super Pi Mod 1.5 XS 32M - Super Pi mod 1.5 XS 32M *
387 s (2%)
47%
N95 +
min: 532.8     avg: 845     median: 824.7 (4%)     max: 1025.92 s
363.2 s (2%)
3DMark Vantage - 3DM Vant. Perf. CPU no Physx
93250 Points (72%)
16%
N95 +
min: 13896     avg: 14556     median: 14595 (11%)     max: 14929 Points
85458 Points (66%)
3DMark 11 - 3DM11 Performance Physics
min: 23129     avg: 24947     median: 24947 (61%)     max: 26765 Points
23%
N95 +
min: 5084     avg: 5571     median: 5661 (14%)     max: 5806 Points
25017 Points (62%)
3DMark - 3DMark Ice Storm Physics
109742 Points (89%)
42%
N95 +
min: 36089     avg: 44673     median: 46477 (38%)     max: 47272 Points
78037 Points (63%)
3DMark - 3DMark Ice Storm Extreme Physics
112268 Points (91%)
41%
N95 +
min: 36329     avg: 44756     median: 46489 (38%)     max: 47322 Points
79174 Points (64%)
3DMark - 3DMark Ice Storm Unlimited Physics
109389 Points (88%)
45%
N95 +
min: 47145     avg: 48606     median: 49062 (39%)     max: 49955 Points
77742 Points (62%)
3DMark - 3DMark Cloud Gate Physics
min: 21804     avg: 23017     median: 23017 (58%)     max: 24230 Points
18%
N95 +
min: 4105     avg: 4214     median: 4217 (11%)     max: 4345 Points
20161 Points (51%)
3DMark - 3DMark Fire Strike Standard Physics
min: 31240     avg: 34160     median: 34159.5 (61%)     max: 37079 Points
17%
N95 +
min: 5701     avg: 5923     median: 5952 (11%)     max: 6062 Points
29671 Points (53%)
3DMark - 3DMark Time Spy CPU
min: 13915     avg: 15550     median: 15550 (66%)     max: 17185 Points
15%
N95 +
min: 2081     avg: 2301     median: 2346 (10%)     max: 2386 Points
13869 Points (58%)
Geekbench 6.5 - Geekbench 6.5 Single-Core
2580 Points (60%)
48%
N95 +
min: 934     avg: 1132     median: 1227 (28%)     max: 1234 Points
2629 Points (61%)
Geekbench 6.5 - Geekbench 6.5 Multi-Core
16200 Points (63%)
18%
N95 +
min: 2800     avg: 2958     median: 2961 (11%)     max: 3114 Points
12969 Points (50%)
Geekbench 6.0 - Geekbench 6.0 Single-Core
100%
1 N95 +
min: 902     avg: 1109     median: 1177 (37%)     max: 1181 Points
Geekbench 6.0 - Geekbench 6.0 Multi-Core
100%
1 N95 +
min: 2661     avg: 2835     median: 2850.5 (12%)     max: 2978 Points
Geekbench 5.5 - Geekbench 5.1 - 5.5 64 Bit Single-Core
min: 1890     avg: 1912     median: 1911.5 (64%)     max: 1933 Points
52%
N95 +
min: 761     avg: 917     median: 999 (34%)     max: 1013 Points
1904 Points (64%)
Geekbench 5.5 - Geekbench 5.1 - 5.5 64 Bit Multi-Core
min: 12475     avg: 14016     median: 14016 (25%)     max: 15557 Points
18%
N95 +
min: 2391     avg: 2577     median: 2566 (5%)     max: 2793 Points
12797 Points (23%)
Geekbench 5.0 - Geekbench 5.0 64 Bit Single-Core
min: 1835     avg: 1841     median: 1840.5 (8%)     max: 1846 Points
54%
N95 +
min: 749     avg: 910     median: 993 (4%)     max: 1005 Points
1821 Points (8%)
Geekbench 5.0 - Geekbench 5.0 64 Bit Multi-Core
min: 12318     avg: 13879     median: 13879 (44%)     max: 15440 Points
18%
N95 +
min: 2382     avg: 2537     median: 2531 (8%)     max: 2737 Points
12746 Points (40%)
Geekbench 4.4 - Geekbench 4.1 - 4.4 64 Bit Single-Core
8133 Points (81%)
55%
N95 +
min: 3411     avg: 4100     median: 4450 (44%)     max: 4553 Points
8223 Points (82%)
Geekbench 4.4 - Geekbench 4.1 - 4.4 64 Bit Multi-Core
55786 Points (55%)
18%
N95 +
min: 9662     avg: 10169     median: 10228 (10%)     max: 10798 Points
46557 Points (46%)
Mozilla Kraken 1.1 - Kraken 1.1 Total Score *
min: 496     avg: 498     median: 498 (1%)     max: 500 ms
47%
N95 +
min: 1026     avg: 1186     median: 1056 (1%)     max: 1577 ms
511 ms (1%)
WebXPRT 4 - WebXPRT 4 Score
100%
1 N95 +
min: 93.2     avg: 121.3     median: 126.8 (33%)     max: 138.3 Points
WebXPRT 3 - WebXPRT 3 Score
min: 301     avg: 303.5     median: 303.5 (54%)     max: 306 Points
59%
N95 +
min: 121.3     avg: 163.5     median: 178.3 (32%)     max: 183.4 Points
293 Points (53%)
CrossMark - CrossMark Overall
1999 Points (75%)
38%
N95 +
min: 555     avg: 716     median: 764 (29%)     max: 820 Points
1637 Points (61%)
Power Consumption - Prime95 Power Consumption - external Monitor *
min: 132.1     avg: 206.6     median: 206.6 (36%)     max: 281 Watt
847%
1 N95 +
min: 20.3     avg: 25.3     median: 24.4 (4%)     max: 31.5 Watt
256.5 Watt (44%)
Power Consumption - Cinebench R15 Multi Power Consumption - external Monitor *
278.2 Watt (51%)
1338%
1 N95 +
min: 18.9     avg: 21.4     median: 20.8 (4%)     max: 25.5 Watt
205.9 Watt (38%)
Power Consumption - Idle Power Consumption - external Monitor *
100%
1 N95 +
min: 6.24     avg: 8.4     median: 7.3 (5%)     max: 12.6 Watt
Power Consumption - Power Efficiency - Cinebench R15 Multi external Monitor
12 Points per Watt (9%)
176%
1 N95 +
21.1 Points per Watt (16%)
12.4 Points per Watt (9%)

Average Benchmarks Intel Core i7-12700K → 100% n=48

Average Benchmarks Intel Processor N95 → 32% n=48

Average Benchmarks Intel Core i5-12600K → 90% n=48

- Range of benchmark values for this graphics card
red legend - Average benchmark values for this graphics card
* Smaller numbers mean a higher performance
1 This benchmark is not used for the average calculation

v1.35
log 02. 16:15:31

#0 ran 0s before starting gpusingle class +0s ... 0s

#1 checking url part for id 14033 +0s ... 0s

#2 checking url part for id 14981 +0s ... 0s

#3 checking url part for id 13886 +0s ... 0s

#4 redirected to Ajax server, took 1767366931s time from redirect:0 +0s ... 0s

#5 did not recreate cache, as it is less than 5 days old! Created at Thu, 01 Jan 2026 05:18:32 +0100 +0s ... 0s

#6 composed specs +0.007s ... 0.007s

#7 did output specs +0s ... 0.007s

#8 getting avg benchmarks for device 14033 +0.004s ... 0.011s

#9 got single benchmarks 14033 +0.004s ... 0.016s

#10 getting avg benchmarks for device 14981 +0.004s ... 0.019s

#11 got single benchmarks 14981 +0.009s ... 0.028s

#12 getting avg benchmarks for device 13886 +0.004s ... 0.032s

#13 got single benchmarks 13886 +0.004s ... 0.037s

#14 got avg benchmarks for devices +0s ... 0.037s

#15 min, max, avg, median took s +0.073s ... 0.11s

#16 return log +0s ... 0.11s

Please share our article, every link counts!
Mail Logo
Google Logo Add as a preferred
source on Google
> Expert Reviews and News on Laptops, Smartphones and Tech Innovations > Benchmarks / Tech > Processor Comparison - Head 2 Head
Redaktion, 2017-09- 8 (Update: 2023-07- 1)