

Intel Core i7-11700 vs Intel Core i3-10320 vs Intel Core i5-11400F
Intel Core i7-11700
► remove from comparison
The Intel Core i7-11700 is a high-end desktop CPU based on the Rocket Lake architecture. The CPU offers 8 cores and 16 threads clocked at 2.5 - 4.9 GHz. The TDP is rated at 65 Watt (PL1, power limit sustained load) but the PL2 is set to around 224 Watt for short term boosts (up to 56 seconds).
The Sunny Cove processor cores (known from the Ice Lake mobile CPUs) offer larger caches and an improved IPC (up to 19%). Furthermore, the chip also includes (partly) integrated WiFi 6E and Thunderbolt 4. The platform supports PCIe 4.0 and Intel DL Boost for AI acceleration.
The faster Rocket Lake-S CPUs also integrate a new Intel UHD Graphics 750 that is based on the current Intel Xe architecture (e.g. mobile Tiger Lake).
The CPU is manufactured on the old 14 nm process like the Comet Lake predecessors.
Intel Core i3-10320
► remove from comparison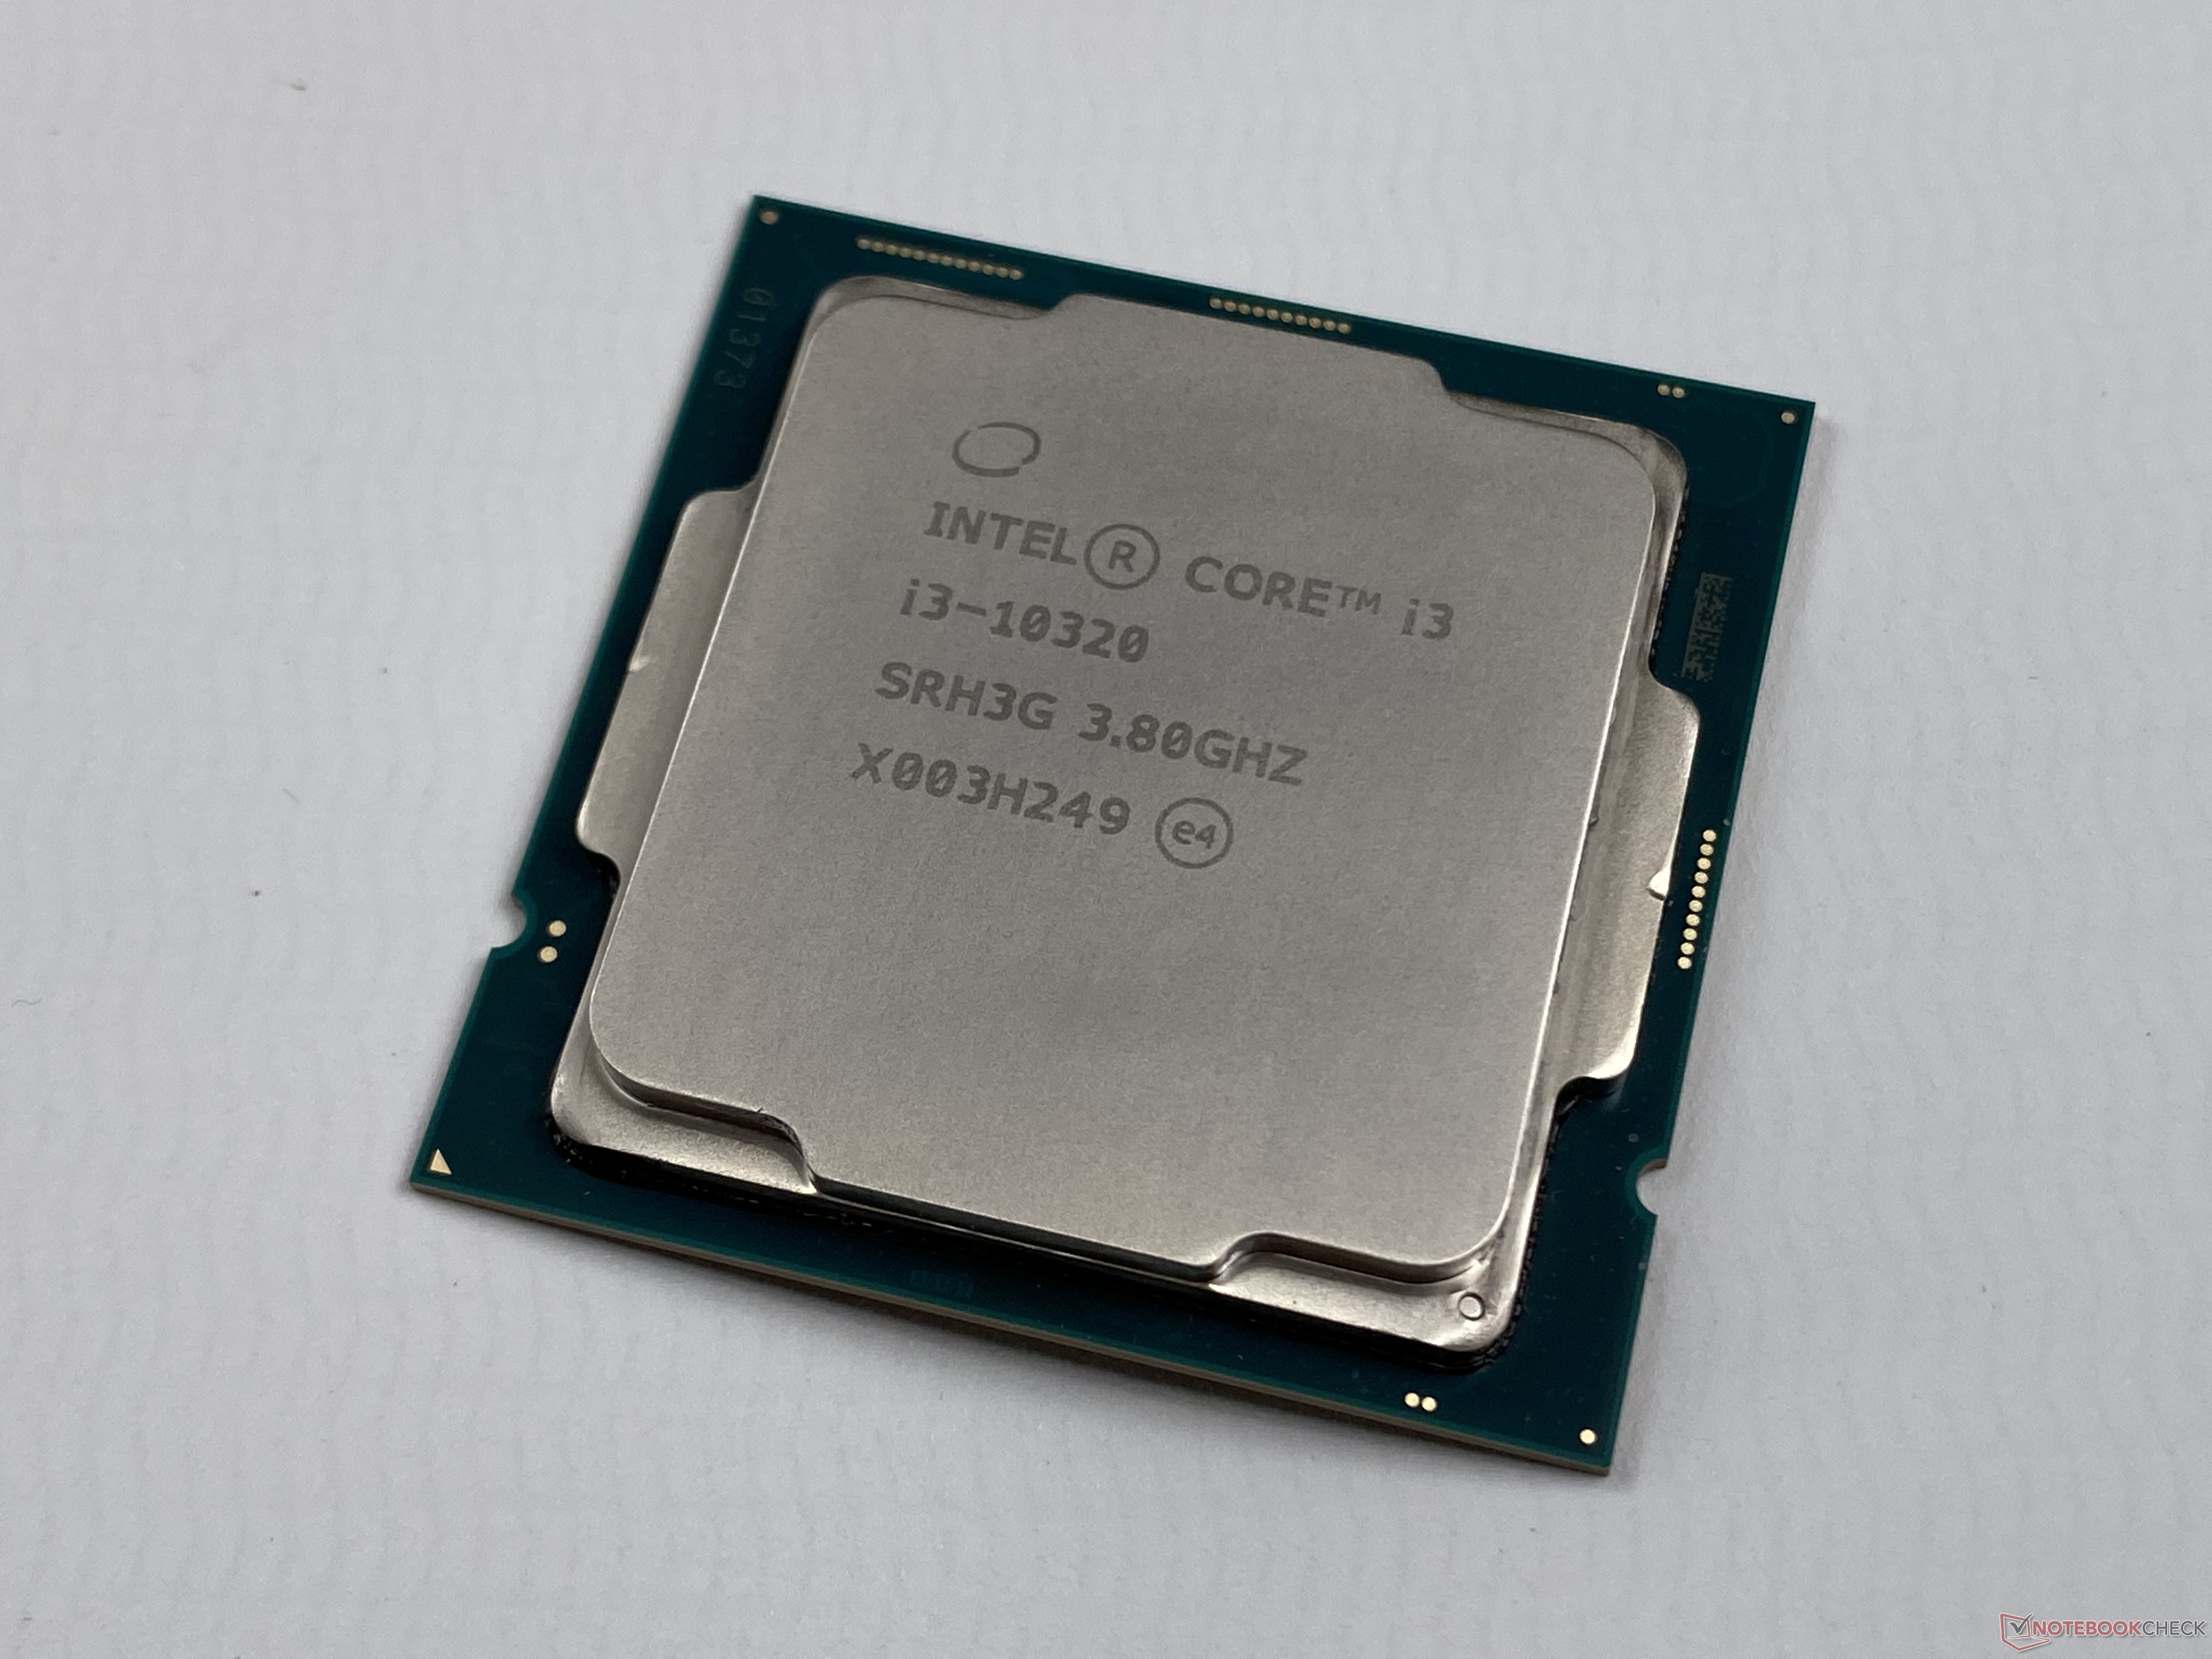
The Intel Core i3-10320 is an entry level quad-core desktop processor based on the Comet Lake-S architecture (CML-S, 4th generation of Skylake). The processor clocks at between 3.8 and 4.6 GHz and can execute up to eight threads with its four cores simultaneously thanks to Hyper-Threading.
The processor is still manufactured in the old 14nm (14nm++) process. Thanks to the free multiplicator, the CPU can also be easily overclocked (but may not have much headroom).
The Comet Lake architecture is similar to Coffee Lake and offers the same features and is produced in the same 14nm process. Other than the improved clock rates, the memory controller now also supports faster DDR4-2933 RAM. More information on Comet Lake and all the models and articles on it can be found here.
Performance
The performance is similar to the old high end Intel Core i7-7700K due to the same architecture and similar clock speeds.
Graphics
The integrated Intel UHD Graphics 630 iGPU is supposed to offer a similar performance as the UHD630 in the Core i7-9900K. As a low-end solution it will only run current games smoothly at reduced details - if at all.
Power Consumption
Intel specifies the TDP with 65 Watts (PL1) but under full load up to 90 Watt are consumed (PL2 for 28s).
Intel Core i5-11400F
► remove from comparisonThe Intel Core i5-11400F is a fast six-core desktop processor based on the new Rocket Lake architecture, which was introduced in March 2021. The processor clocks with a base clock of 2.6 GHz and reaches an all-core boost of 4.2 GHz under load. In single-thread applications, the Intel Core i5-11400F even reaches up to 4.4 GHz. Intel also gives the Rocket Lake processors the Hyperthreading feature, which allows the i5-11400F to process up to 12 threads simultaneously. As known, the Intel Core i5-11400F is manufactured in the 14 nm process. Nevertheless, many changes have been made with the Rocket Lake architecture, which is also reflected in the performance compared to the Comet Lake. The Intel Core i5-11400F is a non-K CPU, which means that there is no freely selectable multiplier. Thus, the scope for overclocking is relatively small.
Performance
Compared to the Intel Core i5-10400F, the Core i5-11400F offers a significantly better IPC. This can be seen clearly in the single-core benchmarks. But the multi-core performance also benefits from the better IPC compared to Comet-Lake. A performance increase of up to 20 percent can be expected. The Core i5 has to do without the TVB (Thermal Velocity Boost). However, 4.2 GHz is still possible when all cores are loaded. Due to the very high single-thread performance, the Intel Core i5-11400F is best suited for video games.
Graphics
The processors marked with "F" in the nomenclature don't offer an integrated graphics unit. All other non-F processors can fall back on the Intel UHD Graphics 750 and also allow operation without a dedicated graphics card.
Power consumption
The TDP turns out relatively low with 65 watts. This is the PL1 value. For Turbo, the Intel Core i5-11400F offers a higher TDP of up to 154 watts with PL2. However, this may only be applied for a maximum of 28 seconds (dew). A good air cooler should be able to handle the resulting waste heat, so no AiO is necessary for this processor.
| Model | Intel Core i7-11700 | Intel Core i3-10320 | Intel Core i5-11400F | ||||||||||||||||||||||||||||||||||||||||||||||||||||||||||||||||
| Codename | Rocket Lake | Comet Lake-S | Rocket Lake | ||||||||||||||||||||||||||||||||||||||||||||||||||||||||||||||||
| Series | Intel Rocket Lake | Intel Comet Lake | Intel Rocket Lake | ||||||||||||||||||||||||||||||||||||||||||||||||||||||||||||||||
| Series: Rocket Lake Rocket Lake |
|
|
| ||||||||||||||||||||||||||||||||||||||||||||||||||||||||||||||||
| Clock | 2500 - 4900 MHz | 3800 - 4600 MHz | 2600 - 4400 MHz | ||||||||||||||||||||||||||||||||||||||||||||||||||||||||||||||||
| L1 Cache | 640 KB | 256 KB | 480 KB | ||||||||||||||||||||||||||||||||||||||||||||||||||||||||||||||||
| L2 Cache | 4 MB | 1 MB | 3 MB | ||||||||||||||||||||||||||||||||||||||||||||||||||||||||||||||||
| L3 Cache | 16 MB | 7.9 MB | 12 MB | ||||||||||||||||||||||||||||||||||||||||||||||||||||||||||||||||
| Cores / Threads | 8 / 16 | 4 / 8 | 6 / 12 | ||||||||||||||||||||||||||||||||||||||||||||||||||||||||||||||||
| TDP | 65 Watt | 65 Watt | 65 Watt | ||||||||||||||||||||||||||||||||||||||||||||||||||||||||||||||||
| Technology | 14 nm | 14 nm | 14 nm | ||||||||||||||||||||||||||||||||||||||||||||||||||||||||||||||||
| Die Size | 276 mm2 | 276 mm2 | |||||||||||||||||||||||||||||||||||||||||||||||||||||||||||||||||
| max. Temp. | 100 °C | 100 °C | 100 °C | ||||||||||||||||||||||||||||||||||||||||||||||||||||||||||||||||
| Socket | LGA1200 | LGA 1200 | LGA1200 | ||||||||||||||||||||||||||||||||||||||||||||||||||||||||||||||||
| Features | DDR4-3200 RAM, PCIe 4, 8 GT/s bus, DL Boost, GNA, vPro, MMX, SSE, SSE2, SSE3, SSSE3, SSE4.1, SSE4.2, AVX, AVX2, AVX-512, BMI2, ABM, FMA, ADX, VMX, SMX, SMEP, SMAP, MPX, EIST, TM1, TM2, HT, Turbo, SST, AES-NI, RDRAND, RDSEED, SHA | HyperThreading, AVX, AVX2, FMA3, Quick Sync, Virtualization | DDR4-3200 RAM, PCIe 4, 8 GT/s bus, DL Boost, GNA, MMX, SSE, SSE2, SSE3, SSSE3, SSE4.1, SSE4.2, AVX, AVX2, AVX-512, BMI2, ABM, FMA, ADX, VMX, SMEP, SMAP, MPX, EIST, TM1, TM2, HT, Turbo, SST, AES-NI, RDRAND, RDSEED, SHA | ||||||||||||||||||||||||||||||||||||||||||||||||||||||||||||||||
| iGPU | Intel UHD Graphics 750 (350 - 1300 MHz) | Intel UHD Graphics 630 (350 - 1150 MHz) | |||||||||||||||||||||||||||||||||||||||||||||||||||||||||||||||||
| Architecture | x86 | x86 | x86 | ||||||||||||||||||||||||||||||||||||||||||||||||||||||||||||||||
| Announced | |||||||||||||||||||||||||||||||||||||||||||||||||||||||||||||||||||
| Manufacturer | ark.intel.com | ark.intel.com | ark.intel.com | ||||||||||||||||||||||||||||||||||||||||||||||||||||||||||||||||
| $162 U.S. | $157 U.S. |

Benchmarks
Average Benchmarks Intel Core i7-11700 → 100% n=32
Average Benchmarks Intel Core i3-10320 → 65% n=32
Average Benchmarks Intel Core i5-11400F → 87% n=32
* Smaller numbers mean a higher performance
1 This benchmark is not used for the average calculation