

Intel Core i5-12400F vs Intel Core i7-12700 vs Intel Core i5-12600K
Intel Core i5-12400F
► remove from comparisonThe Intel Core i5-12400F is a fast six-core processor based on the Alder Lake architecture, which was introduced in January 2022. The processor has a base clock speed of 2.5 GHz and reaches a maximum clock speed of up to 4.4 GHz under load. As with its predecessor, the Intel Core i5-11400F, Alder-Lake also supports hyperthreading, which means that up to 12 threads can be processed simultaneously. The Intel Core i5-12400F is manufactured using the 10 nm process. There are many changes to the new architecture, which is essentially based on a hybrid architecture. However, the Intel Core i5-12400F does not fully benefit from this, as only P-cores are used under the heatspreader. Only with the faster Intel Core i5-12600K can you enjoy the performance of the combination of P and E cores. The Intel Core i5-12400F is a non-K CPU, which in turn means that there is no freely selectable multiplier, which means that the CPU is not suitable for overclocking.
Performance
Compared to the Intel Core i5-11400F , the IPC of the Intel Core i5-12400F has been significantly increased again. The performance difference between the two processors is between 10 and 20 percent in most cases. Due to the good single-thread performance, the Intel Core i5-12400F is definitely a sensible CPU to use as the basis in a gaming PC.
Graphics unit
The processors marked with an "F" in the nomenclature do not offer an integrated graphics unit. All other non-F processors can rely on the Intel Iris Xe.
Power consumption
The TDP is relatively low at 65 watts. This is the PL1 value. For Turbo, the Intel Core i5-12400F with PL2 offers a higher TDP of up to 117 watts. If all restrictions are deactivated in the BIOS, there is no time limit for the PL2 value. With the maximum 117 watts, a large cooling unit is not required.
Intel Core i7-12700
► remove from comparison
The Intel Core i7-12700F is a fast eight-core desktop processor based on the Alder Lake architecture, which was introduced in November 2021. The processor offers a base clock of 3.3 GHz and reaches up to 4.9 GHz in Turbo. In the same way, the Intel Core i7-12700K the Core i7-12700F is based on a hybrid architecture of 8P and 4E cores. The innovations of the Alder Lake-S processor compared to Rocket Lake, together with the smaller 10 nm manufacturing process, are clearly noticeable. The Intel Core i7-12700 does not offer a free multiplier, which means that overclocking is not possible.
Performance
Compared to the Intel Core i7-11700 , performance has been increased with a better IPC. The additional e-cores are also clearly noticeable in multi-threaded applications. Overall, this provides a noticeable performance boost, which also has an effect on all application areas. The 4 E-Cores provide the P-Cores with significantly more power. If all requirements are met, Intel Turbo Boost 3.0can increase the clock rate of the P-Cores to up to 4.9 GHz. The E-cores also offer a turbo and clock up to 3.6 GHz.
Graphics unit
The Intel Core i7-12700 is a processor with an integrated graphics unit. However, with the Intel UHD Graphics 770 there is only a simple iGPU which is only suitable for office use.
Power consumption
The TDP of the Intel Core i7-12700 is 65 watts, with the option to consume up to 180 watts in Turbo mode. If all restrictions are deactivated in the BIOS, the PL2 value can be achieved permanently. However, a high-quality and powerful cooling unit should be used for this.
Intel Core i5-12600K
► remove from comparison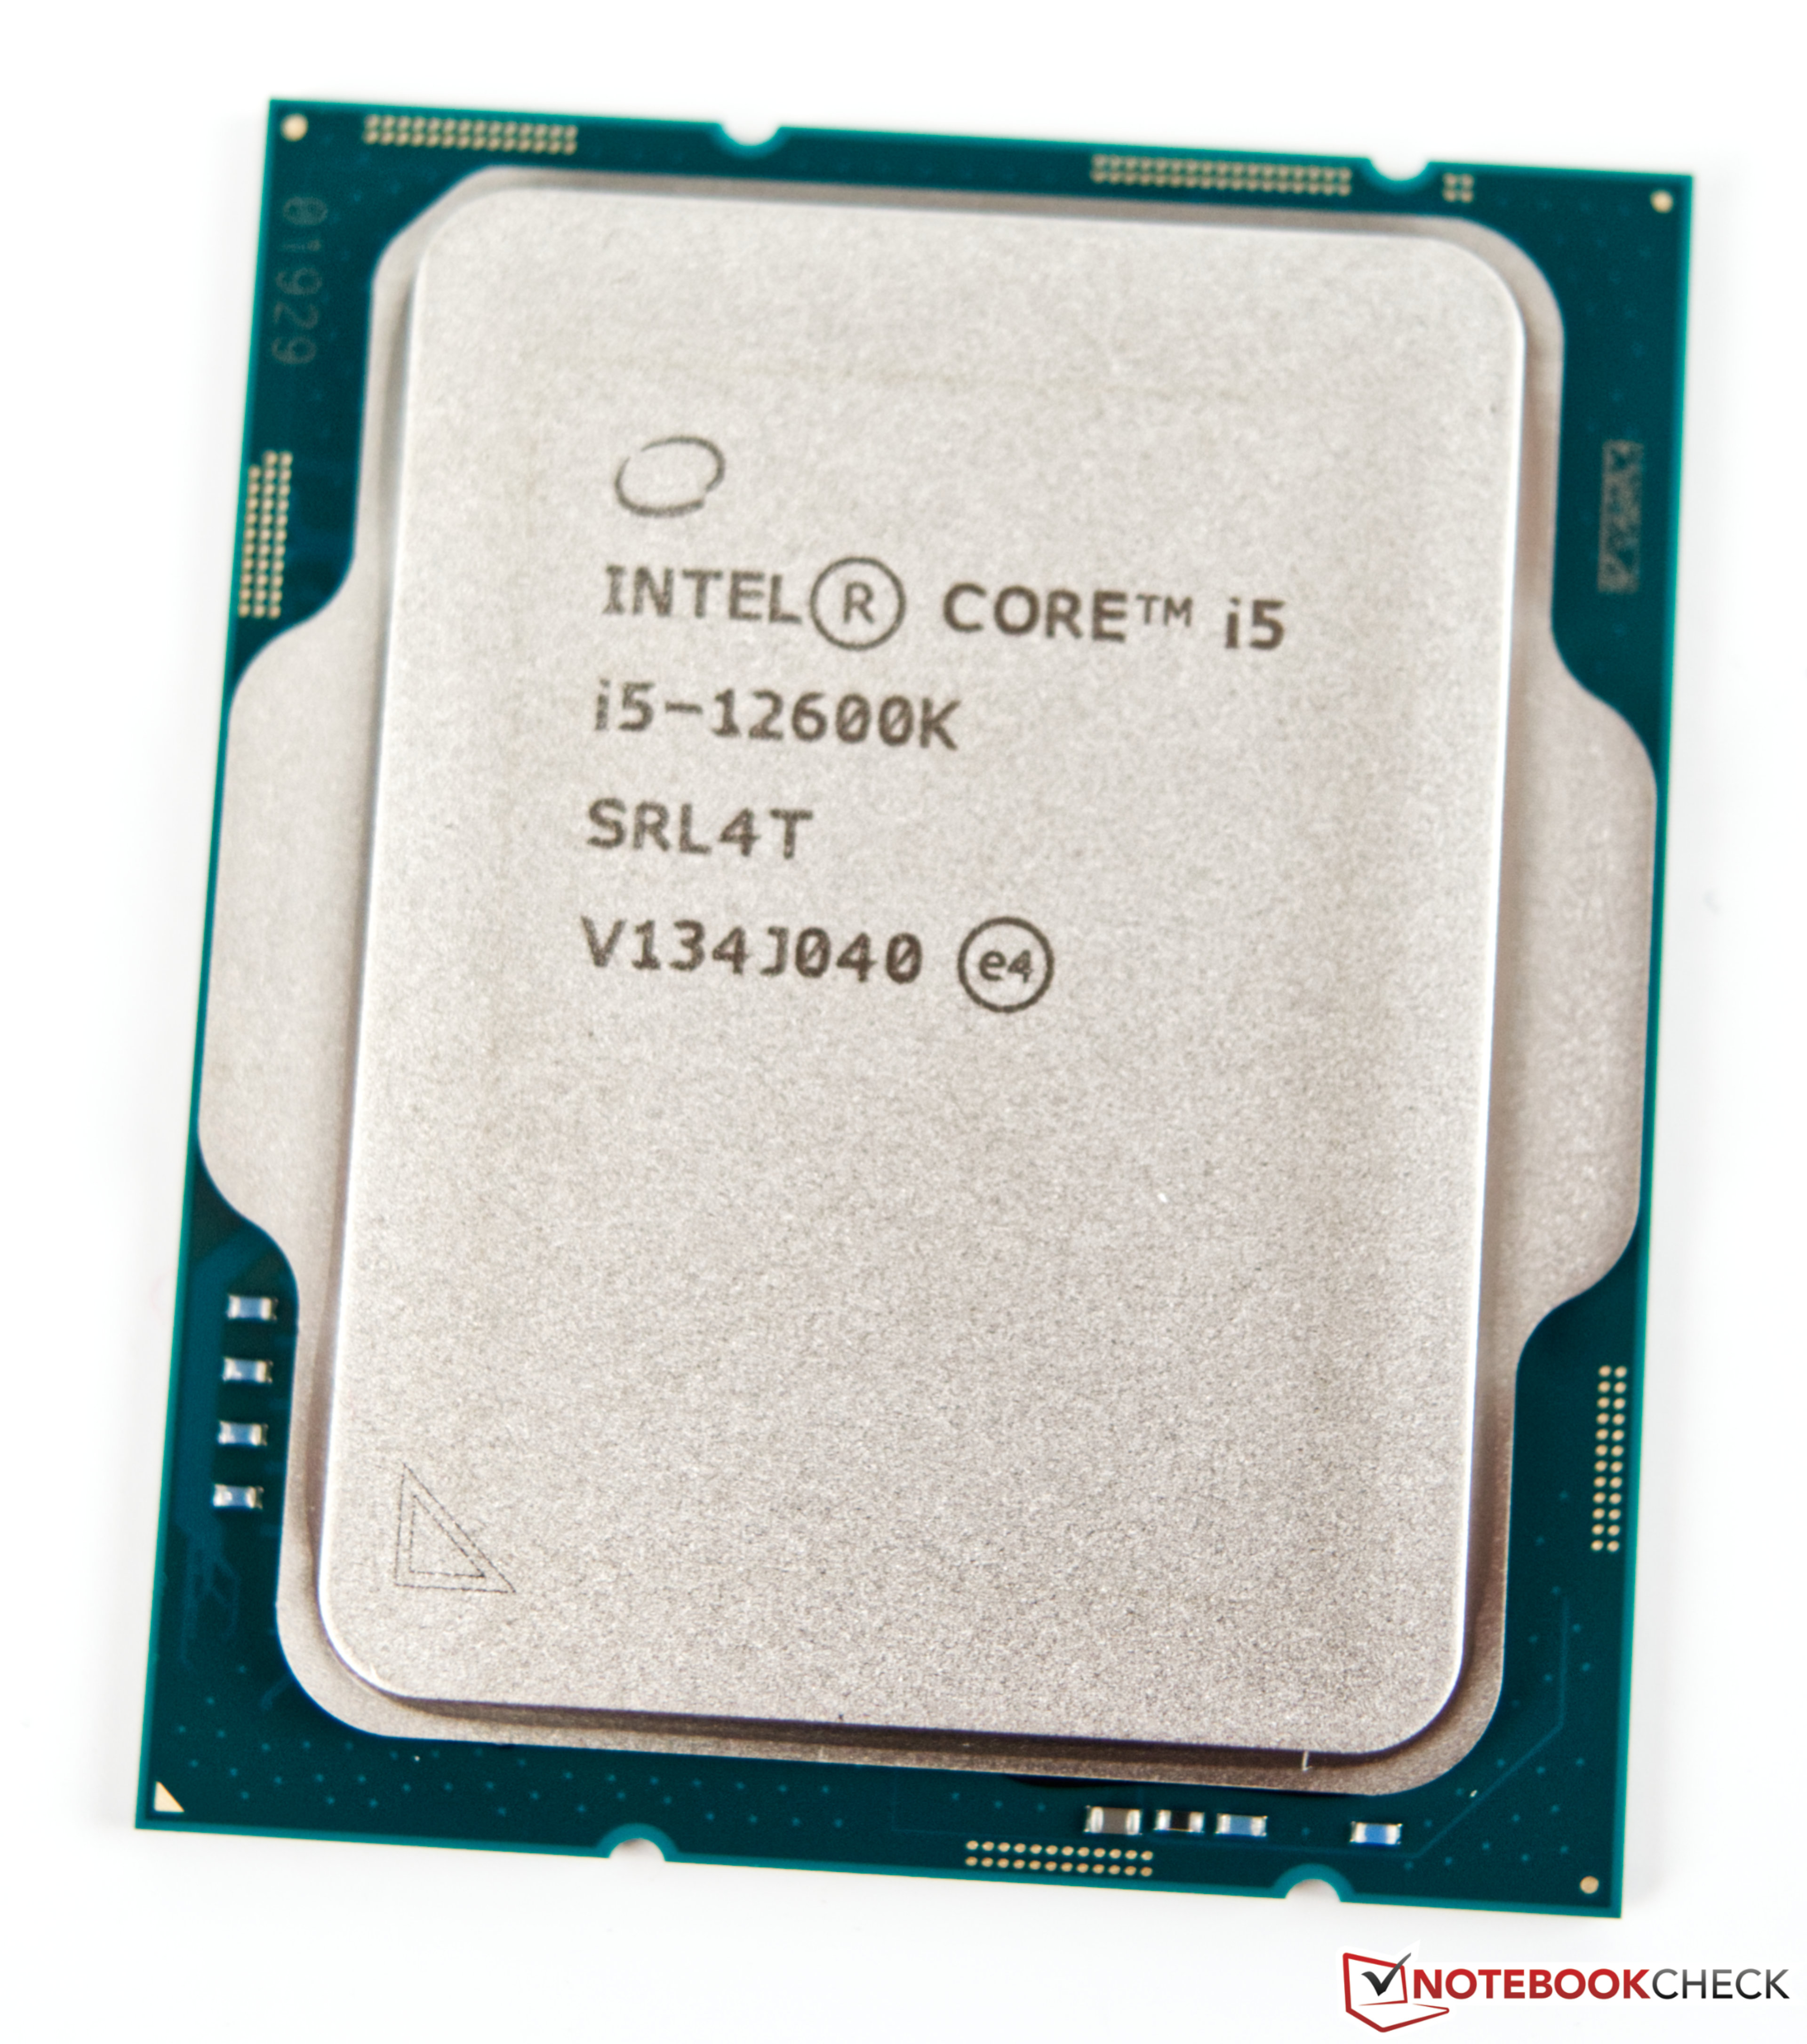
The Intel Core i5-12600K is a mid-range CPU for desktops based on the Alder Lake architecture. It was first announced in November 2021 and offers 6 performance cores and 4 efficiency cores. The performance cores (P-cores) support HyperThreading, leading to 16 Threads that can be processed at once. The performance cores can clock with up to 4.9 GHz, the efficiency cores can clock with up to 3.6 GHz. All cores can use 20 MB Smart Cache. The integrated memory controller supports up to 128 GB DDR5 with 4800 MT/s (dual channel).
Thread Director (in hardware) can support the operating system to decide which thread to use on the performance or efficiency cores for the best performance.
The integrated graphics adapter is based on the Xe-architecture and called Intel UHD Graphics 770. It clocks between 300 and 1.45 GHz.
For AI tasks, the CPU also integrates GNA 3.0 and DL Boost. Quick Sync in version 8 is the same as in the Rocket Lake CPUs and supports MPEG-2, AVC, VC-1 decode, JPEG, VP8 decode, VP9, HEVC and AV1 decode in hardware.
Performance
The average 12600K in our database is way ahead of the Ryzen 9 3900 and the Core i9-10900K, as far as multi-thread benchmark scores are concerned. This is a very fast CPU that should have no trouble running triple-A games for at least a couple of years.
Power consumption
This Core i5 series chip has a Base power consumption of 125 W, with its maximum Intel-recommended Turbo power consumption sitting at 150 W.
The i5-12600K is built with Intel's fourth generation 10 nm process marketed as Intel 7 for lower-than-average, as of mid 2023, energy efficiency.
| Model | Intel Core i5-12400F | Intel Core i7-12700 | Intel Core i5-12600K | ||||||||||||||||||||||||||||||||||||||||||||||||
| Codename | Alder Lake-S | Alder Lake | Alder Lake | ||||||||||||||||||||||||||||||||||||||||||||||||
| Series | Alder Lake-S | Intel Alder Lake-S | Intel Alder Lake-S | ||||||||||||||||||||||||||||||||||||||||||||||||
| Clock | 2500 - 4400 MHz | 3300 - 4900 MHz | 2800 - 4900 MHz | ||||||||||||||||||||||||||||||||||||||||||||||||
| L1 Cache | 480 KB | 1 MB | |||||||||||||||||||||||||||||||||||||||||||||||||
| L2 Cache | 7.5 MB | 12 MB | 9.5 MB | ||||||||||||||||||||||||||||||||||||||||||||||||
| L3 Cache | 17.9 MB | 25 MB | 20 MB | ||||||||||||||||||||||||||||||||||||||||||||||||
| Cores / Threads | 6 / 12 | 12 / 20 | 10 / 16 | ||||||||||||||||||||||||||||||||||||||||||||||||
| TDP | 65 Watt | 65 Watt | 125 Watt | ||||||||||||||||||||||||||||||||||||||||||||||||
| Technology | 10 nm | 10 nm | 10 nm | ||||||||||||||||||||||||||||||||||||||||||||||||
| Die Size | 163 mm2 | 215 mm2 | |||||||||||||||||||||||||||||||||||||||||||||||||
| max. Temp. | 100 °C | 100 °C | 100 °C | ||||||||||||||||||||||||||||||||||||||||||||||||
| Socket | 1700 | LGA 1700 | LGA1700 | ||||||||||||||||||||||||||||||||||||||||||||||||
| Features | TVB, HyperThreading, AVX, AVX2, FMA3, Quick Sync, Virtualization | DDR4-3200/DDR5-4800 RAM, PCIe 5, Thr. Dir., DL Boost, GNA, vPro Enterp., MMX, SSE, SSE2, SSE3, SSSE3, SSE4.1, SSE4.2, AVX, AVX2, BMI2, ABM, FMA, ADX, SMEP, SMAP, EIST, TM1, TM2, HT, Turbo, SST, AES-NI, RDRAND, RDSEED, SHA | |||||||||||||||||||||||||||||||||||||||||||||||||
| Architecture | x86 | x86 | x86 | ||||||||||||||||||||||||||||||||||||||||||||||||
| $180 U.S. | $349 U.S. | $289 U.S. | |||||||||||||||||||||||||||||||||||||||||||||||||
| Announced | |||||||||||||||||||||||||||||||||||||||||||||||||||
| Manufacturer | www.intel.de | www.intel.de | ark.intel.com | ||||||||||||||||||||||||||||||||||||||||||||||||
| Series: Alder Lake-S Alder Lake |
|
| |||||||||||||||||||||||||||||||||||||||||||||||||
| iGPU | Intel UHD Graphics 770 (300 - 1500 MHz) | Intel UHD Graphics 770 (300 - 1450 MHz) |

Benchmarks

Average Benchmarks Intel Core i5-12400F → 100% n=47
Average Benchmarks Intel Core i7-12700 → 135% n=47
Average Benchmarks Intel Core i5-12600K → 123% n=47
* Smaller numbers mean a higher performance
1 This benchmark is not used for the average calculation