

Samsung Xclipse 920 vs Qualcomm Adreno 640 vs Qualcomm Adreno 685
Samsung Xclipse 920
► remove from comparison
The Samsung Xclipse 920 GPU is an integrated graphics card in the Samsung Exynos 2200 SoC that is used in Android based smartphones and tablets. It was introduced in some models of the Galaxy S21 line. The iGPU is the first that uses an architecture by AMD (RDNA 2, like the Radeon 660M in the Ryzen 6000 chips). Current information from Geekbench ML points to 3 CUs (=192 shaders).
The performance is slightly below current high end iGPUs for phones like the Adreno 730 (Snapdrageon 8 Gen 1) or Apple A15 GPU, but still sufficient for all mobile games in 2022.
The Xclipse 920 is produced in the modern 4nm EUV process at Samsung (as its integrated in the Exynos 2200).
Qualcomm Adreno 640
► remove from comparison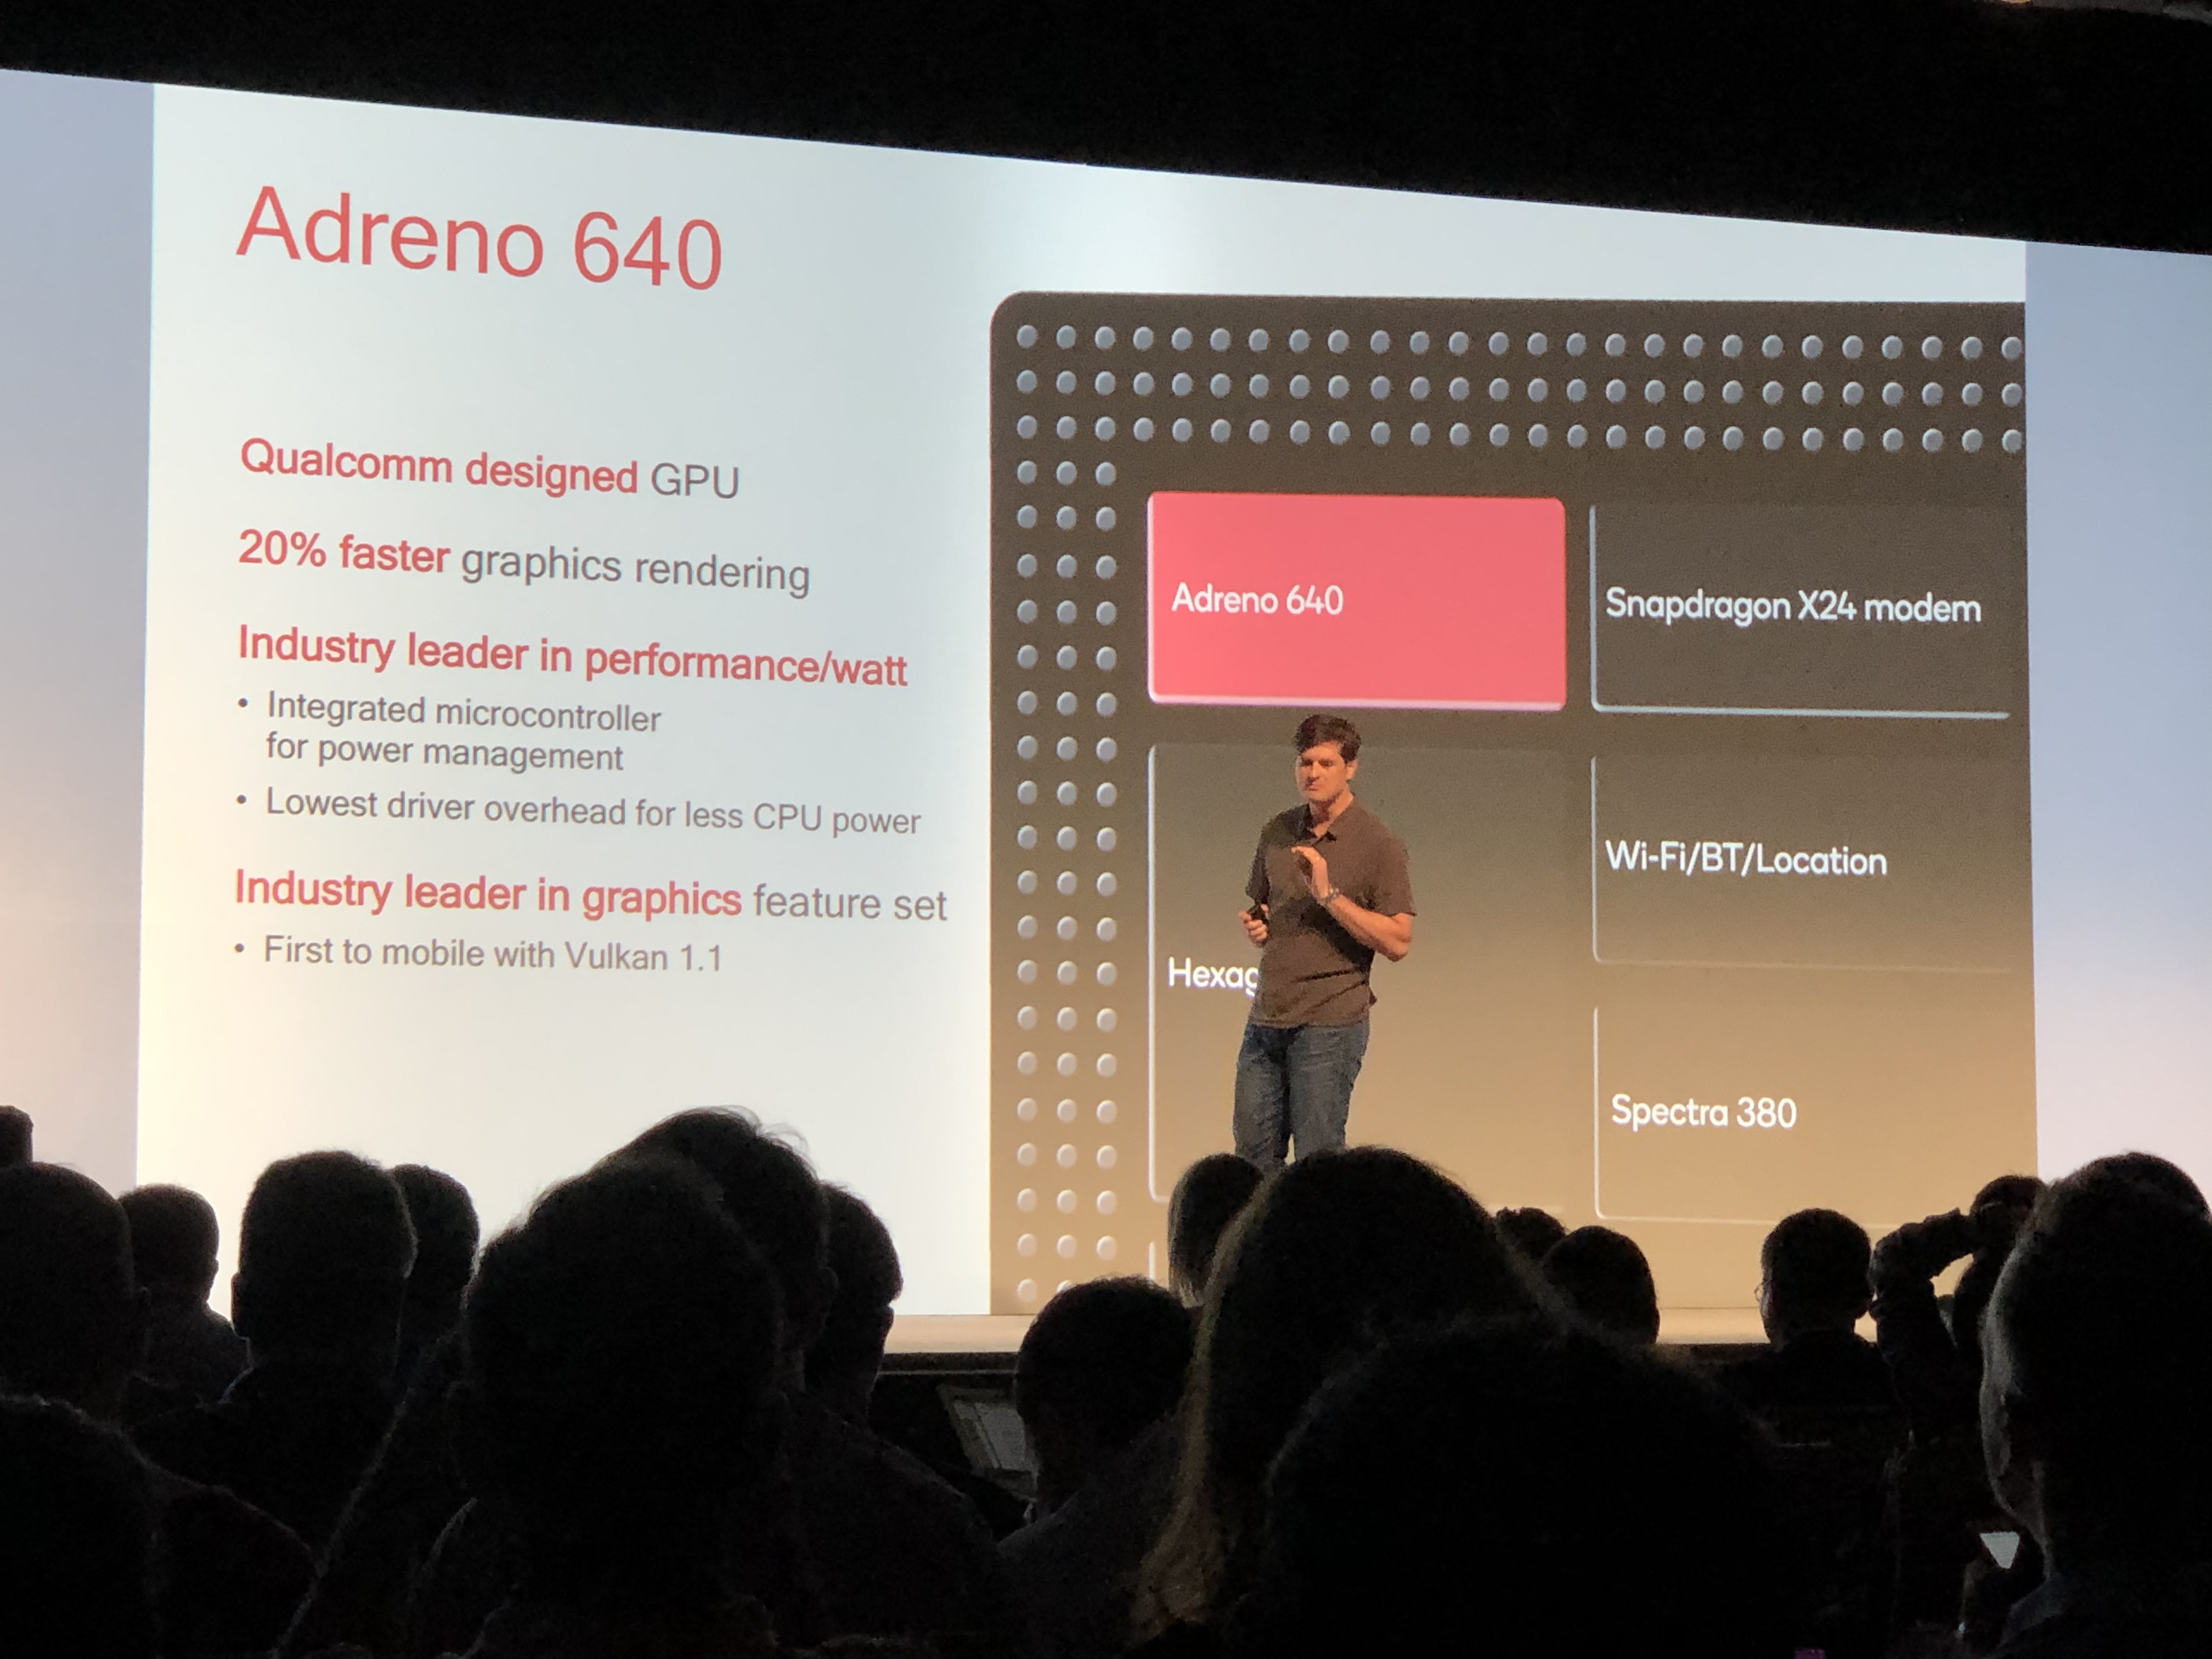
The Qualcomm Adreno 640 is a smartphone and tablet GPU that is integrated within the Qualcomm Snapdragon 855 SoC. The chip will be available from early 2019 and will be used mainly in high-end Android devices.
According to Qualcomm, the Adreno 640 GPU offers a 20% improved performance over the Adreno 630, its predecessor, which is integrated in the Snapdragon 845 SoC. The enhanced performance is achieved by the Adreno 640 having 50% more FP16 and FP32 compute units (ALUs) than the Adreno 630, while its 7 nm FinFET manufacturing process makes it 20% more efficient too.
The Adreno 640 will also support the Vulkan 1.1 API, something which is possible for other Adreno 600 series GPUs too.
Qualcomm Adreno 685
► remove from comparison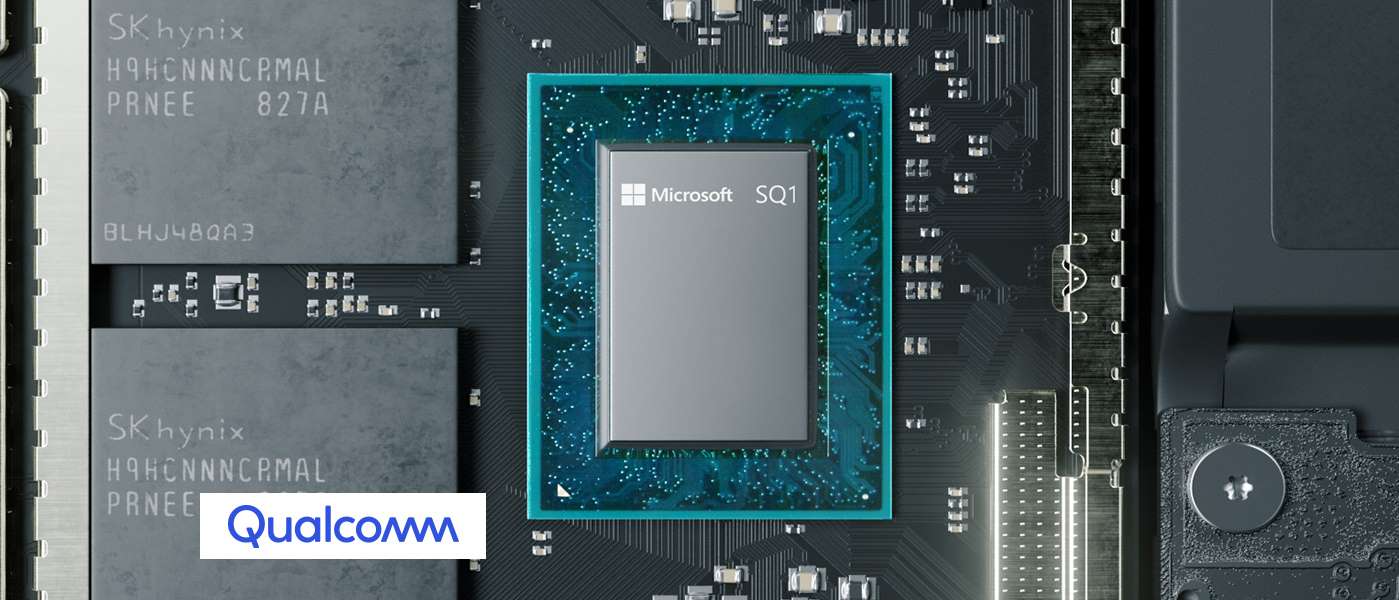
The Qualcomm Adreno 685 is an integrated graphics card in the Microsoft SQ1 ARM-based SoC. It is similar to the Adreno 680 in the Qualcomm Snapdragon 8cx SoC for Windows laptops but higher clocked and therefore with a higher theoretical performance (2 versus 1.8 TFlops).
| Samsung Xclipse 920 | Qualcomm Adreno 640 | Qualcomm Adreno 685 | ||||||||||||||||||||||||||||||||||||||||||||||||||||||||||||||||||||||||||||||||||||||||||||||||||||||||||||||||||||||||||||
| Adreno 600 Series |
|
|
| |||||||||||||||||||||||||||||||||||||||||||||||||||||||||||||||||||||||||||||||||||||||||||||||||||||||||||||||||||||||||||
| Codename | RDNA 2 | |||||||||||||||||||||||||||||||||||||||||||||||||||||||||||||||||||||||||||||||||||||||||||||||||||||||||||||||||||||||||||||
| Architecture | RDNA 2 | |||||||||||||||||||||||||||||||||||||||||||||||||||||||||||||||||||||||||||||||||||||||||||||||||||||||||||||||||||||||||||||
| Pipelines | 192 - unified | |||||||||||||||||||||||||||||||||||||||||||||||||||||||||||||||||||||||||||||||||||||||||||||||||||||||||||||||||||||||||||||
| Core Speed | 555 (Boost) MHz | |||||||||||||||||||||||||||||||||||||||||||||||||||||||||||||||||||||||||||||||||||||||||||||||||||||||||||||||||||||||||||||
| Shared Memory | yes | yes | yes | |||||||||||||||||||||||||||||||||||||||||||||||||||||||||||||||||||||||||||||||||||||||||||||||||||||||||||||||||||||||||||
| technology | 4 nm | 10 nm | 7 nm | |||||||||||||||||||||||||||||||||||||||||||||||||||||||||||||||||||||||||||||||||||||||||||||||||||||||||||||||||||||||||||
| Features | OpenGL ES 3.2, OpenCL 2.0, DirectX 12, Vulkan 1.1 | OpenGL ES 3.2, OpenCL 2.0, DirectX 12, Vulkan 1.1 | ||||||||||||||||||||||||||||||||||||||||||||||||||||||||||||||||||||||||||||||||||||||||||||||||||||||||||||||||||||||||||||
| Date of Announcement | 18.01.2022 | 12.02.2018 | 06.12.2018 | |||||||||||||||||||||||||||||||||||||||||||||||||||||||||||||||||||||||||||||||||||||||||||||||||||||||||||||||||||||||||||
| Link to Manufacturer Page | semiconductor.samsung.com | |||||||||||||||||||||||||||||||||||||||||||||||||||||||||||||||||||||||||||||||||||||||||||||||||||||||||||||||||||||||||||||
| API | DirectX 12, OpenGL ES 3.2 | DirectX 12 | ||||||||||||||||||||||||||||||||||||||||||||||||||||||||||||||||||||||||||||||||||||||||||||||||||||||||||||||||||||||||||||
| Power Consumption | 7 Watt |
|
|
| ||||||||||||||||||||||||||||||||||||
Benchmarks
GFXBench T-Rex HD Offscreen C24Z16 + Samsung Xclipse 920
Average Benchmarks Samsung Xclipse 920 → 100% n=2
Average Benchmarks Qualcomm Adreno 640 → 54% n=2
Average Benchmarks Qualcomm Adreno 685 → 36% n=2
* Smaller numbers mean a higher performance
1 This benchmark is not used for the average calculation
Game Benchmarks
The following benchmarks stem from our benchmarks of review laptops. The performance depends on the used graphics memory, clock rate, processor, system settings, drivers, and operating systems. So the results don't have to be representative for all laptops with this GPU. For detailed information on the benchmark results, click on the fps number.

League of Legends: Wild Rift
2020
Call of Duty Mobile
2020
Genshin Impact
2020

PUBG Mobile
2018World of Tanks Blitz
2018
Arena of Valor
2018

Battle Bay
2018
Asphalt 9: Legends
2013
Temple Run 2
2013
Average Gaming Samsung Xclipse 920 → 100%
Average Gaming 30-70 fps → 100%
Average Gaming Qualcomm Adreno 640 → 90%
Average Gaming 30-70 fps → 134%
| Samsung Xclipse 920 | Qualcomm Adreno 640 | Qualcomm Adreno 685 | |||||||||||||||||||
|---|---|---|---|---|---|---|---|---|---|---|---|---|---|---|---|---|---|---|---|---|---|
| low | med. | high | ultra | QHD | 4K | low | med. | high | ultra | QHD | 4K | low | med. | high | ultra | QHD | 4K | ||||
| League of Legends: Wild Rift | 60 | ||||||||||||||||||||
| Call of Duty Mobile | 60 | ||||||||||||||||||||
| Genshin Impact | 59.5 | 59.3 | 58.2 | ||||||||||||||||||
| Armajet | 67 | 30 | |||||||||||||||||||
| PUBG Mobile | 44 | 39.5 | 32 | 43 | |||||||||||||||||
| Samsung Xclipse 920 | Qualcomm Adreno 640 | Qualcomm Adreno 685 | |||||||||||||||||||
| low | med. | high | ultra | QHD | 4K | low | med. | high | ultra | QHD | 4K | low | med. | high | ultra | QHD | 4K | < 30 fps < 60 fps < 120 fps ≥ 120 fps | 2 1 | 2 | 1 2 | 1 | | | < 30 fps < 60 fps < 120 fps ≥ 120 fps | | | 2 | | | | < 30 fps < 60 fps < 120 fps ≥ 120 fps | | | | | | |
For more games that might be playable and a list of all games and graphics cards visit our Gaming List