Intel UHD Graphics Xe 750 32EUs (Rocket Lake) vs AMD Radeon RX 6300M
Intel UHD Graphics Xe 750 32EUs (Rocket Lake) ► remove from comparison
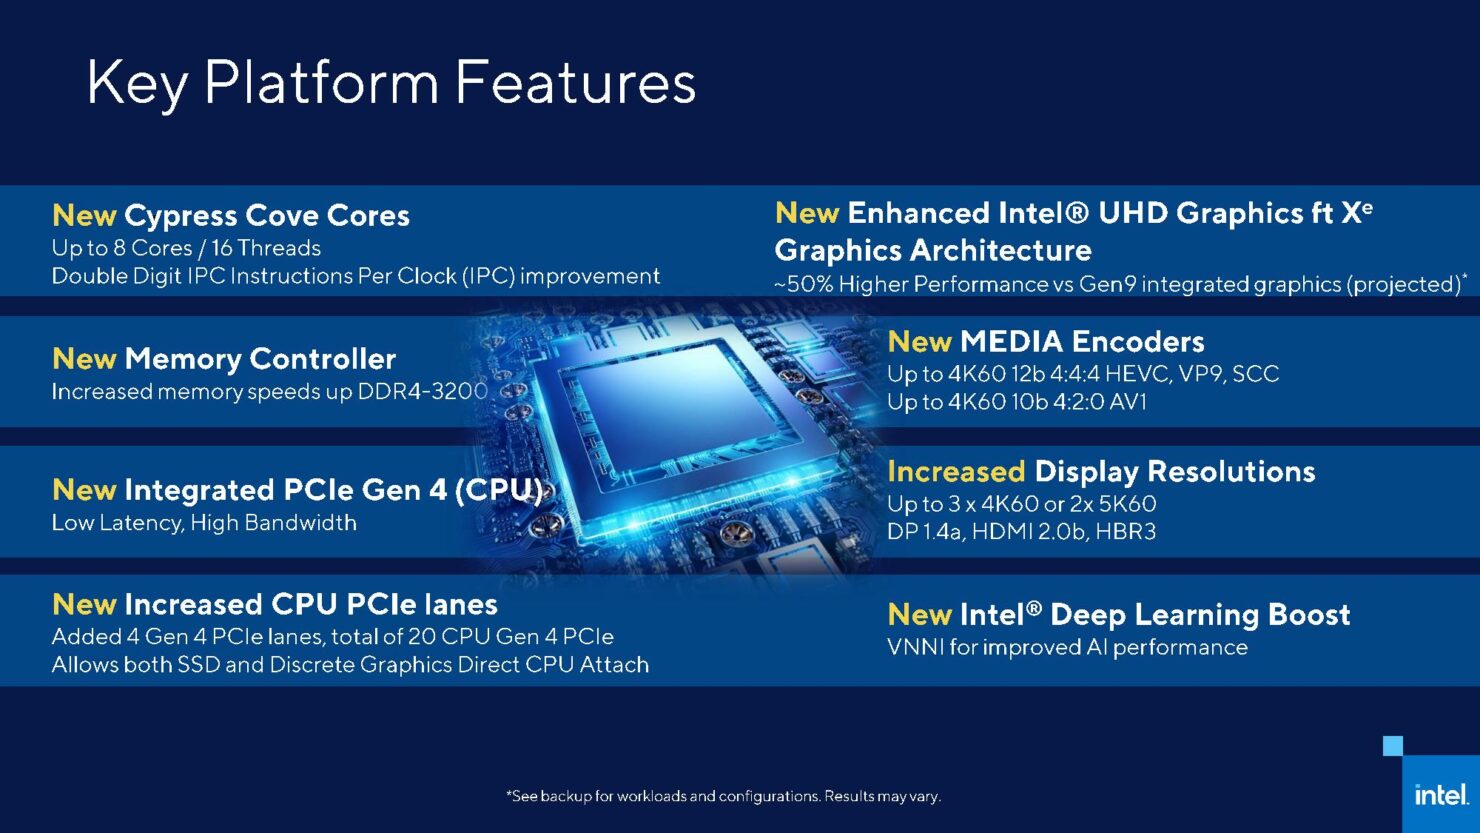
The Intel UHD Graphics Xe 750 (Rocket-Lake GPU with 32 EUs) is a integrated graphics card in the high end Rocket-Lake CPUs. It is using the new Xe architecture (Gen12) and was announced in March 2021.
Compared to the previous generation of UHD Graphics ,the Xe architecture and the improved shader count lead to a big leap in graphics performance. Still, the UHD 750 is only suited for low demanding games or very low settings. The 48 EU version in Tiger Lake SoCs e.g. reached 46 fps in The Witcher 3 low 1024x768 and no fluent framerates in Mafia Definitive Edition.
The Rocket Lake SoCs and therefore the integrated GPU are manufactured in the old 14nm+++ process at Intel.
AMD Radeon RX 6300M ► remove from comparison
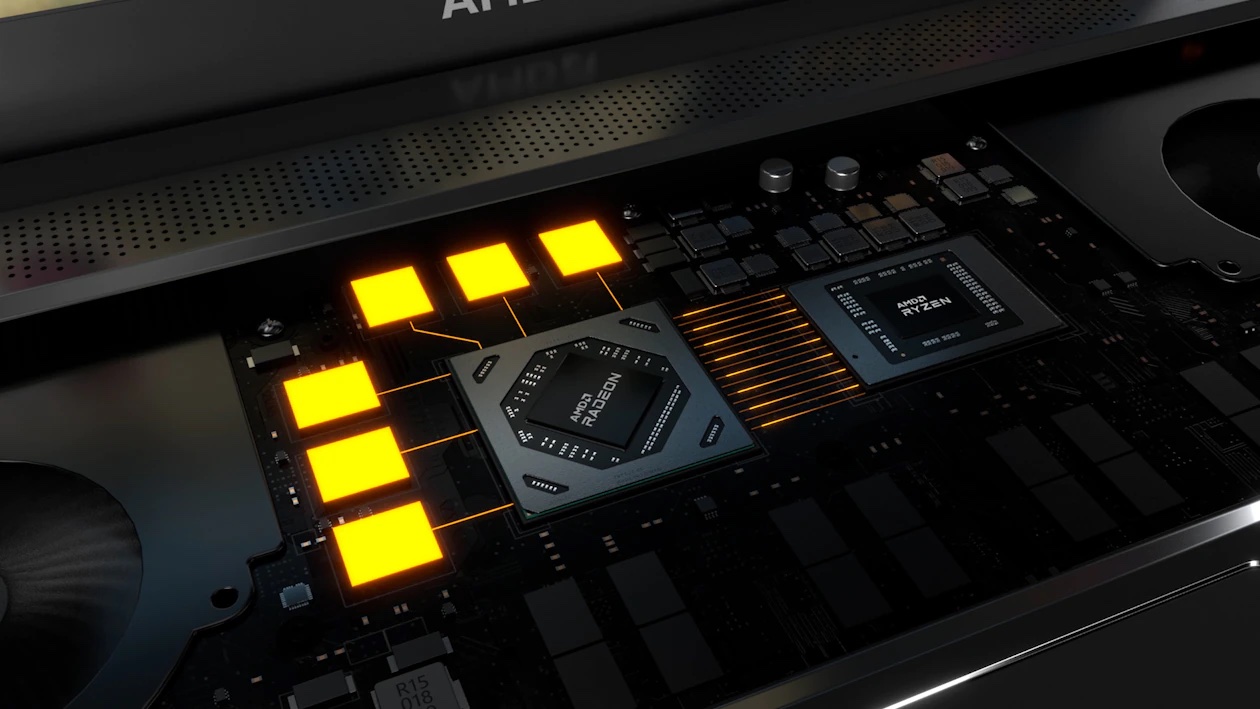
The AMD Radeon RX 6300M is a mobile entry-level graphics card based on the Navi 24 chip (RDNA 2 architecture) manufactured in the modern 6nm process. It features 768 cores (12 CUs - compute units) and 2 GB of fast GDDR6 graphics memory connected with a 128 Bit memory bus. The chip also includes 8 MB Infinity Cache. The game clock speed is specified at 1512 MHz. The 6300M supports Smart Access Memory and SmartShift Technology.
The performance should be similar to a mobile GTX 1650 (according to AMD) and therefore best suited for 1080p gaming with medium settings.
The Navi 24 chip is manufactured at TSMC in the modern 6nm process and should offer a good energy efficiency.
Intel UHD Graphics Xe 750 32EUs (Rocket Lake) AMD Radeon RX 6300M Radeon RX 6000M Series Codename Rocket Lake Xe Architecture Gen. 12 RDNA 2 Pipelines 32 - unified 768 - unified Core Speed 350 - 1450 (Boost) MHz 1512 (Boost) MHz Shared Memory yes no API DirectX 12_1, OpenGL 4.6 DirectX 12_2, Shader 6.4, OpenGL 4.6 technology 14 nm 6 nm Features QuickSync DisplayPort 1.4 w/DFSC, HDMI 2.0b, Radeon Media Engine (H.264 4K150 decode, 4K90 encode / H.265 4K90 decode, 4K60 encode / VP9 4K90 decode) Date of Announcement 30.03.2021 04.01.2022 Memory Speed 18000 MHz Memory Bus Width 128 Bit Memory Type GDDR6 Max. Amount of Memory 2048 MB Power Consumption 25 Watt Link to Manufacturer Page www.amd.com
Benchmarks Performance Rating - 3DMark 11 + Fire Strike + Time Spy - UHD Graphics Xe 750 32EUs
1 pt (3%)
...
Intel UHD Graphics Xe 750 32EUs (Rocket Lake)
...
max:
3DMark - 3DMark Time Spy Score
min: 383 avg: 622 median: 735 (2%) max: 747 Points
3DMark - 3DMark Time Spy Graphics
min: 342 avg: 539 median: 634 (2%) max: 642 Points
3DMark - 3DMark Ice Storm Unlimited Graphics
50628 Points (6%)
3DMark - 3DMark Ice Storm Extreme Graphics
min: 25463 avg: 29673 median: 29673 (4%) max: 33883 Points
3DMark - 3DMark Cloud Gate Score
min: 5545 avg: 10811 median: 12119 (13%) max: 13460 Points
3DMark - 3DMark Cloud Gate Graphics
min: 7604 avg: 10689 median: 11315 (3%) max: 12523 Points
3DMark - 3DMark Fire Strike Standard Score
min: 1024 avg: 1860 median: 2094 (4%) max: 2227 Points
3DMark - 3DMark Fire Strike Standard Graphics
min: 1144 avg: 1955 median: 2174.5 (2%) max: 2327 Points
3DMark - 3DMark Ice Storm Graphics
min: 35756 avg: 39116 median: 38682.5 (5%) max: 43344 Points
3DMark - 3DMark Wild Life Unlimited
2660 Points (1%)
3DMark - 3DMark Wild Life Extreme Unlimited
732 Points (1%)
3DMark - 3DMark Night Raid
3692 Points (3%)
3DMark - 3DMark Night Raid Graphics Score
4435 Points (2%)
3DMark 11 - 3DM11 Performance Score
min: 1407 avg: 2653 median: 3264 (5%) max: 3289 Points
3DMark 11 - 3DM11 Performance GPU
min: 1349 avg: 2328 median: 2811 (2%) max: 2824 Points
3DMark Vantage + Intel UHD Graphics Xe 750 32EUs (Rocket Lake) 3DMark Vantage - 3DM Vant. Perf. total
5134 Points (1%)
3DM Vant. Perf. GPU no PhysX + Intel UHD Graphics Xe 750 32EUs (Rocket Lake) 3DMark Vantage - 3DM Vant. Perf. GPU no PhysX
4452 Points (3%)
3DMark 05 - 3DMark 05 - Standard
8935 Points (10%)
3DMark 06 3DMark 06 - Standard 1280x1024 + Intel UHD Graphics Xe 750 32EUs (Rocket Lake)
min: 8090 avg: 14361 median: 17392 (23%) max: 17601 Points
Unigine Valley 1.0 - Unigine Valley 1.0 DX
3.5 fps (1%)
Cinebench R10 Cinebench R10 Shading (32bit) + Intel UHD Graphics Xe 750 32EUs (Rocket Lake) Cinebench R10 - Cinebench R10 Shading (32bit)
6088 Points (4%)
Cinebench R11.5 Cinebench R11.5 OpenGL 64 Bit + Intel UHD Graphics Xe 750 32EUs (Rocket Lake) Cinebench R11.5 - Cinebench R11.5 OpenGL 64 Bit
min: 22.96 avg: 25.5 median: 25.5 (9%) max: 28.12 fps
Cinebench R15 + Intel UHD Graphics Xe 750 32EUs (Rocket Lake) Cinebench R15 - Cinebench R15 OpenGL 64 Bit
min: 27.38 avg: 29.8 median: 28 (2%) max: 34.1 fps
Cinebench R15 OpenGL Ref. Match 64 Bit + Intel UHD Graphics Xe 750 32EUs (Rocket Lake) Cinebench R15 - Cinebench R15 OpenGL Ref. Match 64 Bit
97.8 % (98%)
Basemark GPU 1.2 - Basemark GPU 1.2 Vulkan Official Medium Offscreen 1080
31.7 fps (0%)
Basemark GPU 1.2 - Basemark GPU 1.2 Vulkan Official High Offscreen 2160
3 fps (1%)
Geekbench 6.2 - Geekbench 6.2 GPU OpenCL
2902 Points (1%)
Geekbench 6.2 - Geekbench 6.2 GPU Vulkan
3872 Points (1%)
LuxMark v2.0 64Bit - LuxMark v2.0 Room GPU
min: 129 avg: 336 median: 336 (2%) max: 543 Samples/s
LuxMark v2.0 64Bit - LuxMark v2.0 Sala GPU
min: 369 avg: 742 median: 742 (1%) max: 1115 Samples/s
ComputeMark v2.1 - ComputeMark v2.1 Result
min: 700 avg: 1024 median: 1024 (1%) max: 1348 Points
Power Consumption - Furmark Stress Test Power Consumption - external Monitor *
min: 14.2 avg: 44.8 median: 56.9 (8%) max: 63.4 Watt
Power Consumption - The Witcher 3 Power Consumption - external Monitor *
min: 70 avg: 86.4 median: 92.9 (13%) max: 96.2 Watt
Average Benchmarks Intel UHD Graphics Xe 750 32EUs (Rocket Lake) → 0% n=
- Range of benchmark values for this graphics card
- Average benchmark values for this graphics card
* Smaller numbers mean a higher performance
1 This benchmark is not used for the average calculation
Game Benchmarks The following benchmarks stem from our benchmarks of review laptops. The performance depends on the used graphics memory, clock rate, processor, system settings, drivers, and operating systems. So the results don't have to be representative for all laptops with this GPU. For detailed information on the benchmark results, click on the fps number.
100%
UHD Graphics Xe 750 32EUs:
21.1 [X] Asus ROG Maximus XIII Hero, Intel Xe 750 918016
Intel Core i9-11900K 3.5GHz
UHD Graphics Xe 750 32EUs
min:
18 fps, P1:
18 fps, max:
24 fps
fps
100%
UHD Graphics Xe 750 32EUs:
18.8 [X] Asus ROG Maximus XIII Hero, Intel Xe 750 918016
Intel Core i9-11900K 3.5GHz
UHD Graphics Xe 750 32EUs
min:
16 fps, P1:
16 fps, max:
21 fps
fps
100%
UHD Graphics Xe 750 32EUs:
12.9 (!) [X] Asus ROG Maximus XIII Hero, Intel Xe 750 Intel Core i9-11900K 3.5GHz
UHD Graphics Xe 750 32EUs
min:
7.82 fps, P0.1:
7.9 fps, P1:
8.9 fps, max:
26.4 fps
fps
100%
UHD Graphics Xe 750 32EUs:
198.3 [X] Asus ROG Maximus XIII Hero, Intel Xe 750 Intel Core i9-11900K 3.5GHz
UHD Graphics Xe 750 32EUs
min:
5.35 fps, P0.1:
75.2 fps, P1:
112.9 fps, max:
501 fps
fps
100%
UHD Graphics Xe 750 32EUs:
64.1 [X] Asus ROG Maximus XIII Hero, Intel Xe 750 Intel Core i9-11900K 3.5GHz
UHD Graphics Xe 750 32EUs
min:
5.06 fps, P0.1:
43.2 fps, P1:
48.2 fps, max:
163 fps
fps
100%
UHD Graphics Xe 750 32EUs:
50.8 [X] Asus ROG Maximus XIII Hero, Intel Xe 750 Intel Core i9-11900K 3.5GHz
UHD Graphics Xe 750 32EUs
min:
21.1 fps, P0.1:
37.3 fps, P1:
39 fps, max:
95.6 fps
fps
100%
UHD Graphics Xe 750 32EUs:
36.1 [X] Asus ROG Maximus XIII Hero, Intel Xe 750 Intel Core i9-11900K 3.5GHz
UHD Graphics Xe 750 32EUs
min:
27.9 fps, P0.1:
28.2 fps, P1:
28.9 fps, max:
46.8 fps
fps
100%
UHD Graphics Xe 750 32EUs:
24 [X] Intel Core i9-11900K Intel Core i9-11900K 3.5GHz
UHD Graphics Xe 750 32EUs
min:
14.19 fps, max:
36.89 fps
fps
100%
UHD Graphics Xe 750 32EUs:
10.6 [X] Intel Core i9-11900K Intel Core i9-11900K 3.5GHz
UHD Graphics Xe 750 32EUs
min:
5.39 fps, max:
15.76 fps
fps
100%
UHD Graphics Xe 750 32EUs:
7.7 [X] Intel Core i9-11900K Intel Core i9-11900K 3.5GHz
UHD Graphics Xe 750 32EUs
min:
3.83 fps, max:
11.85 fps
fps
100%
UHD Graphics Xe 750 32EUs:
25.2 51.1 [X] Intel Core i9-11900K 1.47.22.14 D3D12
Intel Core i9-11900K 3.5GHz
UHD Graphics Xe 750 32EUs
min:
10.4 fps, P1:
14.5 fps, max:
566 fps
~ 38 fps
100%
UHD Graphics Xe 750 32EUs:
10.1 19 [X] Intel Core i9-11900K 1.47.22.14 D3D12
Intel Core i9-11900K 3.5GHz
UHD Graphics Xe 750 32EUs
min:
5 fps, P1:
5 fps, max:
430 fps
~ 15 fps
100%
UHD Graphics Xe 750 32EUs:
9.2 15 [X] Intel Core i9-11900K 1.47.22.14 D3D12
Intel Core i9-11900K 3.5GHz
UHD Graphics Xe 750 32EUs
min:
5 fps, P1:
5 fps, max:
446 fps
~ 12 fps
100%
UHD Graphics Xe 750 32EUs:
13.2 [X] Intel Core i9-11900K 1.47.22.14 D3D12
Intel Core i9-11900K 3.5GHz
UHD Graphics Xe 750 32EUs
min:
5 fps, P1:
5 fps, max:
512 fps
fps
100%
UHD Graphics Xe 750 32EUs:
11.3 17.6 [X] Asus ROG Maximus XIII Hero, Intel Xe 750 Intel Core i5-11600K 3.9GHz
UHD Graphics Xe 750 32EUs
18.3 [X] Asus Maximus XIII Hero Intel Core i7-11700K 3.6GHz
UHD Graphics Xe 750 32EUs
~ 16 fps
100%
UHD Graphics Xe 750 32EUs:
8.5 17.3 [X] Asus Maximus XIII Hero Intel Core i7-11700K 3.6GHz
UHD Graphics Xe 750 32EUs
18.8 [X] Asus ROG Maximus XIII Hero, Intel Xe 750 Intel Core i5-11600K 3.9GHz
UHD Graphics Xe 750 32EUs
~ 15 fps
100%
UHD Graphics Xe 750 32EUs:
7.6 16.4 [X] Asus Maximus XIII Hero Intel Core i7-11700K 3.6GHz
UHD Graphics Xe 750 32EUs
18 [X] Asus ROG Maximus XIII Hero, Intel Xe 750 Intel Core i5-11600K 3.9GHz
UHD Graphics Xe 750 32EUs
~ 14 fps
100%
UHD Graphics Xe 750 32EUs:
5.9 23 [X] Intel Core i9-11900K 1.3
Intel Core i9-11900K 3.5GHz
UHD Graphics Xe 750 32EUs
23.6 [X] Asus ROG Maximus XIII Hero, Intel Xe 750 1.3
Intel Core i9-11900K 3.5GHz
UHD Graphics Xe 750 32EUs
~ 18 fps
100%
UHD Graphics Xe 750 32EUs:
3.5 12.3 [X] Asus ROG Maximus XIII Hero, Intel Xe 750 1.3
Intel Core i9-11900K 3.5GHz
UHD Graphics Xe 750 32EUs
12.4 [X] Intel Core i9-11900K 1.3
Intel Core i9-11900K 3.5GHz
UHD Graphics Xe 750 32EUs
~ 9 fps
100%
UHD Graphics Xe 750 32EUs:
2.5 8.4 [X] Asus ROG Maximus XIII Hero, Intel Xe 750 1.3
Intel Core i9-11900K 3.5GHz
UHD Graphics Xe 750 32EUs
8.5 [X] Intel Core i9-11900K 1.3
Intel Core i9-11900K 3.5GHz
UHD Graphics Xe 750 32EUs
~ 6 fps
100%
UHD Graphics Xe 750 32EUs:
6 [X] Asus ROG Maximus XIII Hero, Intel Xe 750 1.3
Intel Core i9-11900K 3.5GHz
UHD Graphics Xe 750 32EUs
fps
100%
UHD Graphics Xe 750 32EUs:
3.5 [X] Asus ROG Maximus XIII Hero, Intel Xe 750 1.3
Intel Core i9-11900K 3.5GHz
UHD Graphics Xe 750 32EUs
fps
100%
UHD Graphics Xe 750 32EUs:
35.1 84.8 [X] Intel Core i9-11900K Intel Core i9-11900K 3.5GHz
UHD Graphics Xe 750 32EUs
min:
31.6 fps, max:
-1 fps
126 [X] Asus ROG Maximus XIII Hero, Intel Xe 750 Intel Core i5-11600K 3.9GHz
UHD Graphics Xe 750 32EUs
min:
108.5 fps, max:
-1 fps
132 [X] Asus ROG Maximus XIII Hero, Intel Xe 750 Intel Core i9-11900K 3.5GHz
UHD Graphics Xe 750 32EUs
min:
109.7 fps, max:
-1 fps
133 [X] Asus Maximus XIII Hero Intel Core i7-11700K 3.6GHz
UHD Graphics Xe 750 32EUs
min:
107.7 fps, max:
-1 fps
~ 102 fps
100%
UHD Graphics Xe 750 32EUs:
20.6 60.3 [X] Intel Core i9-11900K Intel Core i9-11900K 3.5GHz
UHD Graphics Xe 750 32EUs
min:
29.5 fps, max:
-1 fps
73.8 [X] Asus ROG Maximus XIII Hero, Intel Xe 750 Intel Core i9-11900K 3.5GHz
UHD Graphics Xe 750 32EUs
min:
64.6 fps, max:
-1 fps
74.2 [X] Asus Maximus XIII Hero Intel Core i7-11700K 3.6GHz
UHD Graphics Xe 750 32EUs
min:
65.4 fps, max:
-1 fps
74.7 [X] Asus ROG Maximus XIII Hero, Intel Xe 750 Intel Core i5-11600K 3.9GHz
UHD Graphics Xe 750 32EUs
min:
66.1 fps, max:
-1 fps
~ 61 fps
100%
UHD Graphics Xe 750 32EUs:
10.9 32.6 [X] Intel Core i9-11900K Intel Core i9-11900K 3.5GHz
UHD Graphics Xe 750 32EUs
min:
7.8 fps, max:
-1 fps
34.9 [X] Asus ROG Maximus XIII Hero, Intel Xe 750 Intel Core i5-11600K 3.9GHz
UHD Graphics Xe 750 32EUs
min:
31.8 fps, max:
-1 fps
35.5 [X] Asus Maximus XIII Hero Intel Core i7-11700K 3.6GHz
UHD Graphics Xe 750 32EUs
min:
32.4 fps, max:
-1 fps
35.6 [X] Asus ROG Maximus XIII Hero, Intel Xe 750 Intel Core i9-11900K 3.5GHz
UHD Graphics Xe 750 32EUs
min:
32.3 fps, max:
-1 fps
~ 30 fps
100%
UHD Graphics Xe 750 32EUs:
9.9 30 [X] Intel Core i9-11900K Intel Core i9-11900K 3.5GHz
UHD Graphics Xe 750 32EUs
min:
11.4 fps, max:
-1 fps
31.9 [X] Asus ROG Maximus XIII Hero, Intel Xe 750 Intel Core i5-11600K 3.9GHz
UHD Graphics Xe 750 32EUs
min:
29.2 fps, max:
-1 fps
32.5 [X] Asus Maximus XIII Hero Intel Core i7-11700K 3.6GHz
UHD Graphics Xe 750 32EUs
min:
29.6 fps, max:
-1 fps
32.6 [X] Asus ROG Maximus XIII Hero, Intel Xe 750 Intel Core i9-11900K 3.5GHz
UHD Graphics Xe 750 32EUs
min:
29.7 fps, max:
-1 fps
~ 27 fps
100%
UHD Graphics Xe 750 32EUs:
12.4 [X] Asus ROG Maximus XIII Hero, Intel Xe 750 Intel Core i9-11900K 3.5GHz
UHD Graphics Xe 750 32EUs
min:
11.5 fps, max:
-1 fps
fps
100%
UHD Graphics Xe 750 32EUs:
36.8 fps
100%
UHD Graphics Xe 750 32EUs:
34.1 fps
Average Gaming Intel UHD Graphics Xe 750 32EUs (Rocket Lake) → 100% Average Gaming 30-70 fps → 100%
Intel UHD Graphics Xe 750 32EUs (Rocket Lake) low med. high ultra QHD 4K F1 22 21.1 18.8 God of War 12.9 Valorant 198.3 64.1 50.8 36.1 Metro Exodus 24 10.6 7.74 Strange Brigade 38 15 12 13.2 X-Plane 11.11 16 15 14 Final Fantasy XV Benchmark 18 9 6 6 3.48 Dota 2 Reborn 102 61 30 27 12.4 GTA V 36.8 34.1 < 30 fps < 60 fps < 120 fps ≥ 120 fps 5 2 1 1 5 1 2 4 2 2 1 1 2
For more games that might be playable and a list of all games and graphics cards visit our Gaming List
v1.27
log 17. 03:45:37
#0 checking url part for id 10943 +0s ... 0s
#1 checking url part for id 11128 +0s ... 0s
#2 not redirecting to Ajax server +0s ... 0s
#3 did not recreate cache, as it is less than 5 days old! Created at Sun, 16 Jun 2024 05:38:48 +0200 +0.001s ... 0.001s
#4 composed specs +0.088s ... 0.089s
#5 did output specs +0s ... 0.09s
#6 start showIntegratedCPUs +0s ... 0.09s
#7 getting avg benchmarks for device 10943 +0.049s ... 0.138s
#8 got single benchmarks 10943 +0.018s ... 0.157s
#9 getting avg benchmarks for device 11128 +0.002s ... 0.159s
#10 got single benchmarks 11128 +0s ... 0.159s
#11 got avg benchmarks for devices +0s ... 0.159s
#12 min, max, avg, median took s +0.17s ... 0.329s
#13 before gaming benchmark output +0s ... 0.329s
#14 Got 60 rows for game benchmarks. +0.007s ... 0.336s
#15 composed SQL query for gamebenchmarks +0s ... 0.336s
#16 got data and put it in $dataArray +0.006s ... 0.343s
#17 benchmarks composed for output. +0.02s ... 0.363s
#18 calculated avg scores. +0s ... 0.363s
#19 return log +0.038s ... 0.401s
Please share our article, every link counts!
Redaktion, 2017-09- 8 (Update: 2023-07- 1)
 Deutsch
 English
 Español
 Français
 Italiano
 Nederlands
 Polski
 Português
 Русский
 Türkçe
 Svenska
 Chinese
 Magyar