Kingston NV2 500GB SNV2S/500G vs Intel SSD 670p SSDPEKNU512GZ
Kingston NV2 500GB SNV2S/500G
► remove from comparison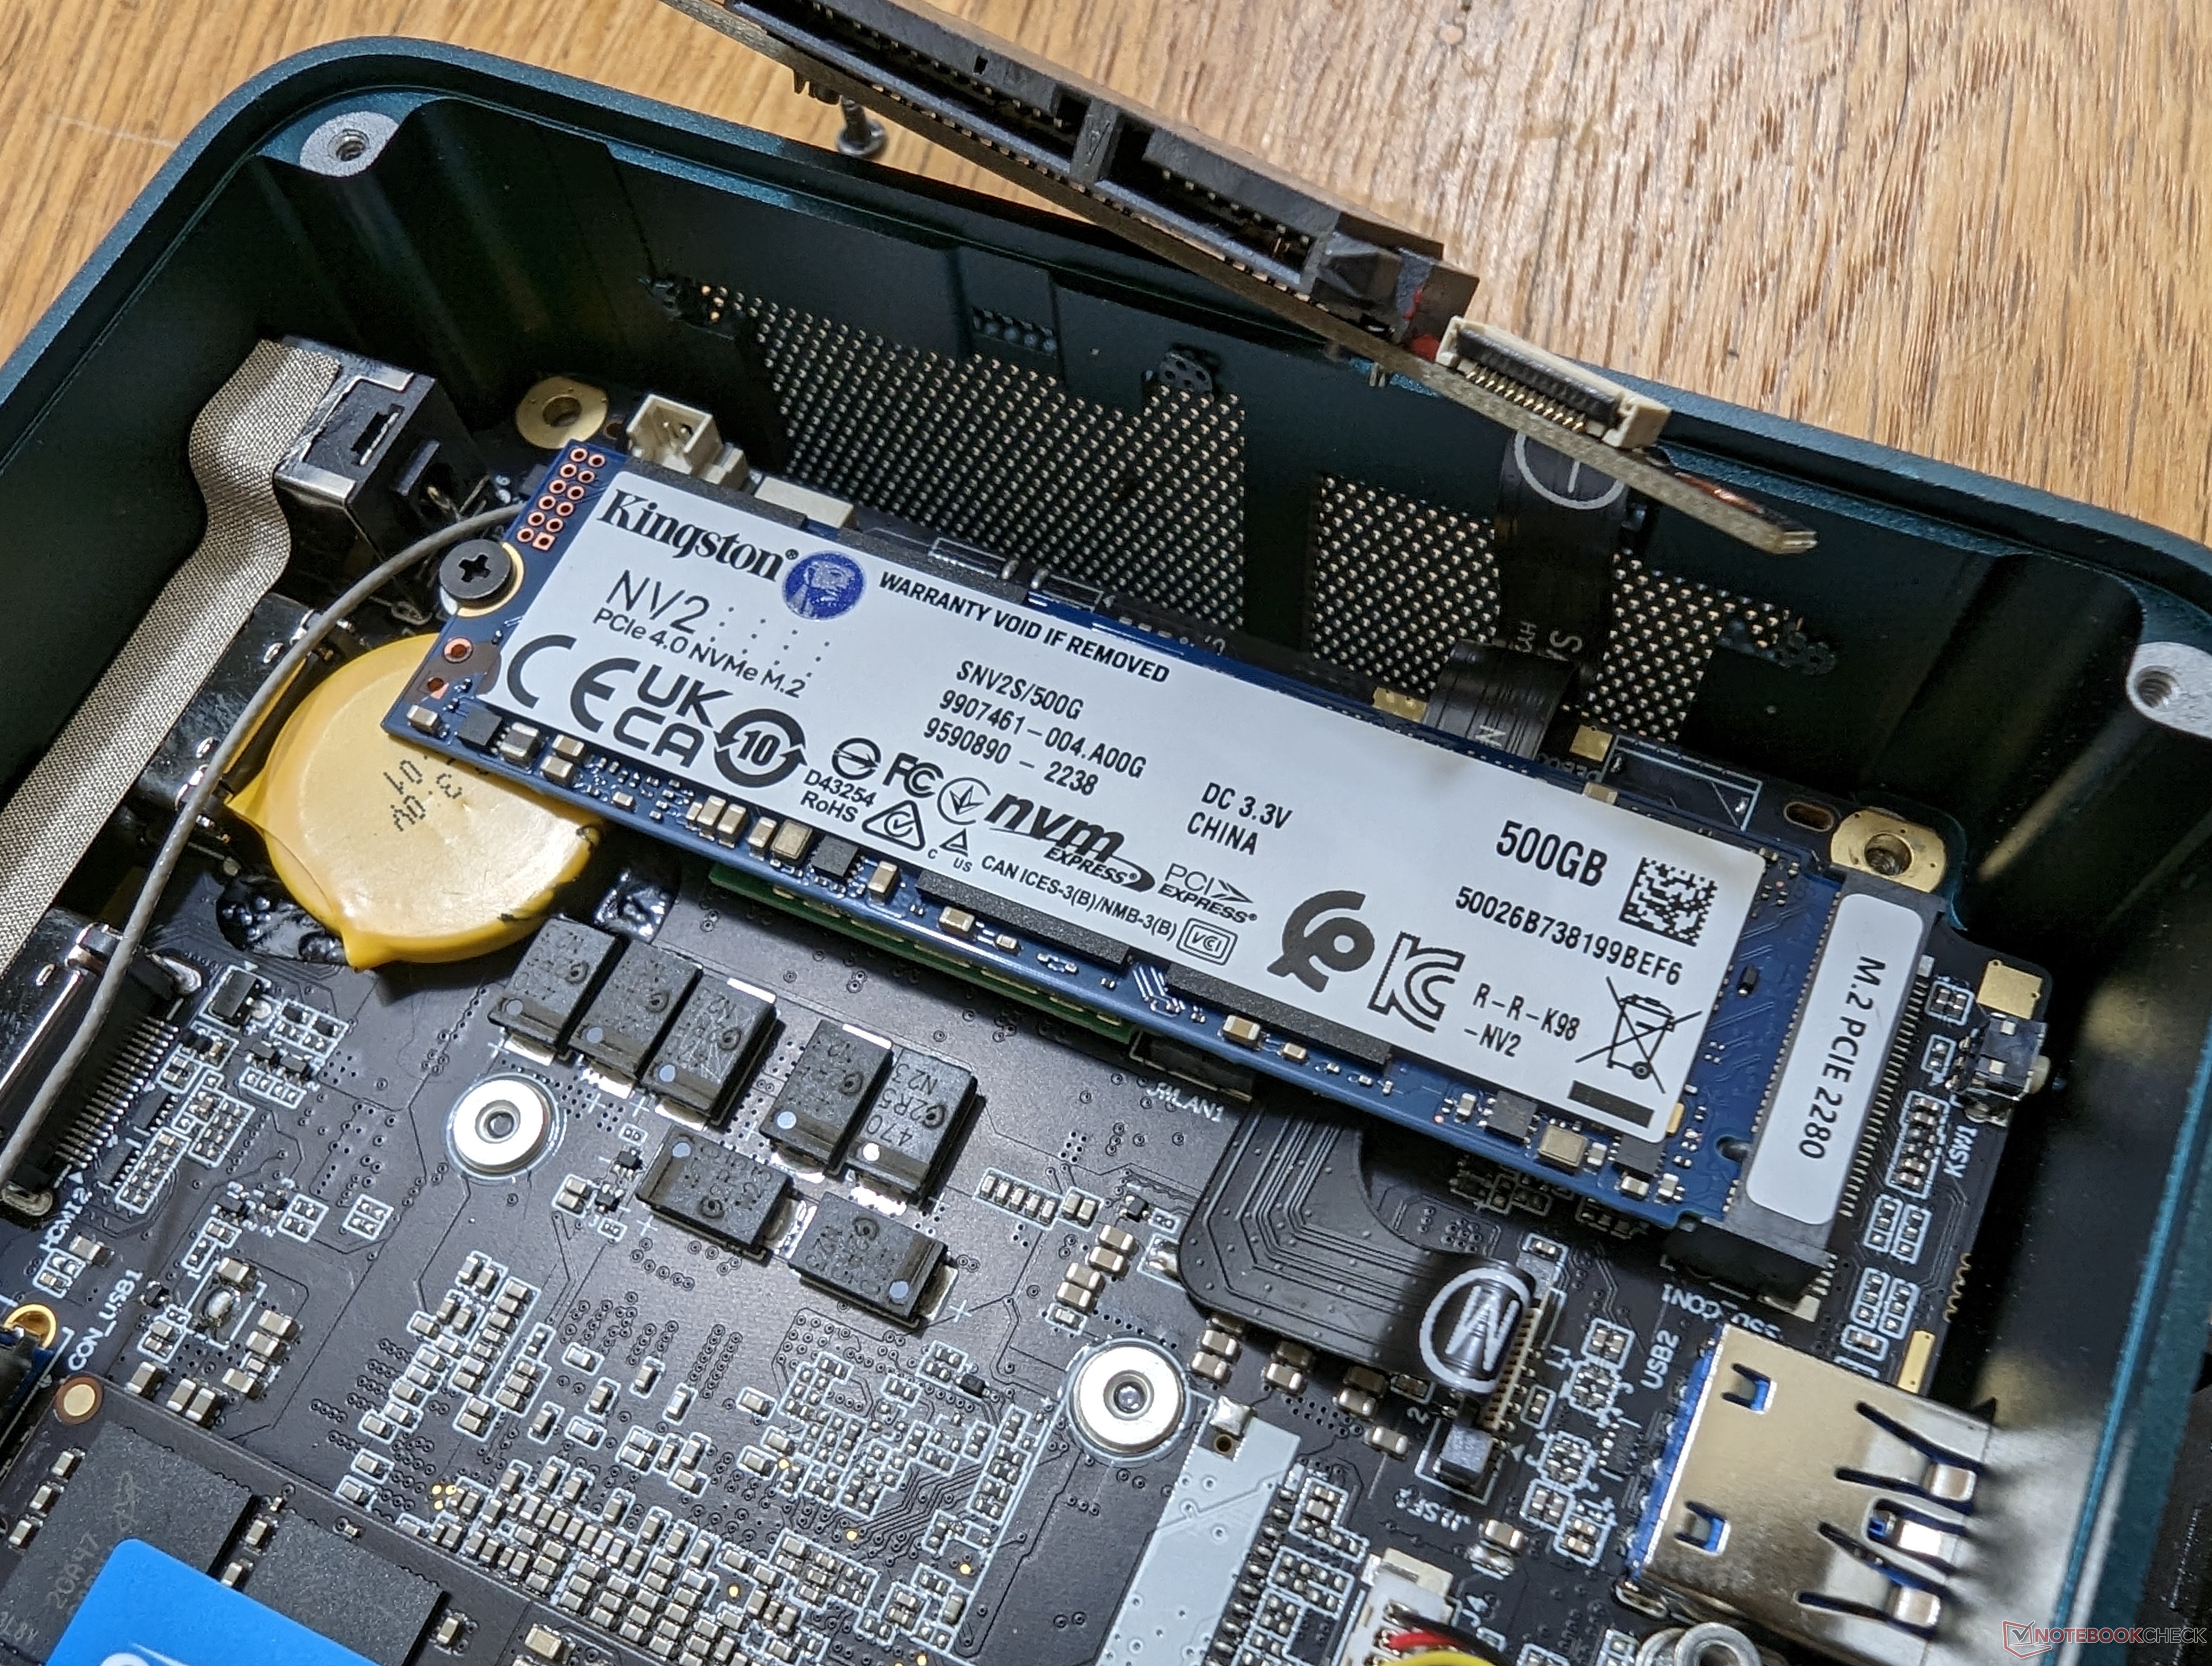
The Kingston Kingston NV2 NVMe PCIe 4.0 SSD 500GB, M.2 (SNV2S/500G) is a relatively fast budget 4x4 NVME PCIe SSD that can depend on various controllers and memory chips. Therefore, the performance can differ greatly depending on the model you get. In our first review of the Beeling SER6 Pro the SSD showed very good results. Kingston specifies the SSD with up to 3,500 MB/s read and 2,100 MB/s write and offers a 3-year limited warranty.
Intel SSD 670p SSDPEKNU512GZ
► remove from comparison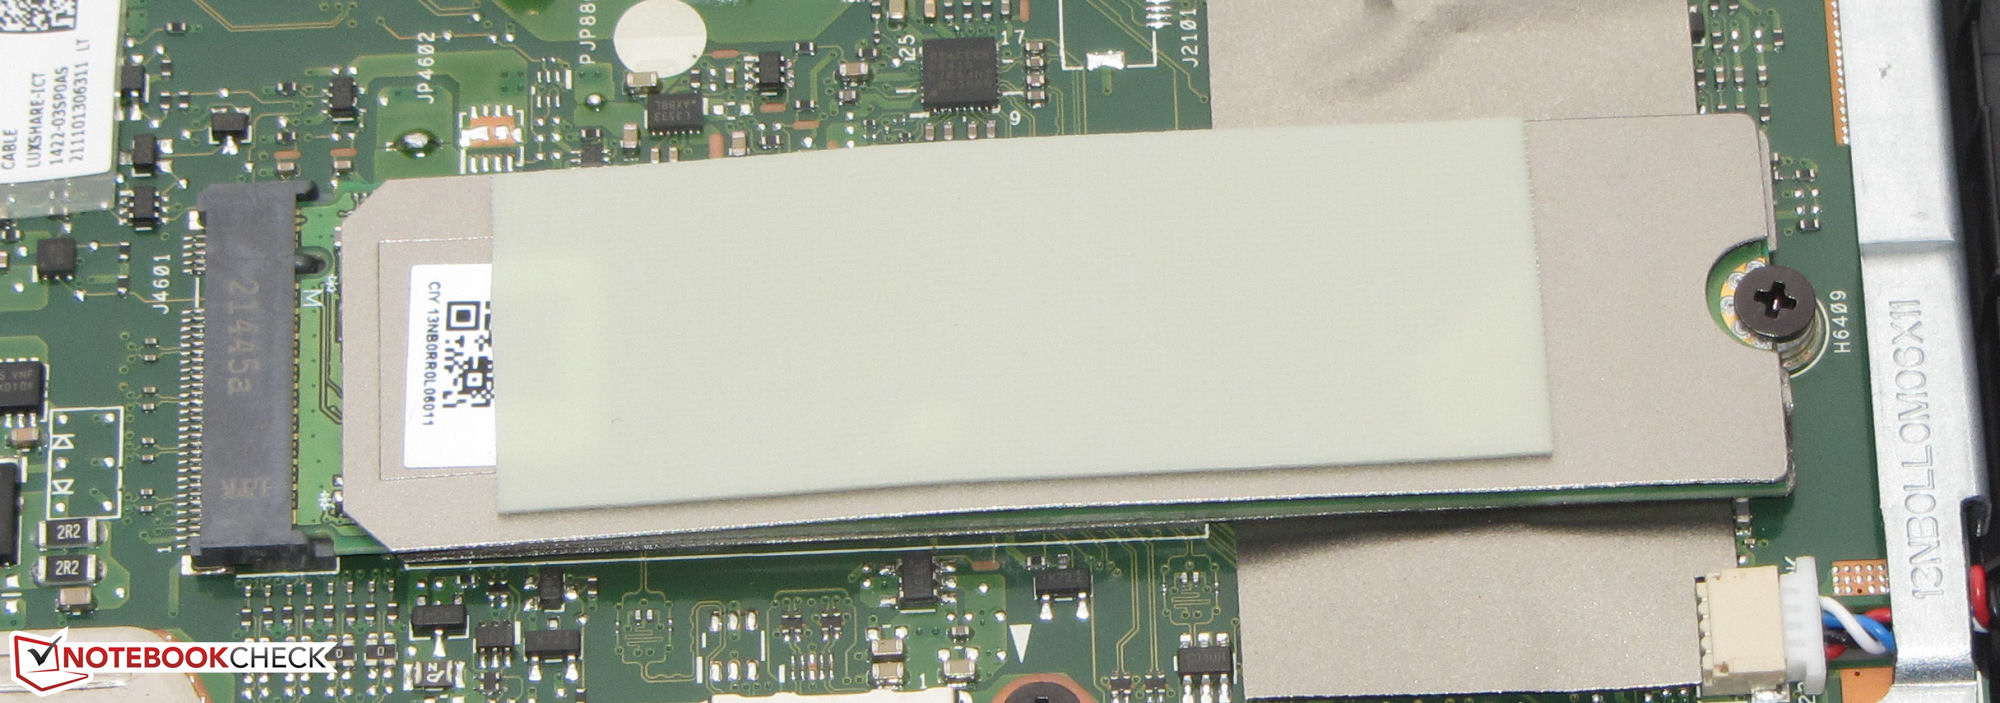
The Intel SSD 670p 512GB SSDPEKNU512GZ is a mid range PCIe M.2 2280 SSD. It uses 512 GB QLC 3D-NAND with 144 Layers and a Silicon Motion SM2265G controller. The NVMe 1.4 drive is rated at a maximum of 3000 MB/s read and 1600 MB/s write (SLC cached).
| Kingston NV2 500GB SNV2S/500G | Intel SSD 670p SSDPEKNU512GZ | |
| Type | SSD | SSD |
| Size | M.2 2280 | M.2 |
| Capacity | 500 GB | 512 GB |
| Interface | NVMe | NVMe |
| Controller | Various | |
| Announced | 23.01.2023 | 03.03.2021 |
| Link | Kingston NV2 500GB SNV2S/500G |
Benchmarks
Performance Rating - DiskSpd - SNV2S/500G
28.1 pt (32%)
Seagate ST1000LM014 Solid State Hybrid Drive
...
2x Kingston OM8PGP4256Q-A0 (RAID 0)
GOFATOO P110E-512GB
Kingston OM8TAP41024K1-A00
Kingston NV2 500GB SNV2S/500G
Micron 3500 1TB MTFDKBA1T0TGD
Kioxia BG6 KBG6AZNV1T02
Netac NS1T0BSSD610
...
Kingston Fury Renegade G5 4TB
0%
100%
Performance Rating - DiskSpd - 670p 512GB
22.2 pt (25%)
Seagate ST1000LM014 Solid State Hybrid Drive
...
Kioxia BG5 KBG5AZNT512G
Future Path FPE220M8SSD512G
Intel SSD 670p SSDPEKNU512GZ
Toshiba KBG40ZNV512G
Samsung MZ9L4512HBLU-00BMV
...
Kingston Fury Renegade G5 4TB
0%
100%
48%
670p 512GB +min: 92.7 avg: 652 median: 769.7 (13%) max: 1170.24 MB/s
45%
670p 512GB +min: 153.39 avg: 342.3 median: 306.5 (11%) max: 630.73 MB/s
50%
670p 512GB +min: 164.99 avg: 1091 median: 1316.5 (5%) max: 1534.29 MB/s
61%
670p 512GB +min: 1486 avg: 2415 median: 2525 (15%) max: 2597 Points

78%
670p 512GB +min: 384 avg: 1310 median: 1418 (20%) max: 1492 Points
48%
670p 512GB +min: 669 avg: 758 median: 763 (12%) max: 801 Points
985%
670p 512GB +min: 0.033 avg: 0.1 median: 0 (0%) max: 0.102 ms
69%
670p 512GB +min: 0.074 avg: 0.1 median: 0.1 (0%) max: 0.157 ms
82%
670p 512GB +min: 169 avg: 1036 median: 1163.3 (20%) max: 1237.33 MB/s
36%
670p 512GB +min: 413.48 avg: 444 median: 447.2 (9%) max: 457 MB/s
66%
670p 512GB +min: 101.77 avg: 151.4 median: 139.5 (27%) max: 219.46 MB/s
159%
670p 512GB +min: 51.69 avg: 64 median: 60.7 (19%) max: 77.91 MB/s
AS SSD - Sequential Write
100%
SNV2S/500G +min: 1926.48 avg: 2065 median: 2065.3 (18%) max: 2204.04 MB/s
54%
670p 512GB +min: 1021 avg: 1225 median: 1118.9 (10%) max: 1494.84 MB/s
AS SSD - Sequential Read
100%
SNV2S/500G +min: 3079.48 avg: 3109 median: 3108.9 (24%) max: 3138.31 MB/s
81%
670p 512GB +min: 1718.27 avg: 2496 median: 2529 (20%) max: 2735.98 MB/s
CrystalDiskMark 5.2 / 6 - CDM 5/6 Write 4K
100%
SNV2S/500G +min: 208.2 avg: 222.9 median: 222.9 (20%) max: 237.5 MB/s
95%
670p 512GB +min: 110.6 avg: 187.6 median: 211.3 (19%) max: 257 MB/s
CrystalDiskMark 5.2 / 6 - CDM 5/6 Read 4K
100%
SNV2S/500G +min: 44.56 avg: 52.9 median: 52.9 (1%) max: 61.29 MB/s
157%
670p 512GB +min: 50.26 avg: 73.7 median: 83.3 (2%) max: 87.97 MB/s
CrystalDiskMark 5.2 / 6 - CDM 5 Write Seq
100%
SNV2S/500G +min: 408.3 avg: 1437 median: 1436.7 (8%) max: 2465 MB/s
113%
670p 512GB +min: 433.99 avg: 1397 median: 1625 (9%) max: 1657 MB/s
CrystalDiskMark 5.2 / 6 - CDM 5 Read Seq
100%
SNV2S/500G +min: 2906 avg: 3051 median: 3050.5 (33%) max: 3195 MB/s
75%
670p 512GB +min: 467.15 avg: 2021 median: 2291 (24%) max: 2616 MB/s
CrystalDiskMark 5.2 / 6 - CDM 5/6 Write 4K Q32T1
100%
SNV2S/500G +min: 344.5 avg: 419.4 median: 419.4 (9%) max: 494.3 MB/s
117%
670p 512GB +min: 323.4 avg: 692 median: 492 (10%) max: 1655.7 MB/s
CrystalDiskMark 5.2 / 6 - CDM 5/6 Read 4K Q32T1
100%
SNV2S/500G +min: 634.9 avg: 640 median: 640.1 (9%) max: 645.2 MB/s
72%
670p 512GB +min: 310.4 avg: 867 median: 463.8 (7%) max: 2640.25 MB/s
CrystalDiskMark 5.2 / 6 - CDM 5/6 Write Seq Q32T1
100%
SNV2S/500G +min: 2145 avg: 2301 median: 2300.5 (15%) max: 2456 MB/s
72%
670p 512GB +min: 1630 avg: 1646 median: 1651 (11%) max: 1660.58 MB/s
CrystalDiskMark 5.2 / 6 - CDM 5/6 Read Seq Q32T1
100%
SNV2S/500G +min: 3456 avg: 3539 median: 3538.5 (19%) max: 3621 MB/s
80%
670p 512GB +min: 2685 avg: 2862 median: 2837.1 (15%) max: 3047 MB/s
DiskSpd - DiskSpd 4k_q1t1_write
100%
SNV2S/500G +min: 239 avg: 244.5 median: 244.5 (56%) max: 250 MB/s
60%
670p 512GB +min: 82.2 avg: 169 median: 146 (34%) max: 260 MB/s
177%
670p 512GB +min: 55.2 avg: 71.1 median: 72.9 (21%) max: 86.1 MB/s
DiskSpd - DiskSpd 4k_q32t16_write
100%
SNV2S/500G +min: 1362 avg: 1377 median: 1376.5 (20%) max: 1391 MB/s
61%
670p 512GB +min: 221 avg: 828 median: 843 (13%) max: 1306 MB/s
DiskSpd - DiskSpd 4k_q32t16_read
100%
SNV2S/500G +min: 1227 avg: 1398 median: 1397.5 (17%) max: 1568 MB/s
34%
670p 512GB +min: 466 avg: 474.9 median: 475.5 (6%) max: 481 MB/s
72%
670p 512GB +min: 1586 avg: 1636 median: 1629 (16%) max: 1675 MB/s
84%
670p 512GB +min: 1629 avg: 2206 median: 2264.5 (24%) max: 2549 MB/s
DiskSpd - DiskSpd seq_q8t1_write
100%
SNV2S/500G +min: 2195 avg: 2233 median: 2233 (15%) max: 2271 MB/s
74%
670p 512GB +min: 1621 avg: 1650 median: 1650 (11%) max: 1688 MB/s
DiskSpd - DiskSpd seq_q8t1_read
100%
SNV2S/500G +min: 2849 avg: 3201 median: 3201 (20%) max: 3553 MB/s
90%
670p 512GB +min: 2132 avg: 2684 median: 2878 (18%) max: 3041 MB/s
DiskSpd - DiskSpd Loop seq_q8t1_read
100%
SNV2S/500G +min: 2669 avg: 2856 median: 2856 (18%) max: 3043 MB/s
92%
670p 512GB +min: 2150 avg: 2579 median: 2615 (16%) max: 3034 MB/s
- Range of benchmark values for this graphics card
 - Average benchmark values for this graphics card
* Smaller numbers mean a higher performance
* Smaller numbers mean a higher performance
Average Benchmarks
Kingston NV2 500GB SNV2S/500G → 100% n=31
Intel SSD 670p SSDPEKNU512GZ → 109% n=31
Average of the median scores above. 1 ... This benchmark is not used for the average calculation
- $100.16Kingston NV3 500GB M.2 2280 NVMe SSD | PCIe 4.0 Gen 4x4 | Up to 5000 MB/s | SNV3S/500G
- $154.99Kingston NV3 500GB M.2 2230 NVMe SSD | Up to 5000MB/s | SNV3SM3/500G
- $109.99Western Digital 500GB WD Green SN3000 NVMe Internal SSD - Solid State Drive - Gen4 PCIe, M.2 2280, Up to 5,000 MB/s - WDS500G4G0E
- $89.99Kingston NV1 500G M.2 2280 NVMe PCIe Internal SSD Up to 2100 MB/s SNVS/500G
- $85.99Fikwot FN950 500GB NVMe SSD PCIe Gen4x4 M.2 2280,Read Up to 5000MB/s, Configure SLC Cache, Internal Solid State Drive for PS5 Laptop Desktop
v1.35