 Deutsch
 English
 Español
 Français
 Italiano
 Nederlands
 Polski
 Português
 Русский
 Türkçe
 Svenska
 Chinese
 Magyar
Beelink SER6 Pro review: The AMD Radeon 680M is stunning on a mini PC
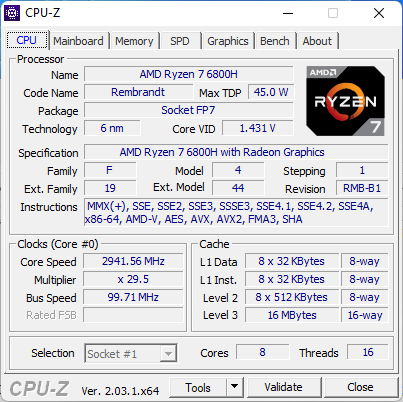
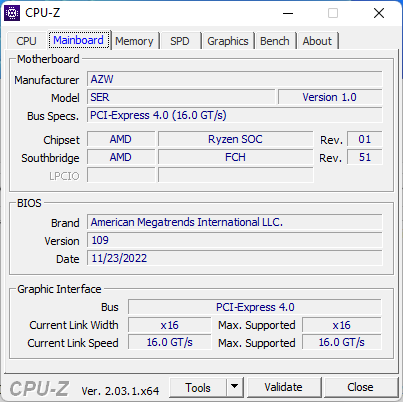
The Beelink SER6 Pro succeeds the older generation Beelink SER5 Pro. It introduces new external changes and an upgraded Zen 3+ Ryzen 7 6800H CPU to replace the Zen 3 Ryzen 7 5800H on the outgoing model. No other CPU options are available for the SER6 Pro at the moment.
The SER6 Pro competes directly with many Intel NUC solutions as well as the Zotac ZBox or the MSI Cubi series. Our specific configuration from Beelink retails between $600 and $700 USD.
More Beelink reviews:
Potential Competitors in Comparison
Rating | Date | Model | Weight | Height | Size | Resolution | Best Price |
|---|---|---|---|---|---|---|---|
01/2023 | Beelink SER6 Pro R7 6800H, Radeon 680M | 511 g | 42 mm | x | |||
11/2022 | Beelink GTR6 R9 6900HX, Radeon 680M | 815 g | 43 mm | x | |||
09/2022 | Beelink SEi11 Pro i5-11320H, Iris Xe G7 96EUs | 440 g | 40 mm | x | |||
| 78.9 % | 11/2022 | Intel NUC 12 Pro Kit NUC12WSKi7 i7-1260P, Iris Xe G7 96EUs | 511 g | 37 mm | x | ||
04/2021 | Intel NUC11PHKi7C i7-1165G7, GeForce RTX 2060 Mobile | 1.4 kg | 42 mm | x | |||
03/2018 | Intel Hades Canyon NUC8i7HVK i7-8809G, Vega M GH | 1.3 kg | 39 mm | x |
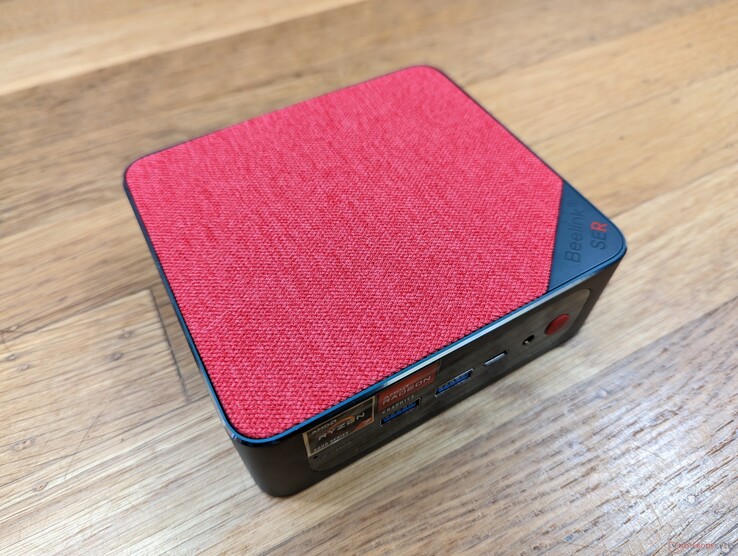
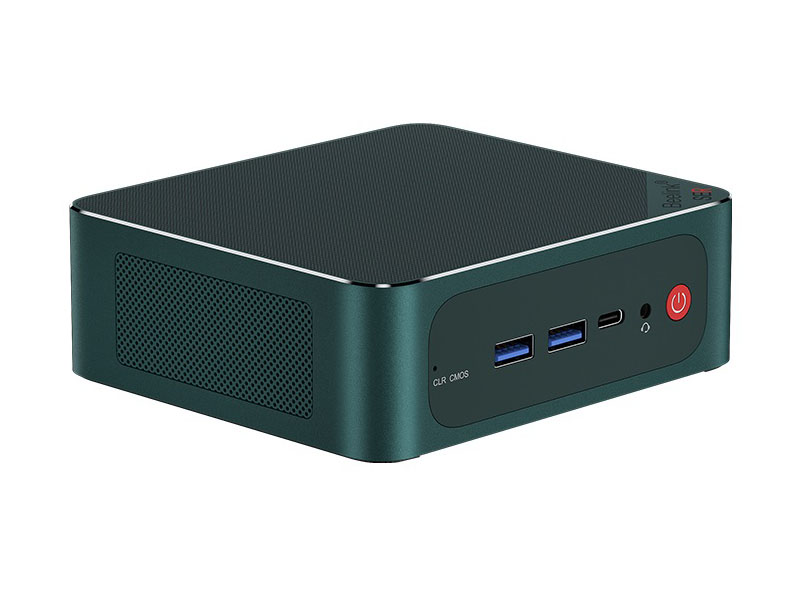
Case
The chassis is metal on all sides aside from the removable fabric top cover. Its overall dimensions are very similar to the SEi11 Pro albeit slightly heavier due to the revised internals. Surprisingly, the SER6 Pro weighs as much as the NUC 12 Pro even though the NUC is smaller.

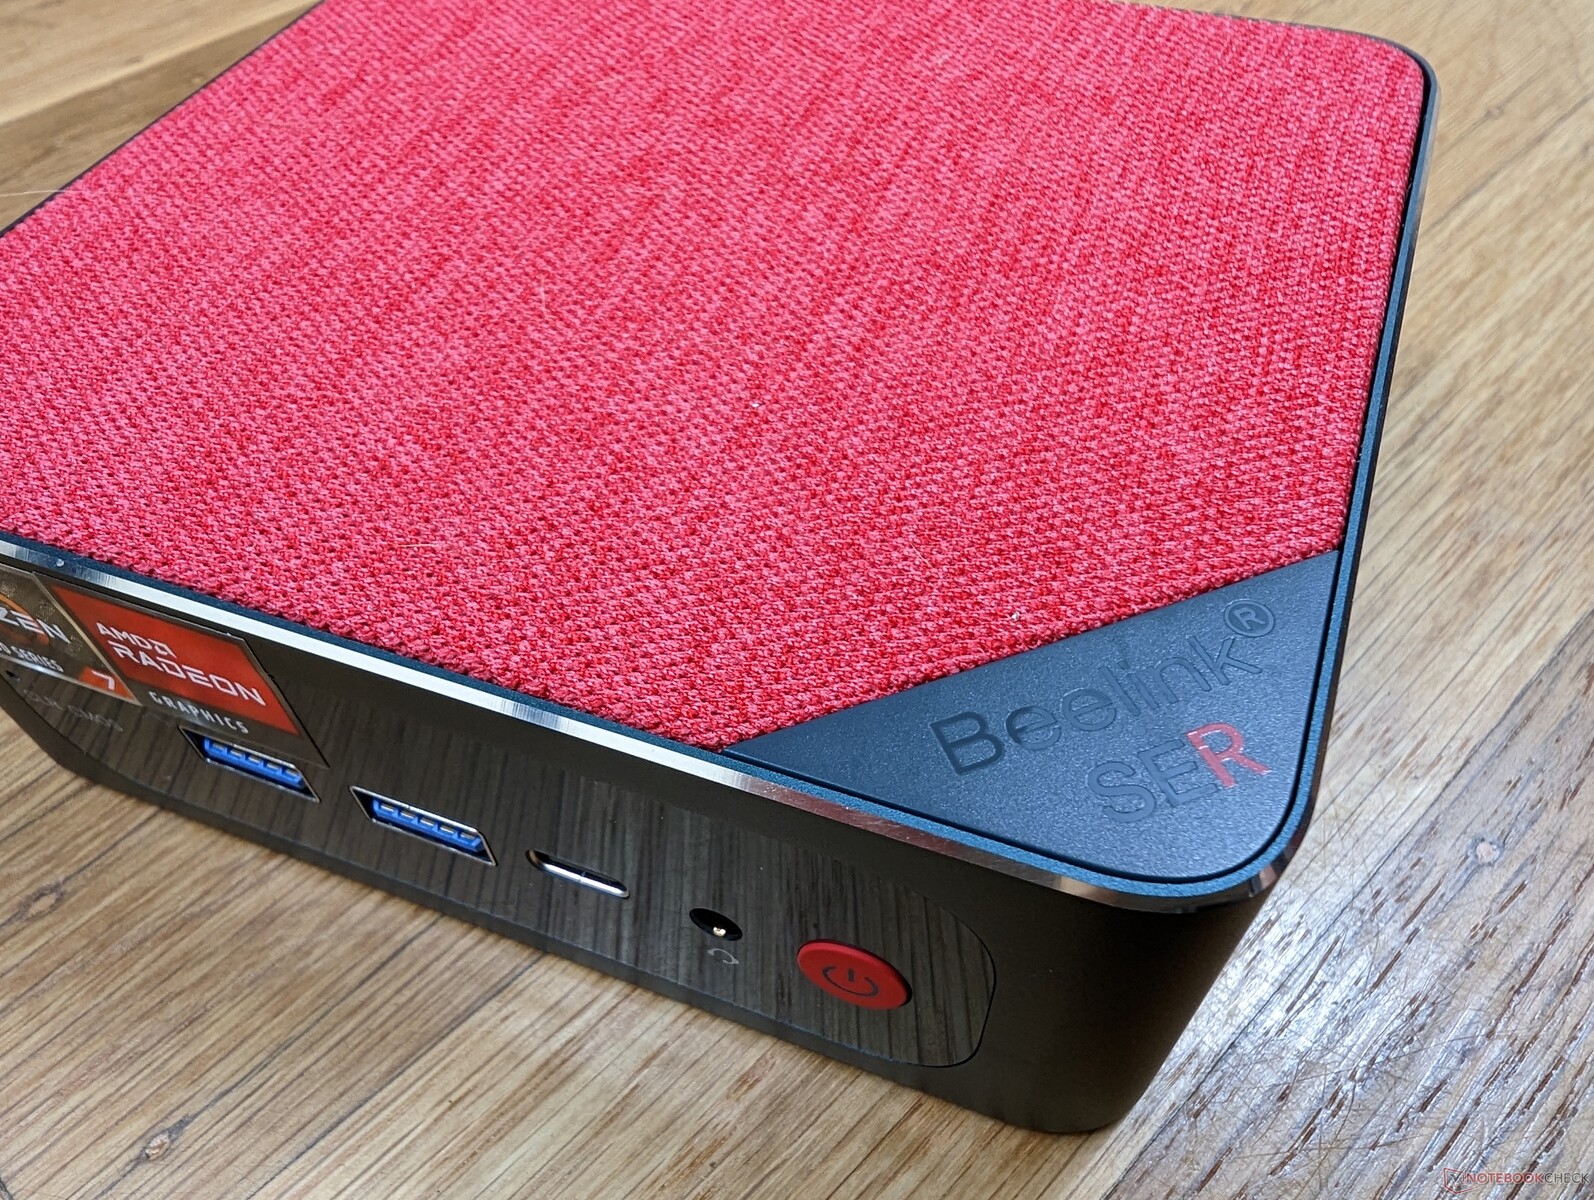
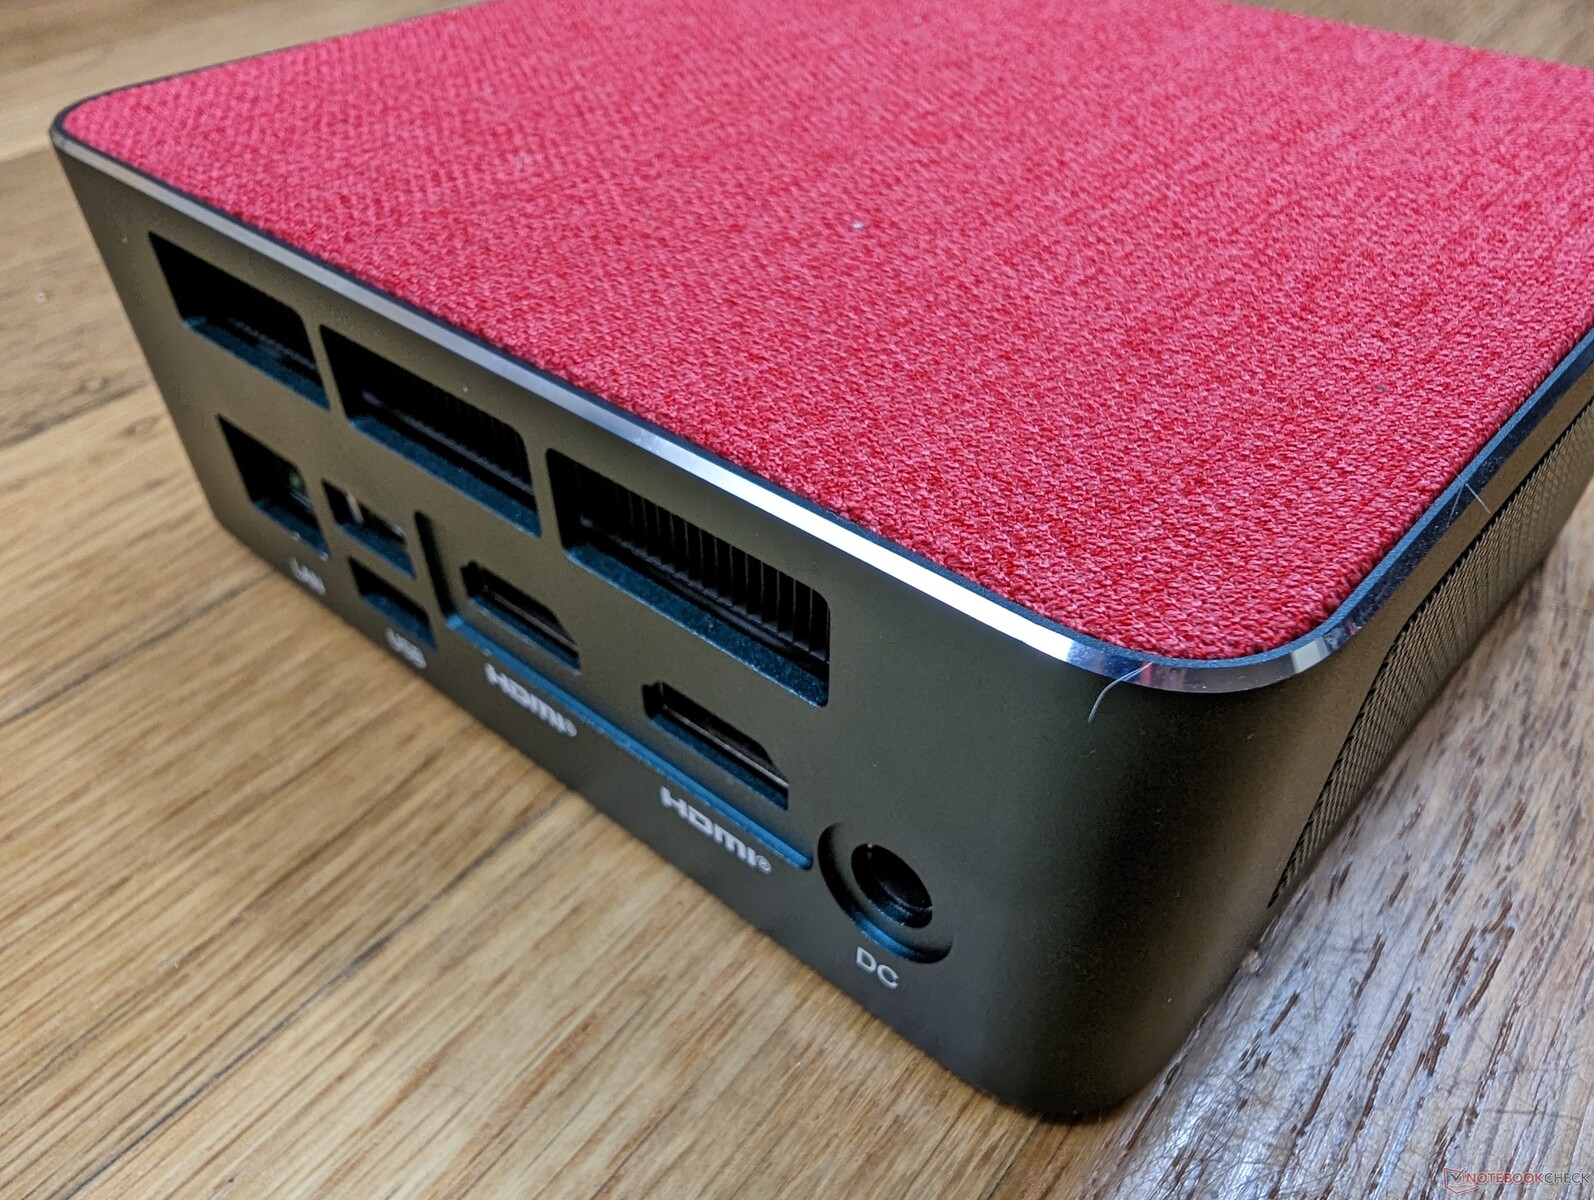

Connectivity
Port options and positioning are identical to the SER5 Pro but with one notable upgrade: the RJ-45 port now supports 2.5 Gbps speeds instead of just 1 Gbps. The system can also be powered by third-party USB-C AC adapters should you ever lose the proprietary adapter that comes in the retail box. Our 130 W AC adapter that ships with the Dell XPS 17, for example, would power our SER6 Pro without any issues.
(January 25, 2023 update: USB 4.0 is supported for theoretical transfer rates of 40 Gbps. Certain Thunderbolt-enabled eGPU docks are therefore compatible.)
Communication
Beelink has swapped out the MediaTek RZ608 in the SER5 Pro for the more common Intel AX200 module. This particular Intel module does not have Wi-Fi 6E capabilities, but transfer rates are fast nonetheless at around 1200 Mbps on average when paired to our Asus AXE11000 test router.

| Networking | |
| iperf3 transmit AX12 | |
| Intel NUC11PHKi7C | |
| Intel Hades Canyon NUC8i7HVK | |
| iperf3 receive AX12 | |
| Intel NUC11PHKi7C | |
| Intel Hades Canyon NUC8i7HVK | |
| iperf3 receive AXE11000 6GHz | |
| Intel NUC 12 Pro Kit NUC12WSKi7 | |
| Beelink GTR6 | |
| Beelink SEi11 Pro | |
| iperf3 receive AXE11000 | |
| Beelink SER6 Pro | |
| Beelink GTR6 | |
| iperf3 transmit AXE11000 | |
| Beelink SER6 Pro | |
| Beelink GTR6 | |
| iperf3 transmit AXE11000 6GHz | |
| Beelink GTR6 | |
| Intel NUC 12 Pro Kit NUC12WSKi7 | |
| Beelink SEi11 Pro | |
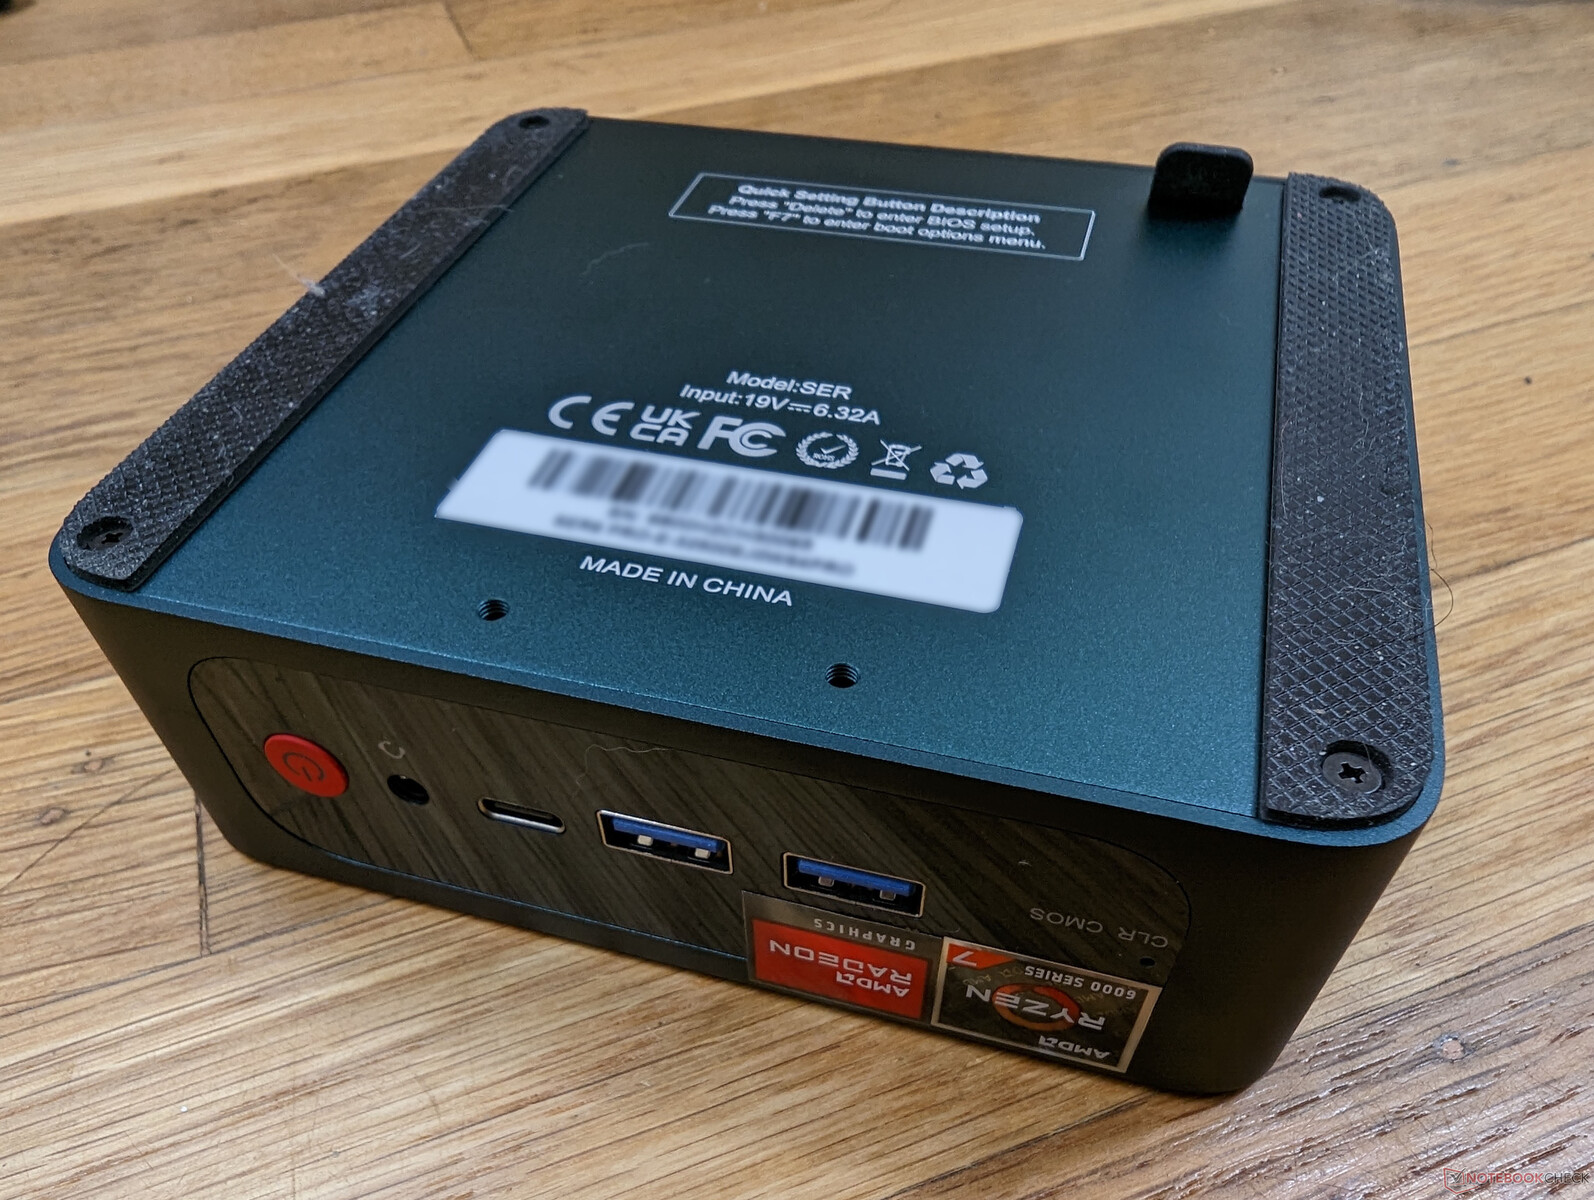
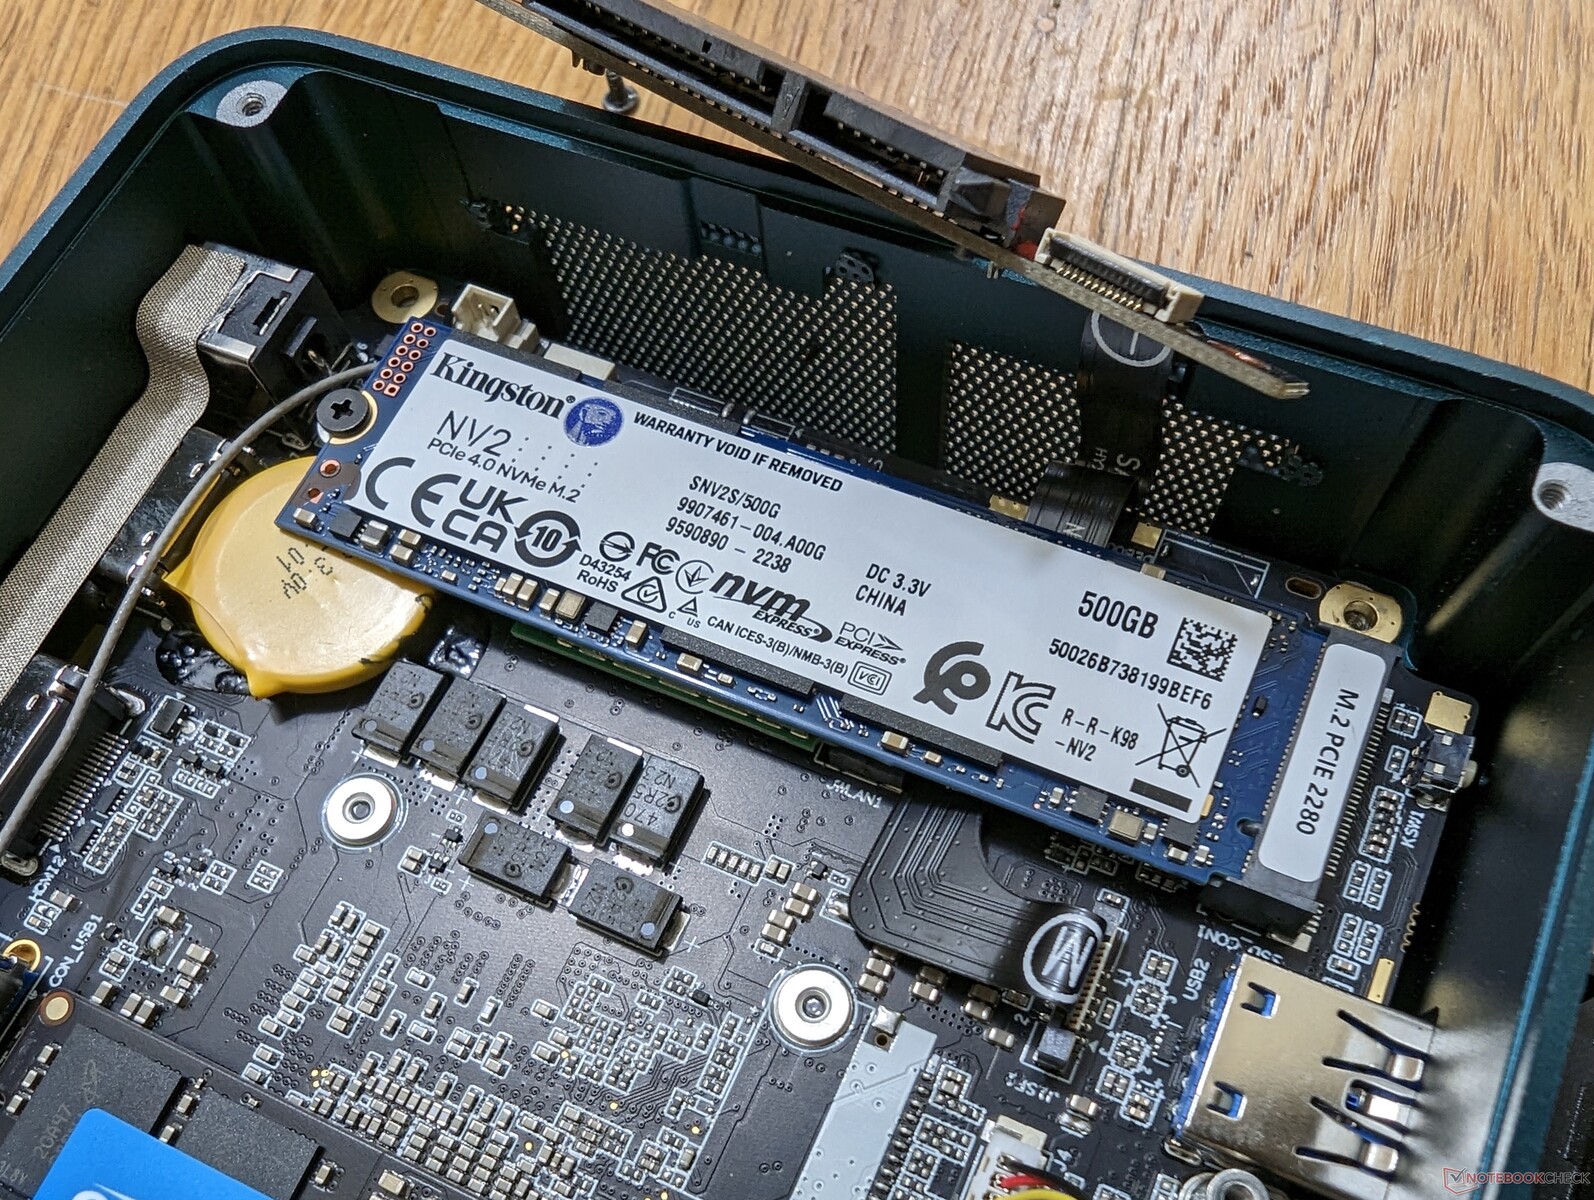
Maintenance
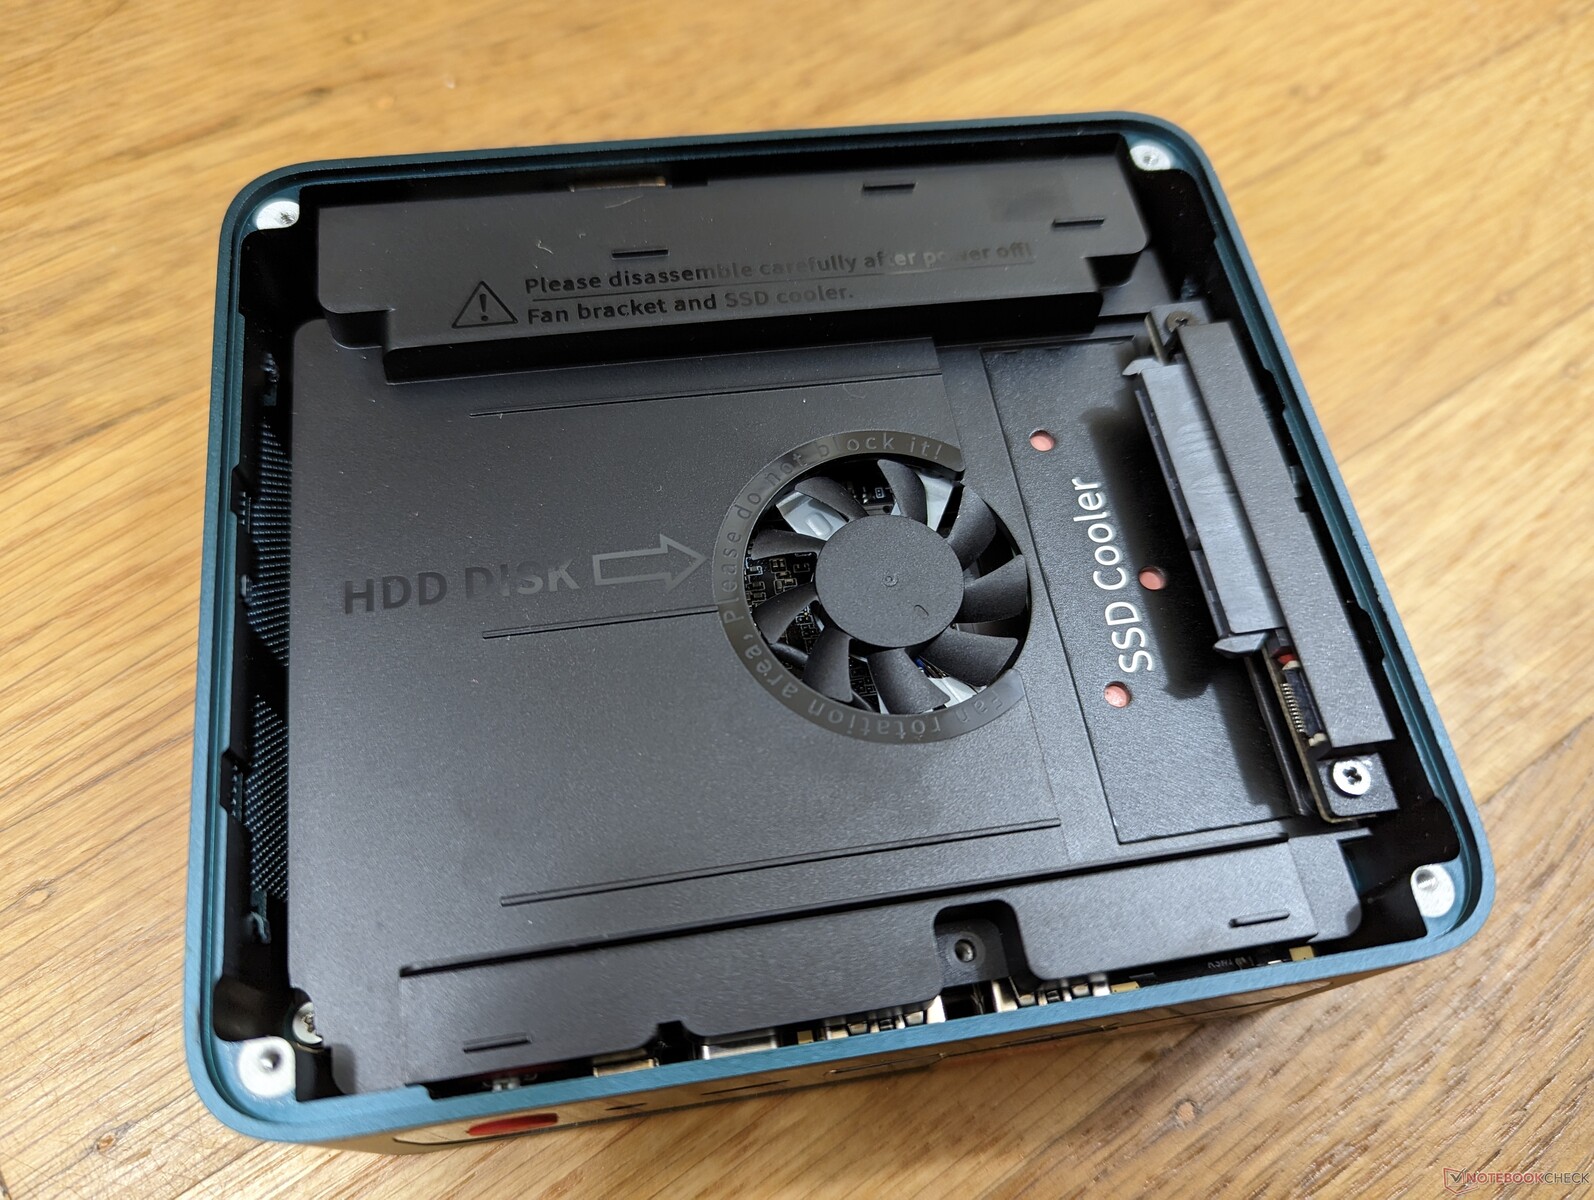
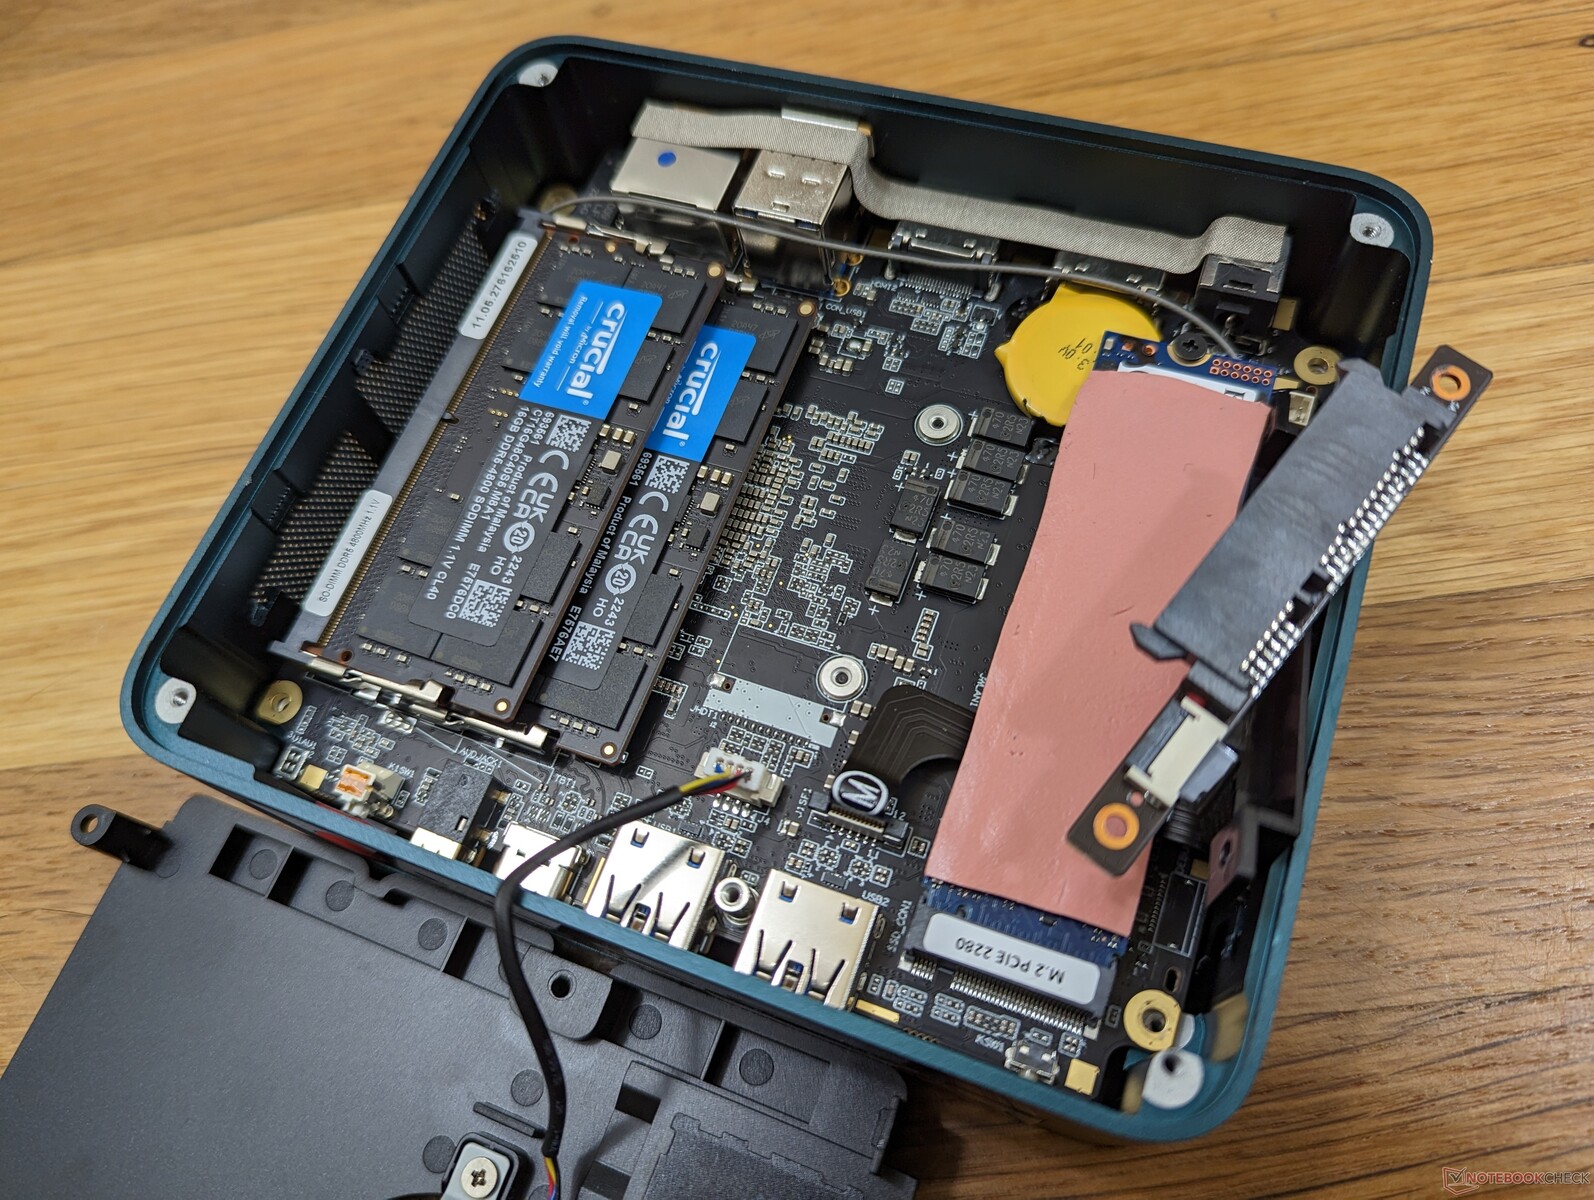
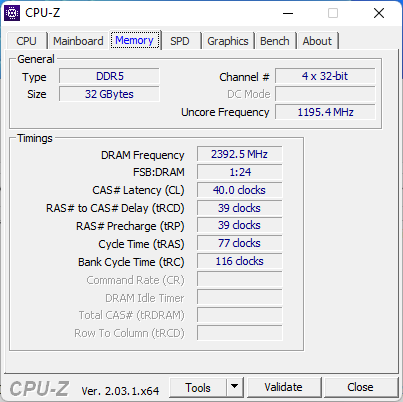
RAM and storage upgrades are easy and require only a Philips screwdriver. Users can install up to two SODIMM RAM modules and two drives (1x M.2 PCIe4 x4 + 1x 2.5-inch SATA III).
Accessories and Warranty
The retail box includes two HDMI cables, a removable VESA mounting bracket, black and red fabric top covers, AC adapter, and paperwork. The usual one-year limited manufacturer warranty applies if purchased in the US.
Performance
Testing Conditions
We set our unit to Performance mode prior to running any benchmarks below. There are no pre-installed control center-type applications.
Processor
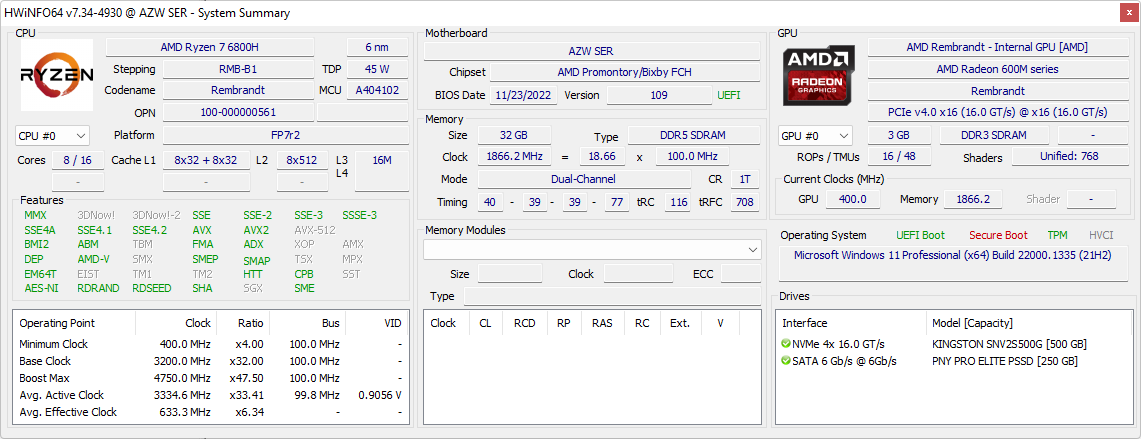
Raw processor performance is nearly identical to the previous generation Ryzen 7 5800H. Single-thread performance may be up to 5 percent faster, but any differences are marginal at best. Instead, the biggest improvement between the two CPUs relate to their integrated GPUs as our GPU section below will demonstrate.
Cinebench R15 Multi Loop
Cinebench R23: Multi Core | Single Core
Cinebench R15: CPU Multi 64Bit | CPU Single 64Bit
Blender: v2.79 BMW27 CPU
7-Zip 18.03: 7z b 4 | 7z b 4 -mmt1
Geekbench 5.5: Multi-Core | Single-Core
HWBOT x265 Benchmark v2.2: 4k Preset
LibreOffice : 20 Documents To PDF
R Benchmark 2.5: Overall mean
Cinebench R23: Multi Core | Single Core
Cinebench R15: CPU Multi 64Bit | CPU Single 64Bit
Blender: v2.79 BMW27 CPU
7-Zip 18.03: 7z b 4 | 7z b 4 -mmt1
Geekbench 5.5: Multi-Core | Single-Core
HWBOT x265 Benchmark v2.2: 4k Preset
LibreOffice : 20 Documents To PDF
R Benchmark 2.5: Overall mean
* ... smaller is better
AIDA64: FP32 Ray-Trace | FPU Julia | CPU SHA3 | CPU Queen | FPU SinJulia | FPU Mandel | CPU AES | CPU ZLib | FP64 Ray-Trace | CPU PhotoWorxx
| Performance Rating | |
| Average AMD Ryzen 7 6800H | |
| Beelink GTR6 | |
| Beelink SER6 Pro | |
| Intel NUC 12 Pro Kit NUC12WSKi7 | |
| Intel NUC11PHKi7C | |
| Beelink SEi11 Pro | |
| AIDA64 / FP32 Ray-Trace | |
| Average AMD Ryzen 7 6800H (12876 - 17031, n=7) | |
| Beelink GTR6 | |
| Beelink SER6 Pro | |
| Intel NUC 12 Pro Kit NUC12WSKi7 | |
| Intel NUC11PHKi7C | |
| Beelink SEi11 Pro | |
| AIDA64 / FPU Julia | |
| Average AMD Ryzen 7 6800H (82673 - 105987, n=7) | |
| Beelink GTR6 | |
| Beelink SER6 Pro | |
| Intel NUC 12 Pro Kit NUC12WSKi7 | |
| Intel NUC11PHKi7C | |
| Beelink SEi11 Pro | |
| AIDA64 / CPU SHA3 | |
| Average AMD Ryzen 7 6800H (2886 - 3634, n=7) | |
| Beelink GTR6 | |
| Beelink SER6 Pro | |
| Intel NUC 12 Pro Kit NUC12WSKi7 | |
| Intel NUC11PHKi7C | |
| Beelink SEi11 Pro | |
| AIDA64 / CPU Queen | |
| Average AMD Ryzen 7 6800H (75117 - 106322, n=7) | |
| Beelink GTR6 | |
| Beelink SER6 Pro | |
| Intel NUC 12 Pro Kit NUC12WSKi7 | |
| Intel NUC11PHKi7C | |
| Beelink SEi11 Pro | |
| AIDA64 / FPU SinJulia | |
| Average AMD Ryzen 7 6800H (11771 - 13120, n=7) | |
| Beelink GTR6 | |
| Beelink SER6 Pro | |
| Intel NUC 12 Pro Kit NUC12WSKi7 | |
| Intel NUC11PHKi7C | |
| Beelink SEi11 Pro | |
| AIDA64 / FPU Mandel | |
| Average AMD Ryzen 7 6800H (45287 - 58327, n=7) | |
| Beelink GTR6 | |
| Beelink SER6 Pro | |
| Intel NUC 12 Pro Kit NUC12WSKi7 | |
| Intel NUC11PHKi7C | |
| Beelink SEi11 Pro | |
| AIDA64 / CPU AES | |
| Beelink GTR6 | |
| Average AMD Ryzen 7 6800H (67816 - 137383, n=7) | |
| Beelink SER6 Pro | |
| Intel NUC 12 Pro Kit NUC12WSKi7 | |
| Intel NUC11PHKi7C | |
| Beelink SEi11 Pro | |
| AIDA64 / CPU ZLib | |
| Average AMD Ryzen 7 6800H (732 - 901, n=7) | |
| Beelink GTR6 | |
| Beelink SER6 Pro | |
| Intel NUC 12 Pro Kit NUC12WSKi7 | |
| Intel NUC11PHKi7C | |
| Beelink SEi11 Pro | |
| AIDA64 / FP64 Ray-Trace | |
| Average AMD Ryzen 7 6800H (6917 - 8980, n=7) | |
| Beelink GTR6 | |
| Beelink SER6 Pro | |
| Intel NUC 12 Pro Kit NUC12WSKi7 | |
| Intel NUC11PHKi7C | |
| Beelink SEi11 Pro | |
| AIDA64 / CPU PhotoWorxx | |
| Beelink GTR6 | |
| Beelink SER6 Pro | |
| Average AMD Ryzen 7 6800H (28224 - 30360, n=7) | |
| Intel NUC 12 Pro Kit NUC12WSKi7 | |
| Intel NUC11PHKi7C | |
| Beelink SEi11 Pro | |
System Performance
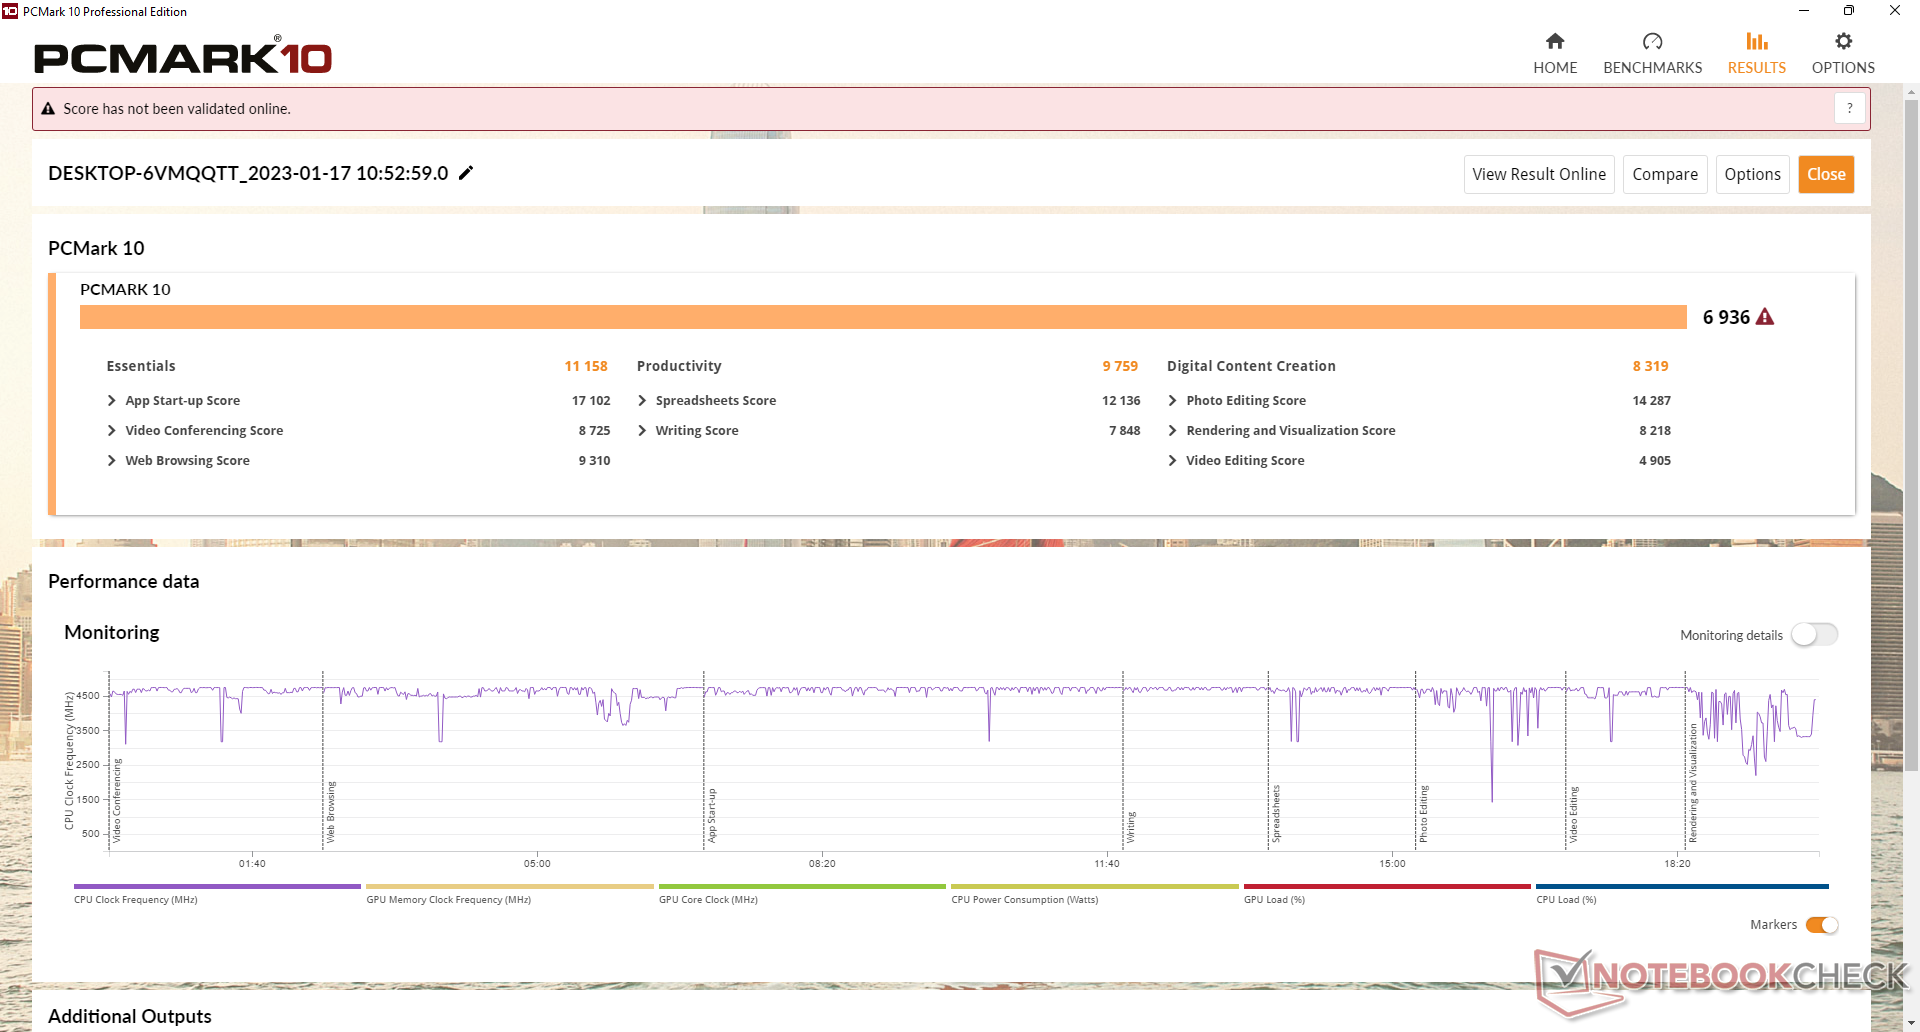
PCMark results are some of the highest for any mini PC with no dedicated graphics. The high scores are be attributed to the new Radeon 680M which is a substantial leap over the older integrated Radeon RX Vega series or Iris Xe series.
CrossMark: Overall | Productivity | Creativity | Responsiveness
| PCMark 10 / Score | |
| Beelink GTR6 | |
| Beelink SER6 Pro | |
| Average AMD Ryzen 7 6800H, AMD Radeon 680M (6591 - 6936, n=3) | |
| Intel NUC11PHKi7C | |
| Intel NUC 12 Pro Kit NUC12WSKi7 | |
| Beelink SER Pro Ryzen 5 5600H | |
| Intel Hades Canyon NUC8i7HVK | |
| Beelink SEi11 Pro | |
| PCMark 10 / Essentials | |
| Beelink GTR6 | |
| Beelink SER6 Pro | |
| Average AMD Ryzen 7 6800H, AMD Radeon 680M (10381 - 11158, n=3) | |
| Intel NUC 12 Pro Kit NUC12WSKi7 | |
| Beelink SER Pro Ryzen 5 5600H | |
| Beelink SEi11 Pro | |
| Intel NUC11PHKi7C | |
| Intel Hades Canyon NUC8i7HVK | |
| PCMark 10 / Productivity | |
| Beelink GTR6 | |
| Beelink SER6 Pro | |
| Average AMD Ryzen 7 6800H, AMD Radeon 680M (9140 - 9759, n=3) | |
| Beelink SER Pro Ryzen 5 5600H | |
| Intel NUC11PHKi7C | |
| Intel Hades Canyon NUC8i7HVK | |
| Intel NUC 12 Pro Kit NUC12WSKi7 | |
| Beelink SEi11 Pro | |
| PCMark 10 / Digital Content Creation | |
| Beelink GTR6 | |
| Beelink SER6 Pro | |
| Average AMD Ryzen 7 6800H, AMD Radeon 680M (8092 - 8485, n=3) | |
| Intel NUC11PHKi7C | |
| Intel NUC 12 Pro Kit NUC12WSKi7 | |
| Beelink SER Pro Ryzen 5 5600H | |
| Intel Hades Canyon NUC8i7HVK | |
| Beelink SEi11 Pro | |
| CrossMark / Overall | |
| Beelink SER6 Pro | |
| Beelink GTR6 | |
| Intel NUC 12 Pro Kit NUC12WSKi7 | |
| Average AMD Ryzen 7 6800H, AMD Radeon 680M (1590 - 1704, n=2) | |
| Beelink SEi11 Pro | |
| Beelink SER Pro Ryzen 5 5600H | |
| CrossMark / Productivity | |
| Beelink GTR6 | |
| Beelink SER6 Pro | |
| Intel NUC 12 Pro Kit NUC12WSKi7 | |
| Average AMD Ryzen 7 6800H, AMD Radeon 680M (1566 - 1674, n=2) | |
| Beelink SEi11 Pro | |
| Beelink SER Pro Ryzen 5 5600H | |
| CrossMark / Creativity | |
| Intel NUC 12 Pro Kit NUC12WSKi7 | |
| Beelink SER6 Pro | |
| Average AMD Ryzen 7 6800H, AMD Radeon 680M (1708 - 1763, n=2) | |
| Beelink GTR6 | |
| Beelink SER Pro Ryzen 5 5600H | |
| Beelink SEi11 Pro | |
| CrossMark / Responsiveness | |
| Beelink GTR6 | |
| Beelink SER6 Pro | |
| Average AMD Ryzen 7 6800H, AMD Radeon 680M (1340 - 1625, n=2) | |
| Intel NUC 12 Pro Kit NUC12WSKi7 | |
| Beelink SEi11 Pro | |
| Beelink SER Pro Ryzen 5 5600H | |
| PCMark 10 Score | 6936 points | |
Help | ||
| AIDA64 / Memory Copy | |
| Beelink SER6 Pro | |
| Beelink GTR6 | |
| Average AMD Ryzen 7 6800H (48209 - 51186, n=7) | |
| Intel NUC 12 Pro Kit NUC12WSKi7 | |
| Beelink SEi11 Pro | |
| Intel NUC11PHKi7C | |
| AIDA64 / Memory Read | |
| Beelink GTR6 | |
| Beelink SER6 Pro | |
| Average AMD Ryzen 7 6800H (50372 - 51778, n=7) | |
| Intel NUC 12 Pro Kit NUC12WSKi7 | |
| Beelink SEi11 Pro | |
| Intel NUC11PHKi7C | |
| AIDA64 / Memory Write | |
| Beelink GTR6 | |
| Beelink SER6 Pro | |
| Average AMD Ryzen 7 6800H (55085 - 55307, n=7) | |
| Beelink SEi11 Pro | |
| Intel NUC 12 Pro Kit NUC12WSKi7 | |
| Intel NUC11PHKi7C | |
| AIDA64 / Memory Latency | |
| Intel NUC 12 Pro Kit NUC12WSKi7 | |
| Intel NUC11PHKi7C | |
| Average AMD Ryzen 7 6800H (83.1 - 89.6, n=7) | |
| Beelink SER6 Pro | |
| Beelink GTR6 | |
| Beelink SEi11 Pro | |
* ... smaller is better
DPC Latency
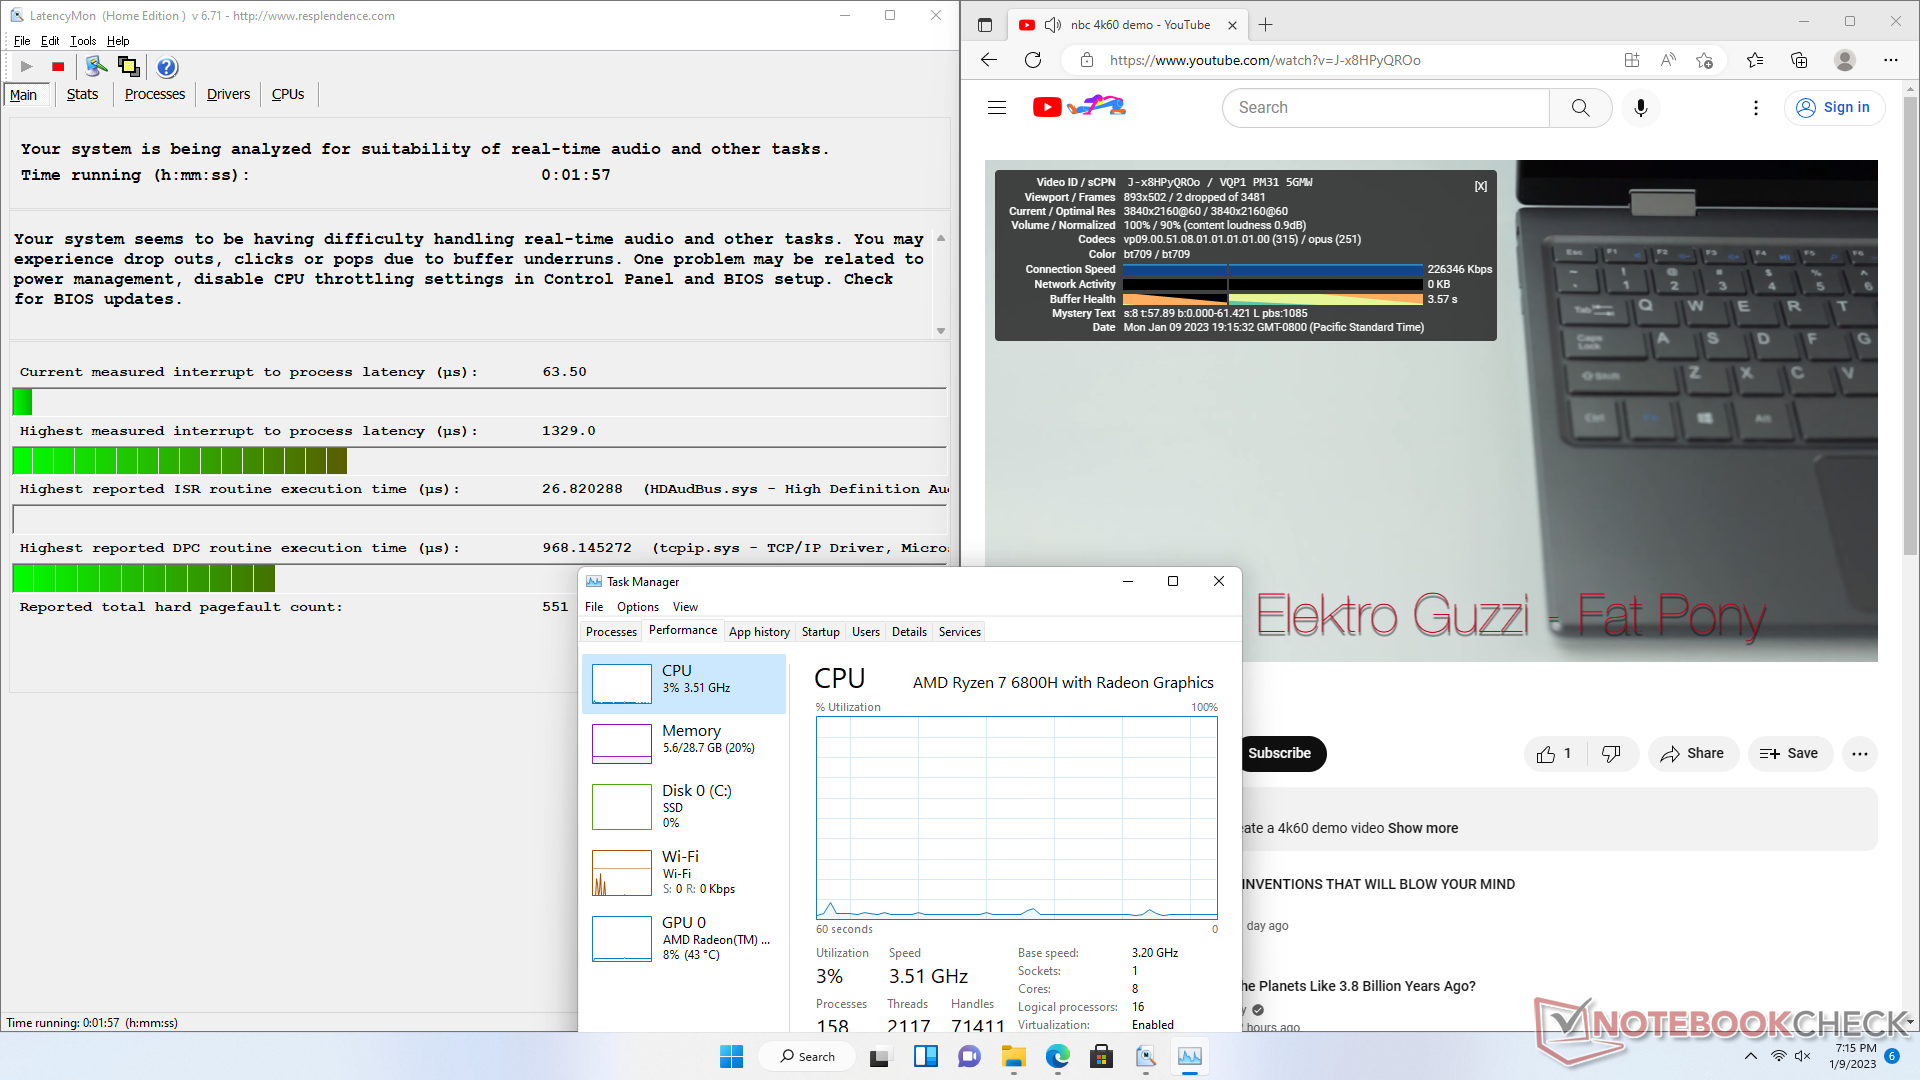
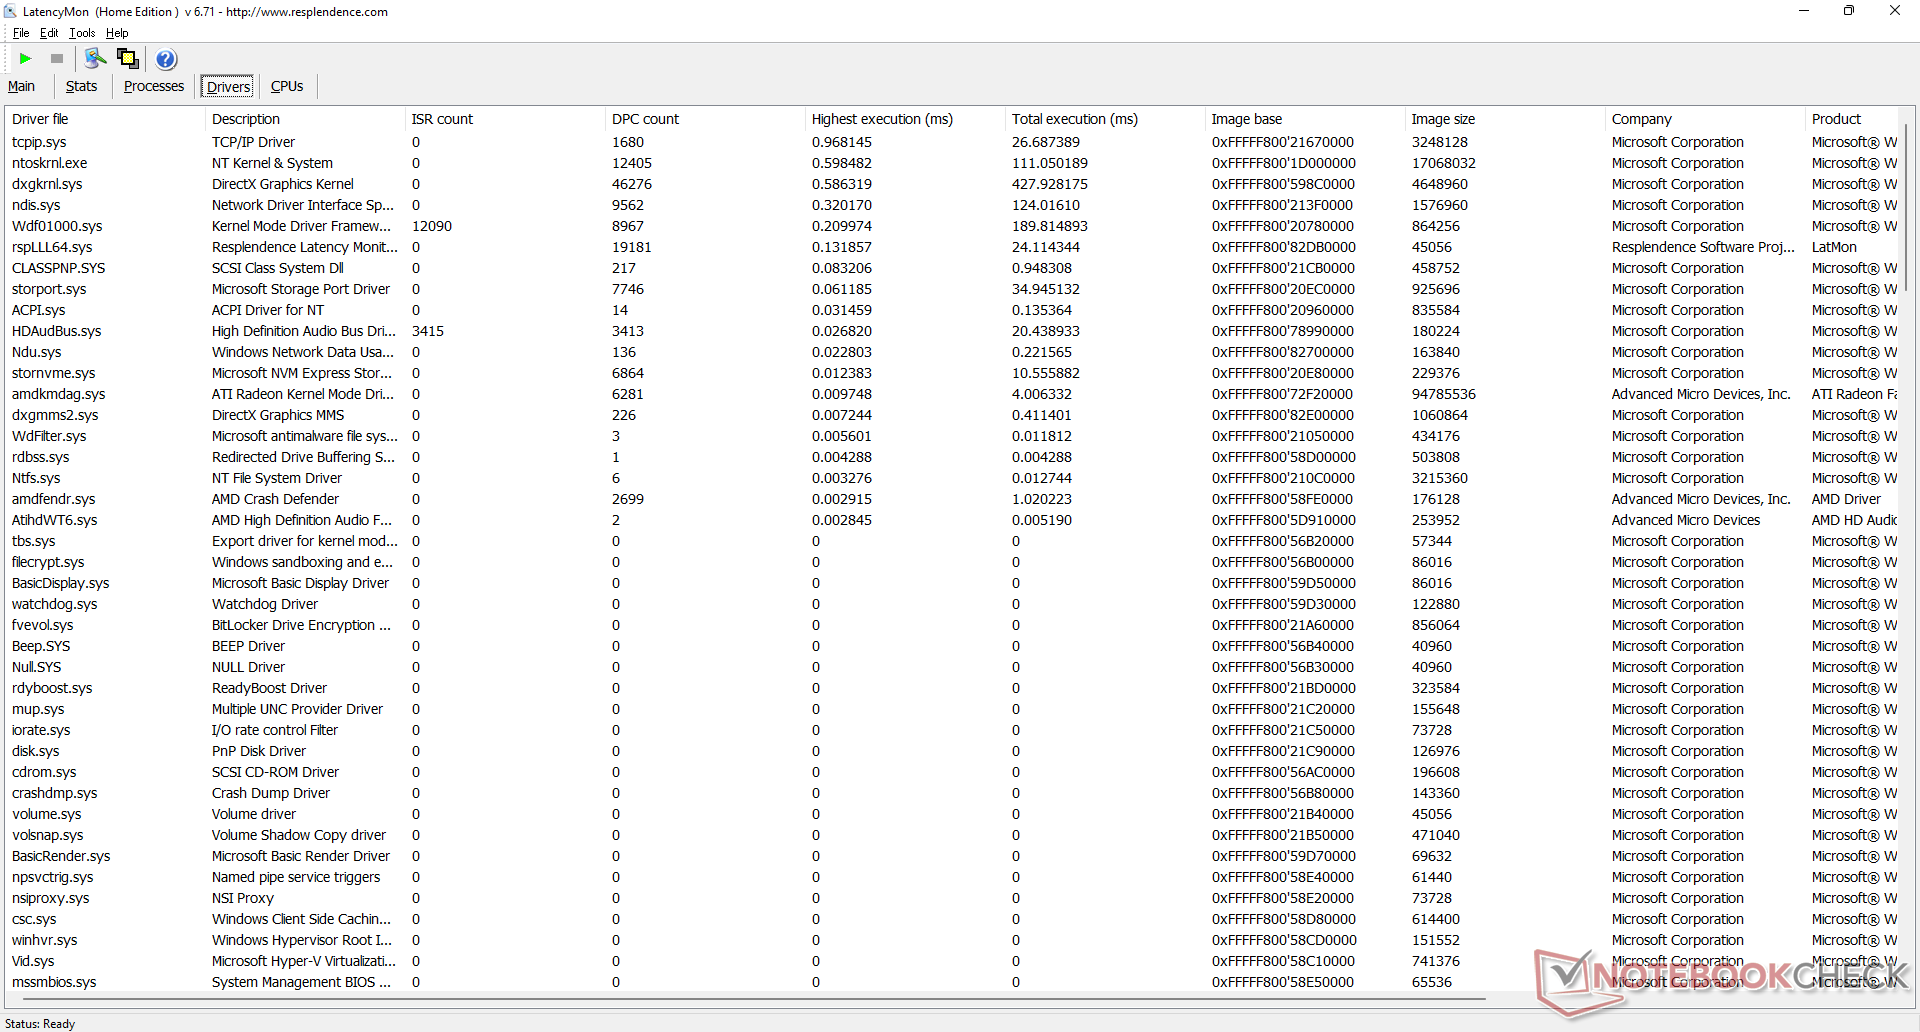
LatencyMon reveals DPC issues when opening multiple browser tabs of our homepage. 4K video playback at 60 FPS is otherwise smooth with just two dropped frames during our one-minute test video.
| DPC Latencies / LatencyMon - interrupt to process latency (max), Web, Youtube, Prime95 | |
| Beelink SER6 Pro | |
| Intel NUC11PHKi7C | |
| Intel NUC 12 Pro Kit NUC12WSKi7 | |
| Beelink GTR6 | |
| Beelink SEi11 Pro | |
* ... smaller is better
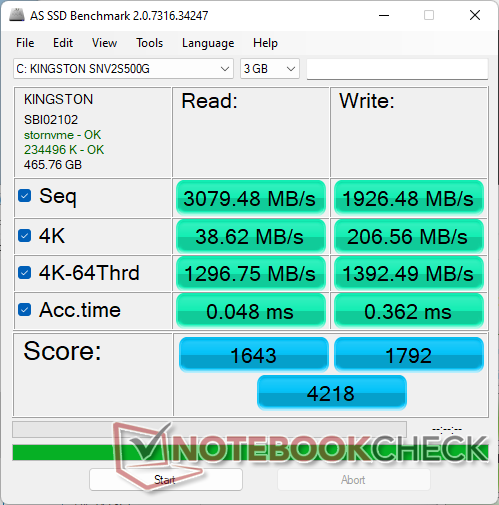
Storage Devices
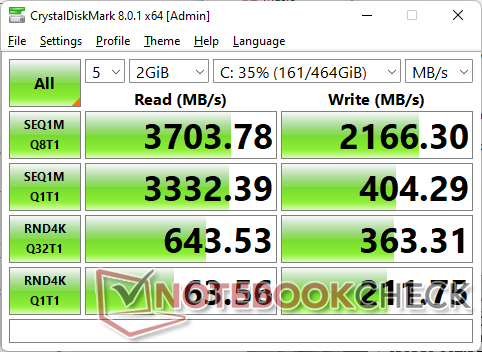
The Kingston SNV2S PCIe4 x4 SSD in our unit is a midrange NVMe drive with sequential read and rates of about 3700 MB/s and 2200 MB/s, respectively, compared to 5000 MB/s or greater with alternatives like the Samsung PM9A1. The drive comes into contact with an inner metal plate beneath the 2.5-inch SATA III slot for heat dissipation.

| Drive Performance Rating - Percent | |
| Beelink GTR6 | |
| Beelink SER6 Pro | |
| Intel Hades Canyon NUC8i7HVK -8! | |
| Intel NUC11PHKi7C | |
| Beelink SEi11 Pro | |
| Intel NUC 12 Pro Kit NUC12WSKi7 | |
* ... smaller is better
Disk Throttling: DiskSpd Read Loop, Queue Depth 8
GPU Performance
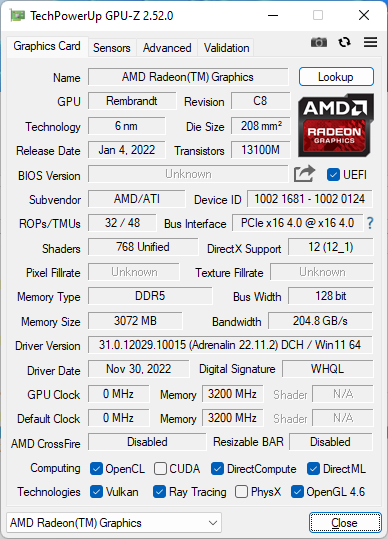
The integrated Radeon 680M is a significant upgrade over the previous generation Radeon RX Vega 7 or Vega 8 as found on the Ryzen 5 5600H or Ryzen 7 5800H, respectively. Raw performance is 70 to 100 percent faster for a noticeably better gaming experience. This isn't to say that the SER6 Pro is a gaming machine as it's still over 2x slower than a GeForce RTX 2060-powered laptop, but it still has enough power to run most games comfortably at 1080p on low to low-medium settings.
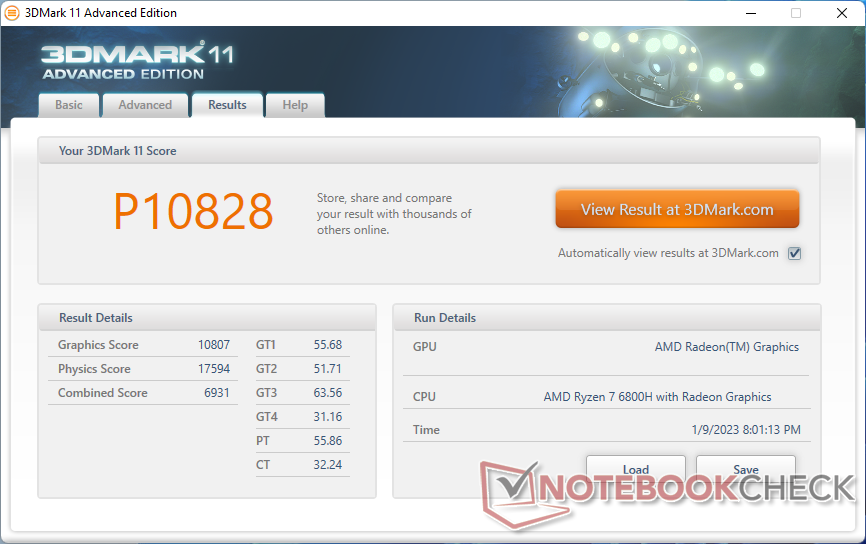
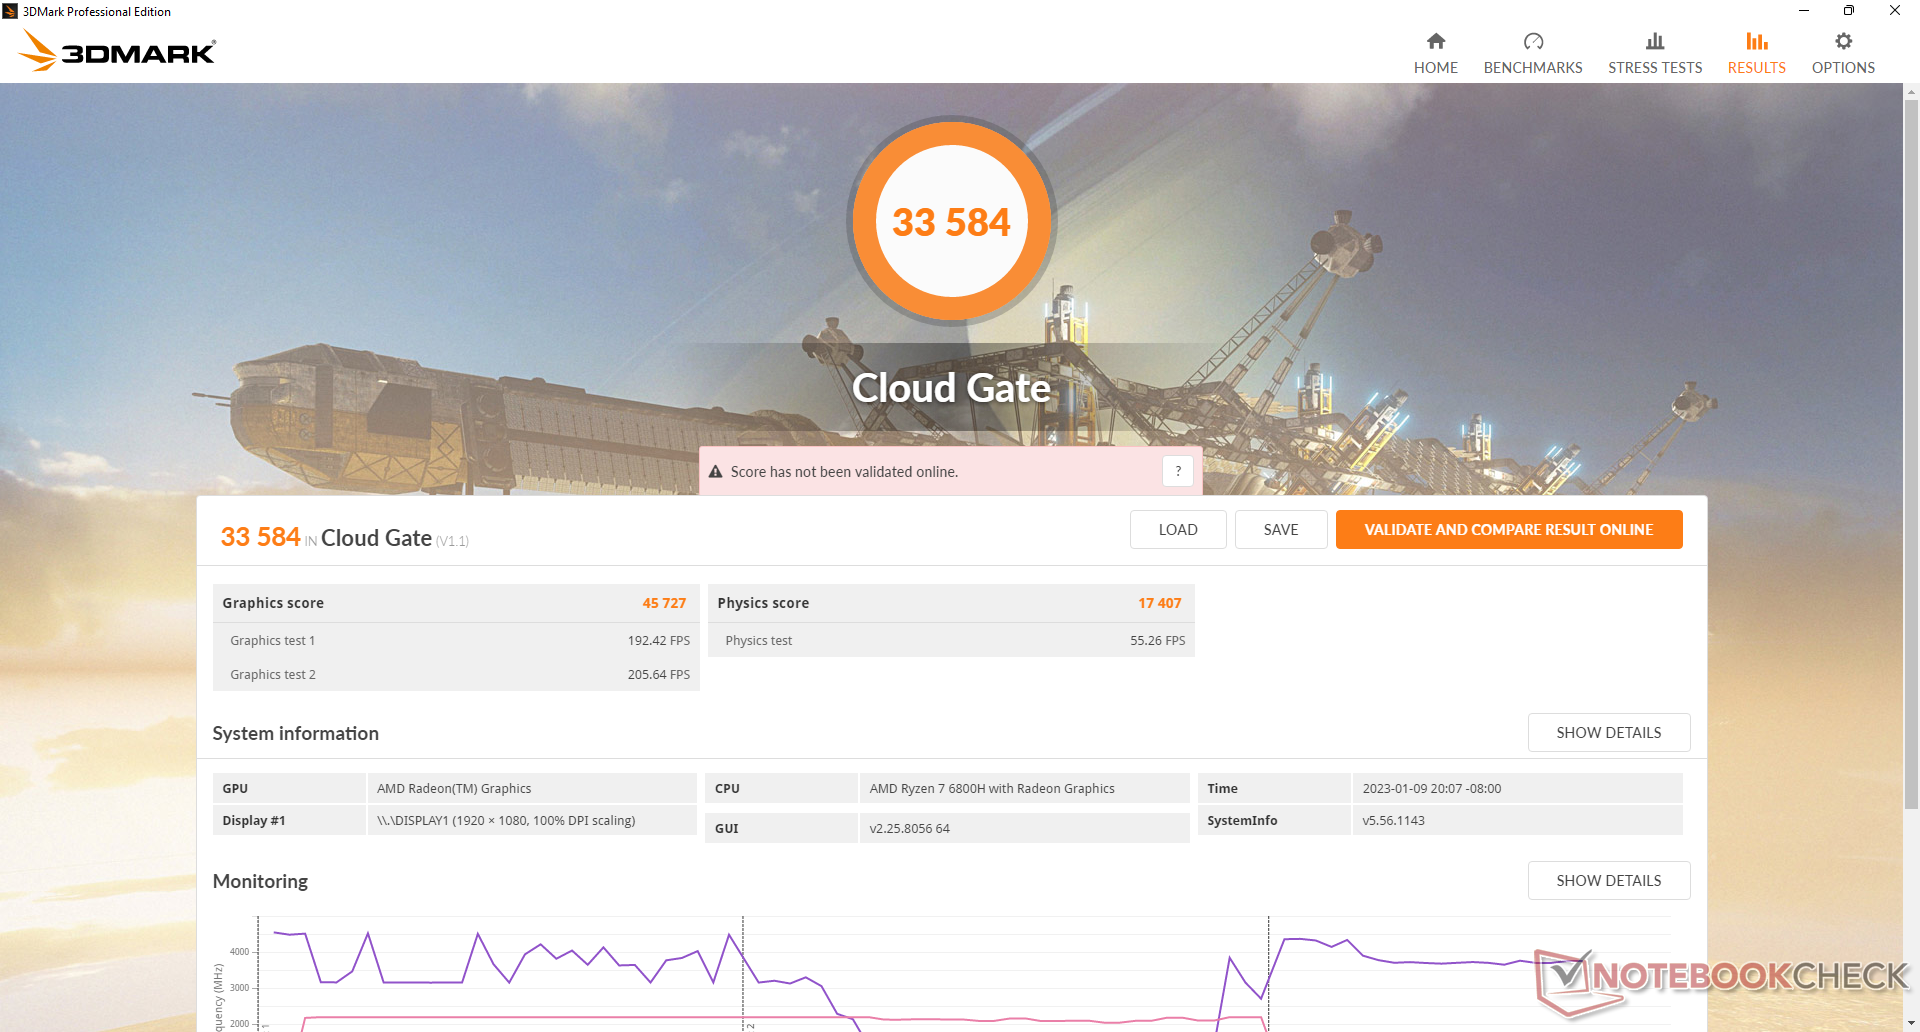
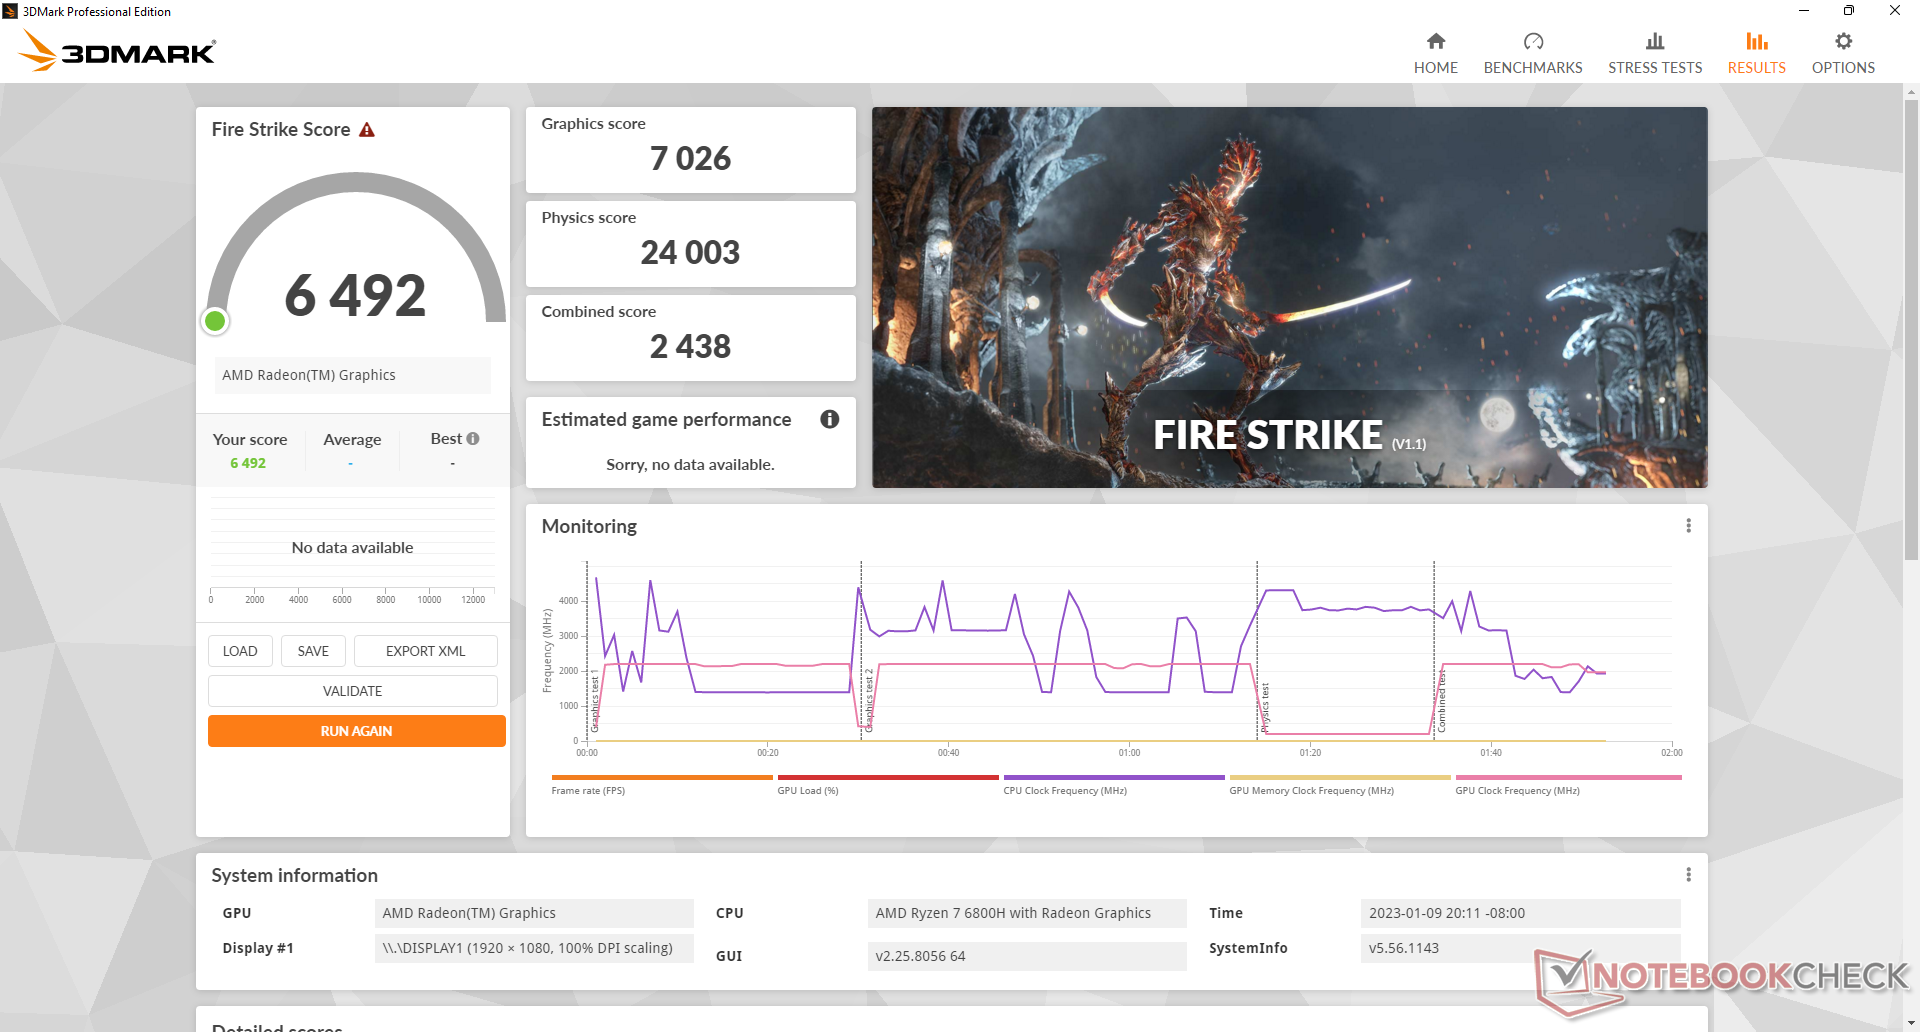


| 3DMark 11 Performance | 10825 points | |
| 3DMark Cloud Gate Standard Score | 33584 points | |
| 3DMark Fire Strike Score | 6492 points | |
| 3DMark Time Spy Score | 2751 points | |
Help | ||
* ... smaller is better
Our unit would exhibit issues maintaining frame rates. When idling on Witcher 3, frame rates would drop periodically from ~80 FPS to ~70 FPS for seemingly no reason. We even experienced a dip to as low as 18 FPS as shown by the graph below. The instability suggests interrupting background activity or poor management of background applications.
Witcher 3 FPS Chart
| low | med. | high | ultra | |
| GTA V (2015) | 152.3 | 139.7 | 51.9 | 23.7 |
| The Witcher 3 (2015) | 138.1 | 85.1 | 43.3 | 27 |
| Dota 2 Reborn (2015) | 143.3 | 113.4 | 83.9 | 73.1 |
| Final Fantasy XV Benchmark (2018) | 68.1 | 34.7 | 24.6 | |
| X-Plane 11.11 (2018) | 66.4 | 52.9 | 43 | |
| Strange Brigade (2018) | 141.9 | 57.8 | 48.6 | 41.9 |
| Cyberpunk 2077 1.6 (2022) | 43.3 | 33.1 | 21.3 | 17.2 |
Emissions
System Noise
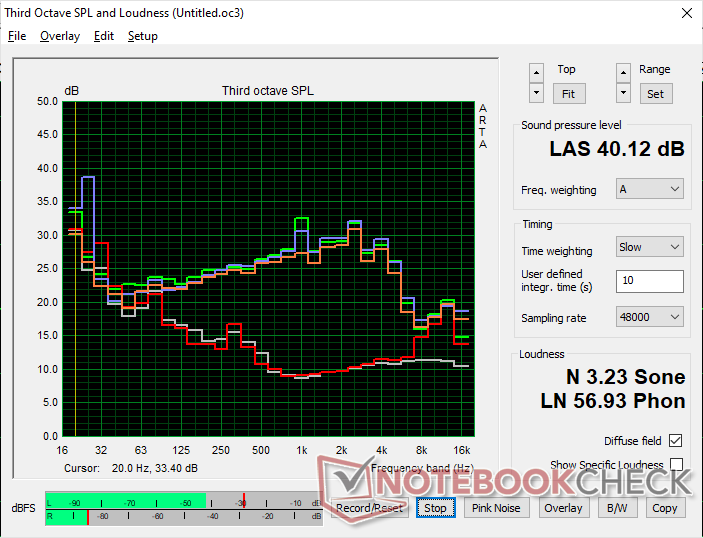
The internal fans are sensitive to onscreen loads. When browsing the web or video streaming, for example, fan noise may occasionally ramp up to 33 dB(A) for short periods. Fan noise would also reach its maximum of about 40 dB(A) more quickly than on most other mini PCs.
We experienced some slight electronic noise or coil whine on our test unit. Thus, we're able to record a noise of 24.1 dB(A) against a silent background of 22.8 dB(A) even when the fan was idle.
Noise Level
| Idle |
| 24.1 / 24.1 / 33.8 dB(A) |
| Load |
| 40.1 / 40.1 dB(A) |
 | ||
30 dB silent 40 dB(A) audible 50 dB(A) loud |
||
min: | ||
| Beelink SER6 Pro Radeon 680M, R7 6800H, Kingston NV2 500GB SNV2S/500G | Beelink GTR6 Radeon 680M, R9 6900HX, Kingston KC3000 512G SKC3000S512G | Beelink SEi11 Pro Iris Xe G7 96EUs, i5-11320H, Kingston NV1 SNVS/500GCN | Intel NUC 12 Pro Kit NUC12WSKi7 Iris Xe G7 96EUs, i7-1260P, Transcend M.2 SSD 2200S TS512GMTE220S | Intel NUC11PHKi7C GeForce RTX 2060 Mobile, i7-1165G7, Samsung SSD 980 Pro 500GB MZ-V8P500BW | Intel Hades Canyon NUC8i7HVK Vega M GH, i7-8809G, Intel Optane 120 GB SSDPEK1W120GA | |
|---|---|---|---|---|---|---|
| Noise | -3% | 8% | -18% | -1% | -11% | |
| off / environment * | 22.8 | 23.2 -2% | 22.8 -0% | 30.4 -33% | 24.5 -7% | 28.7 -26% |
| Idle Minimum * | 24.1 | 23.6 2% | 24.7 -2% | 33.1 -37% | 25.3 -5% | 29 -20% |
| Idle Average * | 24.1 | 23.8 1% | 24.7 -2% | 33.1 -37% | 25.3 -5% | 29 -20% |
| Idle Maximum * | 33.8 | 36.2 -7% | 25.3 25% | 33.1 2% | 25.3 25% | 29 14% |
| Load Average * | 40.1 | 39.7 1% | 33.2 17% | 38.1 5% | 36.4 9% | 36 10% |
| Witcher 3 ultra * | 38.7 | 41 -6% | 34.5 11% | 39.7 -3% | 42 -9% | |
| Load Maximum * | 40.1 | 43 -7% | 37.8 6% | 43.6 -9% | 47.9 -19% | 49.4 -23% |
* ... smaller is better
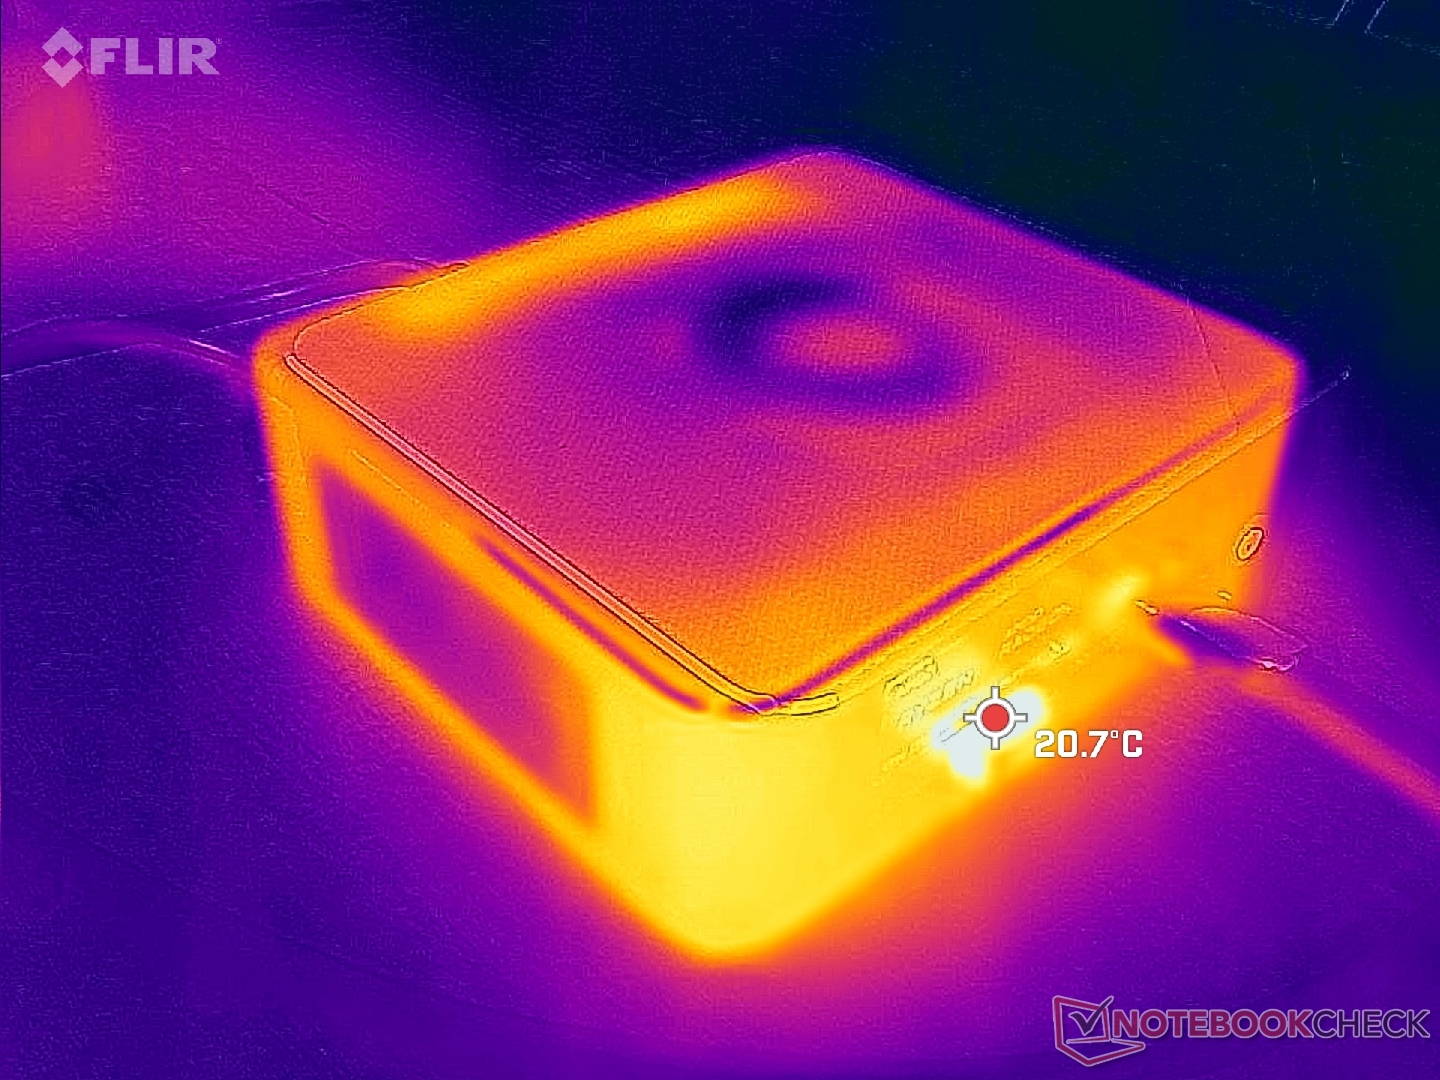
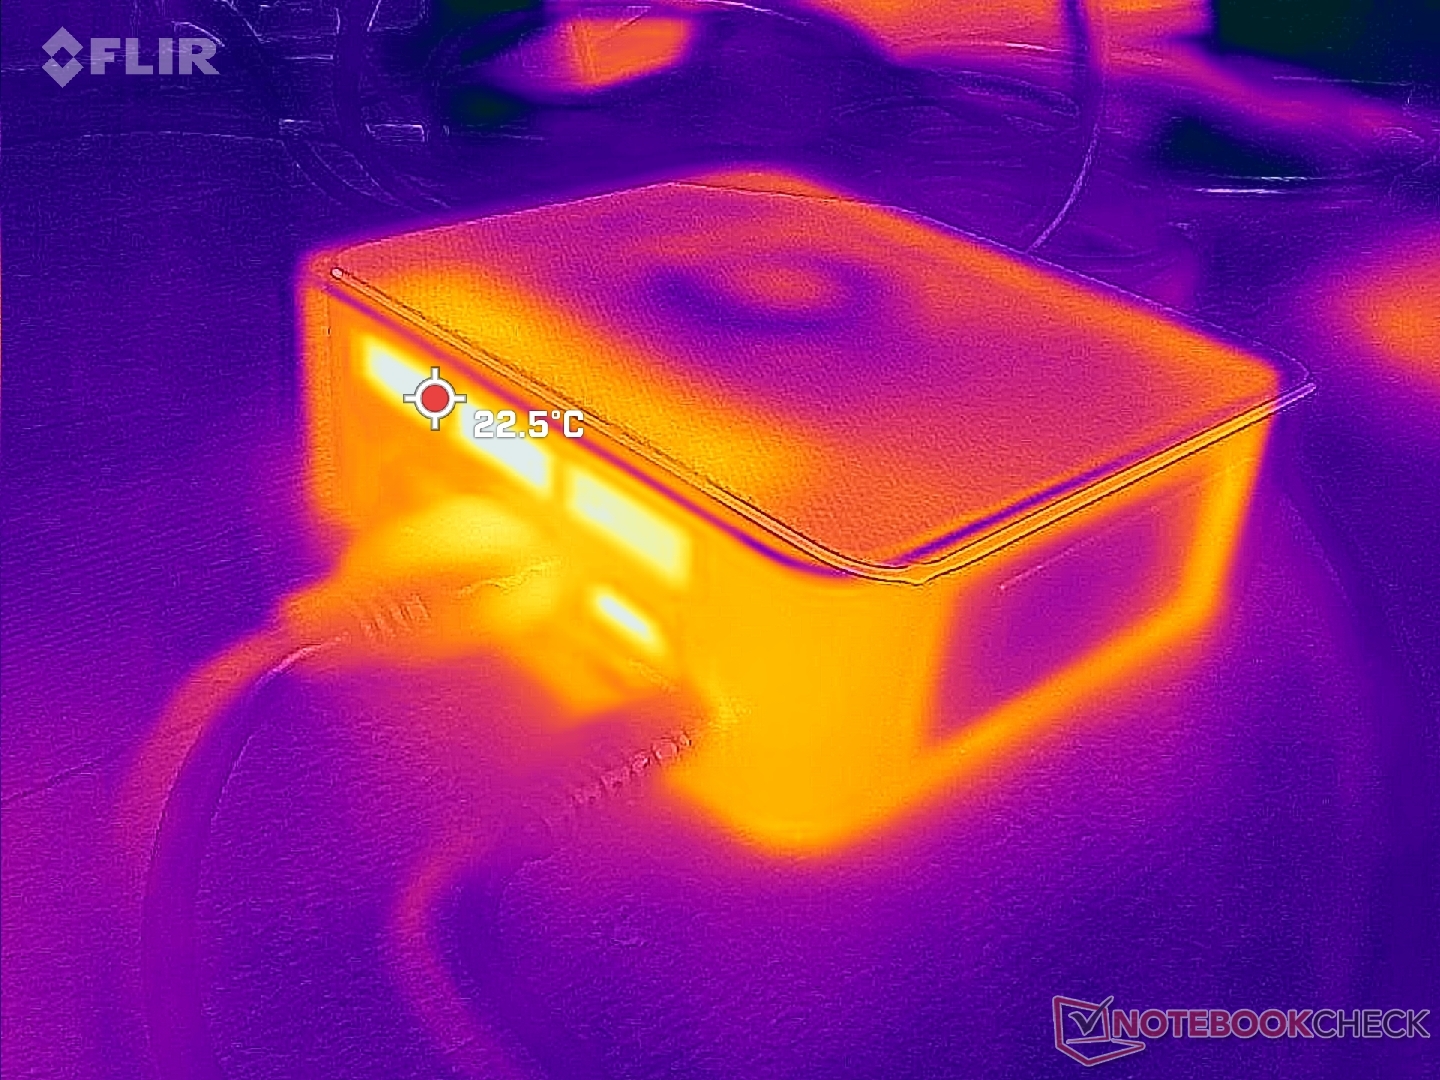
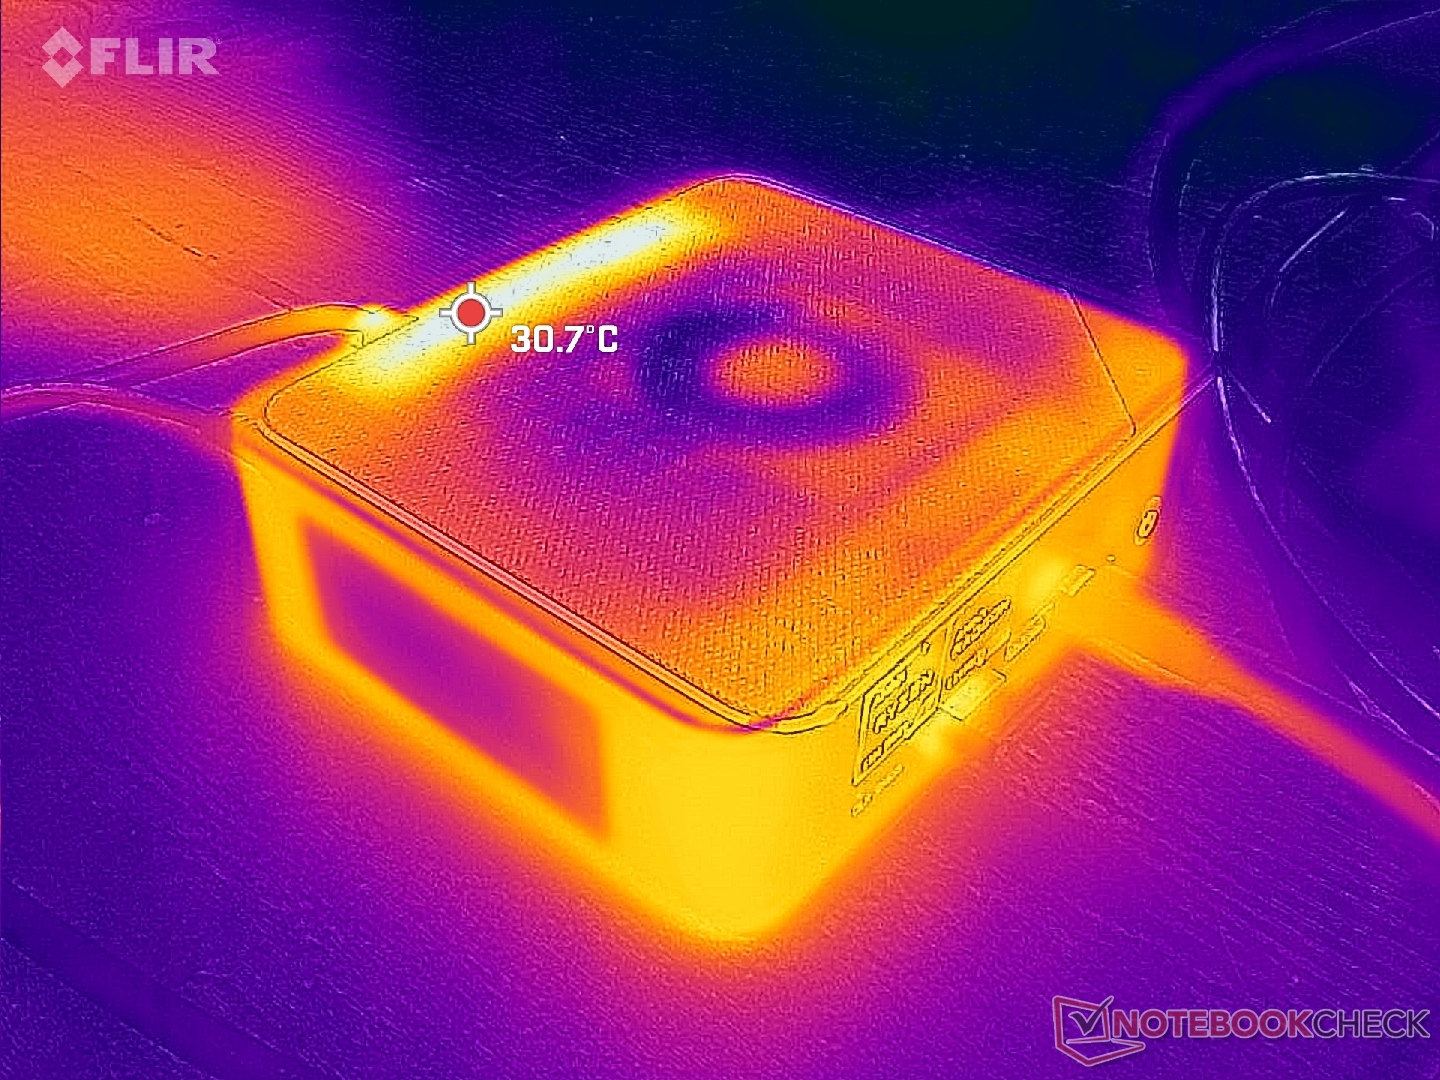
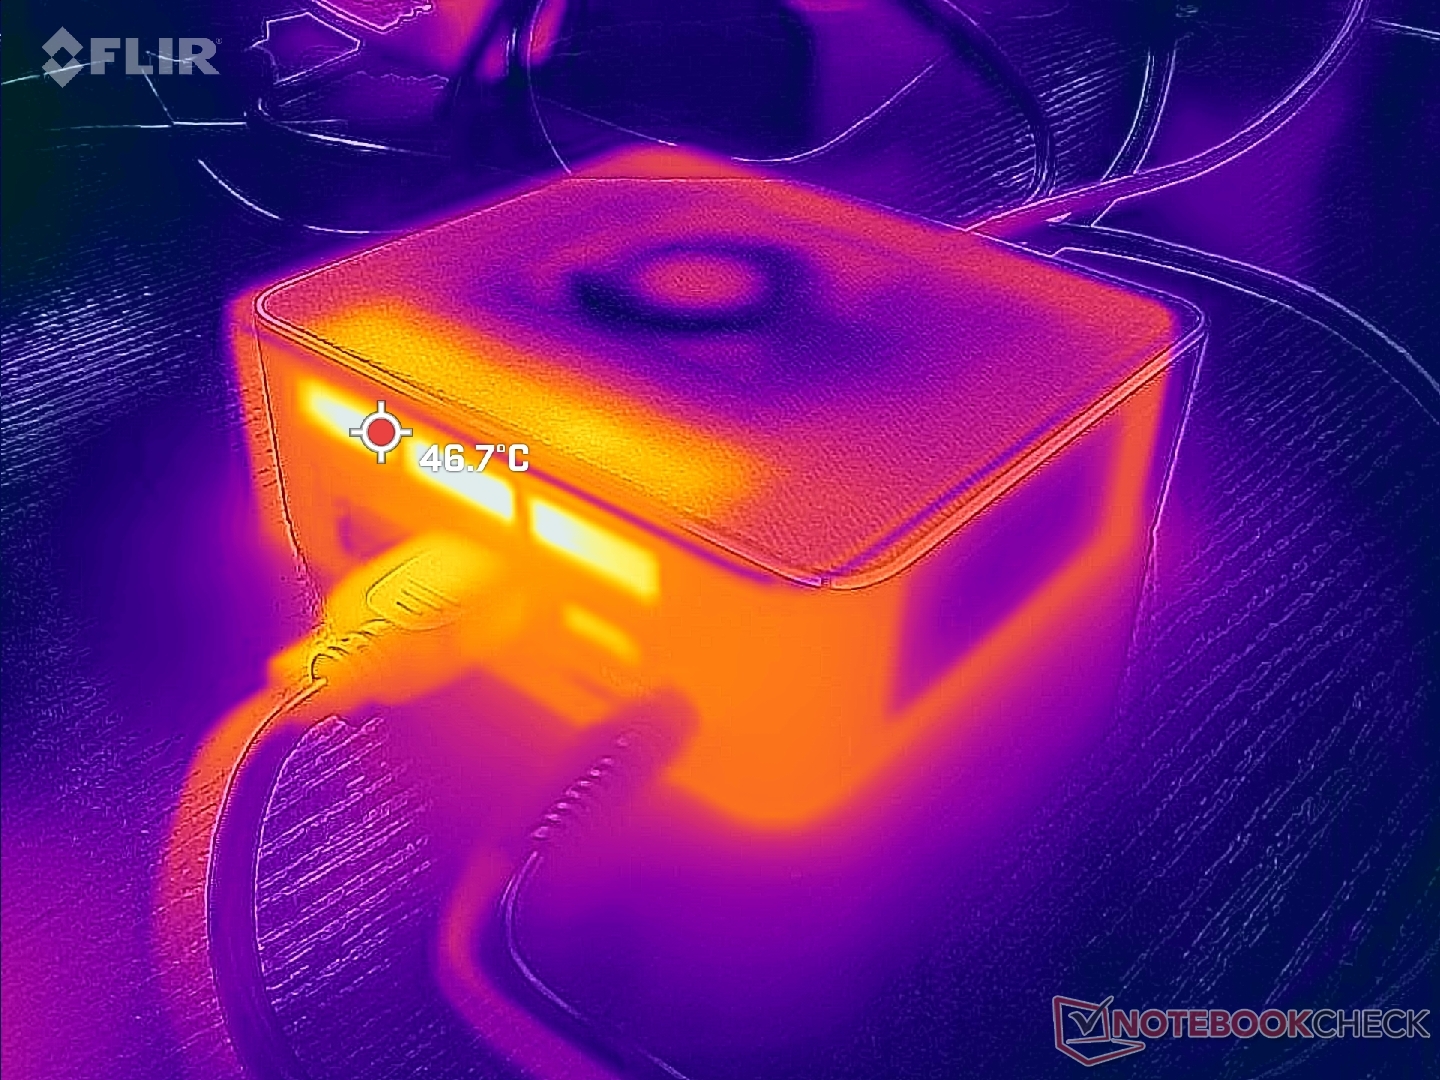
Temperature

Surface temperatures are not an issue. Unlike many other mini PCs, the SER6 Pro incorporates two fans for improved cooling potential. Cool air enters from the sides and top while hot air exits from the rear. Placing items on top of the mini PC or positioning it vertically will therefore obstruct some airflow.
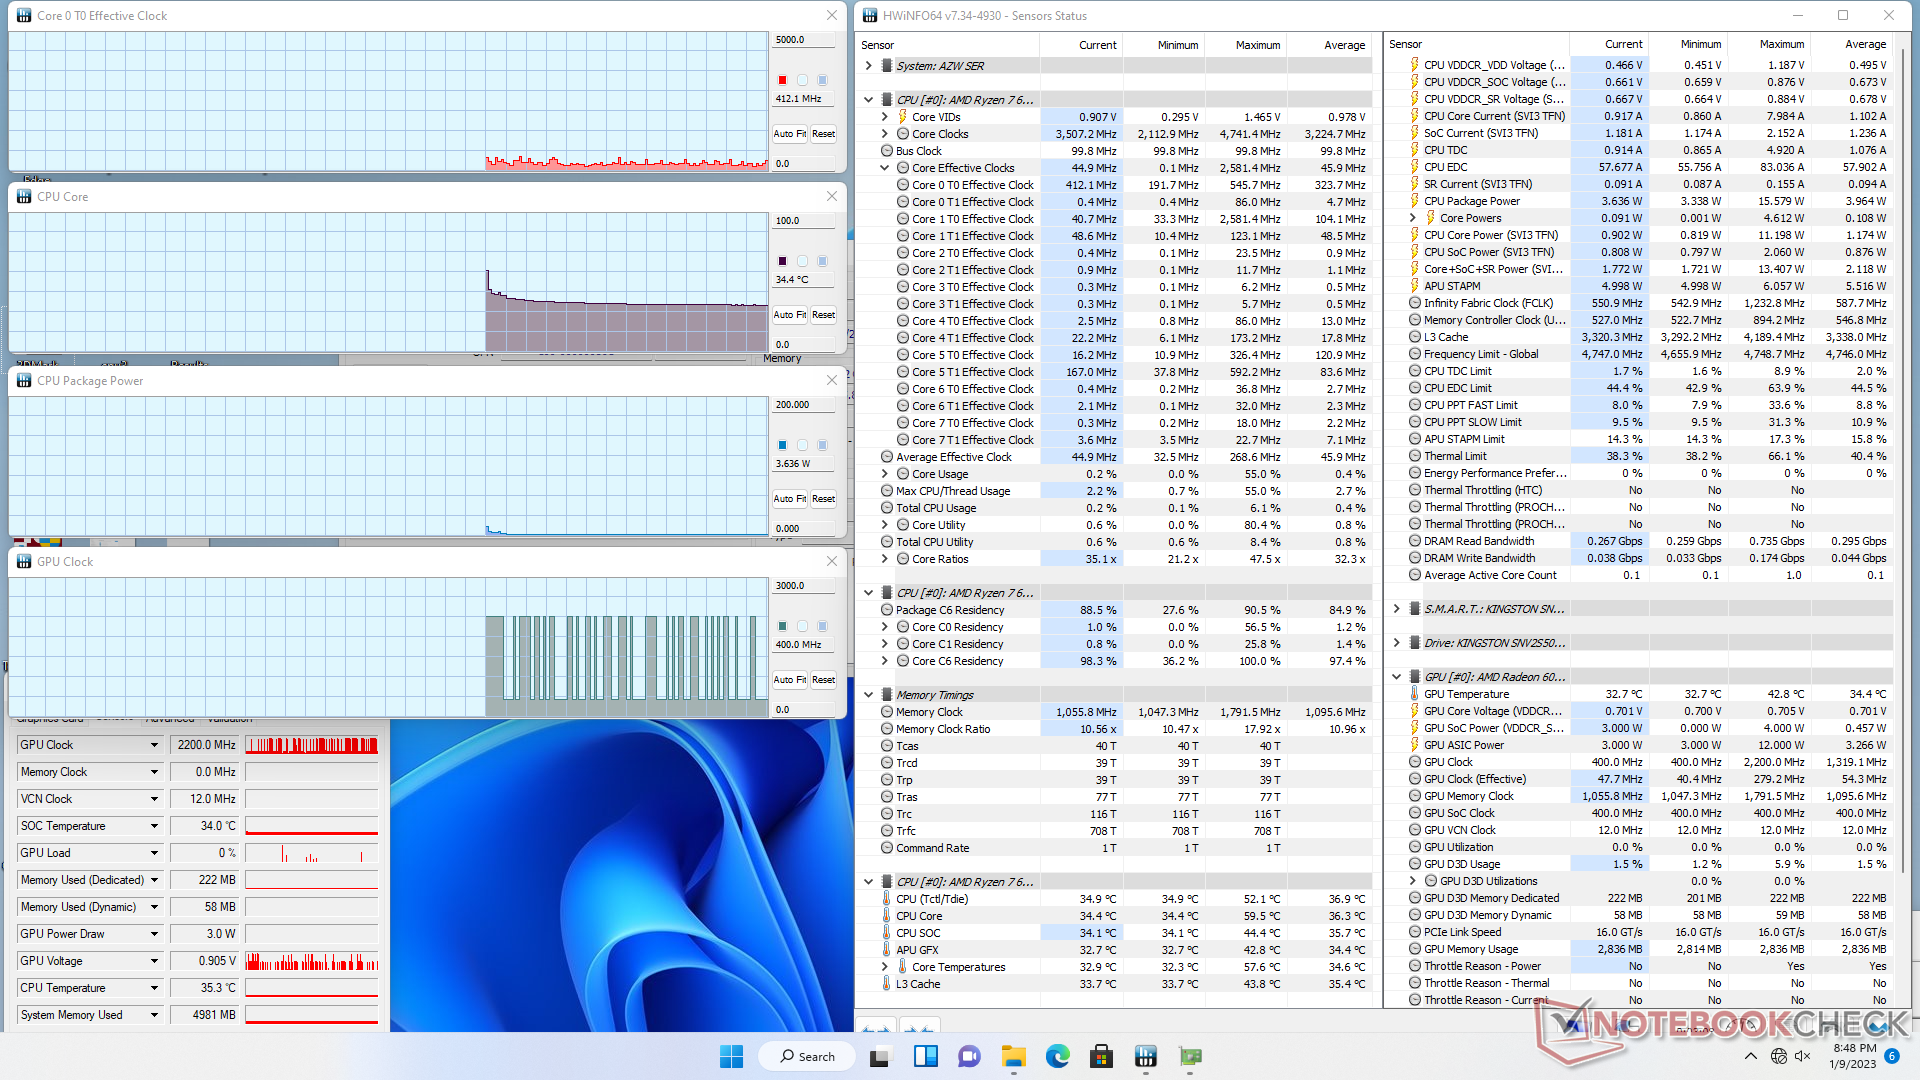
Stress Test
When running Prime95 to stress the CPU, clock rates and board power draw would boost to 3.3 GHz and 45 W, respectively, lasting for just a few seconds. The CPU would then quickly stabilize at 3 GHz, 38 W, and 82 C thereafter. Repeating this same test on the Beelink SEi11 powered by the slower Core i5-11320H would result in a warmer core temperature of 89 C.
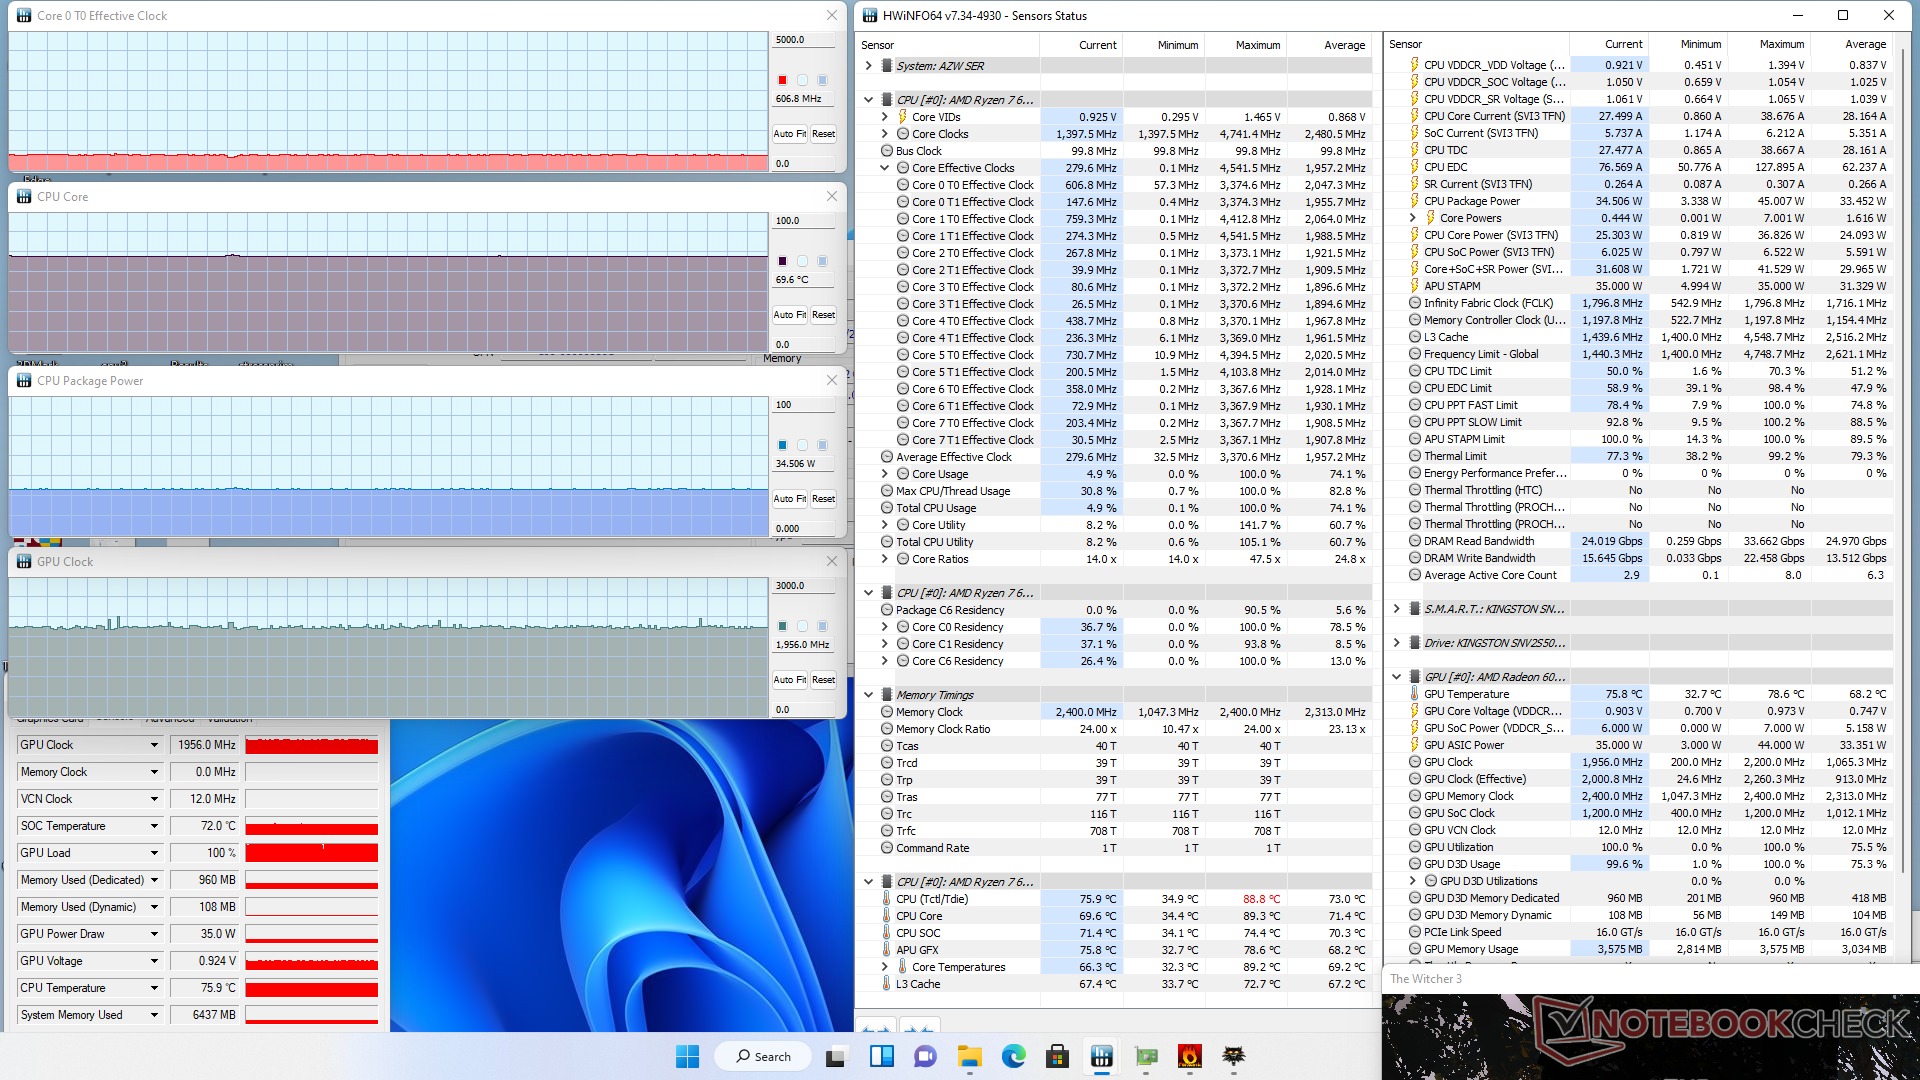
When running Witcher 3 to represent typical gaming loads, GPU clock rate and temperature would stabilize at 1956 MHz and 70 C, respectively, compared to 83 C on the SEi11. The SER6 Pro is not only faster, but it also runs cooler as well.
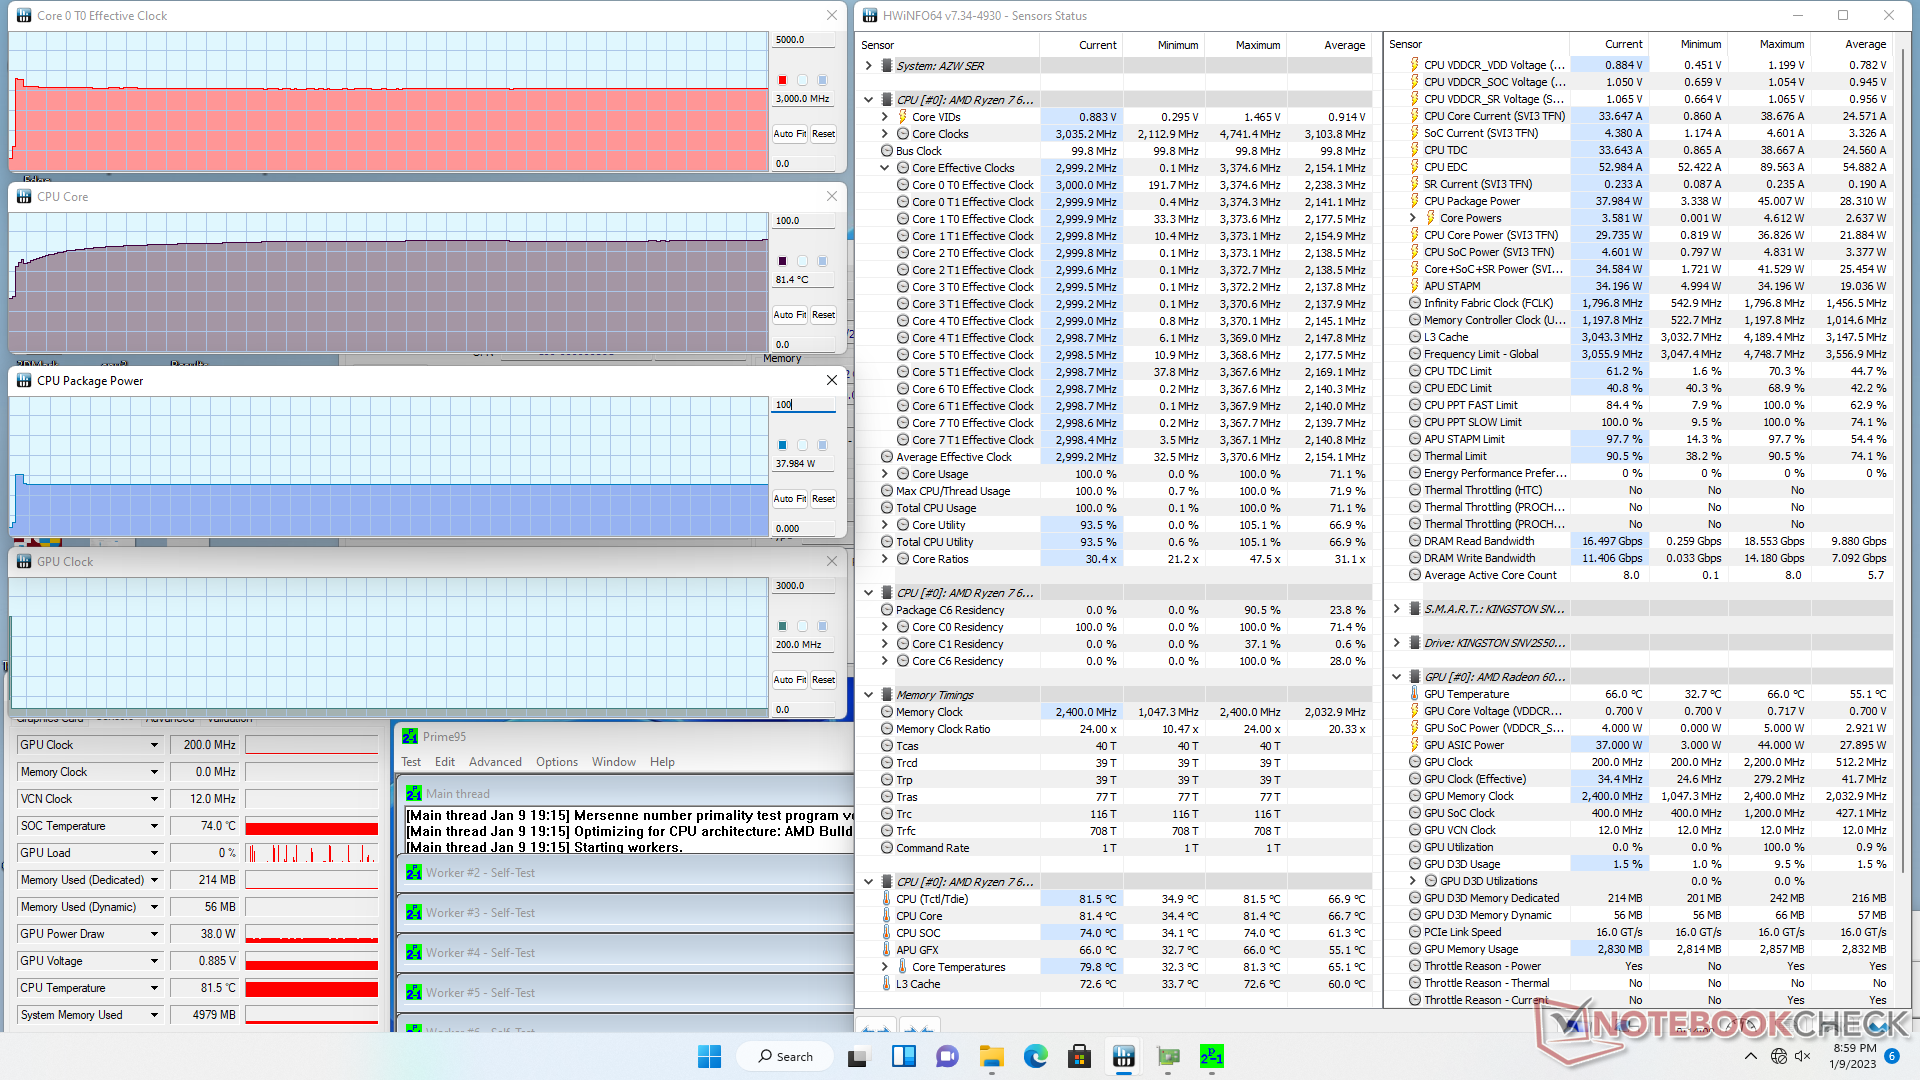
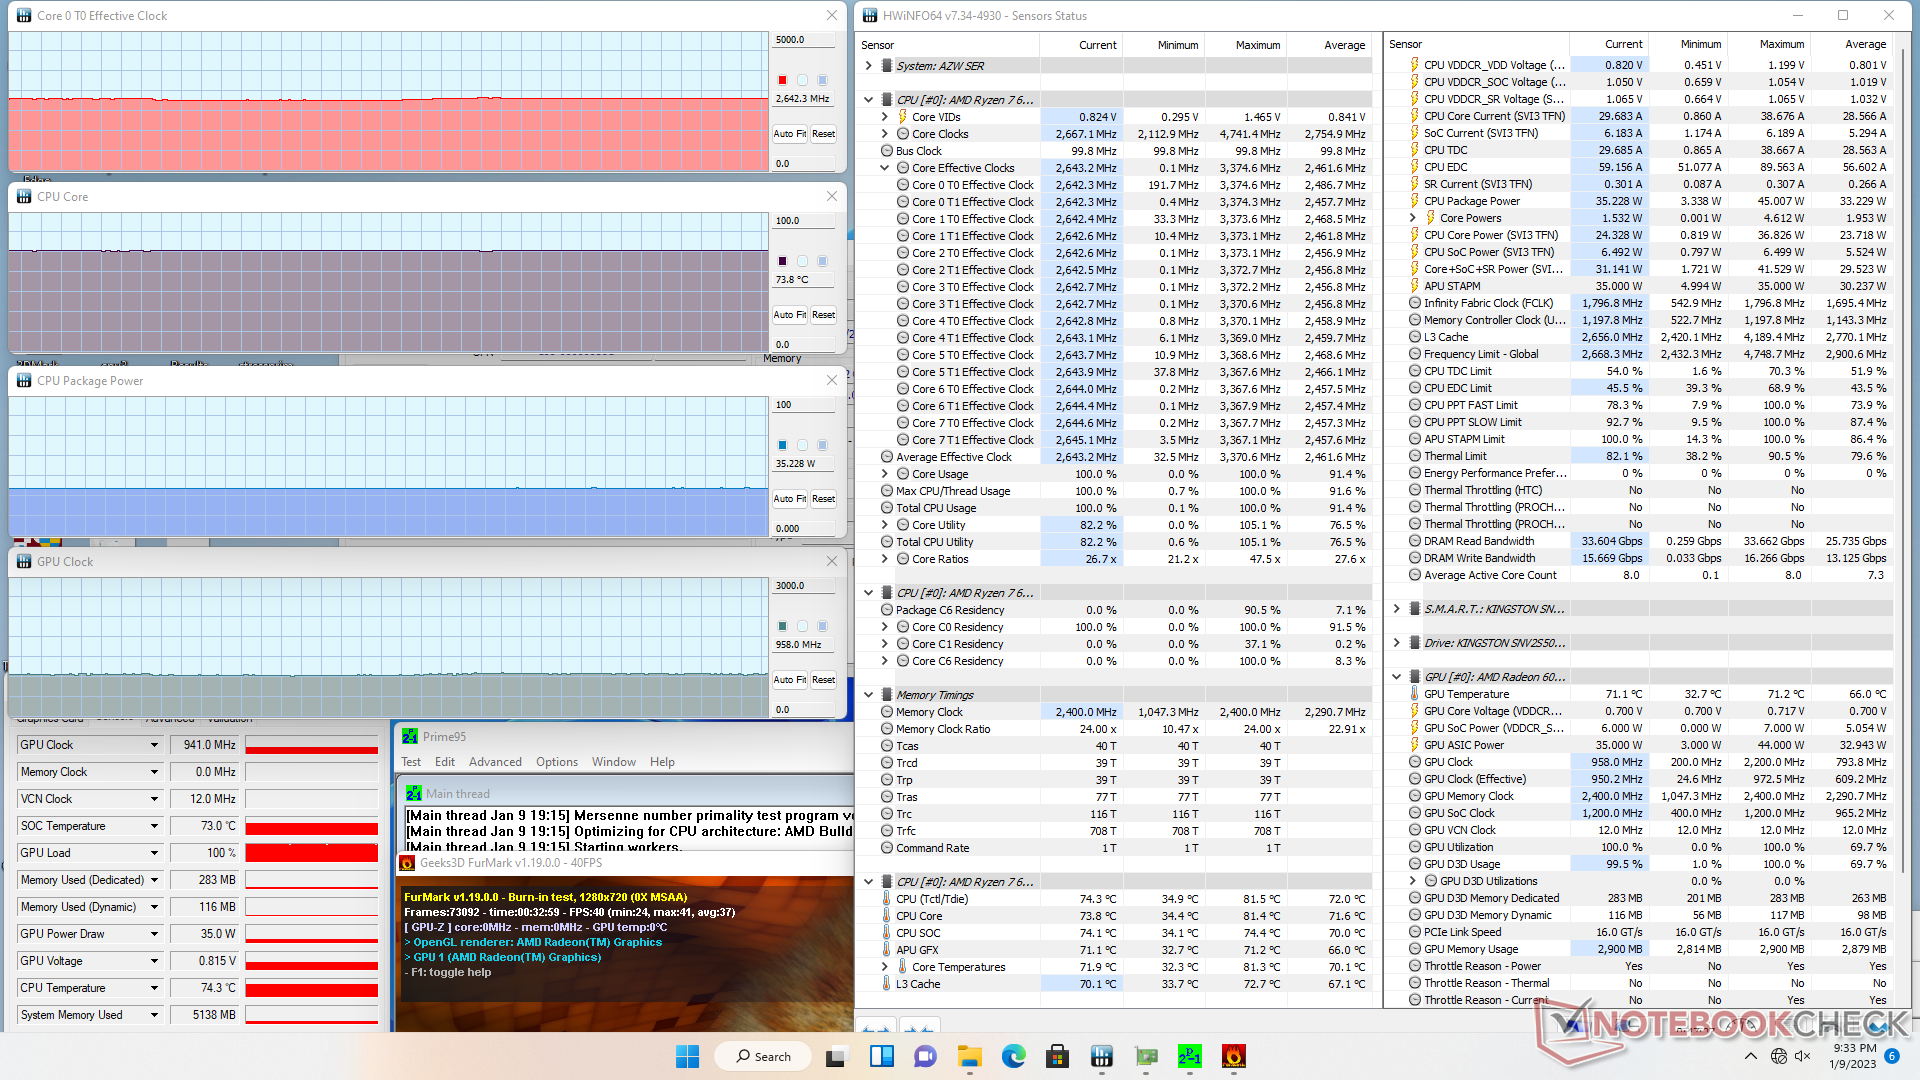
| CPU Clock (GHz) | GPU Clock (MHz) | Average CPU Temperature (°C) | |
| System Idle | -- | -- | 34 |
| Prime95 Stress | 3.0 | -- | 82 |
| Prime95 + FurMark Stress | 2.7 | 941 | 74 |
| Witcher 3 Stress | ~0.6 | 1956 | 70 |
Energy Management
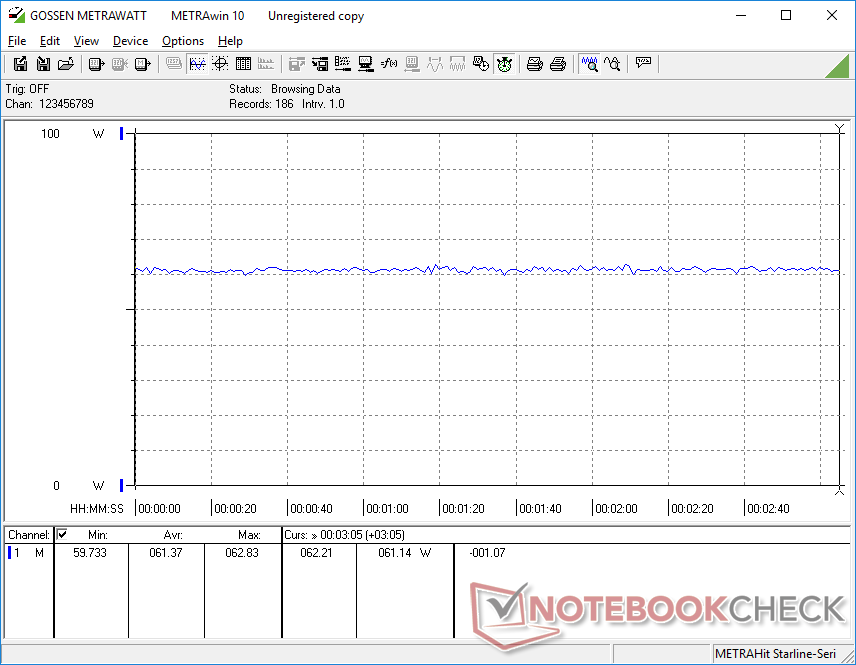
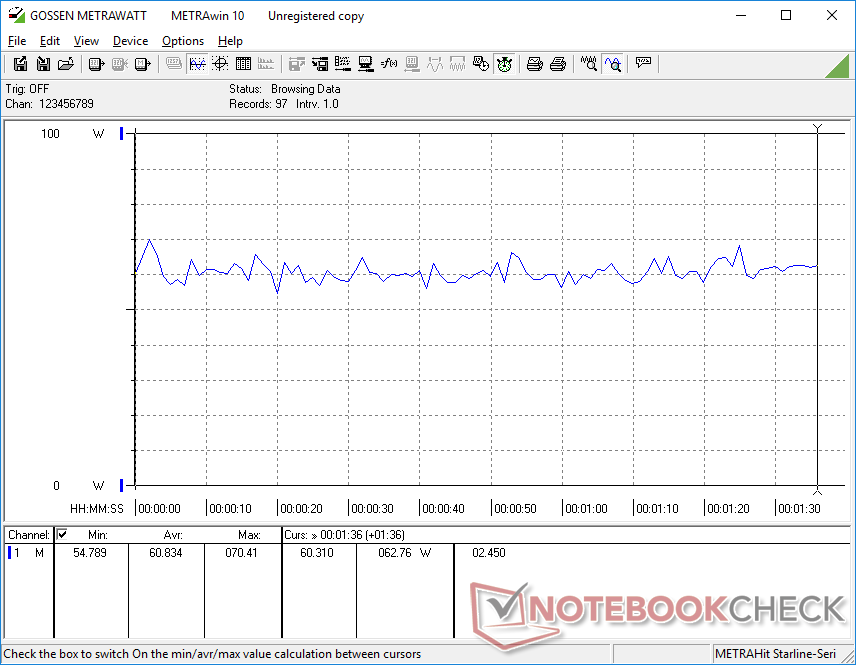
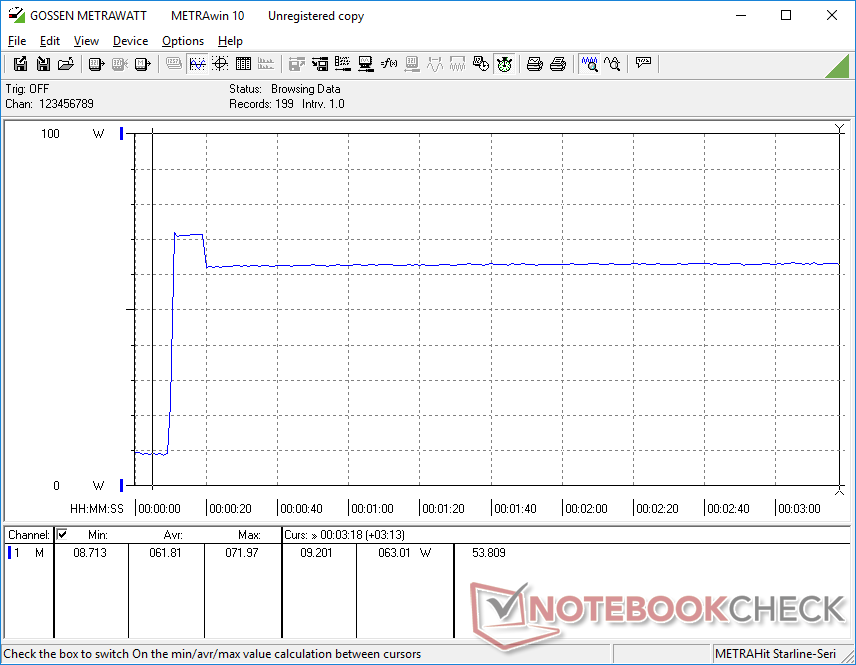
Power Consumption
Power consumption when gaming is about 33 percent higher than the SER5 Pro running on the last generation Ryzen 5 5600H and also slightly higher than the SEi11 Pro running on an Intel 12th gen Core H-series CPU. When considering that our Radeon 680M can offer up to 2x the performance of the Radeon RX Vega 7, however, the higher power consumption is certainly worth it. Idling on desktop would still consumes just as much power as on last year's model despite the upgraded graphics.
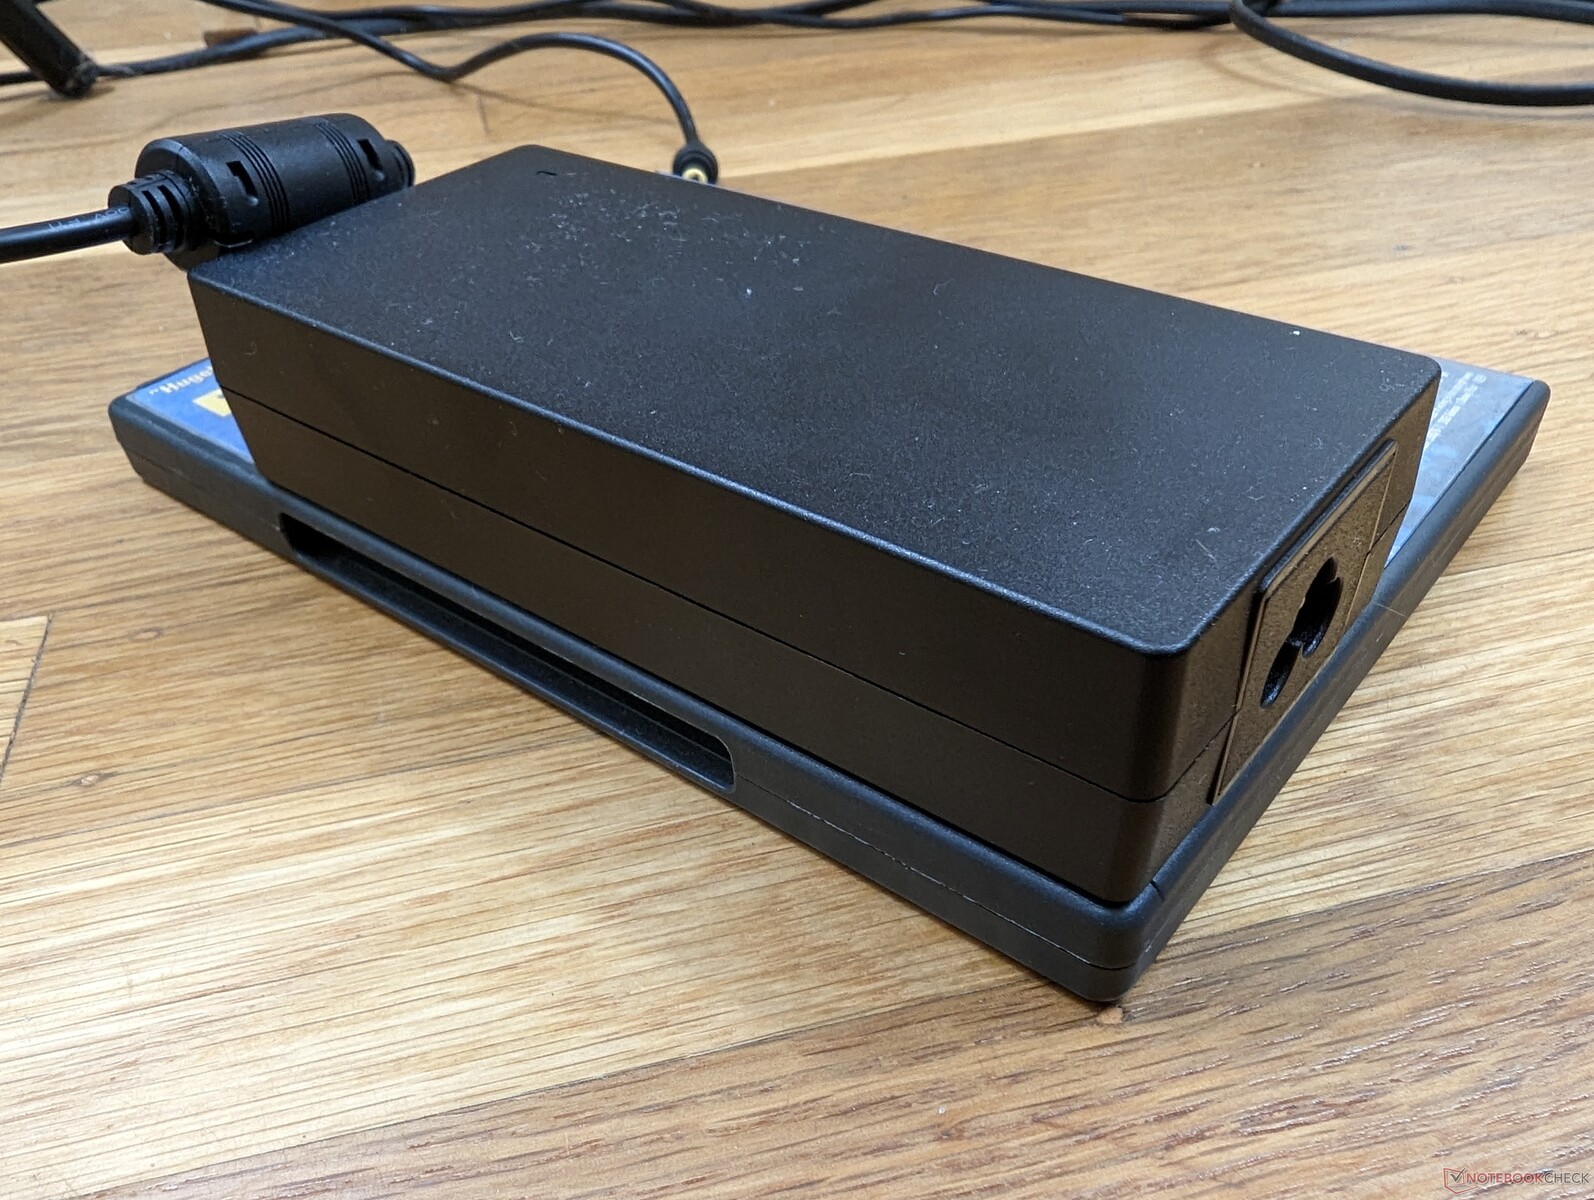
We're able to record a maximum draw of 72 W from the 120 W AC adapter when the CPU is at 100 percent utilization. The high overhead allows the mini PC to power or charge certain USB-C devices at the expense of a bulkier AC adapter.

| Off / Standby | |
| Idle | |
| Load |
|
| Beelink SER6 Pro R7 6800H, Radeon 680M, Kingston NV2 500GB SNV2S/500G, , x, | Beelink SER Pro Ryzen 5 5600H R5 5600H, Vega 7, Kingston NV1 SNVS/500GCN, , x, | Beelink SEi11 Pro i5-11320H, Iris Xe G7 96EUs, Kingston NV1 SNVS/500GCN, , x, | Intel NUC 12 Pro Kit NUC12WSKi7 i7-1260P, Iris Xe G7 96EUs, Transcend M.2 SSD 2200S TS512GMTE220S, , x, | Intel NUC11PHKi7C i7-1165G7, GeForce RTX 2060 Mobile, Samsung SSD 980 Pro 500GB MZ-V8P500BW, , x, | Intel Hades Canyon NUC8i7HVK i7-8809G, Vega M GH, Intel Optane 120 GB SSDPEK1W120GA, , x, | |
|---|---|---|---|---|---|---|
| Power Consumption | 19% | -3% | -35% | -93% | -91% | |
| Idle Minimum * | 8.3 | 5.4 35% | 9.8 -18% | 12.1 -46% | 5.8 30% | 15.5 -87% |
| Idle Average * | 8.4 | 8.2 2% | 10.3 -23% | 12.2 -45% | 5.9 30% | 16.2 -93% |
| Idle Maximum * | 8.7 | 8.3 5% | 10.5 -21% | 12.3 -41% | 20.7 -138% | 16.5 -90% |
| Load Average * | 60.8 | 49.3 19% | 54.2 11% | 64 -5% | 130.8 -115% | 83.4 -37% |
| Witcher 3 ultra * | 61.4 | 46.1 25% | 53.1 14% | 154.4 -151% | 121.7 -98% | |
| Load Maximum * | 72 | 50.2 30% | 59 18% | 98.8 -37% | 225.2 -213% | 173.5 -141% |
* ... smaller is better
Power Consumption Witcher 3 / Stresstest
Power Consumption external Monitor
Pros
Cons
Verdict — A Sleeper Hit
The SER6 Pro shares many of the same advantages and disadvantages as the recent GTR6. More specifically, performance is especially strong when compared to other mini PCs powered by integrated graphics, but both fan noise and power consumption are noisier and slightly higher, respectively. Its two main disadvantages don't detract from the incredible value buyers would be getting: 32 GB of RAM, 500 GB NVMe SSD, Windows 11 Pro, and one of the fastest mini PCs with integrated graphics all for just $650 USD.
The Beelink SER6 Pro beats an equivalently priced Intel Core U-series NUC in both performance and value by wide margins.
For future revisions, we'd like to see a smaller AC adapter and just one large internal fan instead of two smaller ones. The current AC adapter is heavier than the mini PC itself while a larger fan would result in lower-pitched and less noticeable fan noise. Users should also watch out for potential frame rate stability issues when gaming. Other than that, Beelink has been hitting it out of the park with its SEi and SER series of mini PCs in both performance and value.
Price and Availability
Amazon is currently shipping our exact SER6 Pro configuration for $650 USD. Users can also purchase directly from the manufacturer for $659.
More articles related to this device
Beelink SER6 Pro (SER Series)Related Articles


Transparency
The present review sample was made available to the author as a loan by the manufacturer or a shop for the purposes of review. The lender had no influence on this review, nor did the manufacturer receive a copy of this review before publication. There was no obligation to publish this review.
Pricecompare
