Notebookcheck Logo

Qualcomm Snapdragon 450 vs Mediatek MT8183 vs Qualcomm Snapdragon 439

Qualcomm Snapdragon 450

► remove from comparison Qualcomm SD 450

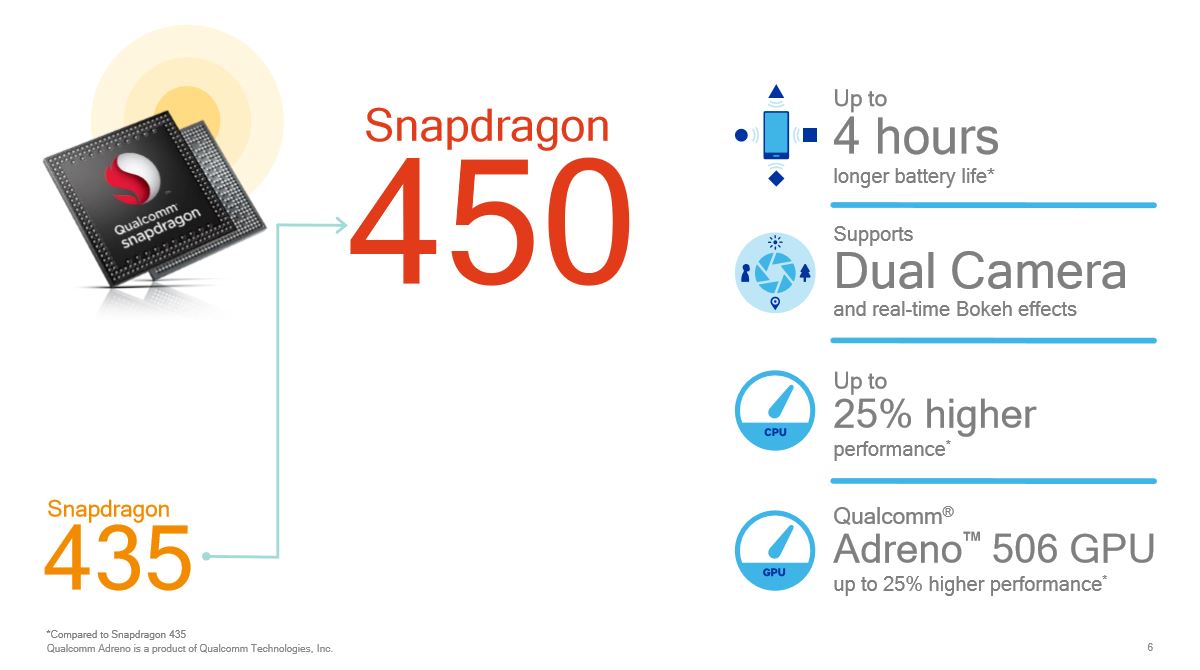
The Qualcomm Snapdragon 450 (SD450) is a lower mainstream SoC for (Android based) smartphones and tablets. It features eight ARM Cortex-A53 cores at up to 1.8 GHz and is already manufactured in the power efficient 14nm process. The integrated X9 LTE modem supports Cat. 7 with maximum transfer rates of 300 Mbps (downstream) and 150 Mbps (upstream). The SoC also includes an Adreno 506 GPU with support for Vulkan and OpenGL ES 3.1. WiFi 802.11ac (1x1, max 364 Mbps) and Bluetooth 4.1 are supported as well. The memory controller supports LPDDR3 (single channel) and the integrated video engine supports H.264 (encode and decode) and HEVC (only decode) in 1080p.

Mediatek MT8183

► remove from comparison  MT8183

The Mediatek MT8183 is a mainstream ARM SoC (System on a Chip) that was introduced in Late 2019 and is primarily used for Android based tablets. It is manufactured in a 12 nm process (unverified) and has a total of eight CPU cores with four powerful Cortex-A73 and four small Cortex-A53 cores in a big.LITTLE configuration. The integrated graphics card is a ARM Mali-G72 with three clusters (MP3).

Features

Besides CPU and GPU, the chip is also equipped with an LPDDR3/LPDDR4x memory controller, a Wi-Fi 5 (a/b/g/n/ac) modem (but no cellular modem). Furthermore, Mediatek states that it integrated an AI accelerator with a performance of 0.5 TOPS.

The maximum display resolution is only 2,400 x 1,080 pixels.

Qualcomm Snapdragon 439

► remove from comparison Qualcomm SD 439

The Qualcomm Snapdragon 439 (SD439) is a lower mainstream SoC for (Android based) smartphones and tablets. Compared to the older Snapdragon 435, the 439 is now manufactured in the current 12nm FinFET process and offers higher clock speeds of 2 GHz of the eight ARM Cortex-A53 cores (compared to 1.4 GHz). Wifi (now ac Wave 2 / Wifi 5) and Bluetooth (v5) were also updated, however the GPU still is the rather slow Adreno 505 and the LTE modem was even downgraded to a X6 with only Cat. 4/5 (max. 150 Mbps download, 75 Mbps upload).

Thanks to the higher maximum clock speed, the performance of the Snapdragon 439 mobile platform can reach the old Snapdragon 625 (also 2 GHz with 8x Cortex-A53). However, there is still a big gap to the SoCs with bigger performance cores.

ModelQualcomm Snapdragon 450Mediatek MT8183Qualcomm Snapdragon 439
SeriesQualcomm Snapdragon Mediatek MT8Qualcomm Snapdragon
CodenameCortex-A53Cortex-A73/-A53Cortex-A53
Series: Snapdragon Cortex-A53
Qualcomm Snapdragon 6302.2 GHz8 / 8 cores Cortex-A53
Qualcomm Snapdragon 6262.2 GHz8 / 8 cores Cortex-A53
Qualcomm Snapdragon 6252 GHz8 / 8 cores Cortex-A53
Qualcomm Snapdragon 4392 GHz8 / 8 cores Cortex-A53
Qualcomm Snapdragon 450 « 1.8 GHz8 / 8 cores Cortex-A53
Qualcomm Snapdragon 4292 GHz4 / 4 cores Cortex-A53
Qualcomm Snapdragon 617 MSM89521.5 GHz8 / 8 cores Cortex-A53
Qualcomm Snapdragon 616 MSM8939v21.7 GHz8 / 8 cores Cortex-A53
Qualcomm Snapdragon 615 MSM89391.7 GHz8 / 8 cores Cortex-A53
Qualcomm Snapdragon 610 MSM89361.7 GHz4 / 4 cores Cortex-A53
Qualcomm Snapdragon 4351.4 GHz8 / 8 cores Cortex-A53
Qualcomm Snapdragon 430 (MSM8937)1.4 GHz8 / 8 cores Cortex-A53
Qualcomm Snapdragon 415 MSM89291.4 GHz8 / 8 cores Cortex-A53
Qualcomm Snapdragon 425 (MSM8917)1.4 GHz4 / 4 cores Cortex-A53
Qualcomm Snapdragon 410 MSM89161.4 GHz4 / 4 cores Cortex-A53
Qualcomm Snapdragon 410 APQ80161.2 GHz4 / 4 cores Cortex-A53
Qualcomm Snapdragon 6302.2 GHz8 / 8 cores Cortex-A53
Qualcomm Snapdragon 6262.2 GHz8 / 8 cores Cortex-A53
Qualcomm Snapdragon 6252 GHz8 / 8 cores Cortex-A53
Qualcomm Snapdragon 439 « 2 GHz8 / 8 cores Cortex-A53
Qualcomm Snapdragon 4501.8 GHz8 / 8 cores Cortex-A53
Qualcomm Snapdragon 4292 GHz4 / 4 cores Cortex-A53
Qualcomm Snapdragon 617 MSM89521.5 GHz8 / 8 cores Cortex-A53
Qualcomm Snapdragon 616 MSM8939v21.7 GHz8 / 8 cores Cortex-A53
Qualcomm Snapdragon 615 MSM89391.7 GHz8 / 8 cores Cortex-A53
Qualcomm Snapdragon 610 MSM89361.7 GHz4 / 4 cores Cortex-A53
Qualcomm Snapdragon 4351.4 GHz8 / 8 cores Cortex-A53
Qualcomm Snapdragon 430 (MSM8937)1.4 GHz8 / 8 cores Cortex-A53
Qualcomm Snapdragon 415 MSM89291.4 GHz8 / 8 cores Cortex-A53
Qualcomm Snapdragon 425 (MSM8917)1.4 GHz4 / 4 cores Cortex-A53
Qualcomm Snapdragon 410 MSM89161.4 GHz4 / 4 cores Cortex-A53
Qualcomm Snapdragon 410 APQ80161.2 GHz4 / 4 cores Cortex-A53
Clock1800 MHz2000 MHz2000 MHz
Cores / Threads8 / 88 / 88 / 8
Technology14 nm12 nm12 nm
FeaturesAdreno 506 GPU, X9 LTE Modem (300 / 150 Mbps)32 MP Camera ISP, 1080p H.264 Video Encoder, H.265 DecoderAdreno 505 GPU, 802.11ac Wave 2WLAN, Bluetooth 5.0, X6 LTE Cat 4/5 (150 / 75 Mbps),
iGPUQualcomm Adreno 506ARM Mali-G72 MP3Qualcomm Adreno 505
ArchitectureARMARMARM
Announced
Manufacturerwww.qualcomm.comwww.qualcomm.com

Benchmarks

Performance Rating - Geekbench 5.5, PCM Work, Sling Shot Physics, Antutu v8 CPU - SD 450
0.2 pt (14%)
Performance Rating - Geekbench 5.5, PCM Work, Sling Shot Physics, Antutu v8 CPU - MT8183
0.5 pt (36%)
Performance Rating - Geekbench 5.5, PCM Work, Sling Shot Physics, Antutu v8 CPU - SD 439
0.3 pt (23%)
3DMark - 3DMark Ice Storm Extreme Physics
100%
1 SD 450 +
11735 Points (10%)
3DMark - 3DMark Ice Storm Unlimited Physics
min: 13596     avg: 14216     median: 14036.5 (12%)     max: 15273 Points
min: 15776     avg: 18163     median: 18829 (16%)     max: 19883 Points
min: 12096     avg: 12492     median: 12492.5 (11%)     max: 12809 Points
3DMark - 3DMark Sling Shot Extreme (ES 3.1) Unlimited Physics
min: 1529     avg: 1773     median: 1789.5 (21%)     max: 1826 Points
min: 2085     avg: 2543     median: 2560.5 (30%)     max: 2966 Points
min: 1500     avg: 1597     median: 1608 (19%)     max: 1657 Points
min: 2322     avg: 2590     median: 2543 (29%)     max: 2963 Points
min: 1516     avg: 1588     median: 1598 (18%)     max: 1618 Points
Geekbench 6.2 - Geekbench 6.2 Single-Core
100%
1 MT8183 +
323 Points (9%)
Geekbench 6.2 - Geekbench 6.2 Multi-Core
100%
1 MT8183 +
1214 Points (5%)
Geekbench 5.5 - Geekbench 5.1 - 5.4 64 Bit Single-Core
min: 131     avg: 140.3     median: 131 (6%)     max: 159 Points
176 Points (7%)
Geekbench 5.5 - Geekbench 5.1 - 5.4 64 Bit Multi-Core
min: 493     avg: 631     median: 498 (1%)     max: 902 Points
min: 909     avg: 1208     median: 1293 (2%)     max: 1430 Points
823 Points (1%)
Geekbench 5.0 - Geekbench 5.0 64 Bit Single-Core
0 Points (0%)
100%
1 SD 439 +
min: 176     avg: 176.7     median: 177 (1%)     max: 177 Points
Geekbench 5.0 - Geekbench 5.0 64 Bit Multi-Core
0 Points (0%)
100%
1 SD 439 +
min: 809     avg: 819     median: 812 (3%)     max: 836 Points
min: 1397     avg: 1431     median: 1430.5 (14%)     max: 1464 Points
min: 863     avg: 880     median: 877.5 (9%)     max: 903 Points
Geekbench 4.4 - Geekbench 4.1 - 4.4 64 Bit Multi-Core
min: 3272     avg: 3862     median: 3907 (4%)     max: 4022 Points
min: 5308     avg: 5377     median: 5376.5 (6%)     max: 5445 Points
min: 2987     avg: 3141     median: 3154 (3%)     max: 3267 Points
Geekbench 4.0 - Geekbench 4.0 64 Bit Single-Core
min: 709     avg: 733     median: 732.5 (10%)     max: 756 Points
1395 Points (19%)
863 Points (12%)
Geekbench 4.0 - Geekbench 4.0 64 Bit Multi-Core
min: 3625     avg: 3691     median: 3690.5 (9%)     max: 3756 Points
4968 Points (12%)
3218 Points (8%)
Geekbench 3 - Geekbench 3 64 Bit Multi-Core
min: 3963     avg: 3981     median: 3980.5 (6%)     max: 3998 Points
min: 5754     avg: 6212     median: 6212 (10%)     max: 6670 Points
3636 Points (6%)
Geekbench 3 - Geekbench 3 64 Bit Single-Core
707 Points (11%)
min: 1410     avg: 1469     median: 1468.5 (22%)     max: 1527 Points
792 Points (12%)
Geekbench 2 - 32 Bit - Geekbench Stream
min: 737     avg: 747     median: 746.5 (6%)     max: 756 Points
805 Points (6%)
712 Points (6%)
Geekbench 2 - 32 Bit - Geekbench Memory
min: 1708     avg: 2113     median: 2112.5 (19%)     max: 2517 Points
1718 Points (16%)
1563 Points (14%)
Geekbench 2 - 32 Bit - Geekbench Floating Point
min: 5993     avg: 6011     median: 6010.5 (12%)     max: 6028 Points
10758 Points (21%)
5986 Points (12%)
Geekbench 2 - 32 Bit - Geekbench Integer
min: 3340     avg: 3381     median: 3381 (7%)     max: 3422 Points
5381 Points (11%)
3444 Points (7%)
Geekbench 2 - 32 Bit - Geekbench Total Score
min: 3683     avg: 3784     median: 3783.5 (10%)     max: 3884 Points
6072 Points (16%)
3684 Points (10%)
Mozilla Kraken 1.1 - Kraken 1.1 Total Score *
min: 11012     avg: 11506     median: 11492.5 (13%)     max: 11863 ms
min: 3957     avg: 4403     median: 4337.5 (5%)     max: 4979 ms
min: 9768     avg: 9963     median: 9952.5 (12%)     max: 10143 ms
Octane V2 - Octane V2 Total Score
min: 3470     avg: 3981     median: 3997 (4%)     max: 4115 Points
min: 8665     avg: 9742     median: 9822 (9%)     max: 10670 Points
min: 4512     avg: 4731     median: 4755.5 (4%)     max: 4958 Points
WebXPRT 3 - WebXPRT 3 Score
min: 28     avg: 31.3     median: 31.5 (7%)     max: 34 Points
min: 46     avg: 54.3     median: 55.5 (12%)     max: 60 Points
min: 32     avg: 35.2     median: 35.5 (7%)     max: 38 Points
AnTuTu v6 - AnTuTu v6 Total Score
100%
1 SD 450 +
min: 54731     avg: 57703     median: 57827.5 (20%)     max: 60077 Points
105%
1 SD 439 +
min: 59539     avg: 60585     median: 60585 (21%)     max: 61631 Points
AnTuTu v7 - AnTuTu v7 MEM
min: 4090     avg: 5355     median: 5158 (16%)     max: 7614 Points
0 Points (0%)
min: 4849     avg: 5390     median: 5051 (16%)     max: 6271 Points
AnTuTu v7 - AnTuTu v7 UX
min: 17204     avg: 19521     median: 19734 (24%)     max: 20891 Points
0 Points (0%)
min: 19841     avg: 21900     median: 22846 (28%)     max: 23014 Points
AnTuTu v7 - AnTuTu v7 GPU
min: 11937     avg: 12110     median: 12147 (4%)     max: 12208 Points
0 Points (0%)
min: 12224     avg: 12439     median: 12514 (4%)     max: 12579 Points
AnTuTu v7 - AnTuTu v7 CPU
min: 33473     avg: 34106     median: 33975 (21%)     max: 35092 Points
0 Points (0%)
min: 37733     avg: 37810     median: 37769 (23%)     max: 37928 Points
AnTuTu v7 - AnTuTu v7 Total Score
min: 56497     avg: 69869     median: 71167 (13%)     max: 73468 Points
0 Points (0%)
min: 75175     avg: 77540     median: 77652 (14%)     max: 79792 Points
AnTuTu v8 - AnTuTu v8 UX
min: 26309     avg: 28038     median: 28107 (24%)     max: 29697 Points
32912 Points (28%)
min: 6969     avg: 12860     median: 13894 (12%)     max: 16684 Points
AnTuTu v8 - AnTuTu v8 MEM
min: 13168     avg: 16031     median: 15671 (13%)     max: 19253 Points
32293 Points (26%)
min: 27672     avg: 29440     median: 29676.5 (24%)     max: 30734 Points
AnTuTu v8 - AnTuTu v8 GPU
min: 9371     avg: 9408     median: 9408 (2%)     max: 9444 Points
25424 Points (5%)
min: 9258     avg: 10049     median: 10067 (2%)     max: 10803 Points
AnTuTu v8 - AnTuTu v8 CPU
min: 28376     avg: 35468     median: 38797 (14%)     max: 39230 Points
67925 Points (25%)
min: 40746     avg: 41220     median: 41221.5 (15%)     max: 41690 Points
AnTuTu v8 - AnTuTu v8 Total Score
min: 89022     avg: 92277     median: 90185 (9%)     max: 97624 Points
158554 Points (15%)
min: 84645     avg: 93569     median: 95218 (9%)     max: 99193 Points
Antutu v9 - AnTuTu v9 Total Score
100%
1 MT8183 +
160693 Points (10%)
Antutu v9 - AnTuTu v9 CPU
100%
1 MT8183 +
69184 Points (19%)
AndEBench - AndEBench Java
0 Iter./s (0%)
AndEBench - AndEBench Native
0 Iter./s (0%)
PassMark PerformanceTest Mobile V1 - PerformanceTest Mobile V1 CPU Tests
101906 Points (13%)
175006 Points (23%)
105520 Points (14%)
PCMark for Android - PCM f. Android Work 2.0 Battery Life
100%
1 SD 450 +
652 min (12%)
PCMark for Android - PCM f. Android Computer Vision
min: 2140     avg: 2239     median: 2157 (11%)     max: 2583 Points
min: 2714     avg: 3143     median: 3143 (17%)     max: 3572 Points
min: 2490     avg: 2557     median: 2556.5 (14%)     max: 2623 Points
PCMark for Android - PCM f. Android Storage
min: 3145     avg: 5094     median: 4391 (9%)     max: 7635 Points
min: 6470     avg: 11152     median: 11152 (24%)     max: 15834 Points
min: 4775     avg: 5213     median: 5212.5 (11%)     max: 5650 Points
min: 4412     avg: 4632     median: 4643.5 (30%)     max: 4791 Points
min: 6284     avg: 7442     median: 7441.5 (37%)     max: 8599 Points
min: 5880     avg: 6095     median: 6115 (31%)     max: 6228 Points
PCMark for Android - PCM f. Android Storage 2.0 score
100%
1 MT8183 +
min: 6087     avg: 13047     median: 13046.5 (21%)     max: 20006 Points
PCMark for Android - PCM f. Android Work Score 3.0
100%
1 MT8183 +
min: 5224     avg: 5900     median: 5830.5 (27%)     max: 6716 Points
Power Consumption - Geekbench 5.5 Power Consumption 150cd *
100%
1 MT8183 +
min: 3.4     avg: 3.4     median: 3.4 (1%)     max: 3.44 Watt
Power Consumption - Idle Power Consumption 150cd 1min *
100%
1 MT8183 +
min: 1.871     avg: 1.9     median: 1.9 (2%)     max: 1.889 Watt

Average Benchmarks Qualcomm Snapdragon 450 → 100% n=34

Average Benchmarks Mediatek MT8183 → 145% n=34

Average Benchmarks Qualcomm Snapdragon 439 → 107% n=34

- Range of benchmark values for this graphics card
- Average benchmark values for this graphics card
* Smaller numbers mean a higher performance
1 This benchmark is not used for the average calculation

v1.26
log 28. 00:34:00

#0 checking url part for id 9946 +0s ... 0s

#1 checking url part for id 11547 +0s ... 0s

#2 checking url part for id 11405 +0s ... 0s

#3 not redirecting to Ajax server +0s ... 0s

#4 did not recreate cache, as it is less than 5 days old! Created at Sat, 25 May 2024 05:38:31 +0200 +0.001s ... 0.001s

#5 composed specs +0.026s ... 0.027s

#6 did output specs +0s ... 0.027s

#7 getting avg benchmarks for device 9946 +0.012s ... 0.039s

#8 got single benchmarks 9946 +0.041s ... 0.08s

#9 getting avg benchmarks for device 11547 +0.012s ... 0.092s

#10 got single benchmarks 11547 +0.022s ... 0.114s

#11 getting avg benchmarks for device 11405 +0.009s ... 0.123s

#12 got single benchmarks 11405 +0.02s ... 0.143s

#13 got avg benchmarks for devices +0s ... 0.143s

#14 No cached benchmark found, getting uncached values +0.078s ... 0.221s

#15 No cached benchmark found, getting uncached values +0.004s ... 0.225s

#16 No cached benchmark found, getting uncached values +0.097s ... 0.322s

#17 No cached benchmark found, getting uncached values +0.004s ... 0.325s

#18 No cached benchmark found, getting uncached values +0.004s ... 0.33s

#19 No cached benchmark found, getting uncached values +0.004s ... 0.333s

#20 No cached benchmark found, getting uncached values +0.004s ... 0.337s

#21 No cached benchmark found, getting uncached values +0.025s ... 0.362s

#22 No cached benchmark found, getting uncached values +0.001s ... 0.364s

#23 min, max, avg, median took s +0.033s ... 0.397s

#24 return log +0s ... 0.397s

Please share our article, every link counts!
> Expert Reviews and News on Laptops, Smartphones and Tech Innovations > Benchmarks / Tech > Processor Comparison - Head 2 Head
Redaktion, 2017-09- 8 (Update: 2023-07- 1)