Notebookcheck Logo

AMD Ryzen 7 5700G vs Intel Core i5-13500HX

AMD Ryzen 7 5700G

► remove from comparison AMD R7 5700G

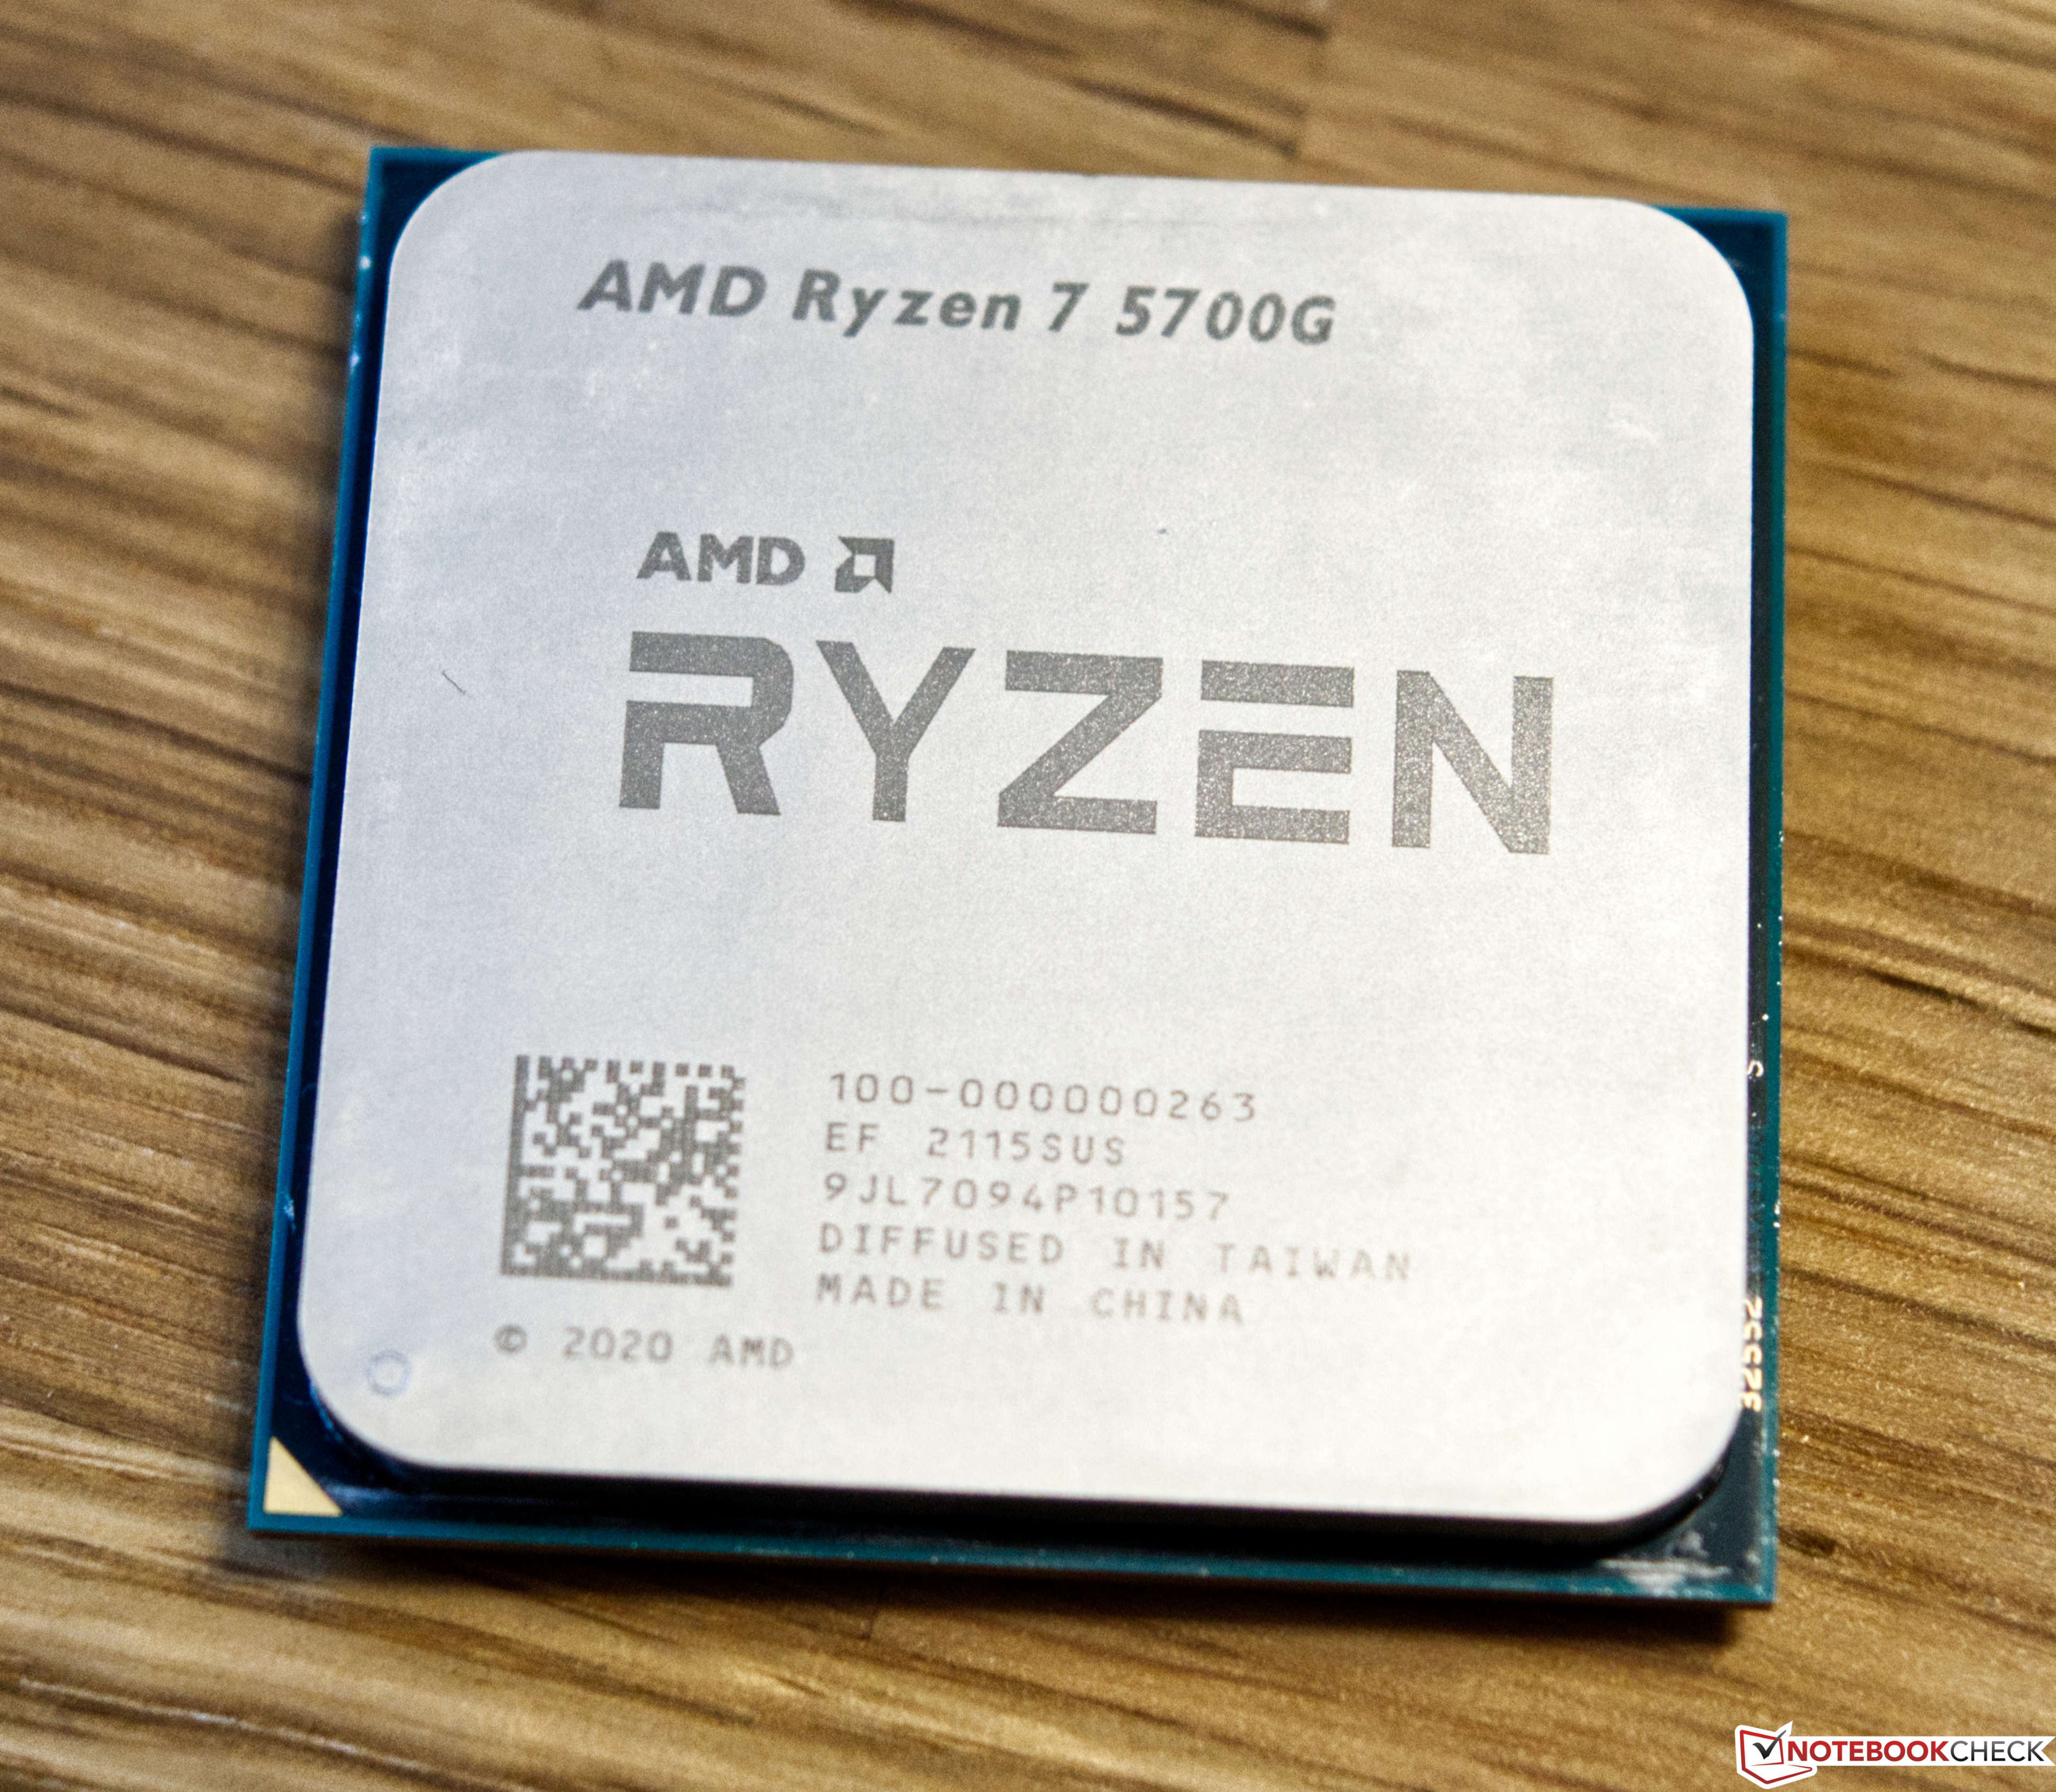
The AMD Ryzen 7 5700G is a desktop APU with 8 cores and part of the Cezanne product family. The 8 cores are based on the Zen 3 architecture and can clock between 3.8 to 4.6 GHz. Thanks to Simultaneous Multithreading (SMT), the CPU supports up to 16 threads at once. At time of the launch, the 5700G is the fastest 8-core-CPU with an iGPU from AMD.

The integrated AMD Radeon RX Vega 8 is currently one of the fastest iGPUs and capable of 1080p gaming at low details.

Performance

The 5700G delivers very serviceable multi-thread performance, as of mid 2022, trading blows with upper mid-range chips such as the Ryzen 7 3700X and the Core i5-12500H. Besides, the consumer is officially allowed to overclock the thing, creating a bit of a performance gain out of thin air. Find out more by reading our full Ryzen 7 5700G review.

Power consumption

This Ryzen 7 series APU has a default TDP, also known as the long-term power limit, of 65 W. PC makers are free to reduce that somewhat with 45 W being the minimum AMD-recommended value. Clock speeds and performance would take a hit as a result.

The R7 5700G is built with TSMC's 7 nm manufacturing process for average, as of mid 2023, energy efficiency.

Intel Core i5-13500HX

► remove from comparison Intel i5-13500HX

The Intel Core i5-13500HX is a fast mid-range mobile processor of the Raptor Lake series. Is was announced in early 2023 and integrates 6 fast Raptor Cove performance cores (P-cores) with HyperThreading and 8 Gracemont efficiency cores without Hyper-Threading. The P-Cores clock between 2.5 GHz (base) up to 4.7 GHz (single core boost, all-core 4.5 GHz). The smaller E-Cores clock between 1.8 and 3.5 GHz. All cores can access the combined 24 MB L3 cache.

Compared to Alder Lake, Raptor Lake offers improved P-Cores (Raptor Cove micro-architecture) with bigger Caches and more E-Cores (same Gracemont micro-architecture). Furthermore, the chip supports faster DDR5 memory (up to 5600 MHz for the 13980HX, but only 4800 MHz for the i5).

Performance

The average 13500HX in our database is in the same league as the Ryzen 7 7745HX, Core i7-13705H, Core i9-12900HK, Core i9-13900H, Core i9-13905H, as far as multi-thread benchmark scores are concerned. This is a very, very fast CPU, as of mid 2023.

Your mileage may vary depending on how competent the cooling solution of your laptop is and how high the CPU power limits are.

Power consumption

The chip's "minimum assured" power consumption sits at 45 W. Its maximum Intel-recommended Turbo power consumption is 157 W and the Base power consumption is supposed to be around 55 W. Most laptop makers will go for a value much higher than 55 W to get better performance.

The i5-13500HX is manufactured on Intel's 4th generation 10 nm process marketed as Intel 7 for average, as of early 2023, energy efficiency.

ModelAMD Ryzen 7 5700GIntel Core i5-13500HX
CodenameCezanne (Zen 3)Raptor Lake-HX
SeriesAMD Cezanne (Zen 3, Ryzen 5000)Intel Raptor Lake-HX
Clock3800 - 4600 MHz1800 - 4700 MHz
L1 Cache512 KB
L2 Cache4 MB
L3 Cache16 MB24 MB
Cores / Threads8 / 1614 / 20
6 x 4.7 GHz Intel Raptor Cove P-Core
8 x 3.5 GHz Intel Gracemont E-Core
TDP65 Watt55 Watt
Technology7 nm10 nm
max. Temp.95 °C100 °C
SocketAM4BGA1964
FeaturesDDR4-3200 RAM, PCIe 3, MMX, SSE, SSE2, SSE3, SSSE3, SSE4A, SSE4.1, SSE4.2, AVX, AVX2, BMI2, ABM, FMA, ADX, SMEP, SMAP, SMT, CPB, AES-NI, RDRAND, RDSEED, SHA, SMEDDR4-3200/DDR5-4800 RAM, PCIe 5, Thr. Director, DL Boost, GNA, MMX, SSE, SSE2, SSE3, SSSE3, SSE4.1, SSE4.2, AVX, AVX2, BMI2, ABM, FMA, ADX, VMX, SMEP, SMAP, EIST, TM1, TM2, HT, Turbo, SST, AES-NI, RDRAND, RDSEED, SHA
iGPUAMD Radeon RX Vega 8 (Ryzen 4000/5000) ( - 2000 MHz)Intel UHD Graphics Xe 16EUs (Tiger Lake-H) ( - 1500 MHz)
Architecturex86x86
$359 U.S.
Announced
Manufacturerwww.amd.comark.intel.com
Series: Raptor Lake-HX Raptor Lake-HX
Intel Core i9-13980HX compare1.6 - 5.6 GHz24 / 32 cores36 MB L3
Intel Core i9-13950HX compare1.6 - 5.5 GHz24 / 32 cores36 MB L3
Intel Core i9-13900HX compare1.6 - 5.4 GHz24 / 32 cores36 MB L3
Intel Core i7-13850HX compare1.5 - 5.3 GHz20 / 28 cores30 MB L3
Intel Core i7-13700HX compare1.5 - 5 GHz16 / 24 cores30 MB L3
Intel Core i7-13650HX compare1.9 - 4.9 GHz14 / 20 cores24 MB L3
Intel Core i5-13600HX compare1.9 - 4.8 GHz14 / 20 cores24 MB L3
Intel Core i5-13500HX « 1.8 - 4.7 GHz14 / 20 cores24 MB L3
Intel Core i5-13450HX compare1.8 - 4.6 GHz10 / 16 cores20 MB L3
Die Size257 mm2

Benchmarks

Performance Rating - CB R15 + R20 + 7-Zip + X265 + Blender + 3DM11 CPU - R7 5700G
36.1 pt (60%)
Restrict / Search: Model: Max. age: years
Performance Rating - CB R15 + R20 + 7-Zip + X265 + Blender + 3DM11 CPU - i5-13500HX
38.6 pt (64%)
Restrict / Search: Model: Max. age: years
Cinebench 2024 - Cinebench 2024 CPU Single Core
98 Points (55%)
Cinebench 2024 - Cinebench 2024 CPU Multi Core
887 Points (17%)
Cinebench R23 - Cinebench R23 Multi Core
min: 11873     avg: 12831     median: 12830.5 (12%)     max: 13788 Points
min: 18235     avg: 18582     median: 18334 (17%)     max: 19176 Points
Cinebench R23 - Cinebench R23 Single Core
min: 1493     avg: 1494     median: 1494 (63%)     max: 1495 Points
min: 1689     avg: 1731     median: 1730.5 (73%)     max: 1772 Points
Cinebench R20 - Cinebench R20 CPU (Single Core)
min: 583     avg: 584     median: 584 (64%)     max: 585 Points
min: 648     avg: 674     median: 679 (74%)     max: 695 Points
Cinebench R20 - Cinebench R20 CPU (Multi Core)
min: 4660     avg: 5016     median: 5015.5 (12%)     max: 5371 Points
min: 6978     avg: 7123     median: 7021 (17%)     max: 7371 Points
Cinebench R15 - Cinebench R15 CPU Multi 64 Bit
min: 1980     avg: 2107     median: 2107 (13%)     max: 2234 Points
min: 2856     avg: 2894     median: 2863 (18%)     max: 2964 Points
Cinebench R15 - Cinebench R15 CPU Single 64 Bit
min: 242     avg: 242.5     median: 242.5 (67%)     max: 243 Points
min: 242     avg: 252.3     median: 252 (70%)     max: 263 Points
Cinebench R11.5 - Cinebench R11.5 CPU Multi 64 Bit
min: 22.79     avg: 23.6     median: 23.6 (31%)     max: 24.37 Points
33.7 Points (44%)
Cinebench R11.5 - Cinebench R11.5 CPU Single 64 Bit
min: 2.84     avg: 2.9     median: 2.9 (68%)     max: 2.87 Points
3.1 Points (75%)
Cinebench R10 - Cinebench R10 Rend. Single (32bit)
min: 6183     avg: 6196     median: 6196 (37%)     max: 6209 Points
8980 Points (54%)
Cinebench R10 - Cinebench R10 Rend. Multi (32bit)
min: 37541     avg: 38827     median: 38826.5 (28%)     max: 40112 Points
58608 Points (42%)
Cinebench R10 - Cinebench R10 Rend. Multi (64bit)
min: 66237     avg: 68700     median: 68699.5 (44%)     max: 71162 Points
Cinebench R10 - Cinebench R10 Rend. Single (64bit)
min: 11351     avg: 11732     median: 11732 (14%)     max: 12113 Points
wPrime 2.10 - wPrime 2.0 1024m *
min: 90.5     avg: 94.6     median: 94.6 (1%)     max: 98.635 s
400.2 s (5%)
wPrime 2.10 - wPrime 2.0 32m *
min: 3.595     avg: 4.3     median: 4.3 (1%)     max: 5.067 s
10.7 s (2%)
WinRAR - WinRAR 4.0
min: 6960     avg: 7681     median: 7680.5 (12%)     max: 8401 Points
7-Zip 18.03 - 7-Zip 18.03 Multi Thread 4 runs
min: 55046     avg: 59702     median: 59702 (34%)     max: 64358 MIPS
min: 68923     avg: 71289     median: 71243 (41%)     max: 73701 MIPS
7-Zip 18.03 - 7-Zip 18.03 Single Thread 4 runs
min: 5809     avg: 5814     median: 5813.5 (69%)     max: 5818 MIPS
min: 5377     avg: 5652     median: 5728 (68%)     max: 5850 MIPS
X264 HD Benchmark 4.0 - x264 Pass 2
min: 116.8     avg: 123.4     median: 123.4 (3%)     max: 130 fps
X264 HD Benchmark 4.0 - x264 Pass 1
min: 263.5     avg: 273.8     median: 273.8 (7%)     max: 284 fps
HWBOT x265 Benchmark v2.2 - HWBOT x265 4k Preset
min: 14.8     avg: 15.8     median: 15.8 (28%)     max: 16.8 fps
min: 20.3     avg: 20.5     median: 20.3 (36%)     max: 20.9 fps
TrueCrypt - TrueCrypt Serpent
min: 1     avg: 1.1     median: 1.1 (31%)     max: 1.1 GB/s
1.5 GB/s (44%)
TrueCrypt - TrueCrypt Twofish
min: 1.5     avg: 1.6     median: 1.6 (28%)     max: 1.7 GB/s
2.8 GB/s (48%)
TrueCrypt - TrueCrypt AES
min: 7.6     avg: 10.5     median: 10.5 (27%)     max: 13.4 GB/s
14.6 GB/s (38%)
Blender - Blender 3.3 Classroom CPU *
min: 310     avg: 328.3     median: 336 (4%)     max: 339 Seconds
Blender - Blender 2.79 BMW27 CPU *
min: 213.6     avg: 232.9     median: 232.9 (2%)     max: 252.1 Seconds
min: 178     avg: 188     median: 193 (1%)     max: 193 Seconds
R Benchmark 2.5 - R Benchmark 2.5 *
min: 0.4896     avg: 0.5     median: 0.5 (11%)     max: 0.4975 sec
min: 0.4512     avg: 0.5     median: 0.5 (10%)     max: 0.4891 sec
3DMark 06 - CPU - 3DMark 06 - CPU
min: 14162     avg: 14372     median: 14324 (30%)     max: 14631 Points
min: 13265     avg: 14596     median: 14596 (31%)     max: 15927 Points
Super Pi mod 1.5 XS 1M - Super Pi mod 1.5 XS 1M *
min: 7.685     avg: 7.8     median: 7.8 (2%)     max: 7.905 s
7.7 s (2%)
Super Pi mod 1.5 XS 2M - Super Pi mod 1.5 XS 2M *
min: 16.699     avg: 16.9     median: 16.9 (1%)     max: 17.15 s
17.1 s (1%)
Super Pi Mod 1.5 XS 32M - Super Pi mod 1.5 XS 32M *
min: 411.3     avg: 415.3     median: 415.3 (2%)     max: 419.234 s
408 s (2%)
3DMark Vantage - 3DM Vant. Perf. CPU no Physx
min: 68538     avg: 68808     median: 68807.5 (53%)     max: 69077 Points
78386 Points (60%)
3DMark 11 - 3DM11 Performance Physics
min: 14277     avg: 16199     median: 15947 (39%)     max: 18372 Points
min: 22848     avg: 23667     median: 23435 (58%)     max: 24719 Points
3DMark - 3DMark Ice Storm Physics
min: 86274     avg: 89153     median: 87786 (71%)     max: 93399 Points
101155 Points (82%)
3DMark - 3DMark Ice Storm Extreme Physics
min: 83584     avg: 88301     median: 87869 (71%)     max: 93449 Points
3DMark - 3DMark Ice Storm Unlimited Physics
min: 88825     avg: 92226     median: 90430 (73%)     max: 97422 Points
3DMark - 3DMark Cloud Gate Physics
min: 16256     avg: 18080     median: 18640 (47%)     max: 19345 Points
min: 20276     avg: 20751     median: 20750.5 (52%)     max: 21225 Points
3DMark - 3DMark Fire Strike Standard Physics
min: 25160     avg: 26172     median: 26056 (46%)     max: 27300 Points
min: 28766     avg: 30450     median: 30600 (55%)     max: 31983 Points
3DMark - 3DMark Time Spy CPU
min: 7087     avg: 8705     median: 9285 (39%)     max: 9743 Points
min: 12867     avg: 13931     median: 14159 (60%)     max: 14766 Points
Geekbench 6.5 - Geekbench 6.5 Single-Core
1948 Points (47%)
2478 Points (60%)
Geekbench 6.5 - Geekbench 6.5 Multi-Core
9407 Points (37%)
13404 Points (52%)
Geekbench 5.5 - Geekbench 5.1 - 5.5 64 Bit Single-Core
min: 1560     avg: 1579     median: 1579 (60%)     max: 1598 Points
min: 1688     avg: 1732     median: 1730 (66%)     max: 1779 Points
Geekbench 5.5 - Geekbench 5.1 - 5.5 64 Bit Multi-Core
min: 7818     avg: 8681     median: 8681 (16%)     max: 9544 Points
min: 12683     avg: 13344     median: 13581 (24%)     max: 13767 Points
Geekbench 5.0 - Geekbench 5.0 64 Bit Single-Core
min: 1518     avg: 1522     median: 1521.5 (7%)     max: 1525 Points
Geekbench 5.0 - Geekbench 5.0 64 Bit Multi-Core
min: 7806     avg: 8685     median: 8684.5 (27%)     max: 9563 Points
Geekbench 4.4 - Geekbench 4.1 - 4.4 64 Bit Single-Core
min: 6517     avg: 6630     median: 6630 (66%)     max: 6743 Points
Geekbench 4.4 - Geekbench 4.1 - 4.4 64 Bit Multi-Core
min: 31835     avg: 34403     median: 34402.5 (34%)     max: 36970 Points
Mozilla Kraken 1.1 - Kraken 1.1 Total Score *
min: 587     avg: 596     median: 595.5 (1%)     max: 604 ms
min: 521     avg: 539     median: 547 (1%)     max: 550 ms
Sunspider - Sunspider 1.0 Total Score *
110.6 ms (1%)
Octane V2 - Octane V2 Total Score
74010 Points (54%)
90065 Points (66%)
WebXPRT 4 - WebXPRT 4 Score
min: 240     avg: 246.7     median: 243 (67%)     max: 257 Points
WebXPRT 3 - WebXPRT 3 Score
min: 284     avg: 289.5     median: 289.5 (52%)     max: 295 Points
min: 255     avg: 280.7     median: 293 (53%)     max: 294 Points
CrossMark - CrossMark Overall
min: 1424     avg: 1450     median: 1449.5 (54%)     max: 1475 Points
min: 1701     avg: 1833     median: 1832.5 (69%)     max: 1964 Points
Power Consumption - Prime95 Power Consumption - external Monitor *
min: 88.3     avg: 106.7     median: 106.7 (18%)     max: 125 Watt
min: 128.6     avg: 132     median: 132 (23%)     max: 135.4 Watt
Power Consumption - Cinebench R15 Multi Power Consumption - external Monitor *
min: 76.1     avg: 104.6     median: 104.6 (19%)     max: 133 Watt
179.2 Watt (33%)
Power Consumption - Idle Power Consumption - external Monitor *
min: 9.64     avg: 27.6     median: 27.6 (18%)     max: 45.6 Watt
min: 16     avg: 17.4     median: 17.4 (12%)     max: 18.8 Watt
Power Consumption - Idle Power Consumption 150cd 1min *
13.4 Watt (16%)
Power Consumption - Power Efficiency - Cinebench R15 Multi external Monitor
min: 16.8     avg: 21.4     median: 21.4 (16%)     max: 26 Points per Watt

Average Benchmarks AMD Ryzen 7 5700G → 100% n=38

Average Benchmarks Intel Core i5-13500HX → 120% n=38

- Range of benchmark values for this graphics card
red legend - Average benchmark values for this graphics card
* Smaller numbers mean a higher performance
1 This benchmark is not used for the average calculation

Add one or more devices and compare

In the following list you can select (and also search for) devices that should be added to the comparison. You can select more than one device.

restrict list:
v1.34
log 14. 17:02:52

#0 ran 0s before starting gpusingle class +0s ... 0s

#1 checking url part for id 14050 +0s ... 0s

#2 checking url part for id 14667 +0s ... 0s

#3 redirected to Ajax server, took 1760454172s time from redirect:0 +0s ... 0s

#4 did not recreate cache, as it is less than 5 days old! Created at Mon, 13 Oct 2025 05:18:33 +0200 +0s ... 0s

#5 composed specs +0.006s ... 0.006s

#6 did output specs +0s ... 0.006s

#7 getting avg benchmarks for device 14050 +0.002s ... 0.008s

#8 got single benchmarks 14050 +0.001s ... 0.01s

#9 getting avg benchmarks for device 14667 +0.004s ... 0.014s

#10 got single benchmarks 14667 +0.008s ... 0.022s

#11 got avg benchmarks for devices +0s ... 0.022s

#12 min, max, avg, median took s +0.033s ... 0.055s

#13 return log +0.001s ... 0.057s

Please share our article, every link counts!
Mail Logo
> Expert Reviews and News on Laptops, Smartphones and Tech Innovations > Benchmarks / Tech > Processor Comparison - Head 2 Head
Redaktion, 2017-09- 8 (Update: 2023-07- 1)