Notebookcheck Logo

AMD Ryzen 5 2500U vs AMD Ryzen 5 7520U

AMD Ryzen 5 2500U

► remove from comparison AMD R5 2500U

The AMD Ryzen 5 2500U is a mobile APU for thin and light laptops that was announced in October 2017. It includes four Zen cores clocked at 2 to 3.6 GHz and offers 4 MB L3-Cache. The integrated graphics card is called Radeon RX Vega 8 and offers 8 CUs (512 Shaders) clocked at up to 1100 MHz. The TDP is configurable between 12 and 25 Watt (15 Watt nominal). More information on Raven Ridge can be found in our launch article.

AMD Ryzen 5 7520U

► remove from comparison AMD R5 7520U

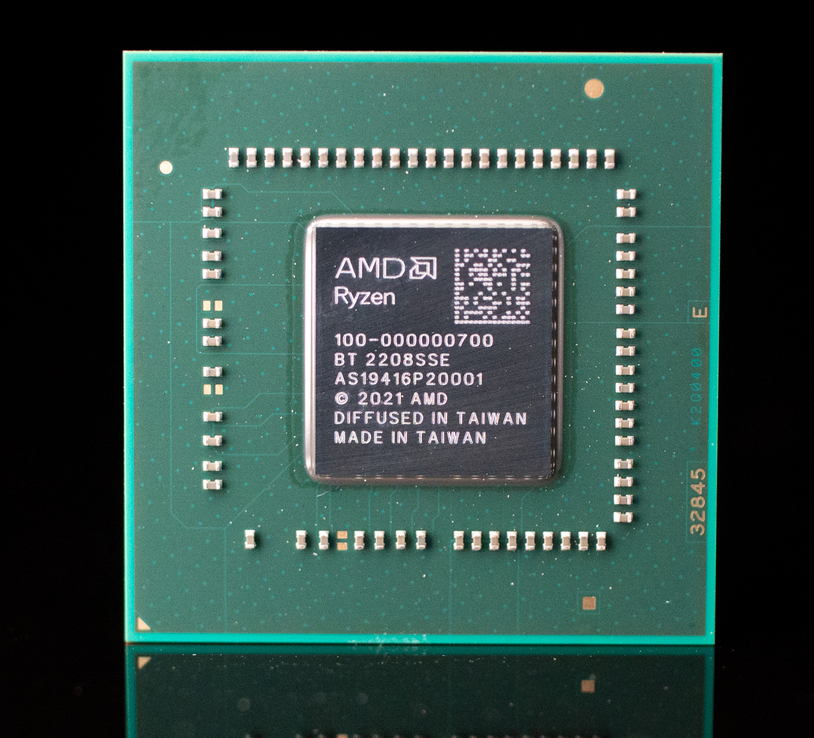
The AMD Ryzen 5 7520U is a mobile processor for cheap laptops of the Mendocino series. It integrates four older Zen 2 cores (similar to the Ryzen 4000 series like the Ryzen 3 4300U). The CPU cores clock from 2.8 GHz (base) to 4.3 GHz (single core Turbo) and can use 4 MB L3 cache. Thanks to SMT/Hyperthreading, the CPU can work on 8 threads simultaneously. The integrated memory controller only supports fast LPDDR5 memory (5500 MHz max.).

The integrated graphics adapter (Radeon 610M iGPU) uses the modern RDNA 2 architecture, but only 2 CUs (128 shaders) and clocks with up to 1.9 GHz.

Performance

The average 7520U in our extensive database is in the same league as the Core i7-1185G7, as far as multi-thread benchmark scores are concerned. This is a so-so result and indicative of a lower mid-range chip, as of Q3 2023.

Your mileage may vary depending on how high the CPU power limits are and how competent the cooling solution of your system is.

Mendocino series chips are produced on a relatively modern 6nm FinFET process at TSMC and should offer a good power efficiency. The R5 7520U is rated at 8-15 W TDP and therefore well suited for thin and light laptops.

ModelAMD Ryzen 5 2500UAMD Ryzen 5 7520U
CodenameZenMendocino-U (Zen 2)
SeriesAMD Raven Ridge (Ryzen 2000 APU)AMD Mendocino (Zen 2, Ryzen 7020)
Series: Mendocino (Zen 2, Ryzen 7020) Mendocino-U (Zen 2)
AMD Ryzen 5 2400G compare3.6 - 3.9 GHz4 / 8 cores4 MB L3
AMD Ryzen 7 2700U compare2.2 - 3.8 GHz4 / 8 cores4 MB L3
AMD Ryzen 7 PRO 2700U compare2.2 - 3.8 GHz4 / 8 cores4 MB L3
AMD Ryzen 3 2200G compare3.5 - 3.7 GHz4 / 4 cores4 MB L3
AMD Ryzen 5 2600H compare3.2 - 3.6 GHz4 / 8 cores4 MB L3
AMD Ryzen 5 2500U « 2 - 3.6 GHz4 / 8 cores4 MB L3
AMD Ryzen 5 PRO 2500U compare2 - 3.6 GHz4 / 8 cores4 MB L3
AMD Ryzen Embedded V1605B compare2 - 3.6 GHz4 / 8 cores4 MB L3
AMD Ryzen 3 2300U compare2 - 3.4 GHz4 / 4 cores4 MB L3
AMD Ryzen 3 PRO 2300U compare2 - 3.4 GHz4 / 4 cores4 MB L3
AMD Ryzen Embedded R1606G compare2.6 - 3.5 GHz2 / 4 cores4 MB L3
AMD Ryzen 3 2200U compare2.5 - 3.4 GHz2 / 4 cores4 MB L3
AMD Ryzen 3 PRO 2200U compare2.5 - 3.4 GHz2 / 4 cores4 MB L3
AMD Ryzen Embedded R1505G compare2.4 - 3.3 GHz2 / 4 cores4 MB L3
AMD Athlon 300U compare2.4 - 3.3 GHz2 / 4 cores4 MB L3
AMD Ryzen 5 7520U « 2.8 - 4.3 GHz4 / 8 cores4 MB L3
AMD Ryzen 3 7320U compare2.4 - 4.1 GHz4 / 8 cores4 MB L3
Clock2000 - 3600 MHz2800 - 4300 MHz
L1 Cache384 KB256 KB
L2 Cache2 MB2 MB
L3 Cache4 MB4 MB
Cores / Threads4 / 84 / 8
TDP15 Watt15 Watt
Transistors4500 Million
Technology14 nm6 nm
SocketAM4
FeaturesXFR, FMA3, SSE 4.2, AVX2, SMTLPDDR5-5500 RAM, PCIe 3, MMX (+), SSE, SSE2, SSE3, SSSE3, SSE4.1, SSE4.2, SSE4A, AES, AVX, AVX2, FMA3, SHA
iGPUAMD Radeon RX Vega 8 (Ryzen 2000/3000) ( - 1100 MHz)AMD Radeon 610M ( - 1900 MHz)
Architecturex86x86
Announced
Manufacturerwww.amd.com

Benchmarks

Performance Rating - CB R15 + R20 + 7-Zip + X265 + Blender + 3DM11 CPU - R5 2500U
24.4 pt (41%)
Restrict / Search: Model: Max. age: years
Performance Rating - CB R15 + R20 + 7-Zip + X265 + Blender + 3DM11 CPU - R5 7520U
26.7 pt (44%)
Restrict / Search: Model: Max. age: years
Cinebench R23 - Cinebench R23 Multi Core
5149 Points (5%)
Cinebench R23 - Cinebench R23 Single Core
1171 Points (49%)
Cinebench R20 - Cinebench R20 CPU (Single Core)
min: 338     avg: 351     median: 354.5 (39%)     max: 357 Points
min: 250     avg: 350.5     median: 350.5 (38%)     max: 451 Points
Cinebench R20 - Cinebench R20 CPU (Multi Core)
min: 1103     avg: 1267     median: 1298.5 (3%)     max: 1367 Points
min: 1281     avg: 1633     median: 1632.5 (4%)     max: 1984 Points
Cinebench R15 - Cinebench R15 CPU Multi 64 Bit
min: 510     avg: 598     median: 609 (4%)     max: 642 Points
834 Points (5%)
Cinebench R15 - Cinebench R15 CPU Single 64 Bit
min: 124     avg: 136.2     median: 137 (38%)     max: 142 Points
168.8 Points (47%)
Cinebench R11.5 - Cinebench R11.5 CPU Multi 64 Bit
min: 5.71     avg: 6.5     median: 6.6 (9%)     max: 6.91 Points
Cinebench R11.5 - Cinebench R11.5 CPU Single 64 Bit
min: 1.53     avg: 1.6     median: 1.6 (38%)     max: 1.61 Points
Cinebench R10 - Cinebench R10 Rend. Single (32bit)
min: 4103     avg: 4371     median: 4410.5 (27%)     max: 4473 Points
Cinebench R10 - Cinebench R10 Rend. Multi (32bit)
min: 13850     avg: 15426     median: 15683.5 (11%)     max: 16471 Points
wPrime 2.10 - wPrime 2.0 1024m *
min: 251.1     avg: 313.5     median: 313.5 (4%)     max: 375.9 s
wPrime 2.10 - wPrime 2.0 32m *
min: 7.819     avg: 10.2     median: 10.2 (2%)     max: 12.64 s
WinRAR - WinRAR 4.0
min: 2416     avg: 2426     median: 2425.5 (4%)     max: 2435 Points
7-Zip 18.03 - 7-Zip 18.03 Multi Thread 4 runs
min: 15360     avg: 16200     median: 16251 (9%)     max: 16988 MIPS
24219 MIPS (14%)
7-Zip 18.03 - 7-Zip 18.03 Single Thread 4 runs
min: 2924     avg: 3269     median: 3441 (41%)     max: 3443 MIPS
4167 MIPS (49%)
X264 HD Benchmark 4.0 - x264 Pass 2
min: 33     avg: 34.7     median: 34.7 (12%)     max: 36.4 fps
X264 HD Benchmark 4.0 - x264 Pass 1
min: 118     avg: 121     median: 121 (28%)     max: 124 fps
HWBOT x265 Benchmark v2.2 - HWBOT x265 4k Preset
min: 3.6     avg: 3.7     median: 3.7 (6%)     max: 3.74 fps
6.3 fps (11%)
TrueCrypt - TrueCrypt Serpent
min: 0.357     avg: 0.4     median: 0.4 (11%)     max: 0.403 GB/s
TrueCrypt - TrueCrypt Twofish
min: 0.543     avg: 0.6     median: 0.6 (10%)     max: 0.568 GB/s
TrueCrypt - TrueCrypt AES
min: 3.2     avg: 3.3     median: 3.3 (9%)     max: 3.4 GB/s
Blender - Blender 3.3 Classroom CPU *
1044 Seconds (13%)
Blender - Blender 2.79 BMW27 CPU *
min: 757     avg: 771     median: 770.5 (5%)     max: 784 Seconds
588 Seconds (4%)
R Benchmark 2.5 - R Benchmark 2.5 *
0.6 sec (14%)
3DMark 06 - CPU - 3DMark 06 - CPU
min: 4155     avg: 4952     median: 4828 (10%)     max: 5873 Points
Super Pi mod 1.5 XS 1M - Super Pi mod 1.5 XS 1M *
min: 11.77     avg: 17.7     median: 12.3 (3%)     max: 29 s
Super Pi mod 1.5 XS 2M - Super Pi mod 1.5 XS 2M *
min: 26.95     avg: 27.4     median: 27.3 (1%)     max: 28 s
Super Pi Mod 1.5 XS 32M - Super Pi mod 1.5 XS 32M *
min: 685     avg: 696     median: 697 (3%)     max: 706 s
3DMark Vantage - 3DM Vant. Perf. CPU no Physx
min: 14732     avg: 17114     median: 15610 (12%)     max: 21001 Points
3DMark 11 - 3DM11 Performance Physics
min: 3941     avg: 5637     median: 5973 (15%)     max: 6648 Points
7743 Points (19%)
3DMark - 3DMark Ice Storm Physics
min: 31155     avg: 32374     median: 31862 (26%)     max: 34052 Points
58709 Points (48%)
3DMark - 3DMark Ice Storm Extreme Physics
min: 29317     avg: 32015     median: 32593.5 (26%)     max: 33556 Points
58852 Points (48%)
3DMark - 3DMark Ice Storm Unlimited Physics
min: 28284     avg: 32266     median: 32009.5 (26%)     max: 37624 Points
3DMark - 3DMark Cloud Gate Physics
min: 1579     avg: 4508     median: 4609.5 (12%)     max: 6591 Points
5521 Points (14%)
3DMark - 3DMark Fire Strike Standard Physics
min: 4922     avg: 7508     median: 7807 (14%)     max: 9138 Points
11558 Points (21%)
3DMark - 3DMark Time Spy CPU
min: 2166     avg: 2523     median: 2566 (11%)     max: 2821 Points
3442 Points (15%)
Geekbench 6.4 - Geekbench 6.4 Single-Core
1374 Points (34%)
Geekbench 6.4 - Geekbench 6.4 Multi-Core
4434 Points (17%)
Geekbench 6.0 - Geekbench 6.0 Single-Core
1338 Points (42%)
Geekbench 6.0 - Geekbench 6.0 Multi-Core
4253 Points (17%)
Geekbench 5.5 - Geekbench 5.1 - 5.5 64 Bit Single-Core
831 Points (32%)
1066 Points (42%)
Geekbench 5.5 - Geekbench 5.1 - 5.5 64 Bit Multi-Core
2515 Points (5%)
3821 Points (7%)
Geekbench 4.4 - Geekbench 4.1 - 4.4 64 Bit Single-Core
min: 3275     avg: 3641     median: 3703 (37%)     max: 3789 Points
Geekbench 4.4 - Geekbench 4.1 - 4.4 64 Bit Multi-Core
min: 9434     avg: 10029     median: 9952 (10%)     max: 10871 Points
Geekbench 4.0 - Geekbench 4.0 64 Bit Single-Core
min: 3558     avg: 3582     median: 3581.5 (40%)     max: 3605 Points
Geekbench 4.0 - Geekbench 4.0 64 Bit Multi-Core
min: 9480     avg: 9548     median: 9548 (13%)     max: 9616 Points
Geekbench 3 - Geekbench 3 32 Bit Multi-Core
min: 10506     avg: 11390     median: 11301 (20%)     max: 12280 Points
Geekbench 3 - Geekbench 3 32 Bit Single-Core
min: 3234     avg: 3379     median: 3383 (44%)     max: 3477 Points
Geekbench 3 - Geekbench 3 64 Bit Multi-Core
min: 11649     avg: 11774     median: 11773.5 (18%)     max: 11898 Points
Geekbench 3 - Geekbench 3 64 Bit Single-Core
min: 3601     avg: 3674     median: 3673.5 (55%)     max: 3746 Points
Geekbench 2 - 32 Bit - Geekbench Stream
7330 Points (39%)
Geekbench 2 - 32 Bit - Geekbench Memory
6320 Points (44%)
Geekbench 2 - 32 Bit - Geekbench Floating Point
13912 Points (27%)
Geekbench 2 - 32 Bit - Geekbench Integer
10715 Points (22%)
Geekbench 2 - 32 Bit - Geekbench Total Score
10616 Points (28%)
Mozilla Kraken 1.1 - Kraken 1.1 Total Score *
min: 1138     avg: 1349     median: 1411 (2%)     max: 1443 ms
849 ms (1%)
Sunspider - Sunspider 1.0 Total Score *
min: 110.2     avg: 122     median: 117 (1%)     max: 143.7 ms
Octane V2 - Octane V2 Total Score
min: 21539     avg: 25871     median: 26534.5 (19%)     max: 29587 Points
WebXPRT 4 - WebXPRT 4 Score
155.3 Points (43%)
WebXPRT 3 - WebXPRT 3 Score
160 Points (29%)
191.3 Points (34%)
CrossMark - CrossMark Overall
960 Points (36%)
Power Consumption - Prime95 Power Consumption - external Monitor *
32.6 Watt (6%)
35.5 Watt (6%)
Power Consumption - Cinebench R15 Multi Power Consumption - external Monitor *
39.4 Watt (7%)
37 Watt (7%)
Power Consumption - Idle Power Consumption - external Monitor *
3.8 Watt (2%)
Power Consumption - Power Efficiency - Cinebench R15 Multi external Monitor
15.5 Points per Watt (12%)
22.5 Points per Watt (17%)

Average Benchmarks AMD Ryzen 5 2500U → 100% n=18

Average Benchmarks AMD Ryzen 5 7520U → 140% n=18

- Range of benchmark values for this graphics card
red legend - Average benchmark values for this graphics card
* Smaller numbers mean a higher performance
1 This benchmark is not used for the average calculation

Add one or more devices and compare

In the following list you can select (and also search for) devices that should be added to the comparison. You can select more than one device.

restrict list:
v1.33
log 13. 17:53:09

#0 ran 0s before starting gpusingle class +0s ... 0s

#1 checking url part for id 9310 +0s ... 0s

#2 checking url part for id 14609 +0s ... 0s

#3 redirected to Ajax server, took 1755100389s time from redirect:0 +0s ... 0s

#4 did not recreate cache, as it is less than 5 days old! Created at Wed, 13 Aug 2025 05:18:40 +0200 +0s ... 0s

#5 composed specs +0.004s ... 0.005s

#6 did output specs +0s ... 0.005s

#7 getting avg benchmarks for device 9310 +0.004s ... 0.009s

#8 got single benchmarks 9310 +0.01s ... 0.019s

#9 getting avg benchmarks for device 14609 +0.004s ... 0.022s

#10 got single benchmarks 14609 +0.006s ... 0.028s

#11 got avg benchmarks for devices +0s ... 0.028s

#12 min, max, avg, median took s +0.029s ... 0.057s

#13 return log +0.001s ... 0.058s

Please share our article, every link counts!
Mail Logo
> Expert Reviews and News on Laptops, Smartphones and Tech Innovations > Benchmarks / Tech > Processor Comparison - Head 2 Head
Redaktion, 2017-09- 8 (Update: 2023-07- 1)