

AMD Ryzen 3 3100 vs Intel Core i7-6700T vs AMD Ryzen 7 3700X
AMD Ryzen 3 3100
► remove from comparison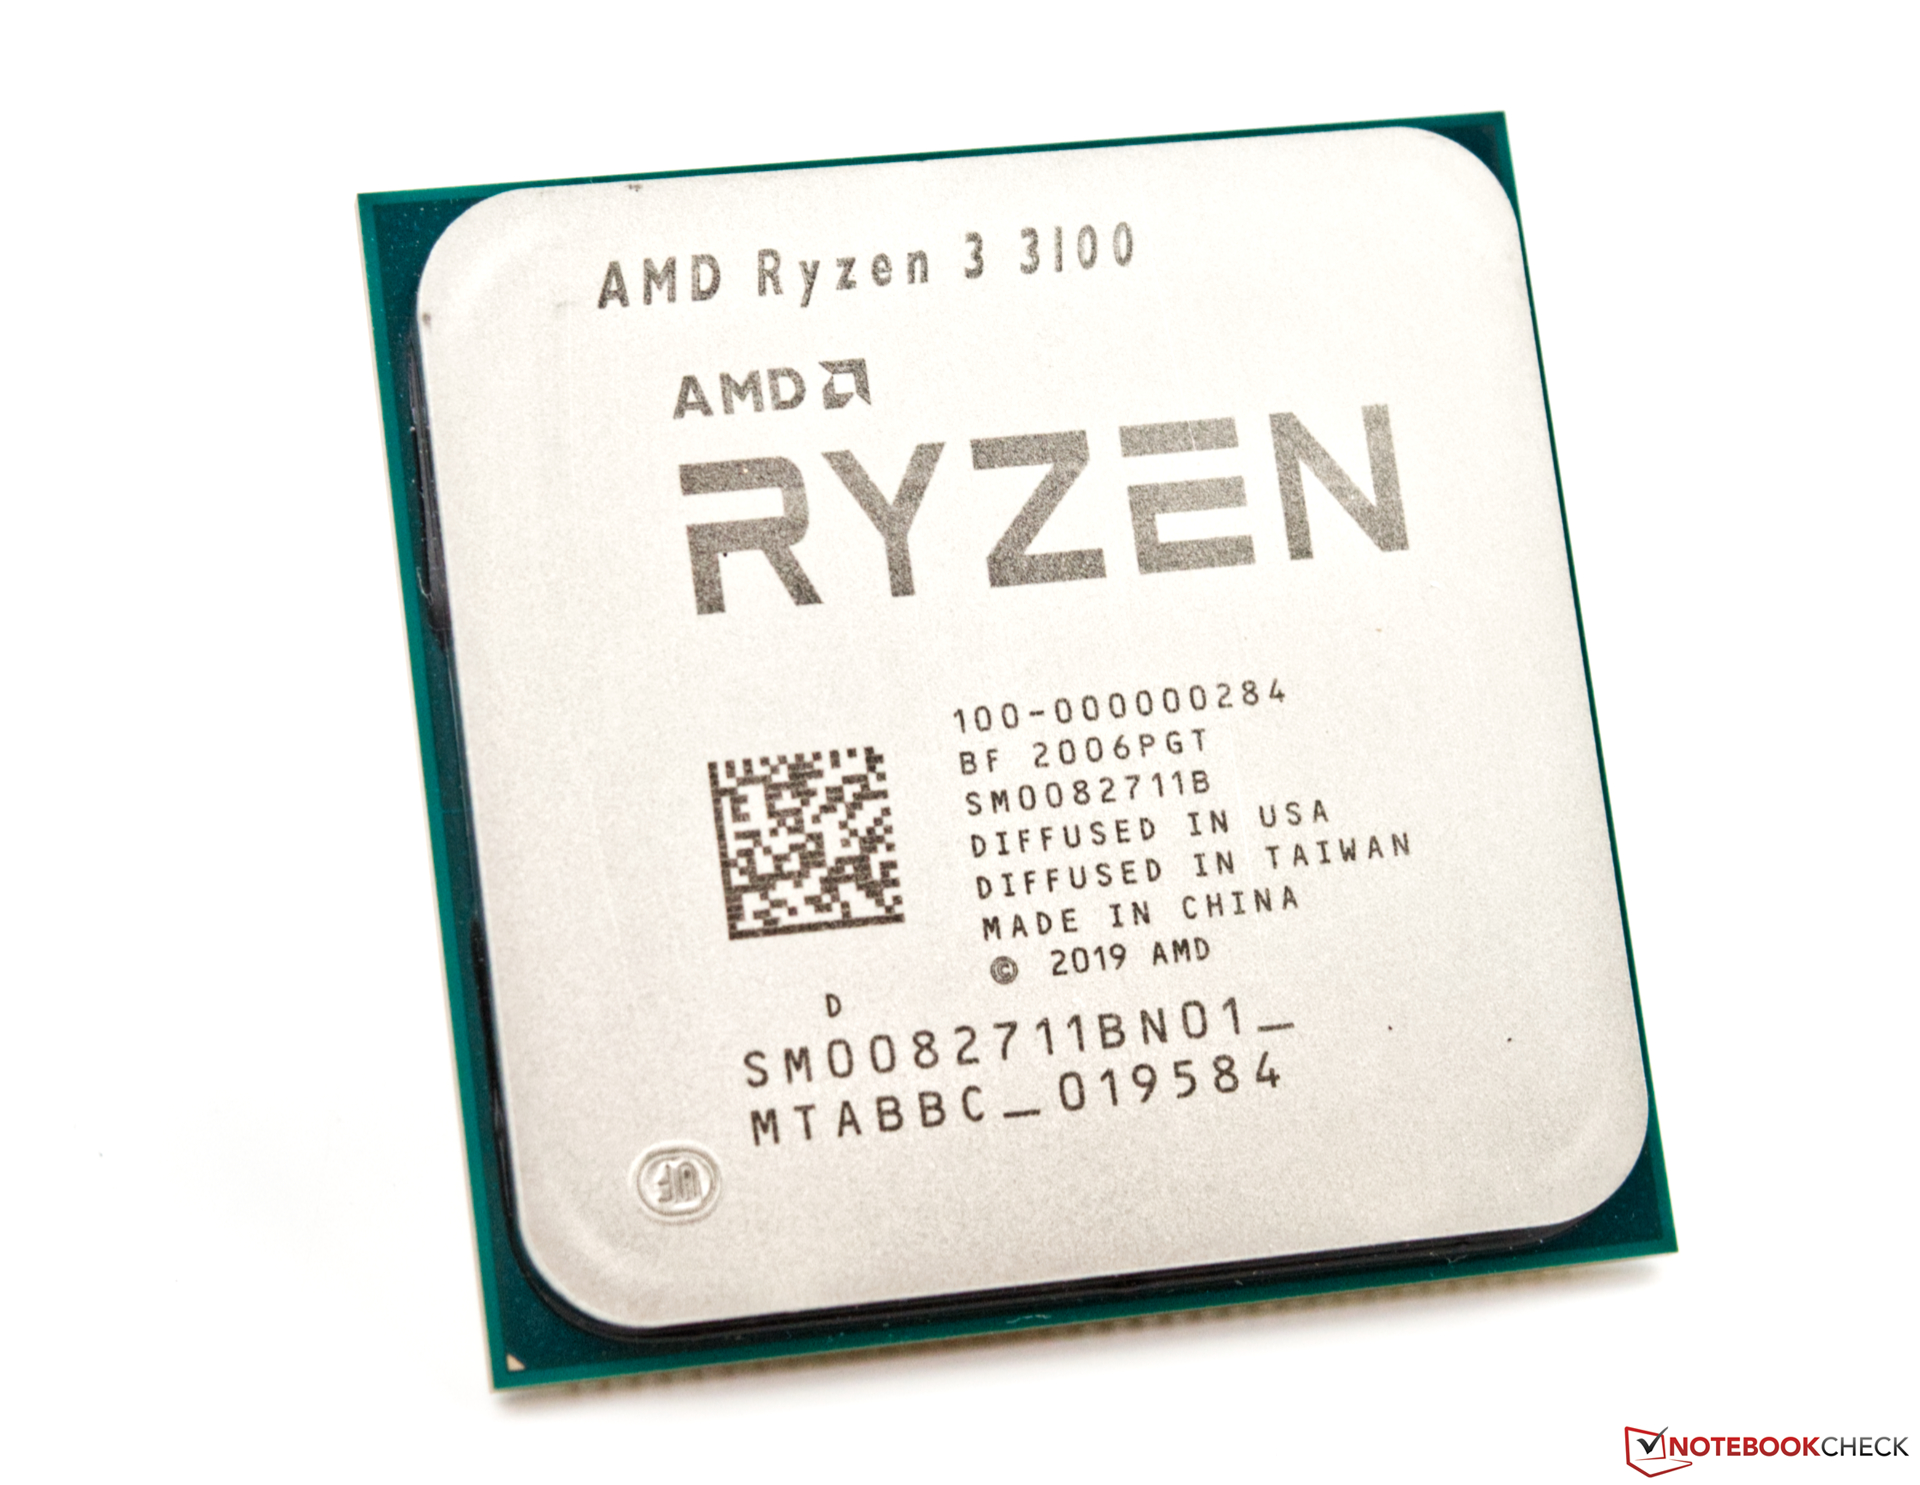
The Ryzen 3 3100 is a cheap entry level desktop processor of the Matisse series with 4 cores and 8 threads. It clocks from 3.6 (base) - 3.9 GHz (boost) and uses the Zen 2 microarchitecture. It uses two CCX clusters with two cores each. Therefore, there are some disadvantages compared to the faster Ryzen 3 3300X that uses all four cores of a single CCX-cluster. The CPU is manufactured on the modern 7 nm process at TSMC. The I/O die that is not part of the main die is manufactured on 12 nm at Globalfoundries. The TDP is 65 Watts and therefore the CPU won't need a big beefy cooler.
In multi-threaded applications the performance of the Ryzen 3 3100 can reach the old Core i7-7700K (a former high end CPU). In games and single threaded applications, the performance is slightly lower as the higher clocked Ryzen 3 3300X is on par with the 7700K. Still, the 3100 can be a good pick for an entry level gaming system.
Intel Core i7-6700T
► remove from comparison
The Intel Core i7-6700T is a quad-core processor based on the Skylake architecture, that has been launched in September 2015. It is generally intended for desktops but due to the relatively low TDP of 35 Watt is is also used in some laptops. In addition to four CPU cores with Hyper-Threading clocked at 2.8 - 3.6 GHz, the chip also integrates an HD Graphics 530 GPU and a dual-channel DDR4-2133/DDR3L-1600 memory controller. The CPU is manufactured using a 14 nm process with FinFET transistors.
Architecture
Skylake replaces both Haswell and Broadwell and brings the same microarchitecture in every TDP class from 4.5 to 45 W. The extensive improvements of the Skylake design include increased out-of-order buffers, optimized prefetching and branch prediction as well as additional performance gains through Hyper-Threading. Overall, however, performance per clock has been increased by only 5 to 10 percent (compared to Haswell) respectively under 5 percent (compard to Broadwell), which is quite modest for a new architecture ("Tock").
Performance
According to the specified clock rates and the improved architecture, the Core i7-6700T performs roughly on par with the former, somewhat higher clocked Intel Core i7-3770K (Ivy Bridge). Therefore, the CPU is also well suited for demanding applications.
Graphics
The integrated graphics unit called HD Graphics 530 represents the "GT2" version of the Skylake GPU (Intel Gen. 9). The 24 Execution Units, also called EUs, are clocked at 350 - 1100 MHz and offer a performance about 20 percent above the old HD Graphics 4600. Games of 2015 can thus be played smoothly in low or medium settings. For more information about performance and features, check our page for HD Graphics 530.
Power Consumption
Specified at a TDP of 35 W (including CPU, GPU and memory controller), the CPU is best suited for bigger notebooks 15-inches in size and above or small desktops.
AMD Ryzen 7 3700X
► remove from comparison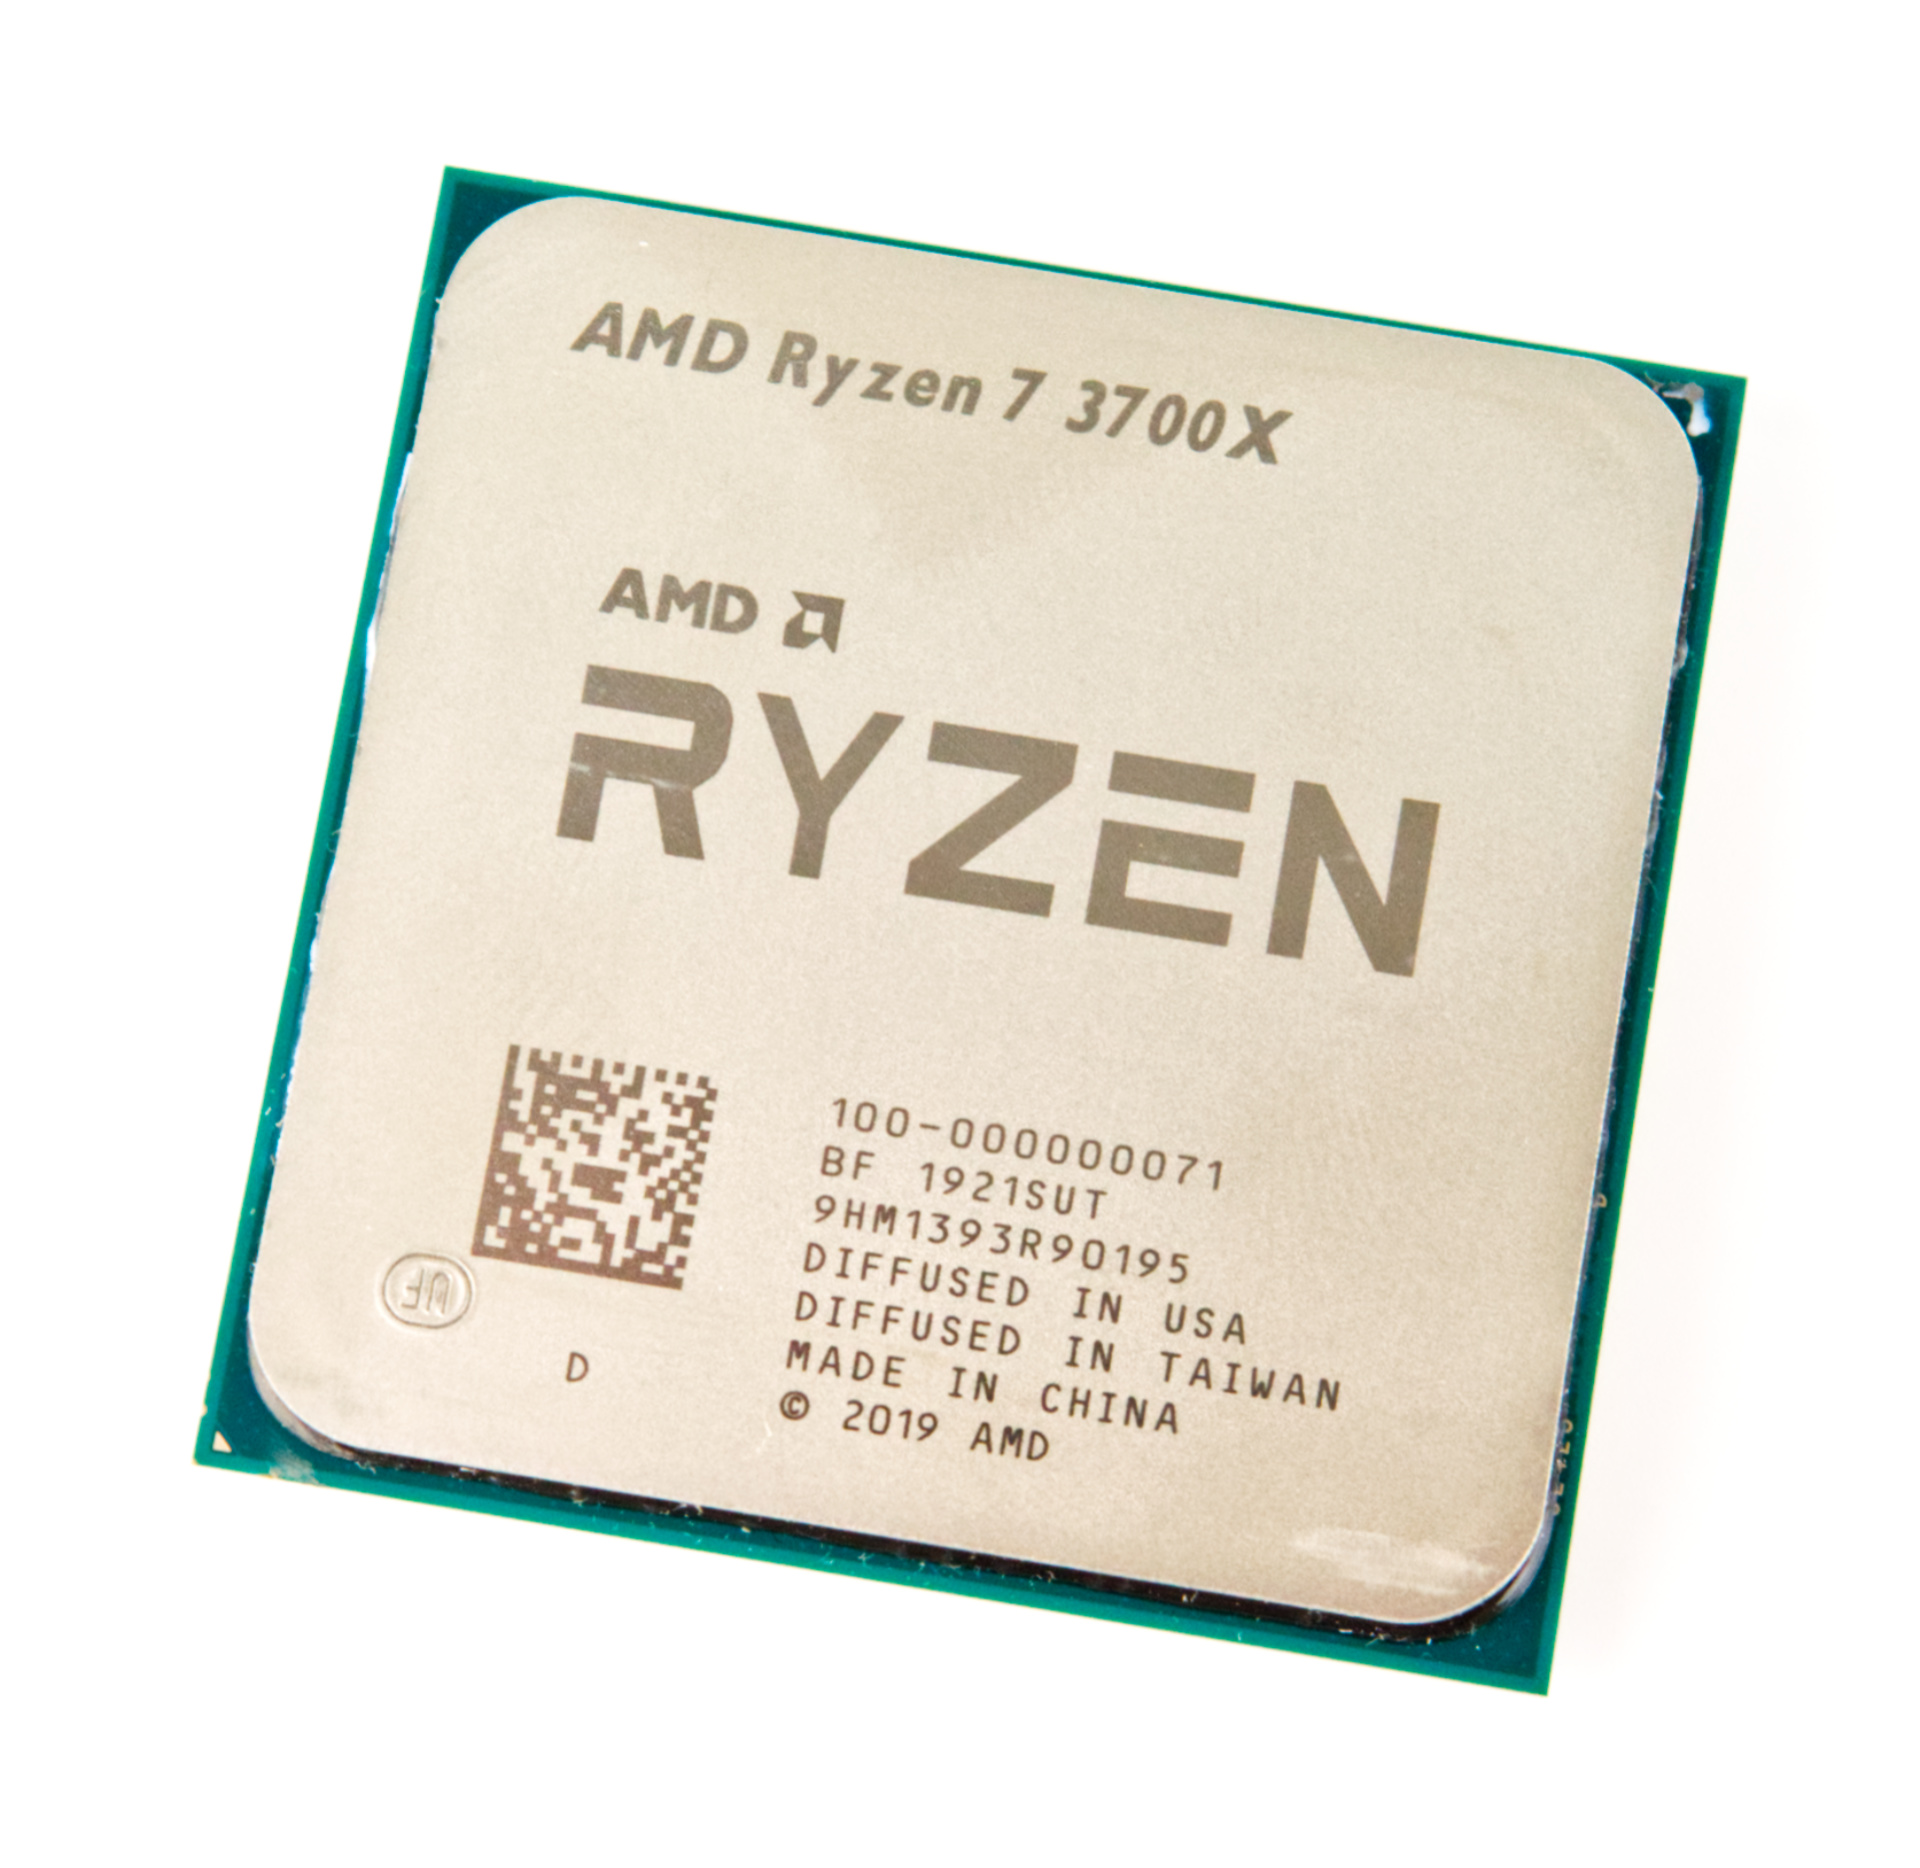
Der AMD Ryzen 7 3700X ist ein Desktop-Prozessor mit 8-Kernen und Hyperthreading (SMT), weshalb dieser 16 Threads gleichzeitig verarbeiten kann. Mit dem Launch am 07.07.2019 ist er nach dem Ryzen 7 3800X der zweitschnellste Ryzen 7 Prozessor und mit 65 Watt TDP deutlich sparsamer als das schnellste Ryzen 7 Modell.
Der Ryzen 7 3700X taktet mit 3,6 GHz Basistakt und kann per Turbo auf bis zu 4,4 GHz takten. Bei Last aller 8 Kerne erreicht der Ryzen 7 3700X maximal 4,1 GHz. Dank des Precision Boost 2 kann der Takt auf einem höheren Level gehalten werden, wie wir es schon von Zen+ her kennen.
Die Leistung des AMD Ryzen 7 3700X ist durchweg bei allen Anwendungen hervorragend. Vor allem bei Multi-Thread-Anwendungen kann hier der native 8-Kerner seine Stärken ausspielen und trotz der geringen TDP ist der Intel Core i9-9900K in Reichweite. Die beiden CCX-Cluster bestehend aus jeweils 4 CPU-Kernen befinden sich in einem CCD (je 4 Kerne mit eigenem 16 MByte L3 Cache). Dieser ist genau 74 mm² groß und wird im neuen 7 nm Verfahren bei TSMC gefertigt. Der I/O-Die ist separiert und kommt im mit der älteren 12 nm Strukturbreite daher, welcher weiterhin von Gobalfoundries gefertigt.
Bei Spielen kann der AMD Ryzen 7 3700X dank der verbesserten IPC überzeugen. In Spielen erreicht der Ryzen 7 3700X etwa die Leistung eines Intel Core i7-8700K. Geschlagen geben muss sich der Ryzen momentan allerdings trotzdem, denn in den meisten Spielen bietet der Coffee-Lake-Prozessor etwas mehr Leistung. Zukünftige Unterstützung von mehr Kernen können das Blatt schnell wenden.
| Model | AMD Ryzen 3 3100 | Intel Core i7-6700T | AMD Ryzen 7 3700X | ||||||||||||||||||||||||||||||||||||||||||||||||||||||||||||||||||||
| Codename | Matisse (Zen 2) | Skylake | Matisse (Zen 2) | ||||||||||||||||||||||||||||||||||||||||||||||||||||||||||||||||||||
| Series | AMD Matisse (Ryzen 3000 Desktop) | Intel Core i7 (Desktop) | AMD Matisse (Ryzen 3000 Desktop) | ||||||||||||||||||||||||||||||||||||||||||||||||||||||||||||||||||||
| Series: Matisse (Ryzen 3000 Desktop) Matisse (Zen 2) |
|
|
| ||||||||||||||||||||||||||||||||||||||||||||||||||||||||||||||||||||
| Clock | 3600 - 3900 MHz | 2800 - 3600 MHz | 3600 - 4400 MHz | ||||||||||||||||||||||||||||||||||||||||||||||||||||||||||||||||||||
| L1 Cache | 256 KB | 256 KB | 512 KB | ||||||||||||||||||||||||||||||||||||||||||||||||||||||||||||||||||||
| L2 Cache | 2 MB | 1 MB | 4 MB | ||||||||||||||||||||||||||||||||||||||||||||||||||||||||||||||||||||
| L3 Cache | 16 MB | 6 MB | 32 MB | ||||||||||||||||||||||||||||||||||||||||||||||||||||||||||||||||||||
| Cores / Threads | 4 / 8 | 4 / 8 | 8 / 16 | ||||||||||||||||||||||||||||||||||||||||||||||||||||||||||||||||||||
| TDP | 65 Watt | 35 Watt | 65 Watt | ||||||||||||||||||||||||||||||||||||||||||||||||||||||||||||||||||||
| Technology | 7 nm | 14 nm | 7 nm | ||||||||||||||||||||||||||||||||||||||||||||||||||||||||||||||||||||
| Socket | AM4 (LGA1331) | FCLGA1151 | AM4 (LGA1331) | ||||||||||||||||||||||||||||||||||||||||||||||||||||||||||||||||||||
| Features | DDR4-3200 RAM, PCIe 4, MMX, SSE, SSE2, SSE3, SSSE3, SSE4A, SSE4.1, SSE4.2, AVX, AVX2, BMI2, ABM, FMA, ADX, SMEP, SMAP, SMT, CPB, AES-NI, RDRAND, RDSEED, SHA, SME | Dual-Channel DDR3L-1600/DDR4-2133 Memory Controller, AVX, AVX2, Quick Sync, Virtualization, AES-NI | DDR4-3200 RAM, PCIe 4, MMX, SSE, SSE2, SSE3, SSSE3, SSE4A, SSE4.1, SSE4.2, AVX, AVX2, BMI2, ABM, FMA, ADX, SMEP, SMAP, SMT, CPB, AES-NI, RDRAND, RDSEED, SHA, SME | ||||||||||||||||||||||||||||||||||||||||||||||||||||||||||||||||||||
| Architecture | x86 | x86 | x86 | ||||||||||||||||||||||||||||||||||||||||||||||||||||||||||||||||||||
| $99 U.S. | $303 U.S. | $329 U.S. | |||||||||||||||||||||||||||||||||||||||||||||||||||||||||||||||||||||
| Announced | |||||||||||||||||||||||||||||||||||||||||||||||||||||||||||||||||||||||
| Manufacturer | www.amd.com | ark.intel.com | www.amd.com | ||||||||||||||||||||||||||||||||||||||||||||||||||||||||||||||||||||
| Die Size | 122 mm2 | ||||||||||||||||||||||||||||||||||||||||||||||||||||||||||||||||||||||
| max. Temp. | 66 °C | 95 °C | |||||||||||||||||||||||||||||||||||||||||||||||||||||||||||||||||||||
| iGPU | Intel HD Graphics 530 (350 - 1100 MHz) |

Benchmarks

Average Benchmarks AMD Ryzen 3 3100 → 100% n=20
Average Benchmarks Intel Core i7-6700T → 81% n=20
Average Benchmarks AMD Ryzen 7 3700X → 163% n=20
* Smaller numbers mean a higher performance
1 This benchmark is not used for the average calculation