YMTC PC005 256GB vs SK hynix PC801 HFS512GEJ9X115N
YMTC PC005 256GB
► remove from comparison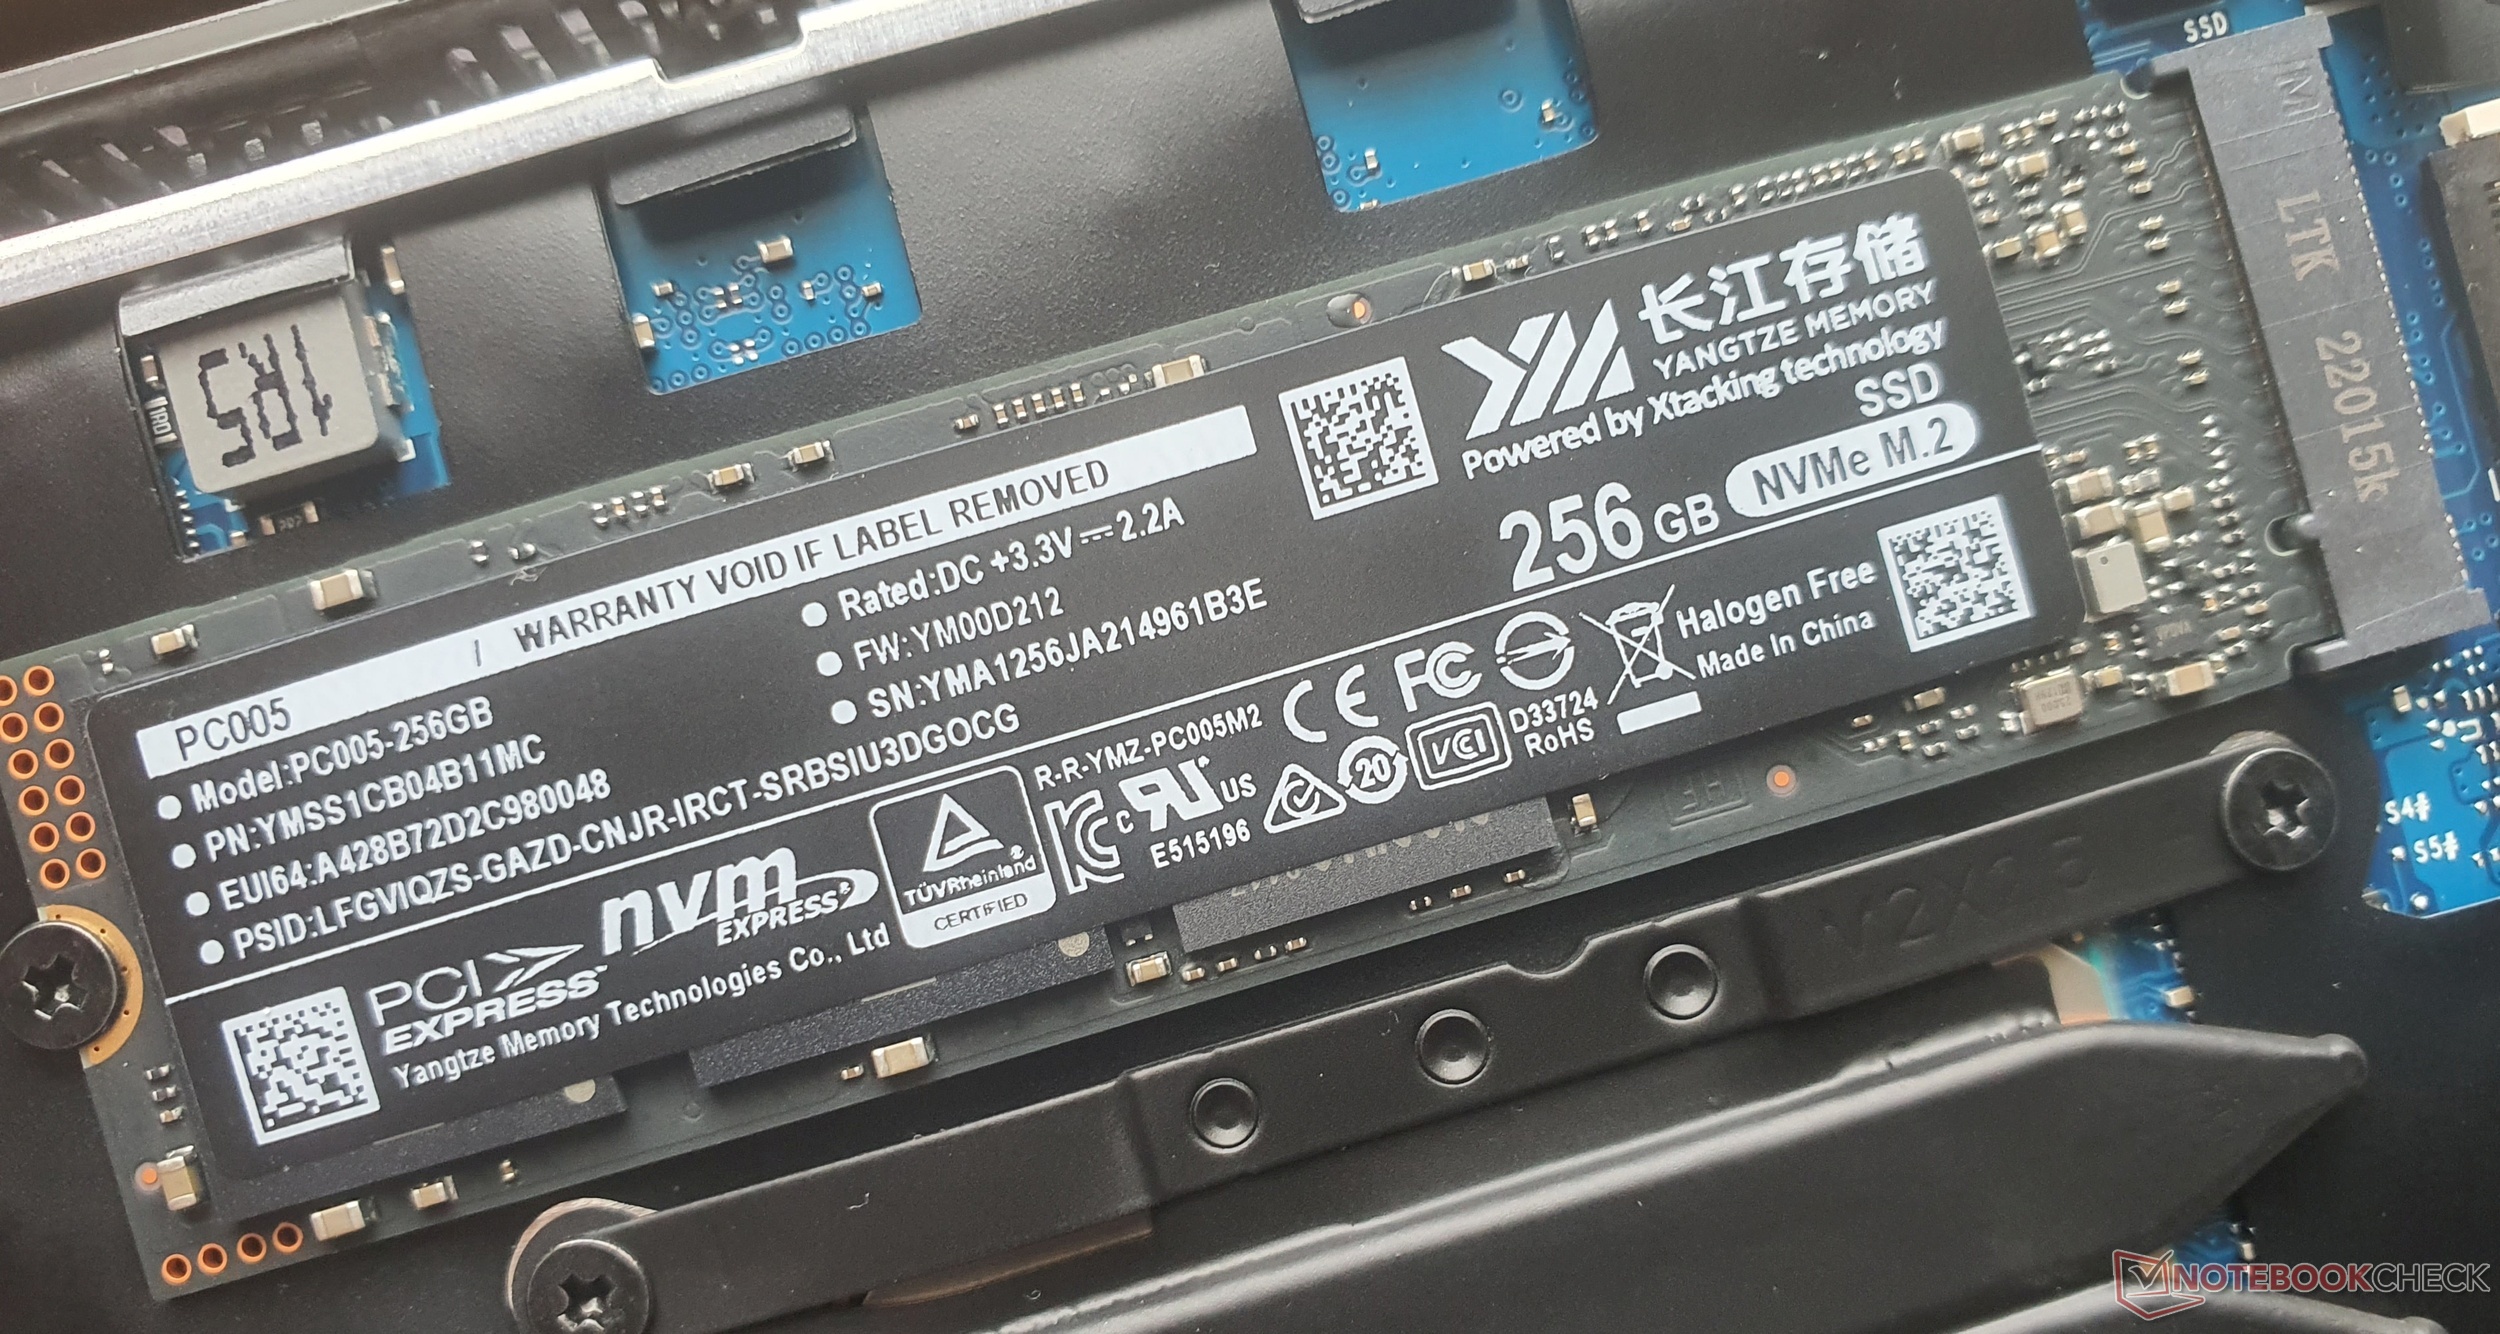
The YMTC PC005 256 GB (PC005-256GB, YMSS1CB04B11MC) is an entry level NVMe M.2 2280 SSD by Yangtze Memory.
SK hynix PC801 HFS512GEJ9X115N
► remove from comparison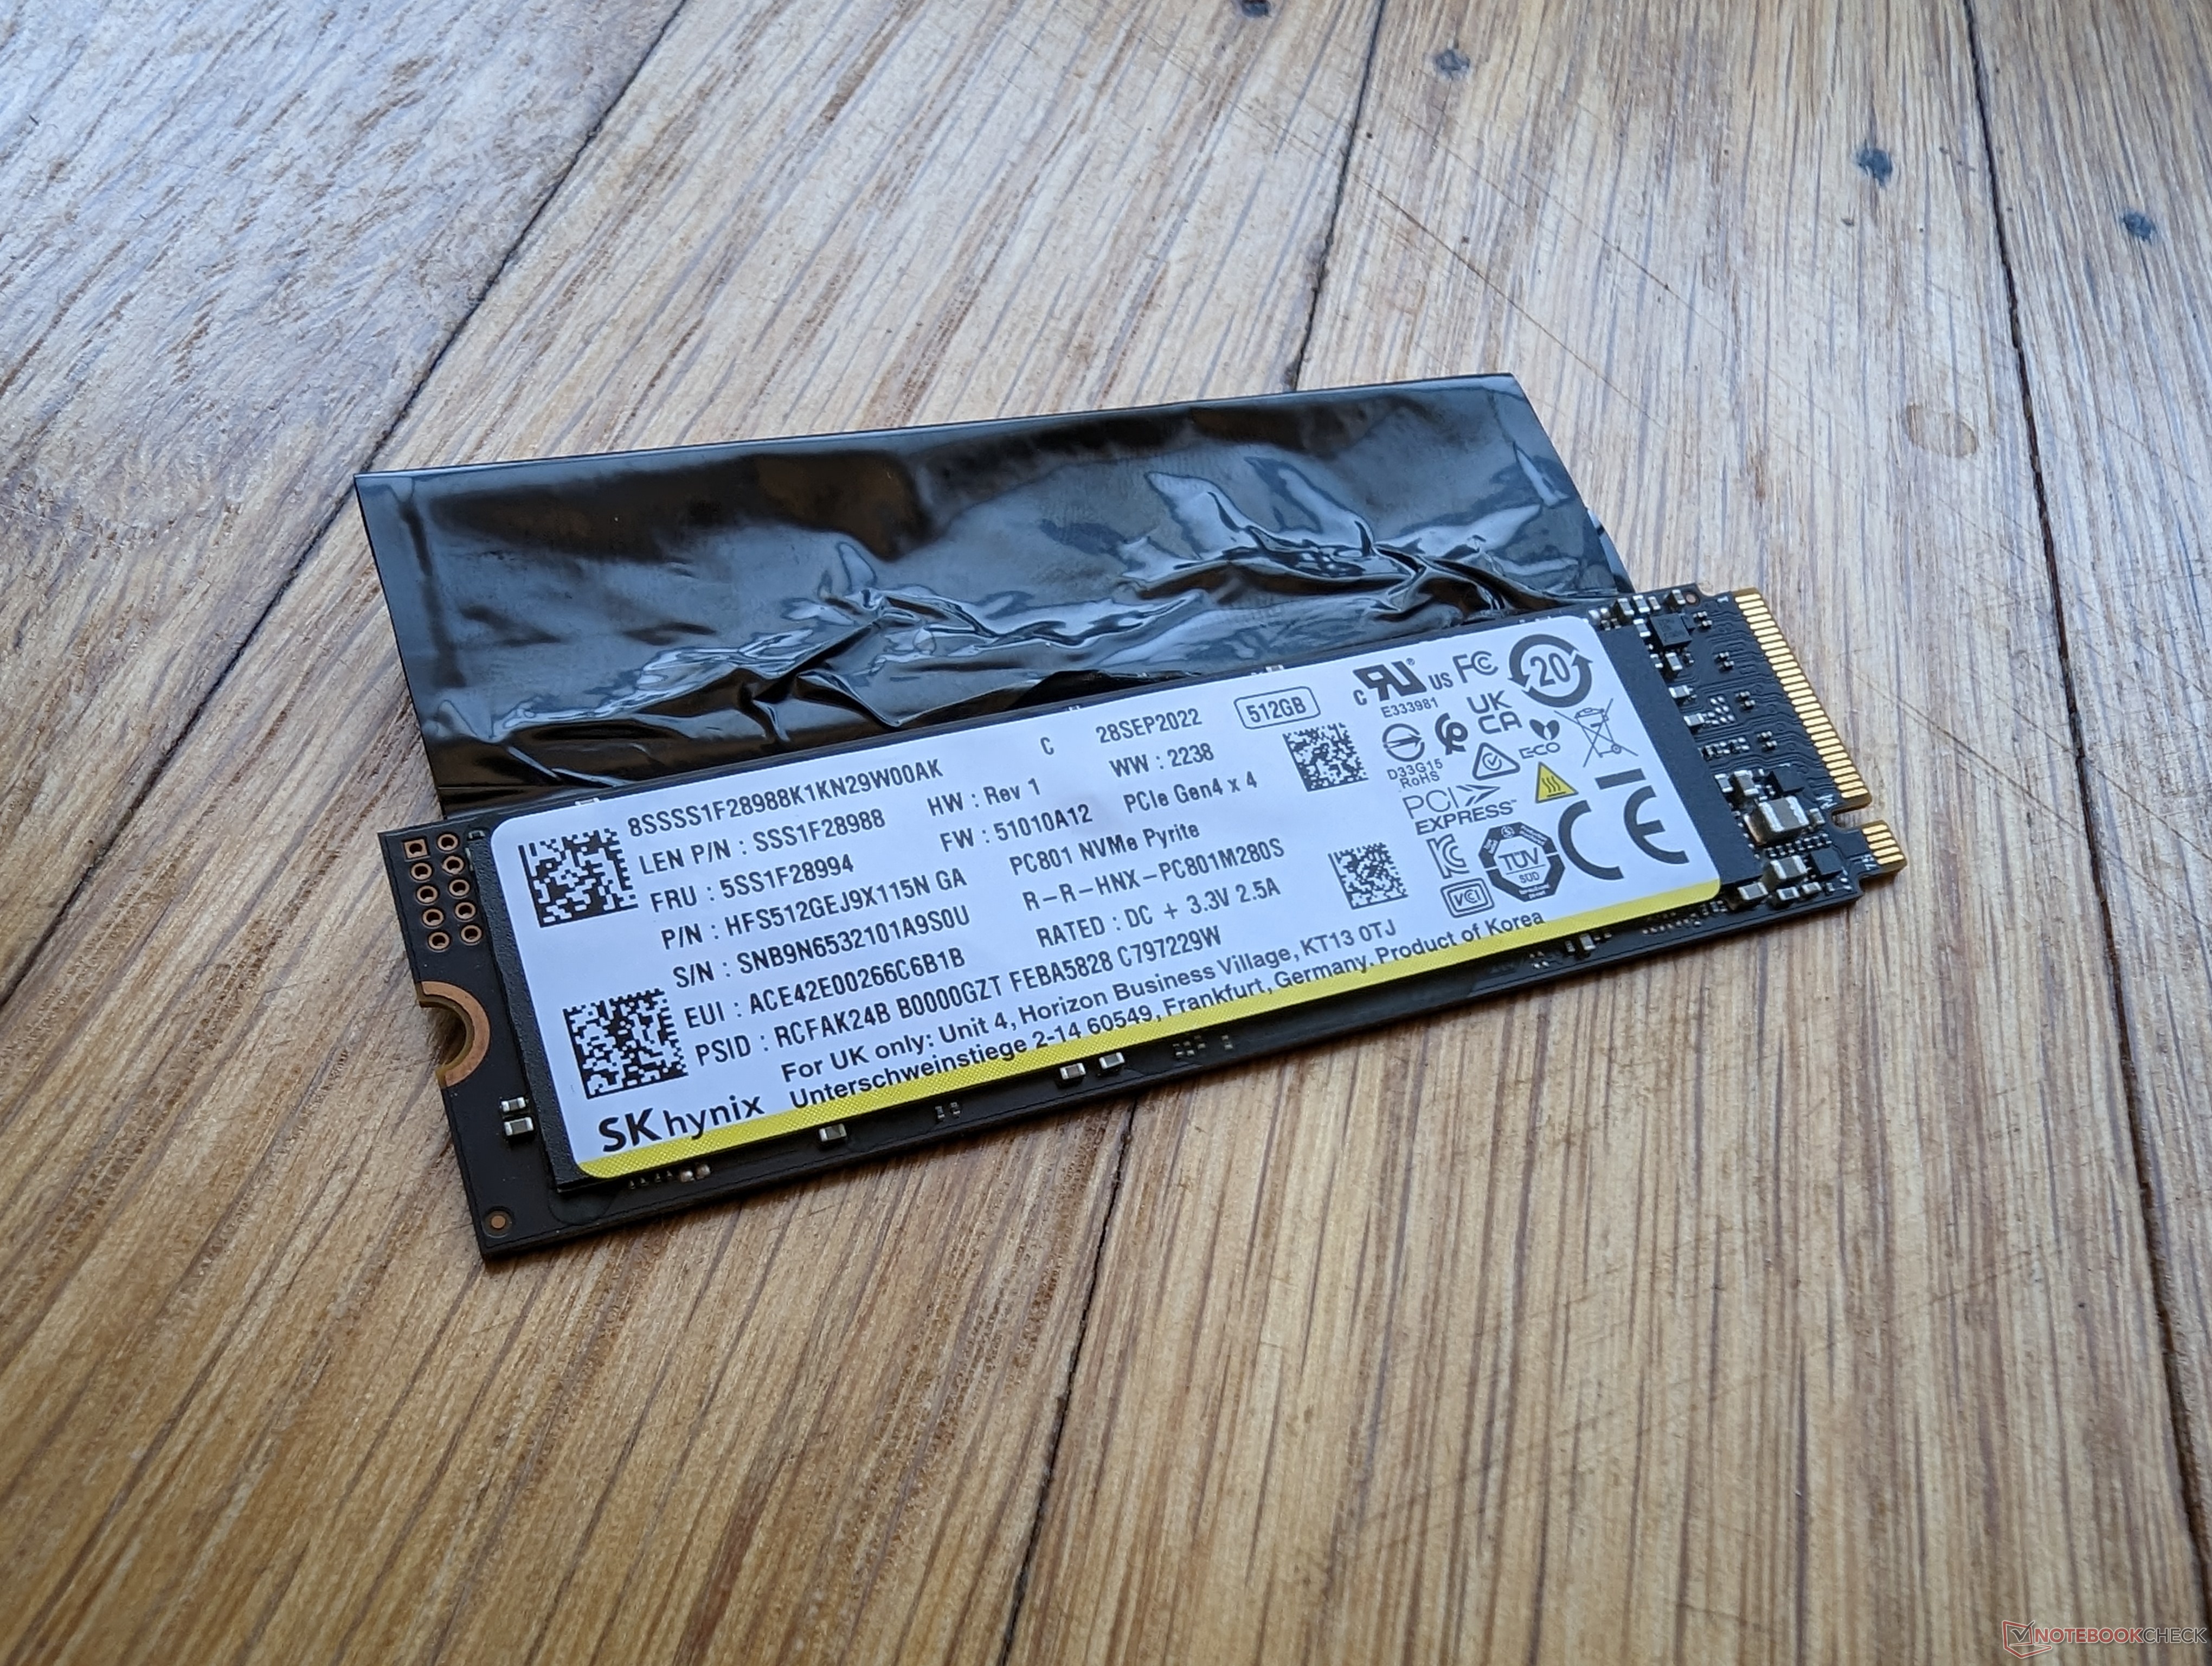
The SK hynix PC801 HFS512GEJ9X115N GA is a fast PCIe Gen 4x4 NVMe SSD in the M.2 2280 form factor. It offers 512GB flash memory and is one of the fastest drives in 2022. It supports the Pyrite security features.
| YMTC PC005 256GB | SK hynix PC801 HFS512GEJ9X115N | |
| Type | SSD | SSD |
| Size | M.2 2280 | M.2 2280 |
| Capacity | 256 GB | 512 GB |
| Interface | NVMe | NVMe |
| Announced | 17.02.2023 | 16.12.2022 |
Benchmarks
Performance Rating - DiskSpd - PC005-256GB
22.1 pt (25%)
Seagate ST1000LM014 Solid State Hybrid Drive
...
Kioxia BG5 KBG5AZNT512G
Future Path FPE220M8SSD512G
YMTC PC005 256GB
...
Kingston Fury Renegade G5 4TB
0%
100%
Performance Rating - DiskSpd - HFS512GEJ9X115N
38.3 pt (44%)
Seagate ST1000LM014 Solid State Hybrid Drive
...
Lexar NM790 2TB
Western Digital SN740 SDDPTQE-2T00
Samsung PM9C1a MZ9L81T0HDLB
SK hynix PC801 HFS512GEJ9X115N
Lexar NQ7A1
Lenovo UMIS AM541 1TB
...
Kingston Fury Renegade G5 4TB
0%
100%
594%
HFS512GEJ9X115N +min: 1931.5 avg: 2300 median: 2298.5 (38%) max: 2670.4 MB/s
344%
HFS512GEJ9X115N +min: 759.98 avg: 974 median: 1018.2 (38%) max: 1098.38 MB/s
251%
HFS512GEJ9X115N +min: 566.62 avg: 2443 median: 2833.9 (11%) max: 3538.73 MB/s
327%
HFS512GEJ9X115N +min: 4439 avg: 6509 median: 6320 (39%) max: 9125 Points
481%
HFS512GEJ9X115N +min: 2271 avg: 3169 median: 2977.5 (41%) max: 4288 Points
240%
HFS512GEJ9X115N +min: 1261 avg: 2269 median: 2205.5 (35%) max: 3413 Points
min: 0.017 avg: 0.1 median: 0.1 (0%) max: 0.101 ms
131%
HFS512GEJ9X115N +min: 0.039 avg: 0.1 median: 0 (0%) max: 0.089 ms
668%
HFS512GEJ9X115N +min: 1701.44 avg: 2610 median: 2438.8 (41%) max: 3536.78 MB/s
287%
HFS512GEJ9X115N +min: 701.66 avg: 1683 median: 1679.7 (33%) max: 2755 MB/s
142%
HFS512GEJ9X115N +min: 114.92 avg: 224.9 median: 234.1 (46%) max: 291.16 MB/s
115%
HFS512GEJ9X115N +min: 50.71 avg: 63.5 median: 63.2 (20%) max: 77.12 MB/s
318%
HFS512GEJ9X115N +min: 2629.13 avg: 3339 median: 2815.9 (25%) max: 4750.28 MB/s
189%
HFS512GEJ9X115N +min: 4076.28 avg: 5221 median: 5253.2 (41%) max: 5872 MB/s
CrystalDiskMark 5.2 / 6 - CDM 5/6 Write 4K
100%
1 HFS512GEJ9X115N +min: 105.4 avg: 204.2 median: 155.6 (14%) max: 308 MB/s
CrystalDiskMark 5.2 / 6 - CDM 5/6 Read 4K
100%
1 HFS512GEJ9X115N +min: 53.51 avg: 63.2 median: 61.3 (2%) max: 72.42 MB/s
CrystalDiskMark 5.2 / 6 - CDM 5 Write Seq
100%
1 HFS512GEJ9X115N +min: 3338 avg: 3789 median: 3535 (19%) max: 4922 MB/s
CrystalDiskMark 5.2 / 6 - CDM 5 Read Seq
100%
1 HFS512GEJ9X115N +min: 3104 avg: 4488 median: 4539 (48%) max: 5640 MB/s
CrystalDiskMark 5.2 / 6 - CDM 5/6 Write 4K Q32T1
100%
1 HFS512GEJ9X115N +min: 382.6 avg: 503 median: 488.3 (10%) max: 628.7 MB/s
CrystalDiskMark 5.2 / 6 - CDM 5/6 Read 4K Q32T1
100%
1 HFS512GEJ9X115N +min: 310.5 avg: 565 median: 482.4 (7%) max: 844.7 MB/s
CrystalDiskMark 5.2 / 6 - CDM 5/6 Write Seq Q32T1
100%
1 HFS512GEJ9X115N +min: 3855 avg: 4653 median: 4945 (33%) max: 4984 MB/s
CrystalDiskMark 5.2 / 6 - CDM 5/6 Read Seq Q32T1
100%
1 HFS512GEJ9X115N +min: 4805 avg: 6668 median: 7127 (38%) max: 7147 MB/s
min: 115 avg: 227.8 median: 230.3 (53%) max: 328 MB/s
134%
HFS512GEJ9X115N +min: 53 avg: 64.9 median: 66.4 (19%) max: 75.5 MB/s
141%
HFS512GEJ9X115N +min: 248 avg: 1345 median: 973 (14%) max: 2826 MB/s
273%
HFS512GEJ9X115N +min: 683 avg: 2086 median: 1976.5 (24%) max: 3794 MB/s
310%
HFS512GEJ9X115N +min: 1495 avg: 3396 median: 3492.5 (34%) max: 4938 MB/s
190%
HFS512GEJ9X115N +min: 2805 avg: 4066 median: 4091.5 (43%) max: 5346 MB/s
404%
HFS512GEJ9X115N +min: 4510 avg: 4862 median: 4919.5 (34%) max: 4983 MB/s
265%
HFS512GEJ9X115N +min: 4407 avg: 6401 median: 6859 (43%) max: 7328 MB/s
255%
HFS512GEJ9X115N +min: 3642 avg: 6225 median: 6646.5 (41%) max: 7134 MB/s
- Range of benchmark values for this graphics card
 - Average benchmark values for this graphics card
* Smaller numbers mean a higher performance
* Smaller numbers mean a higher performance
Average Benchmarks
YMTC PC005 256GB → 100% n=23
SK hynix PC801 HFS512GEJ9X115N → 269% n=23
Average of the median scores above. 1 ... This benchmark is not used for the average calculation
v1.35