Notebookcheck Logo

ARM Mali-T760 MP8 vs Qualcomm Adreno 506

ARM Mali-T760 MP8

► remove from comparison ARM Mali-T760 MP8

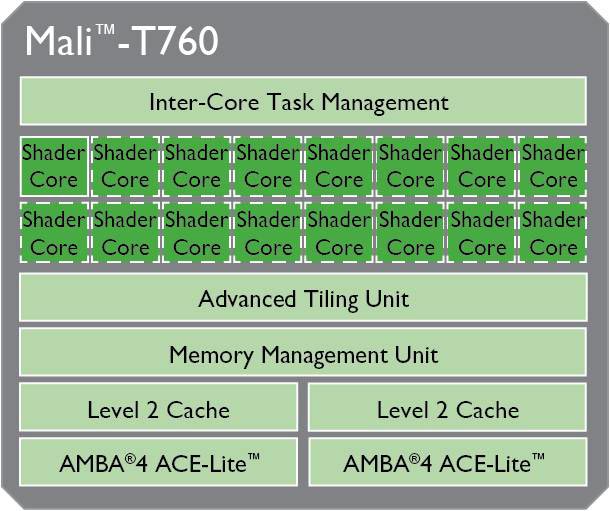
The ARM Mali-T760 MP8 is a fast mobile graphics solution that can be found in ARM SoCs like the Samsung Exynos 7420 Octa (Galaxy S6). The chip is available since Q1/2015 and is one of the fastest solutions of its class at the time of the introduction. Besides OpenGL ES 3.1, the GPU supports OpenCL 1.1 as well as DirectX 11. According to ARM, the Mali-T760 can be scaled from 1 - 16 cores/clusters.

The MP8 version offers 8 clusters clocked at up to 772 MHz (302 GFLOPS). In most benchmarks, the GPU is able to beat the competing Adreno 420 (Snapdragon 805) and PowerVR GX6450 (Apple A8). Only a few tablet chips like Tegra K1/X1 or the GXA6850 (Apple A8X) are still somewhat faster. Overall, the Mali-T760 MP8 is the fastest smartphone GPU in early 2015 and will handle even the most demanding Android games fluently in high resolutions.

Despite its impressive performance, the Mali-T760 MP8 / Exynos 7420 has a very modest power consumption thanks to an advanced 14 nm FinFET process (Samsung LPE). Therefore, it can be used even in smaller smartphones.

Qualcomm Adreno 506

► remove from comparison

The Qualcomm Adreno 506 is a mobile graphics card for mid-range smartphones and tablets (mostly Android based). It is included in the Qualcomm Snapdragon 625 SoCs and based on the Adreno 500 architecture (like the Adreno 520 in the S820, which should be fully compatible in software).

The GPU supports modern standards like Vulkan 1.0 (according to Wikipedia), OpenGL ES 3.1 + AE (3.2 in other sources), OpenCL 2.0 and DirectX 12 (FL 12.1 according to Wikipedia, 11.1 according to Qualcomm). Furthermore, the GPU supports Universal Bandwidth Compression (UBWC) to save memory bandwidth.

ARM Mali-T760 MP8Qualcomm Adreno 506
Adreno 500 Series
Mali-T760 MP8 8 @ 0.7 - 0.77 GHz
Mali-T760 MP6 compare 6 @ 0.7 GHz
Mali-T760 MP4 compare 4 @ 0.6 GHz
Mali-T760 MP2 compare 2 @ 0.7 GHz
Mali-T720 MP4 compare 4 @ 0.6 GHz
Mali-T720 MP2 compare 2 @ 0.65 GHz
Mali-T720 compare 1 @ 0.6 GHz
Adreno 540 compare @ 0.71 GHz
Adreno 530 compare @ 0.62 GHz
Adreno 512 compare
Adreno 510 compare
Adreno 509 compare
Adreno 508 compare @ 0.65 GHz
Adreno 506 @ 0.65 GHz
Adreno 505 compare @ 0.45 GHz
Adreno 504 compare @ 0.45 GHz
CodenameMidgard (3rd Generation)
ArchitectureMidgard (3rd-gen)Adreno 500
Pipelines8 - unified
Core Speed700 - 772 (Boost) MHz650 MHz
Shared Memorynoyes
APIDirectX 11, OpenGL ES 3.1DirectX 12.1, OpenGL ES 3.2, Vulkan
technology14 nm14 nm
FeaturesOpenGL ES 3.1, OpenCL 1.1, DirectX 11, Renderscript, FSAA/MSAAOpenGL ES 3.2, OpenCL 2.0, Direct3D 12 (FL 12_1)
Date of Announcement01.03.2015 15.12.2015
Link to Manufacturer Pagewww.arm.com
CPU in Mali-T760 MP8GPU Base SpeedGPU Boost / Turbo
Samsung Exynos 7420 Octa8 x 2100 MHz700 MHz772 MHz
CPU in Adreno 506GPU Base SpeedGPU Boost / Turbo
Qualcomm Snapdragon 6328 x 1800 MHz? MHz? MHz
Qualcomm Snapdragon 6268 x 2200 MHz? MHz? MHz
Qualcomm Snapdragon 6258 x 2000 MHz? MHz? MHz
Qualcomm Snapdragon 4508 x 1800 MHz? MHz? MHz
min. - max.? - 700 MHz? - 772 MHz

Benchmarks

3DMark - 3DMark Ice Storm Unlimited Graphics
min: 23193     avg: 25970     median: 26964 (3%)     max: 28192 Points
min: 7668     avg: 13091     median: 13240 (2%)     max: 14741 Points
3DMark - 3DMark Ice Storm Extreme Graphics
min: 7040     avg: 7261     median: 7309 (1%)     max: 7435 Points
3DMark - 3DMark Ice Storm Graphics
12169 Points (1%)
3DMark - 3DMark Sling Shot (ES 3.0) Unlimited
min: 533     avg: 847     median: 851 (4%)     max: 951 Points
3DMark - 3DMark Sling Shot (ES 3.0) Unlimited Graphics
min: 440     avg: 732     median: 734 (2%)     max: 814 Points
3DMark - 3DMark Sling Shot Extreme (ES 3.1) Unlimited
min: 488     avg: 524     median: 510.5 (3%)     max: 882 Points
3DMark - 3DMark Sling Shot Extreme (ES 3.1) Unlimited Graphics
min: 403     avg: 433.9     median: 421.5 (1%)     max: 761 Points
3DMark - 3DMark Wild Life Unlimited
0 Points (0%)
GFXBench - GFXBench 5.0 Aztec Ruins High Tier Offscreen
min: 1.1     avg: 1.2     median: 1.2 (0%)     max: 1.4 fps
GFXBench - GFXBench 5.0 Aztec Ruins Normal Tier Offscreen
min: 3.3     avg: 3.6     median: 3.6 (0%)     max: 3.9 fps
GFXBench - GFXBench Car Chase Offscreen
min: 3.3     avg: 3.6     median: 3.5 (0%)     max: 3.9 fps
GFXBench 3.1 - GFXBench Manhattan ES 3.1 Offscreen
13 fps (0%)
min: 3.5     avg: 6.5     median: 6.4 (0%)     max: 14 fps
GFXBench 3.0 - GFXBench 3.0 Manhattan Offscreen
min: 18     avg: 21.9     median: 22.5 (1%)     max: 25.5 fps
min: 3.1     avg: 9.6     median: 9.8 (1%)     max: 11 fps
GFXBench (DX / GLBenchmark) 2.7
GFXBench T-Rex HD Offscreen C24Z16 + ARM Mali-T760 MP8
GFXBench (DX / GLBenchmark) 2.7 - GFXBench T-Rex HD Offscreen C24Z16
min: 46     avg: 52.3     median: 53.5 (0%)     max: 56.1 fps
GFXBench T-Rex HD Offscreen C24Z16 + Qualcomm Adreno 506
min: 21     avg: 22.7     median: 23 (0%)     max: 25 fps
Basemark ES 2.0 - Basemark ES 2.0
min: 59.4     avg: 59.9     median: 59.8 (99%)     max: 60.4 fps
44 fps (73%)
Basemark X 1.1 - Basemark X 1.1 High Quality
min: 9252     avg: 22140     median: 26124 (59%)     max: 27059 Points
10438 Points (24%)
Basemark X 1.1 - Basemark X 1.1 Medium Quality
min: 31743     avg: 35781     median: 36339.5 (81%)     max: 38701 Points
21210 Points (47%)
NenaMark2 - NenaMark2 Score
min: 59.7     avg: 60.1     median: 60.1 (89%)     max: 60.5 fps
PassMark PerformanceTest Mobile V1 - PerformanceTest Mobile V1 2D Graphics Tests
min: 4691     avg: 5019     median: 5054.5 (5%)     max: 5274 Points
min: 2337     avg: 3197     median: 3197 (3%)     max: 4057 Points
PassMark PerformanceTest Mobile V1 - PerformanceTest Mobile V1 3D Graphics Tests
min: 2227     avg: 2263     median: 2239.5 (4%)     max: 2345 Points
min: 1371     avg: 1472     median: 1472 (3%)     max: 1573 Points
Smartbench 2012 - Smartbench 2012 Gaming Index
min: 4489     avg: 4519     median: 4510 (98%)     max: 4566 Points
3466 Points (75%)

Average Benchmarks ARM Mali-T760 MP8 → 100% n=10

Average Benchmarks Qualcomm Adreno 506 → 56% n=10

- Range of benchmark values for this graphics card
- Average benchmark values for this graphics card
* Smaller numbers mean a higher performance
1 This benchmark is not used for the average calculation

Game Benchmarks

The following benchmarks stem from our benchmarks of review laptops. The performance depends on the used graphics memory, clock rate, processor, system settings, drivers, and operating systems. So the results don't have to be representative for all laptops with this GPU. For detailed information on the benchmark results, click on the fps number.

League of Legends: Wild Rift

League of Legends: Wild Rift

2020
low
Adreno 506:
53.5  fps
high
Adreno 506:
48  fps
PUBG Mobile

PUBG Mobile

2018
low
Adreno 506:
25 26 26 29 30 30 ~ 28 fps
med.
Adreno 506:
23 25 26 26 30 ~ 26 fps
Arena of Valor

Arena of Valor

2018
low
Adreno 506:
30 31 31 31 31 32 ~ 31 fps
ultra
Adreno 506:
30 30 30 31 31 31 31 31 ~ 31 fps
Shadow Fight 3

Shadow Fight 3

2018
low
Adreno 506:
54 57 60 ~ 57 fps
high
Adreno 506:
50 53 54 60 60 ~ 55 fps
Dead Trigger 2

Dead Trigger 2

2013
high
Adreno 506:
30 30 30 30 30 30 30 30 53 55 56 56 57 58 ~ 41 fps
Asphalt 8: Airborne

Asphalt 8: Airborne

2013
low
Adreno 506:
29 30 30 30 30 30 30 30 30 30 30 30 30 ~ 30 fps
high
Adreno 506:
24 28 28 28 29 30 30 30 30 30 30 30 30 30 ~ 29 fps
Asphalt 9: Legends

Asphalt 9: Legends

2013
low
Adreno 506:
26 27 28 30 30 30 ~ 29 fps
high
Adreno 506:
15 21 24 28 28.5 ~ 23 fps
Temple Run 2

Temple Run 2

2013
high
Adreno 506:
60 60 ~ 60 fps
Qualcomm Adreno 506lowmed.highultraQHD4K
League of Legends: Wild Rift53.548
PUBG Mobile2826
Arena of Valor3131
Shadow Fight 35755
Dead Trigger 241
Asphalt 8: Airborne3029
Asphalt 9: Legends2923
Temple Run 260
< 30 fps
< 60 fps
< 120 fps
≥ 120 fps
2
4

1


2
3
1

1


For more games that might be playable and a list of all games and graphics cards visit our Gaming List

Add one or more devices and compare

In the following list you can select (and also search for) devices that should be added to the comparison. You can select more than one device.

restrict list:

show all (including archived), 2024, 2023
v1.26
log 02. 17:16:14

#0 checking url part for id 6188 +0s ... 0s

#1 checking url part for id 7443 +0s ... 0s

#2 not redirecting to Ajax server +0s ... 0s

#3 did not recreate cache, as it is less than 5 days old! Created at Sat, 01 Jun 2024 05:39:27 +0200 +0.001s ... 0.001s

#4 composed specs +0.093s ... 0.094s

#5 did output specs +0s ... 0.094s

#6 start showIntegratedCPUs +0s ... 0.094s

#7 getting avg benchmarks for device 6188 +0.029s ... 0.123s

#8 got single benchmarks 6188 +0.014s ... 0.137s

#9 getting avg benchmarks for device 7443 +0.002s ... 0.139s

#10 got single benchmarks 7443 +0.109s ... 0.248s

#11 got avg benchmarks for devices +0s ... 0.248s

#12 No cached benchmark found, getting uncached values +0.055s ... 0.303s

#13 min, max, avg, median took s +0.034s ... 0.337s

#14 before gaming benchmark output +0s ... 0.337s

#15 Got 89 rows for game benchmarks. +0.033s ... 0.37s

#16 composed SQL query for gamebenchmarks +0s ... 0.37s

#17 got data and put it in $dataArray +0.004s ... 0.374s

#18 benchmarks composed for output. +0.018s ... 0.392s

#19 calculated avg scores. +0s ... 0.392s

#20 return log +0.043s ... 0.436s

Please share our article, every link counts!
> Expert Reviews and News on Laptops, Smartphones and Tech Innovations > Benchmarks / Tech > Graphics Card Comparison - Head 2 Head
Redaktion, 2017-09- 8 (Update: 2023-07- 1)