

Intel Core i7-720QM vs Intel Core i7-640M vs Intel Core i7-620M
Intel Core i7-720QM
► remove from comparison
The Intel Core i7 720QM is a fast quad-core CPU and slowest Core i7 quad core in 2009. It features 4 cores (quad core CPU) and Hyperthreading. Therefore, 8 threads can be worked on simultaneously. Compared to the faster Core i7 mobile CPUs, the 720QM only features 6MB L3 Cache (the faster ones 8 MB).
Because of the Turbo Mode, the CPU is clocked with up to 2.8 GHz and therefore fast for single core applications like older games. Thanks to the 4 cores (and 8 threads), modern multi-threaded applications also profit from this CPU greatly (altough when using all cores, the clock speed remains low).
The Core i7 7xx line has an integrated memory controller for DDR3 bars (1066 or 1333). Therefore, the memory performance is very good (compared to older CPUs with external memory controllers). Still this also leads to the higher TDP of the whole chip.
The power consumption of up to 45 Watt (TDP) is quite high for a laptop CPU and because of the Turbo Mode, the power consumption could reach these high values. Therefore, only large laptops with good cooling solutions can house this CPU.
Intel Core i7-640M
► remove from comparison
The Intel Core i7-640M is a high end dual core CPU for laptops and clocks (due to the Turbo Mode) from 2.8 to 3.46 GHz. Each core is based on the Nehalem (Westmere) micro-architecture. Hyperthreading enables the Dual Core CPU to handle 4 threads at once (for a better usage of the pipeline). Therefore, the i7-640M is related to the other i5 and i3 dual core CPUs and not the quad-core i7 CPUs.
A feature of the new Core i7-640M is the integrated graphics card called Intel HD Graphics (GMA HD) and memory controller. Both are on a separate die that is still manufactured in 45nm whereas the CPU die is already manufactured in the new 32nm process.
The 32nm cpu cores of the Westmere generation can also process some new instructions to accelerate AES encryptions. Compared to the slower i5 versions without AES features, the 3DMark Vantage Communication Score showed a significant increase with AES enabled CPUs.
The integrated Intel Graphics Media Accelerator HD (GMA HD) graphics card is clocked with 500-733 MHz and performs clearly faster than the old GMA 4500MHD. A GeForce 9400M (ION) should still be a bit faster (especially as Nvidia and ATI cards have a better driver support than Intel up to now).
The power consumption of 35 Watt TDP (max.) counts for the whole package and therefore it is clearly better than the 35 Watt TDP of the Core 2 Duo T-series (CPU alone).
The Core i7-640M should not be mistaken with the similar named but slower low voltage Core i7-640LM and Core i7-640UM models.
Intel Core i7-620M
► remove from comparison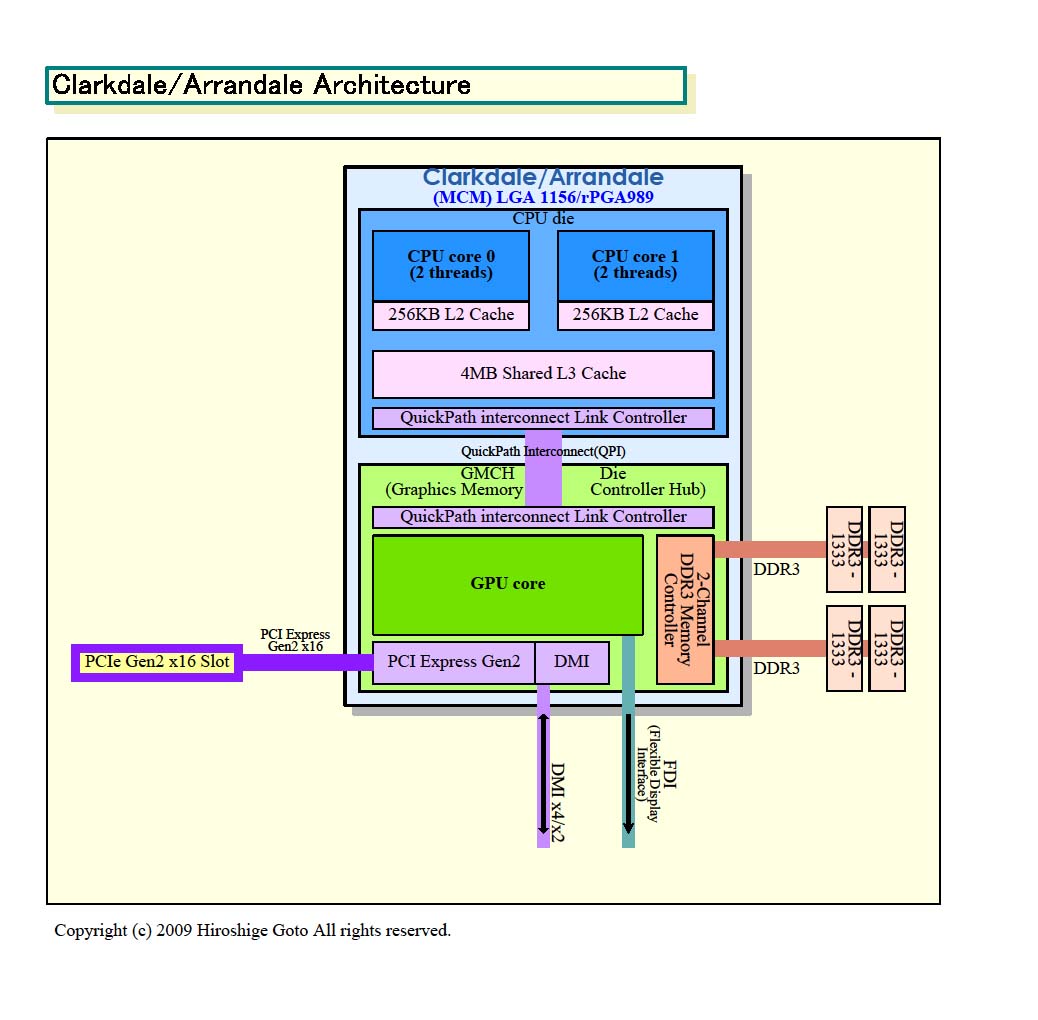
The Intel Core i7-620M is a high end dual core CPU for laptops and clocks (due to the Turbo Mode) from 2.66 to 3.33 GHz. Each core is based on the Nehalem (Westmere) micro-architecture. Hyperthreading enables the Dual Core CPU to handle 4 threads at once (for a better usage of the pipeline). Therefore, the i7-620M is related to the other i5 and i3 dual core CPUs and not the quad-core i7 CPUs.
A feature of the new Core i7-620M is the integrated graphics card called Intel HD Graphics (GMA HD) and memory controller. Both are on a separate die that is still manufactured in 45nm whereas the CPU die is already manufactured in the new 32nm process.
The performance of the Core i7-620M is on average above the former fastest mobile dual core CPU, the Core 2 Duo T9900 / X9100. In our tests, just the single threaded rendering test in the Cinebench R10 benchmark scored less points. Even the mobile Core i7-720QM quad core is slower in many cases.
The 32nm cpu cores of the Westmere generation can also process some new instructions to accelerate AES encryptions. Compared to the slower i5 versions without AES features, the 3DMark Vantage Communication Score showed a significant increase with AES enabled CPUs.
The integrated Intel Graphics Media Accelerator HD (GMA HD) graphics card is clocked with 500-733 MHz and performs clearly faster than the old GMA 4500MHD. A GeForce 9400M (ION) should still be a bit faster (especially as Nvidia and ATI cards have a better driver support than Intel up to now).
The power consumption of 35 Watt TDP (max.) counts for the whole package and therefore it is clearly better than the 35 Watt TDP of the Core 2 Duo T-series (CPU alone).
The Core i7-620M should not be mistaken with the similar named but slower low voltage and ultra low voltage chips Core i7-620LM (2.13-2.93 GHZ, 25W) and Core i7-620UM (1.2-2.26 GHz, 18 W).
| Model | Intel Core i7-720QM | Intel Core i7-640M | Intel Core i7-620M | ||||||||||||||||||||||||||||||||||||||||||||||||||||||||||||||||||||||||||||||||||||||||||||||||
| Codename | Clarksfield | Arrandale | Arrandale | ||||||||||||||||||||||||||||||||||||||||||||||||||||||||||||||||||||||||||||||||||||||||||||||||
| Series | Intel Core i7 | Intel Core i7 | Intel Core i7 | ||||||||||||||||||||||||||||||||||||||||||||||||||||||||||||||||||||||||||||||||||||||||||||||||
| Series: Core i7 Arrandale |
|
|
| ||||||||||||||||||||||||||||||||||||||||||||||||||||||||||||||||||||||||||||||||||||||||||||||||
| Clock | 1600 - 2800 MHz | 2800 - 3460 MHz | 2660 - 3333 MHz | ||||||||||||||||||||||||||||||||||||||||||||||||||||||||||||||||||||||||||||||||||||||||||||||||
| FSB | 2500 | 2500 | 2500 | ||||||||||||||||||||||||||||||||||||||||||||||||||||||||||||||||||||||||||||||||||||||||||||||||
| L1 Cache | 256 KB | ||||||||||||||||||||||||||||||||||||||||||||||||||||||||||||||||||||||||||||||||||||||||||||||||||
| L2 Cache | 1 MB | 512 KB | 512 KB | ||||||||||||||||||||||||||||||||||||||||||||||||||||||||||||||||||||||||||||||||||||||||||||||||
| L3 Cache | 6 MB | 4 MB | 4 MB | ||||||||||||||||||||||||||||||||||||||||||||||||||||||||||||||||||||||||||||||||||||||||||||||||
| Cores / Threads | 4 / 8 | 2 / 4 | 2 / 4 | ||||||||||||||||||||||||||||||||||||||||||||||||||||||||||||||||||||||||||||||||||||||||||||||||
| TDP | 45 Watt | 35 Watt | 35 Watt | ||||||||||||||||||||||||||||||||||||||||||||||||||||||||||||||||||||||||||||||||||||||||||||||||
| Transistors | 774 Million | 382+177 Million | 382+177 Million | ||||||||||||||||||||||||||||||||||||||||||||||||||||||||||||||||||||||||||||||||||||||||||||||||
| Technology | 45 nm | 32 nm | 32 nm | ||||||||||||||||||||||||||||||||||||||||||||||||||||||||||||||||||||||||||||||||||||||||||||||||
| Die Size | 296 mm2 | 81+114 mm2 | 81+114 mm2 | ||||||||||||||||||||||||||||||||||||||||||||||||||||||||||||||||||||||||||||||||||||||||||||||||
| Socket | RPGA989 | BGA1288, PGA988 | BGA1288, PGA988 | ||||||||||||||||||||||||||||||||||||||||||||||||||||||||||||||||||||||||||||||||||||||||||||||||
| Architecture | x86 | x86 | x86 | ||||||||||||||||||||||||||||||||||||||||||||||||||||||||||||||||||||||||||||||||||||||||||||||||
| $546 U.S. | $346 U.S. | $332 U.S. | |||||||||||||||||||||||||||||||||||||||||||||||||||||||||||||||||||||||||||||||||||||||||||||||||
| Announced | |||||||||||||||||||||||||||||||||||||||||||||||||||||||||||||||||||||||||||||||||||||||||||||||||||
| Manufacturer | ark.intel.com | ark.intel.com | ark.intel.com | ||||||||||||||||||||||||||||||||||||||||||||||||||||||||||||||||||||||||||||||||||||||||||||||||
| max. Temp. | 105 °C | 105 °C | |||||||||||||||||||||||||||||||||||||||||||||||||||||||||||||||||||||||||||||||||||||||||||||||||
| Features | Turbo Boost, Hyper Threading, Enhanced Speedstep, integrierte GMA HD 500-733MHz, Dual Channel DDR3 memory controller | Turbo Boost, Hyper Threading, Enhanced Speedstep, integrierte GMA HD 500-733MHz, Dual Channel DDR3 memory controller |

Benchmarks

Average Benchmarks Intel Core i7-720QM → 100% n=14
Average Benchmarks Intel Core i7-640M → 107% n=14
Average Benchmarks Intel Core i7-620M → 99% n=14
* Smaller numbers mean a higher performance
1 This benchmark is not used for the average calculation