Notebookcheck Logo

Intel Core i3-5005U vs Intel Core i7-3632QM

Intel Core i3-5005U

► remove from comparison Intel 5005U

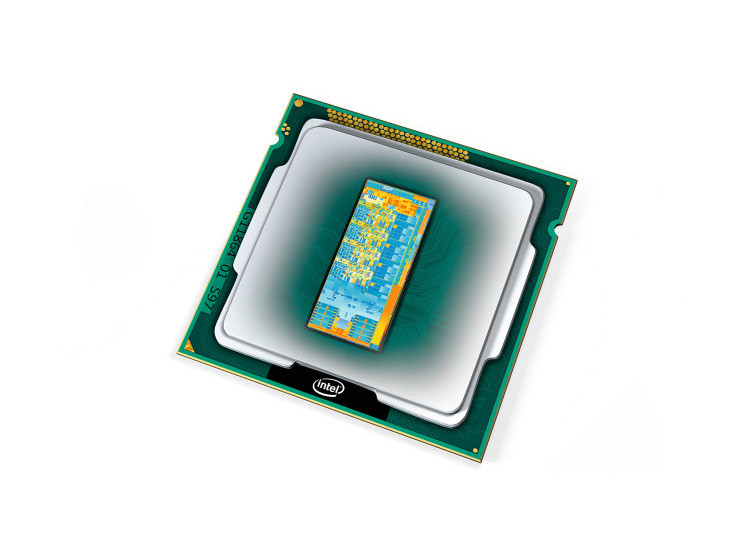
The Intel Core i3-5005U is an ULV (ultra low voltage) dual-core processor based on the Broadwell architecture, which has been launched in January 2015. In addition to two CPU cores with Hyper-Threading clocked at 2.0 GHz (no Turbo), the chip also integrates an HD Graphics 5500 GPU and a dual-channel DDR3(L)-1600 memory controller. The Core i3 is manufactured in a 14 nm process with FinFET transistors.

Architecture

Broadwell represents the "Tick" in Intel's Tick-Tock model, which means a shrink of its predecessor Haswell. The new 14 nm manufacturing process with three-dimensional FinFET transistors allows not only improvements in energy efficiency, but also a significantly smaller die size fit for more compact packages and devices.

Further advantages result from the revised microarchitecture of Broadwell. Due to its improved branch prediction, bigger buffer sizes (1500 instead of 1000 entries in the L2 TLB) and other tweaks, the performance per clock has been increased by more than 5 percent over its predecessor. There are also some new instruction set extensions designed for cryptographic applications.

Performance

Thanks to its improved architecture and the slightly higher clock rate, the Core i3-5005U ends up 5 - 10 percent faster than the Core i3-4025U (1.9 GHz, Haswell). Thus, the CPU has sufficient power for office and multimedia purposes as well as more demanding applications and multitasking.

Graphics

The integrated HD Graphics 5500 offers 24 Execution Units (EUs), however only 23 EUs (clocked at 300 - 850 MHz) are active in this case. Similar to the CPU core, the GPU architecture (Intel Gen 8) has been thoroughly revised for improved performance-per-clock. Therefore, the HD Graphics 5500 is able to beat the HD Graphics 4400 (20 EUs) as well as the HD Graphics 5000 (40 EUs), both part of the Haswell generation. Nevertheless, most games as of 2015 will be playable only in low settings.

Broadwell is the first Intel chip to fully support DirectX 11.2 as well as OpenCL 1.3/2.0 and OpenGL 4.3. Video will output natively via DisplayPort 1.2 or HDMI 1.4a. However, the new HDMI 2.0 standard is not supported.

Power Consumption

The i3-5005U is rated at a TDP of 15 W (10 W cTDP Down) including the graphics card, memory controller, VRMs and the integrated chipset. Therefore, the CPU is suited even for small ultrabooks 11-inches and greater.

Intel Core i7-3632QM

► remove from comparison Intel 3632QM

The Intel Core i7-3632QM is a fast quad-core processor for laptops based on the Ivy Bridge architecture and successor of the i7-3612QM. It is the fastest mobile processor rated at 35 Watt (at the time of announcement in Q3 2012). Due to Hyperthreading, the four cores can handle up to eight threads in parallel leading to better utilization of the CPU. Each core offers a base speed of 2.2 GHz but can dynamically increase clock rates with Turbo Boost up to 2.9 GHz (for 4 active cores), 3.1 GHz (for 2 active cores) and 3.2 GHz (for 1 active core). Compared to other quad core CPUs, the 3632QM is specified at a TDP of only 35 Watt (similar to the dual-core CPUs). The BGA version (that is directly soldered to the mainboard) supports VT-d virtualization, whereas the rPGA version does not. Both don't support vPro and Trusted Execution, but otherwise all Ivy Bridge features like AES or VT-x are useable.

Ivy Bridge is an enhanced die shrink of the Sandy Bridge architecture with improvements on both GPU and CPU performance. The CPUs are produced in 22nm (versus 32nm Sandy Bridge CPUs) and are the first to introduce 3D transistors for increased energy efficiency when compared to similarly clocked Sandy Bridge processors. Other new features are integrated PCI Express 3.0 and  DDR3(L)-1600 support.

The performance of the Core i7-3632QM is slightly above a similarly clocked Sandy Bridge processor due to the architectural improvements. As a result, overall performance is slightly above the Sandy Bridge Core i7-2820QM. Altough the 3632QM has a higher model number than the 3630QM, it offers slower clock rates and therefore performs worse. However, the 3630QM is specified at a much higher TDP of 45 Watt.

The integrated Intel HD Graphics 4000 offers 16 Execution Units (EUs) and is clocked at 650 MHz (base) up to 1150 MHz (Turbo Boost).

With a TDP of only 35 Watt, the Core i7-3632QM is specified at the level of the dual-core mobile CPUs. Therefore, even smaller laptops can use the Core i7.

ModelIntel Core i3-5005UIntel Core i7-3632QM
CodenameBroadwellIvy Bridge
SeriesIntel Core i3Intel Core i7
Series: Core i7 Ivy Bridge
Intel Core i3-5157U compare2.5 GHz2 / 4 cores3 MB L3
Intel Core i3-5020U compare2.2 GHz2 / 4 cores3 MB L3
Intel Core i3-5010U compare2.1 GHz2 / 4 cores3 MB L3
Intel Core i3-5015U compare2.1 GHz2 / 4 cores3 MB L3
Intel Core i3-5005U « 2 GHz2 / 4 cores3 MB L3
Intel Core i7-3940XM compare3 - 3.9 GHz4 / 8 cores8 MB L3
Intel Core i7-3920XM compare2.9 - 3.8 GHz4 / 8 cores8 MB L3
Intel Core i7-3840QM compare2.8 - 3.8 GHz4 / 8 cores8 MB L3
Intel Core i7-3820QM compare2.7 - 3.7 GHz4 / 8 cores8 MB L3
Intel Core i7-3740QM compare2.7 - 3.7 GHz4 / 8 cores6 MB L3
Intel Core i7-3720QM compare2.6 - 3.6 GHz4 / 8 cores6 MB L3
Intel Core i7-3635QM compare2.4 - 3.4 GHz4 / 8 cores6 MB L3
Intel Core i7-3630QM compare2.4 - 3.4 GHz4 / 8 cores6 MB L3
Intel Core i7-3615QM compare2.3 - 3.3 GHz4 / 8 cores6 MB L3
Intel Core i7-3610QM compare2.3 - 3.3 GHz4 / 8 cores6 MB L3
Intel Core i7-3632QM « 2.2 - 3.2 GHz4 / 8 cores6 MB L3
Intel Core i7-3612QM compare2.1 - 3.1 GHz4 / 8 cores6 MB L3
Intel Core i7-3540M compare3 - 3.7 GHz2 / 4 cores4 MB L3
Intel Core i7-3520M compare2.9 - 3.6 GHz2 / 4 cores4 MB L3
Intel Core i7-3687U compare2.1 - 3.3 GHz2 / 4 cores4 MB L3
Intel Core i7-3667U compare2 - 3.2 GHz2 / 4 cores4 MB L3
Intel Core i7-3537U compare2 - 3.1 GHz2 / 4 cores4 MB L3
Intel Core i7-3517U compare1.9 - 3 GHz2 / 4 cores4 MB L3
Intel Core i7-3689Y compare1.5 - 2.6 GHz2 / 4 cores4 MB L3
Clock2000 MHz2200 - 3200 MHz
L1 Cache128 KB256 KB
L2 Cache512 KB1 MB
L3 Cache3 MB6 MB
Cores / Threads2 / 44 / 8
TDP15 Watt35 Watt
Transistors1300 Million1400 Million
Technology14 nm22 nm
Die Size82 mm2160 mm2
max. Temp.105 °C105 °C
SocketBGAFCBGA1224, FCPGA988
FeaturesDDR3(L)-1600 Memory Controller, HyperThreading, AVX, AVX2, Quick Sync, Virtualization, AES-NIHD Graphics 4000, DDR3(L)-1600 Memory Controller, HyperThreading, AVX, Quick Sync, Virtualization
iGPUIntel HD Graphics 5500 (300 - 850 MHz)Intel HD Graphics 4000 (650 - 1150 MHz)
Architecturex86x86
$275 U.S.
Announced
Manufacturerark.intel.comark.intel.com

Benchmarks

Performance Rating - CB R15 + R20 + 7-Zip + X265 + Blender + 3DM11 CPU - 5005U
17.8 pt (30%)
Restrict / Search: Model: Max. age: years
Cinebench R23 - Cinebench R23 Multi Core
100%
1 5005U +
1225 Points (1%)
Cinebench R23 - Cinebench R23 Single Core
100%
1 5005U +
499 Points (21%)
Cinebench R20 - Cinebench R20 CPU (Single Core)
100%
1 5005U +
191 Points (21%)
Cinebench R20 - Cinebench R20 CPU (Multi Core)
100%
1 5005U +
486 Points (1%)
Cinebench R15 - Cinebench R15 CPU Multi 64 Bit
min: 206     avg: 208     median: 208 (1%)     max: 210 Points
min: 519     avg: 521     median: 521 (3%)     max: 523 Points
Cinebench R15 - Cinebench R15 CPU Single 64 Bit
min: 80.1     avg: 81.7     median: 82 (23%)     max: 83 Points
min: 111     avg: 112.3     median: 113 (31%)     max: 113 Points
Cinebench R11.5 - Cinebench R11.5 CPU Multi 64 Bit
min: 2.27     avg: 2.3     median: 2.3 (3%)     max: 2.29 Points
min: 5.13     avg: 5.7     median: 5.8 (8%)     max: 5.84 Points
Cinebench R11.5 - Cinebench R11.5 CPU Single 64 Bit
min: 0.92     avg: 0.9     median: 1 (23%)     max: 0.96 Points
min: 1.29     avg: 1.3     median: 1.3 (31%)     max: 1.34 Points
Cinebench R10 - Cinebench R10 Rend. Single (32bit)
min: 3113     avg: 3131     median: 3133 (19%)     max: 3151 Points
min: 4261     avg: 4287     median: 4293.5 (26%)     max: 4299 Points
Cinebench R10 - Cinebench R10 Rend. Multi (32bit)
min: 6837     avg: 6932     median: 6927 (5%)     max: 7048 Points
min: 15952     avg: 16139     median: 16117 (12%)     max: 16368 Points
Cinebench R10 - Cinebench R10 Rend. Multi (64bit)
min: 6936     avg: 7951     median: 7951 (5%)     max: 8966 Points
min: 18906     avg: 19646     median: 19793.5 (13%)     max: 20126 Points
Cinebench R10 - Cinebench R10 Rend. Single (64bit)
min: 3134     avg: 3659     median: 3658.5 (4%)     max: 4183 Points
min: 5296     avg: 5394     median: 5419.5 (7%)     max: 5456 Points
wPrime 2.10 - wPrime 2.0 1024m *
775 s (9%)
min: 271.5     avg: 321.9     median: 295 (3%)     max: 426.1 s
wPrime 2.10 - wPrime 2.0 32m *
24.4 s (5%)
min: 8.784     avg: 10.5     median: 9.9 (2%)     max: 13.53 s
WinRAR - WinRAR 4.0
1952 Points (3%)
min: 4045     avg: 4069     median: 4069 (6%)     max: 4093 Points
7-Zip 18.03 - 7-Zip 18.03 Multi Thread 4 runs
100%
1 5005U +
5871 MIPS (3%)
7-Zip 18.03 - 7-Zip 18.03 Single Thread 4 runs
100%
1 5005U +
2389 MIPS (28%)
X264 HD Benchmark 4.0 - x264 Pass 2
13 fps (4%)
min: 27.5     avg: 30.9     median: 31.9 (11%)     max: 32.22 fps
X264 HD Benchmark 4.0 - x264 Pass 1
69.7 fps (16%)
min: 123.3     avg: 125.5     median: 125.4 (29%)     max: 127.7 fps
HWBOT x265 Benchmark v2.2 - HWBOT x265 4k Preset
100%
1 5005U +
1.7 fps (3%)
TrueCrypt - TrueCrypt Serpent
0.1 GB/s (3%)
min: 0.236     avg: 0.3     median: 0.3 (9%)     max: 0.302 GB/s
TrueCrypt - TrueCrypt Twofish
0.2 GB/s (3%)
min: 0.346     avg: 0.5     median: 0.5 (9%)     max: 0.514 GB/s
TrueCrypt - TrueCrypt AES
1.2 GB/s (3%)
min: 1.8     avg: 2.6     median: 2.9 (8%)     max: 2.9 GB/s
Blender - Blender 2.79 BMW27 CPU *
100%
1 5005U +
2101 Seconds (15%)
R Benchmark 2.5 - R Benchmark 2.5 *
100%
1 5005U +
1.3 sec (29%)
3DMark 06 - CPU - 3DMark 06 - CPU
2713 Points (6%)
min: 5514     avg: 5702     median: 5681 (12%)     max: 5947 Points
Super Pi mod 1.5 XS 1M - Super Pi mod 1.5 XS 1M *
19.3 s (4%)
min: 11     avg: 11.9     median: 11.9 (3%)     max: 13 s
Super Pi mod 1.5 XS 2M - Super Pi mod 1.5 XS 2M *
43.5 s (2%)
min: 26     avg: 27.1     median: 27.2 (1%)     max: 28 s
Super Pi Mod 1.5 XS 32M - Super Pi mod 1.5 XS 32M *
962 s (4%)
min: 623     avg: 636     median: 635 (3%)     max: 649 s
SiSoft Sandra Dhrystone (MIPS) - SiSoft Sandra Dhrystone (MIPS)
100%
1 3632QM +
99750 MIPS (47%)
SiSoft Sandra Whetstone (MFLOPS) - SiSoft Sandra Whetstone (MFLOPS)
100%
1 3632QM +
68510 MFLOPS (53%)
Windows 7 Experience Index - Win7 CPU
100%
1 3632QM +
7.5 Points (96%)
3DMark Vantage - 3DM Vant. Perf. CPU no Physx
7264 Points (6%)
min: 16654     avg: 19072     median: 20095 (15%)     max: 20467 Points
3DMark 11 - 3DM11 Performance Physics
min: 2700     avg: 2767     median: 2711 (7%)     max: 2906 Points
min: 5976     avg: 6528     median: 6410 (16%)     max: 7327 Points
3DMark - 3DMark Ice Storm Physics
min: 25552     avg: 26631     median: 26953 (22%)     max: 27065 Points
min: 26398     avg: 32228     median: 32530 (26%)     max: 37454 Points
3DMark - 3DMark Ice Storm Extreme Physics
25796 Points (21%)
26458 Points (21%)
3DMark - 3DMark Ice Storm Unlimited Physics
100%
1 5005U +
29332 Points (24%)
3DMark - 3DMark Cloud Gate Physics
min: 2289     avg: 2338     median: 2347.5 (6%)     max: 2368 Points
min: 4887     avg: 5110     median: 4981 (13%)     max: 5591 Points
3DMark - 3DMark Fire Strike Standard Physics
min: 3250     avg: 3293     median: 3288 (6%)     max: 3346 Points
min: 7073     avg: 7328     median: 7174 (13%)     max: 7737 Points
Geekbench 5.5 - Geekbench 5.1 - 5.5 64 Bit Single-Core
100%
1 5005U +
531 Points (21%)
Geekbench 5.5 - Geekbench 5.1 - 5.5 64 Bit Multi-Core
100%
1 5005U +
1150 Points (2%)
Geekbench 3 - Geekbench 3 32 Bit Multi-Core
min: 4016     avg: 4061     median: 4075 (7%)     max: 4093 Points
10241 Points (18%)
Geekbench 3 - Geekbench 3 32 Bit Single-Core
min: 1907     avg: 1916     median: 1912 (37%)     max: 1928 Points
2748 Points (54%)
Geekbench 2 - 32 Bit - Geekbench Stream
4744 Points (38%)
7341 Points (59%)
Geekbench 2 - 32 Bit - Geekbench Memory
4089 Points (37%)
6764 Points (61%)
Geekbench 2 - 32 Bit - Geekbench Floating Point
4524 Points (9%)
10911 Points (21%)
Geekbench 2 - 32 Bit - Geekbench Integer
4193 Points (8%)
9690 Points (20%)
Geekbench 2 - 32 Bit - Geekbench Total Score
4343 Points (11%)
9297 Points (24%)
Mozilla Kraken 1.1 - Kraken 1.1 Total Score *
100%
1 5005U +
min: 1636     avg: 2420     median: 1961 (2%)     max: 3339 ms
Sunspider - Sunspider 1.0 Total Score *
100%
1 5005U +
min: 136.3     avg: 174.6     median: 151.1 (2%)     max: 275 ms
Octane V2 - Octane V2 Total Score
100%
1 5005U +
min: 9479     avg: 14507     median: 14425 (11%)     max: 19700 Points
WebXPRT 3 - WebXPRT 3 Score
100%
1 5005U +
89.2 Points (16%)
Power Consumption - Prime95 Power Consumption - external Monitor *
100%
1 5005U +
21 Watt (4%)
Power Consumption - Cinebench R15 Multi Power Consumption - external Monitor *
100%
1 5005U +
15 Watt (3%)
Power Consumption - Power Efficiency - Cinebench R15 Multi external Monitor
100%
1 5005U +
13.8 Points per Watt (10%)

Average Benchmarks Intel Core i3-5005U → 100% n=33

Average Benchmarks Intel Core i7-3632QM → 204% n=33

- Range of benchmark values for this graphics card
red legend - Average benchmark values for this graphics card
* Smaller numbers mean a higher performance
1 This benchmark is not used for the average calculation

Add one or more devices and compare

In the following list you can select (and also search for) devices that should be added to the comparison. You can select more than one device.

restrict list:
v1.33
log 28. 16:42:14

#0 ran 0s before starting gpusingle class +0s ... 0s

#1 checking url part for id 6390 +0s ... 0s

#2 checking url part for id 3366 +0s ... 0s

#3 redirected to Ajax server, took 1753713734s time from redirect:0 +0s ... 0s

#4 did not recreate cache, as it is less than 5 days old! Created at Mon, 28 Jul 2025 05:17:35 +0200 +0s ... 0s

#5 composed specs +0.006s ... 0.007s

#6 did output specs +0s ... 0.007s

#7 getting avg benchmarks for device 6390 +0.004s ... 0.011s

#8 got single benchmarks 6390 +0.014s ... 0.024s

#9 getting avg benchmarks for device 3366 +0.001s ... 0.025s

#10 got single benchmarks 3366 +0.01s ... 0.035s

#11 got avg benchmarks for devices +0s ... 0.035s

#12 min, max, avg, median took s +0.038s ... 0.073s

#13 return log +0.003s ... 0.076s

Please share our article, every link counts!
Mail Logo
> Expert Reviews and News on Laptops, Smartphones and Tech Innovations > Benchmarks / Tech > Processor Comparison - Head 2 Head
Redaktion, 2017-09- 8 (Update: 2023-07- 1)