

Intel Core i7-4960HQ vs AMD Ryzen 9 3950X
Intel Core i7-4960HQ
► remove from comparisonThe Intel Core i7-4960HQ is a high-end quad-core processor for laptops launched in Q3 2013. It is based on the Haswell architecture and manufactured in 22nm. Due to Hyperthreading, the four cores can handle up to eight threads in parallel, leading to better utilization of the CPU. Each core offers a base speed of 2.6 GHz, but can dynamically increase clock rates with Turbo Boost up to 3.6 GHz (for 4 active cores), 3.7 GHz (for 2 active cores) and 3.8 GHz (for 1 active core). Please note: These Turbo clocks are not confirmed yet. A noteworthy feature is the fast integrated graphics unit (GT3e) with eDRAM memory (128 MB, 77 mm², on-package, 102 GB/s).
Haswell is the successor to the Ivy Bridge architecture with improvements on both GPU and CPU performance. The CPUs are produced in 22nm and offer an optimized branch prediction as well as additional execution ports, improving the performance per clock by almost 10 percent. Furthermore, new features like AVX2 and FMA should increase the performance in future applications.
Since the turbo stages of the Core i7-4960HQ exactly match those of the i7-4900MQ, the performance should be very similar. Therefore, the CPU will match the Ivy Bridge based Core i7-3940XM and handle even the most demanding applications.
The integrated Iris Pro Graphics 5200 GPU offers 40 Execution Units (EUs) clocked at 200 - 1300 MHz (with Turbo Boost), making it significantly faster than the HD 4000 or HD 4600. The additional eDRAM memory further improves performance. As a result, the HD 5200 competes with dedicated mid-range graphics cards.
The i7-4960HQ is rated at a TDP of 47 W including the integrated graphics card, memory controller and VRMs. Therefore, the CPU is best suited for laptops 15-inches or greater.
AMD Ryzen 9 3950X
► remove from comparison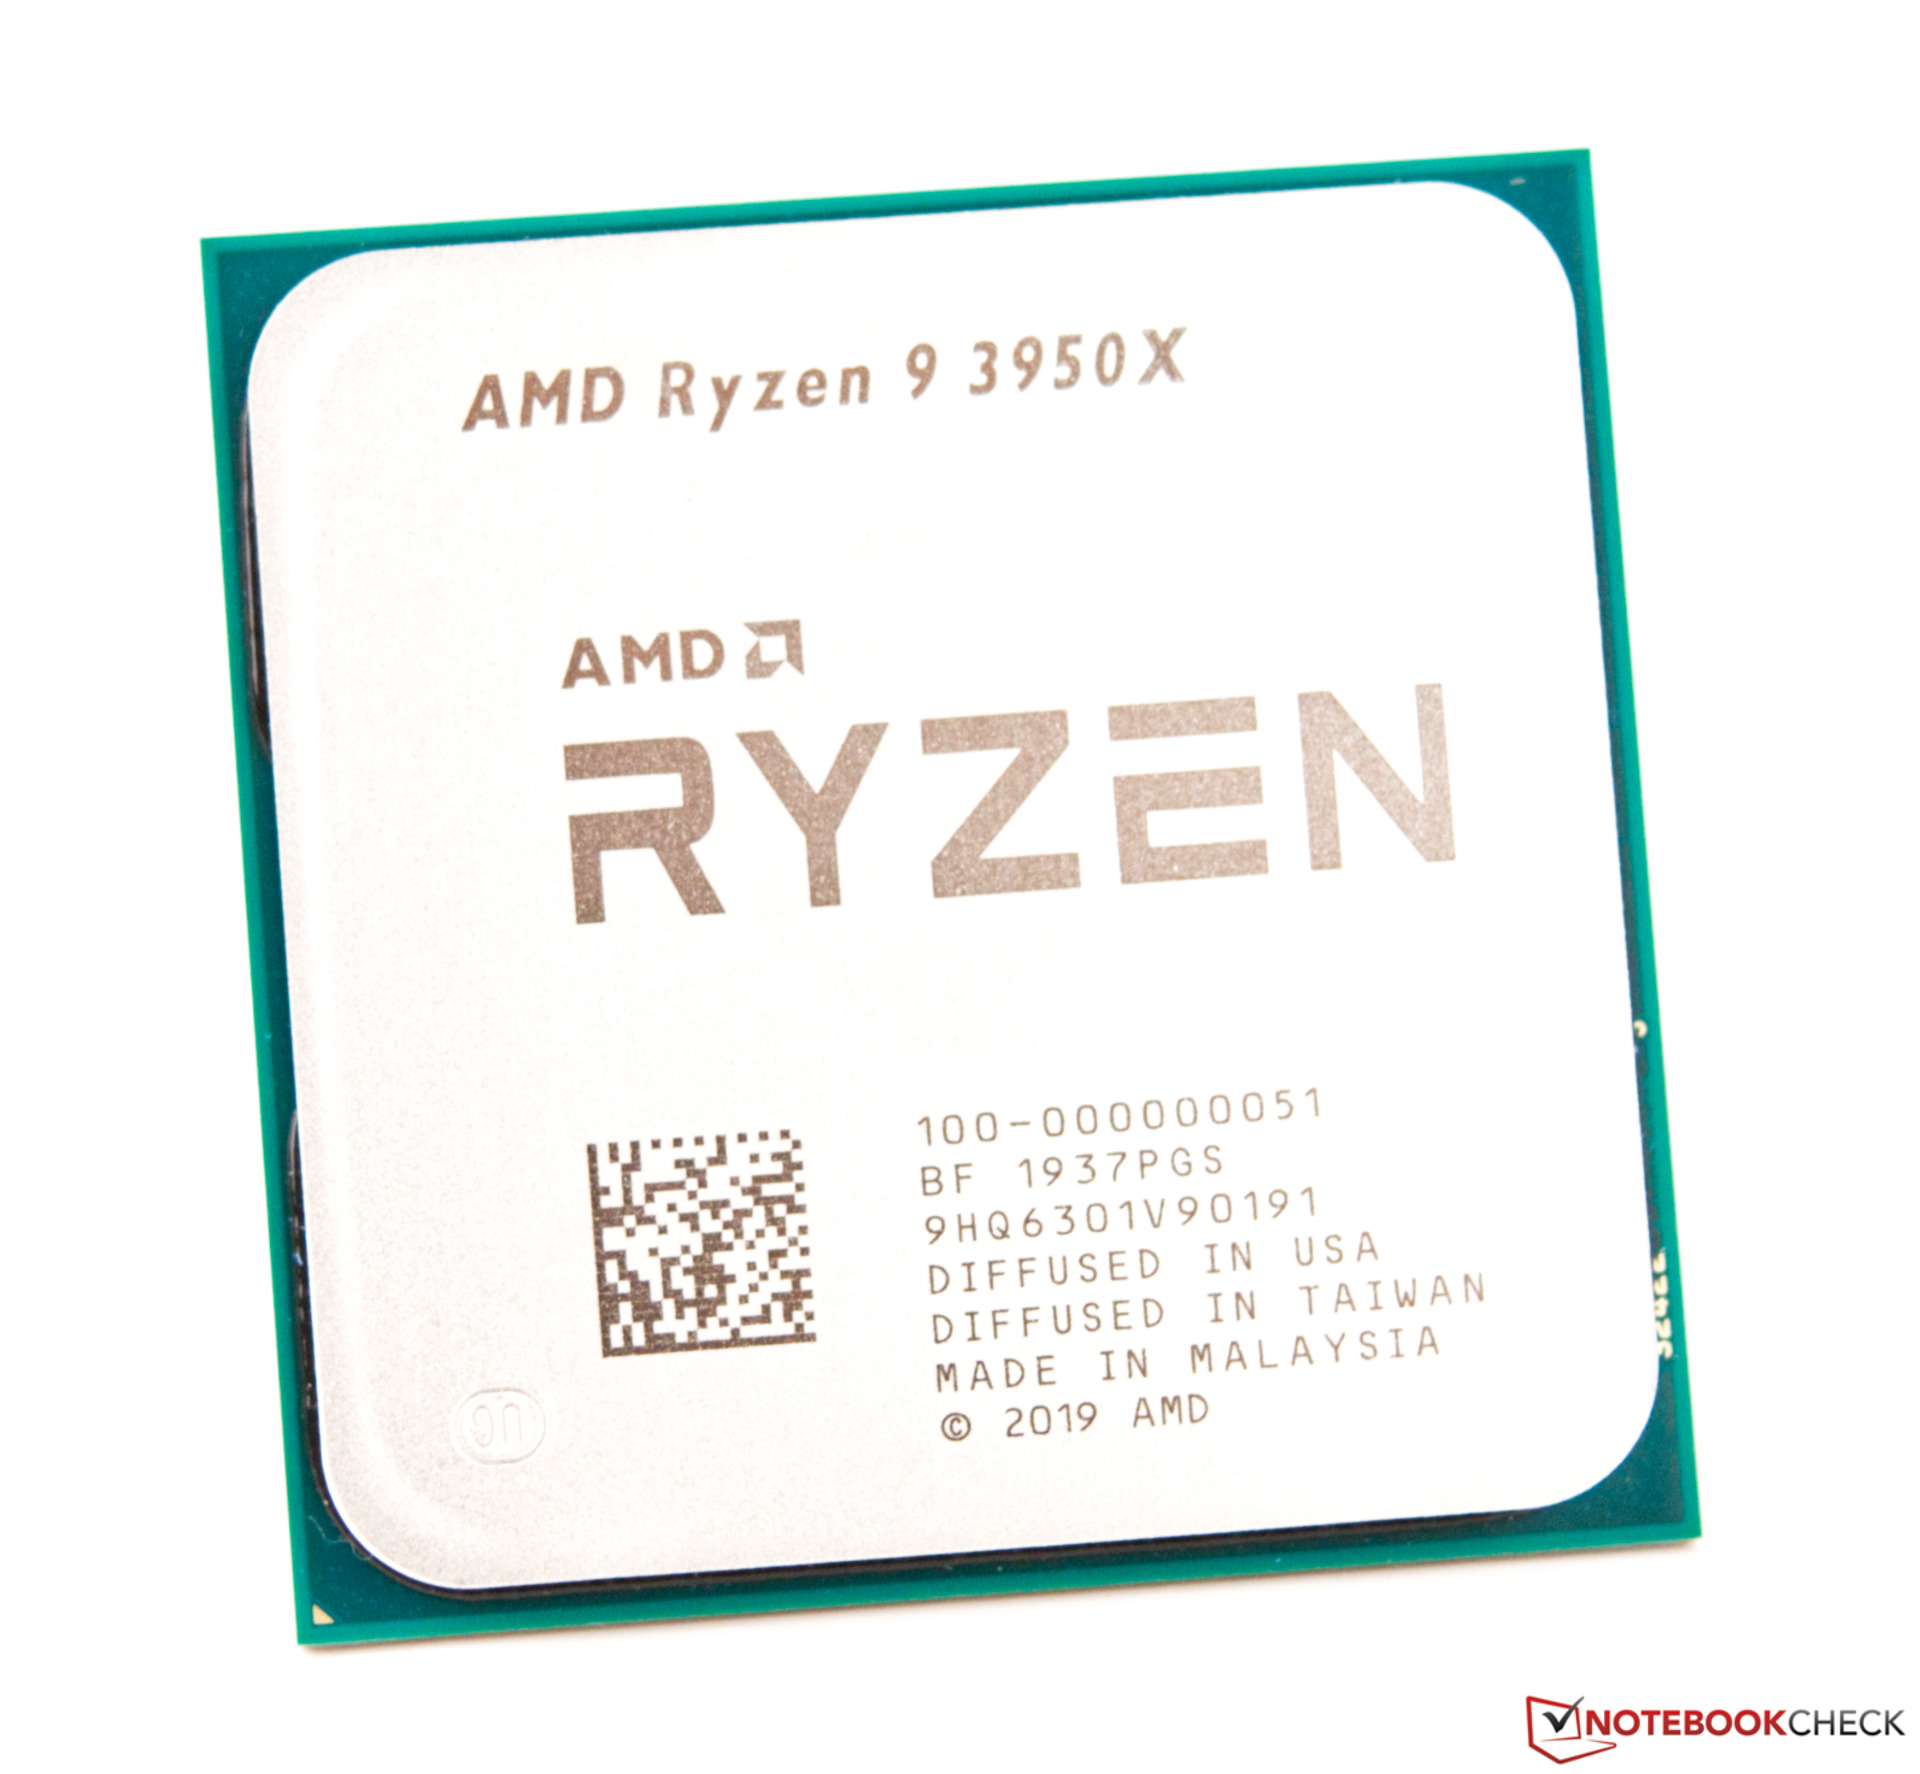
The AMD Ryzen 9 3950X is a high-end desktop processor with 16 cores based on the Zen 2 architecture. At launch in November 2019 it is the fastest CPU of the Matisse series. The 3950X clocks from 3.5 GHz (base) up to 4.7 GHz (Turbo for a single core). All sixteen cores can reach up to 4.1 GHz.
Thanks to the 16 cores and 32 threads, the 3950X offers excellent application performance - if the number of cores can be used. Thanks to the relatively high Turbo, the single core performance is also situated in the high end. For games however, there are faster CPUs, like the Core i9-10900K.
The Ryzen 9 3950X is manufactured in 7nm (the four CCX-cluster with the cores) at TSMC and 12 nm (I/O die) at Globalfoundries. The TDP is rated at 250 Watt and therefore the CPU needs a very powerful cooling system.
| Model | Intel Core i7-4960HQ | AMD Ryzen 9 3950X | ||||||||||||||||||||||||||||||||||||||||||||||||||||||||||||||||||||||||||||||||||||||||||||||||||||||||||||||||||||||||||||||||||||||||||||||||||||||||||||||||||||||||
| Codename | Haswell | Matisse (Zen 2) | ||||||||||||||||||||||||||||||||||||||||||||||||||||||||||||||||||||||||||||||||||||||||||||||||||||||||||||||||||||||||||||||||||||||||||||||||||||||||||||||||||||||||
| Series | Intel Core i7 | AMD Matisse (Ryzen 3000 Desktop) | ||||||||||||||||||||||||||||||||||||||||||||||||||||||||||||||||||||||||||||||||||||||||||||||||||||||||||||||||||||||||||||||||||||||||||||||||||||||||||||||||||||||||
| Series: Matisse (Ryzen 3000 Desktop) Matisse (Zen 2) |
|
| ||||||||||||||||||||||||||||||||||||||||||||||||||||||||||||||||||||||||||||||||||||||||||||||||||||||||||||||||||||||||||||||||||||||||||||||||||||||||||||||||||||||||
| Clock | 2600 - 3800 MHz | 3500 - 4700 MHz | ||||||||||||||||||||||||||||||||||||||||||||||||||||||||||||||||||||||||||||||||||||||||||||||||||||||||||||||||||||||||||||||||||||||||||||||||||||||||||||||||||||||||
| L1 Cache | 256 KB | 1 MB | ||||||||||||||||||||||||||||||||||||||||||||||||||||||||||||||||||||||||||||||||||||||||||||||||||||||||||||||||||||||||||||||||||||||||||||||||||||||||||||||||||||||||
| L2 Cache | 1 MB | 8 MB | ||||||||||||||||||||||||||||||||||||||||||||||||||||||||||||||||||||||||||||||||||||||||||||||||||||||||||||||||||||||||||||||||||||||||||||||||||||||||||||||||||||||||
| L3 Cache | 6 MB | 64 MB | ||||||||||||||||||||||||||||||||||||||||||||||||||||||||||||||||||||||||||||||||||||||||||||||||||||||||||||||||||||||||||||||||||||||||||||||||||||||||||||||||||||||||
| Cores / Threads | 4 / 8 | 16 / 32 | ||||||||||||||||||||||||||||||||||||||||||||||||||||||||||||||||||||||||||||||||||||||||||||||||||||||||||||||||||||||||||||||||||||||||||||||||||||||||||||||||||||||||
| TDP | 47 Watt | 105 Watt | ||||||||||||||||||||||||||||||||||||||||||||||||||||||||||||||||||||||||||||||||||||||||||||||||||||||||||||||||||||||||||||||||||||||||||||||||||||||||||||||||||||||||
| Transistors | 1700 Million | |||||||||||||||||||||||||||||||||||||||||||||||||||||||||||||||||||||||||||||||||||||||||||||||||||||||||||||||||||||||||||||||||||||||||||||||||||||||||||||||||||||||||
| Technology | 22 nm | 7 nm | ||||||||||||||||||||||||||||||||||||||||||||||||||||||||||||||||||||||||||||||||||||||||||||||||||||||||||||||||||||||||||||||||||||||||||||||||||||||||||||||||||||||||
| Die Size | 260 mm2 | 2 x 72 mm + 125 mm (IO-Die) mm2 | ||||||||||||||||||||||||||||||||||||||||||||||||||||||||||||||||||||||||||||||||||||||||||||||||||||||||||||||||||||||||||||||||||||||||||||||||||||||||||||||||||||||||
| max. Temp. | 100 °C | |||||||||||||||||||||||||||||||||||||||||||||||||||||||||||||||||||||||||||||||||||||||||||||||||||||||||||||||||||||||||||||||||||||||||||||||||||||||||||||||||||||||||
| Socket | FCBGA1364 | AM4 (1331) | ||||||||||||||||||||||||||||||||||||||||||||||||||||||||||||||||||||||||||||||||||||||||||||||||||||||||||||||||||||||||||||||||||||||||||||||||||||||||||||||||||||||||
| Features | Iris Pro Graphics 5200 (200 - 1300 MHz), DDR3(L)-1600 Memory Controller, HyperThreading, AVX, AVX2, Quick Sync, Virtualization, vPro, AES-NI | MMX(+), SSE, SSE2, SSE3, SSSE3, SSE4.1, SSE4.2, SSE4A, x86-64, AMD-V, AES, AVX, AVX2, FMA3, SHA, Precision Boost 2 | ||||||||||||||||||||||||||||||||||||||||||||||||||||||||||||||||||||||||||||||||||||||||||||||||||||||||||||||||||||||||||||||||||||||||||||||||||||||||||||||||||||||||
| iGPU | Intel HD Graphics 4600 (200 - 1300 MHz) | |||||||||||||||||||||||||||||||||||||||||||||||||||||||||||||||||||||||||||||||||||||||||||||||||||||||||||||||||||||||||||||||||||||||||||||||||||||||||||||||||||||||||
| Architecture | x86 | x86 | ||||||||||||||||||||||||||||||||||||||||||||||||||||||||||||||||||||||||||||||||||||||||||||||||||||||||||||||||||||||||||||||||||||||||||||||||||||||||||||||||||||||||
| $657 U.S. | $799 U.S. | |||||||||||||||||||||||||||||||||||||||||||||||||||||||||||||||||||||||||||||||||||||||||||||||||||||||||||||||||||||||||||||||||||||||||||||||||||||||||||||||||||||||||
| Announced | ||||||||||||||||||||||||||||||||||||||||||||||||||||||||||||||||||||||||||||||||||||||||||||||||||||||||||||||||||||||||||||||||||||||||||||||||||||||||||||||||||||||||||
| Manufacturer | ark.intel.com |

Benchmarks

Average Benchmarks Intel Core i7-4960HQ → 100% n=1
Average Benchmarks AMD Ryzen 9 3950X → 633% n=1
* Smaller numbers mean a higher performance
1 This benchmark is not used for the average calculation